Article

At What Cost Can Renewable Hydrogen Offset Fossil Fuel Use in Ireland’s Gas Network?

1
Mechanical Engineering, Alice Perry Engineering Building, National University of Ireland Galway, Galway H91 HX31, Ireland
2
Ryan Institute for Marine, Environmental and Energy Research, National University of Ireland Galway, Galway H91 TK33, Ireland
3
MaREI, the SFI Research Centre for Energy, Climate and Marine, Environmental Research Institute, Beaufort Building, University College Cork, Cork P43 C573, Ireland
4
Center for Electric Power and Energy (CEE), Department of Electrical Engineering, Technical University of Denmark (DTU), 2800 Kgs. Lyngby, Denmark
5
Coillte CGA, Dublin Road, Wicklow A63 DN25, Ireland
6
Network Services Centre, Gas Networks Ireland, Dublin 11 D11 Y895, Ireland
7
Mechanical & Manufacturing Engineering, DCU Glasnevin Campus, Dublin City University, Dublin 9 D09 V209, Ireland
*
Author to whom correspondence should be addressed.
Energies 2020, 13(7), 1798; https://doi.org/10.3390/en13071798
Submission received: 20 February 2020 / Revised: 18 March 2020 / Accepted: 30 March 2020 / Published: 8 April 2020
(This article belongs to the Special Issue Computational Analysis of Natural Gas Supply Chains)

Abstract

:
The results of a techno-economic model of distributed wind-hydrogen systems (WHS) located at each existing wind farm on the island of Ireland are presented in this paper. Hydrogen is produced by water electrolysis from wind energy and backed up by grid electricity, compressed before temporarily stored, then transported to the nearest injection location on the natural gas network. The model employs a novel correlation-based approach to select an optimum electrolyser capacity that generates a minimum levelised cost of hydrogen production (LCOH) for each WHS. Three scenarios of electrolyser operation are studied: (1) curtailed wind, (2) available wind, and (3) full capacity operations. Additionally, two sets of input parameters are used: (1) current and (2) future techno-economic parameters. Additionally, two electricity prices are considered: (1) low and (2) high prices. A closest facility algorithm in a geographic information system (GIS) package identifies the shortest routes from each WHS to its nearest injection point. By using current parameters, results show that small wind farms are not suitable to run electrolysers under available wind operation. They must be run at full capacity to achieve sufficiently low LCOH. At full capacity, the future average LCOH is 6–8 €/kg with total hydrogen production capacity of 49 kilotonnes per year, or equivalent to nearly 3% of Irish natural gas consumption. This potential will increase significantly due to the projected expansion of installed wind capacity in Ireland from 5 GW in 2020 to 10 GW in 2030.

Graphical Abstract

1. Introduction

The global installed capacity of wind energy increased by nearly four times from 2008 to 2018, accounting for a quarter of global renewable installed capacity in 2018 [1]. Over the same period, wind power installed capacity in the island of Ireland rose by three times to nearly 5 GW. Wind accounts for 29% of national electricity generation, the third highest in the world after Denmark and Uruguay [2]. Currently, Ireland has a government policy to deliver 70% renewable electricity through the Renewable Electricity Support Scheme (RESS), mostly from wind, by 2030 [3,4].
In 2018, 707 GWh (6%) of available wind energy was lost due to curtailment. Wind curtailment is caused by two factors: (1) low wind demand in the electricity market, and (2) low capacity of electricity networks. The low wind demand is caused by (1) must-run capacities of conventional power plants, and (2) wind supply limitation to maintain system stability [5]. The low transmission capacity is caused by (1) transmission congestion, and (2) network constraint [5]. Wind curtailment in Ireland may increase to 7–14% as a result of a higher penetration of wind energy in the future [6]. Distributed and long-term energy storage can help to reduce wind energy lost, particularly that caused by low transmission capacity. Hydrogen has the potentially to be generated through electrolysis using curtailed wind power and used as a clean fuel [7]. Hydrogen production can be placed and operated at each existing wind farm. For relatively small quantities and short distances, hydrogen can be economically transported to demand locations in the form of compressed gas [8]. It can be blended with natural gas and transported longer distances through the existing gas grid [9]. In 2018, natural gas contributed to 30% of total primary energy requirement in Ireland [10]. In the same year, 52% of electricity and 41% of heat demands were supplied by natural gas [10]. If produced at wind farms and transported to the gas network, hydrogen could be used to (1) reduce wasted available wind energy, (2) decarbonise the gas network, and eventually (3) increase renewable supply for power and heat generation and transportation.

1.1. Hydrogen Production System Optimisation

In terms of hydrogen production from wind curtailment, Beccali et al. simulated wind curtailment by using electricity demand and wind speed data, and then defined the optimum system size from the minimum hydrogen production cost [11]. Zhang et al. advanced the optimisation by using real time data from a wind farm, and introduced the need of a grid electricity supply to maintain minimum power for the electrolyser to run idle [7]. However, in Zhang’s study, the algorithm is designed to replace curtailed wind with grid electricity whenever curtailed wind does not meet the minimum power to run electrolyser. Thus, some curtailed wind is still wasted. The analysed system did not include a compressor, which has high energy consumption. The contribution of the current study is a novel approach to optimise the system capacity of hydrogen production, where curtailed wind is prioritised to power the electrolyser and compressor. Available exportable electricity form the wind farm and grid electricity are used as backup energy sources.

1.2. Wind-Based Hydrogen and Grid Injection

Spatial analysis through the use of Geographic Information System (GIS) software on the evaluation of hydrogen production capacity from wind energy enables identification of high potential sites [12]. Quarton et al. described current hydrogen projects that focus on grid injection and emphasised the need for incorporating spatial analysis in future hydrogen studies [13]. In Ireland, the potential of hydrogen production from wind curtailment integrated with biogas production to create biomethane is evaluated by Vo et al. [14]. McDonagh et al. investigated hydrogen production from grid electricity and found that incorporating wind curtailment within the analysis can reduce the carbon intensity of the hydrogen produced [15]. Singlitico et al. spatially assessed the techno-economics of biomass-derived synthetic natural gas (bio-SNG) injection into the Irish gas network and optimised the design of the supply chain for economic performance [16]. The authors further expanded their work to include supply chain optimisation for environmental performance and explored trade-offs between these two optima [17]. The current study also aims to fill a literature gap on how much hydrogen can be optimally and economically produced in respect to the reduction of wind curtailment and efficiently supplied to gas injection sites. As recently published by [18], the Irish gas grid operator, Gas Networks Ireland (GNI), plans to directly inject hydrogen into the gas network after 2030.

1.3. Objectives and Outline

The objectives of this study are primarily (1) to model and optimise the system size of hydrogen production that prioritises wind curtailment as its energy source, (2) to evaluate hydrogen production capacity and its costs at all existing Irish wind farms, and (3) to optimise the cost of hydrogen transportation from wind farm to gas grid. To achieve this, the method is broken down into four sections. After the introduction section, the method section describes the hydrogen production system from wind energy as well as three developed scenarios to evaluate the effect of using different electricity sources in the hydrogen production system. This section also lists the essential techno-economic parameters, explains the novel system sizing approach, describes the wind curtailment data preparation, and explains the hydrogen transportation submodel. Results are shown in the third section, which presents detailed system size optimisation at a sample wind farm and summaries for all Irish wind farms. The section also covers energy analysis, levelised cost of hydrogen (LCOH) analysis, share of hydrogen in natural gas network, sensitivity analysis, and a discussion of technical challenges for hydrogen injection. All the significant findings and suggestions for future work are summarised in conclusion section.

2. Method

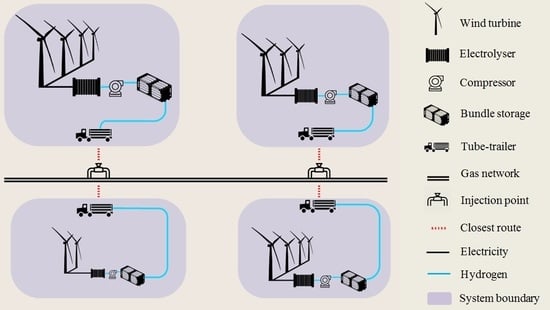
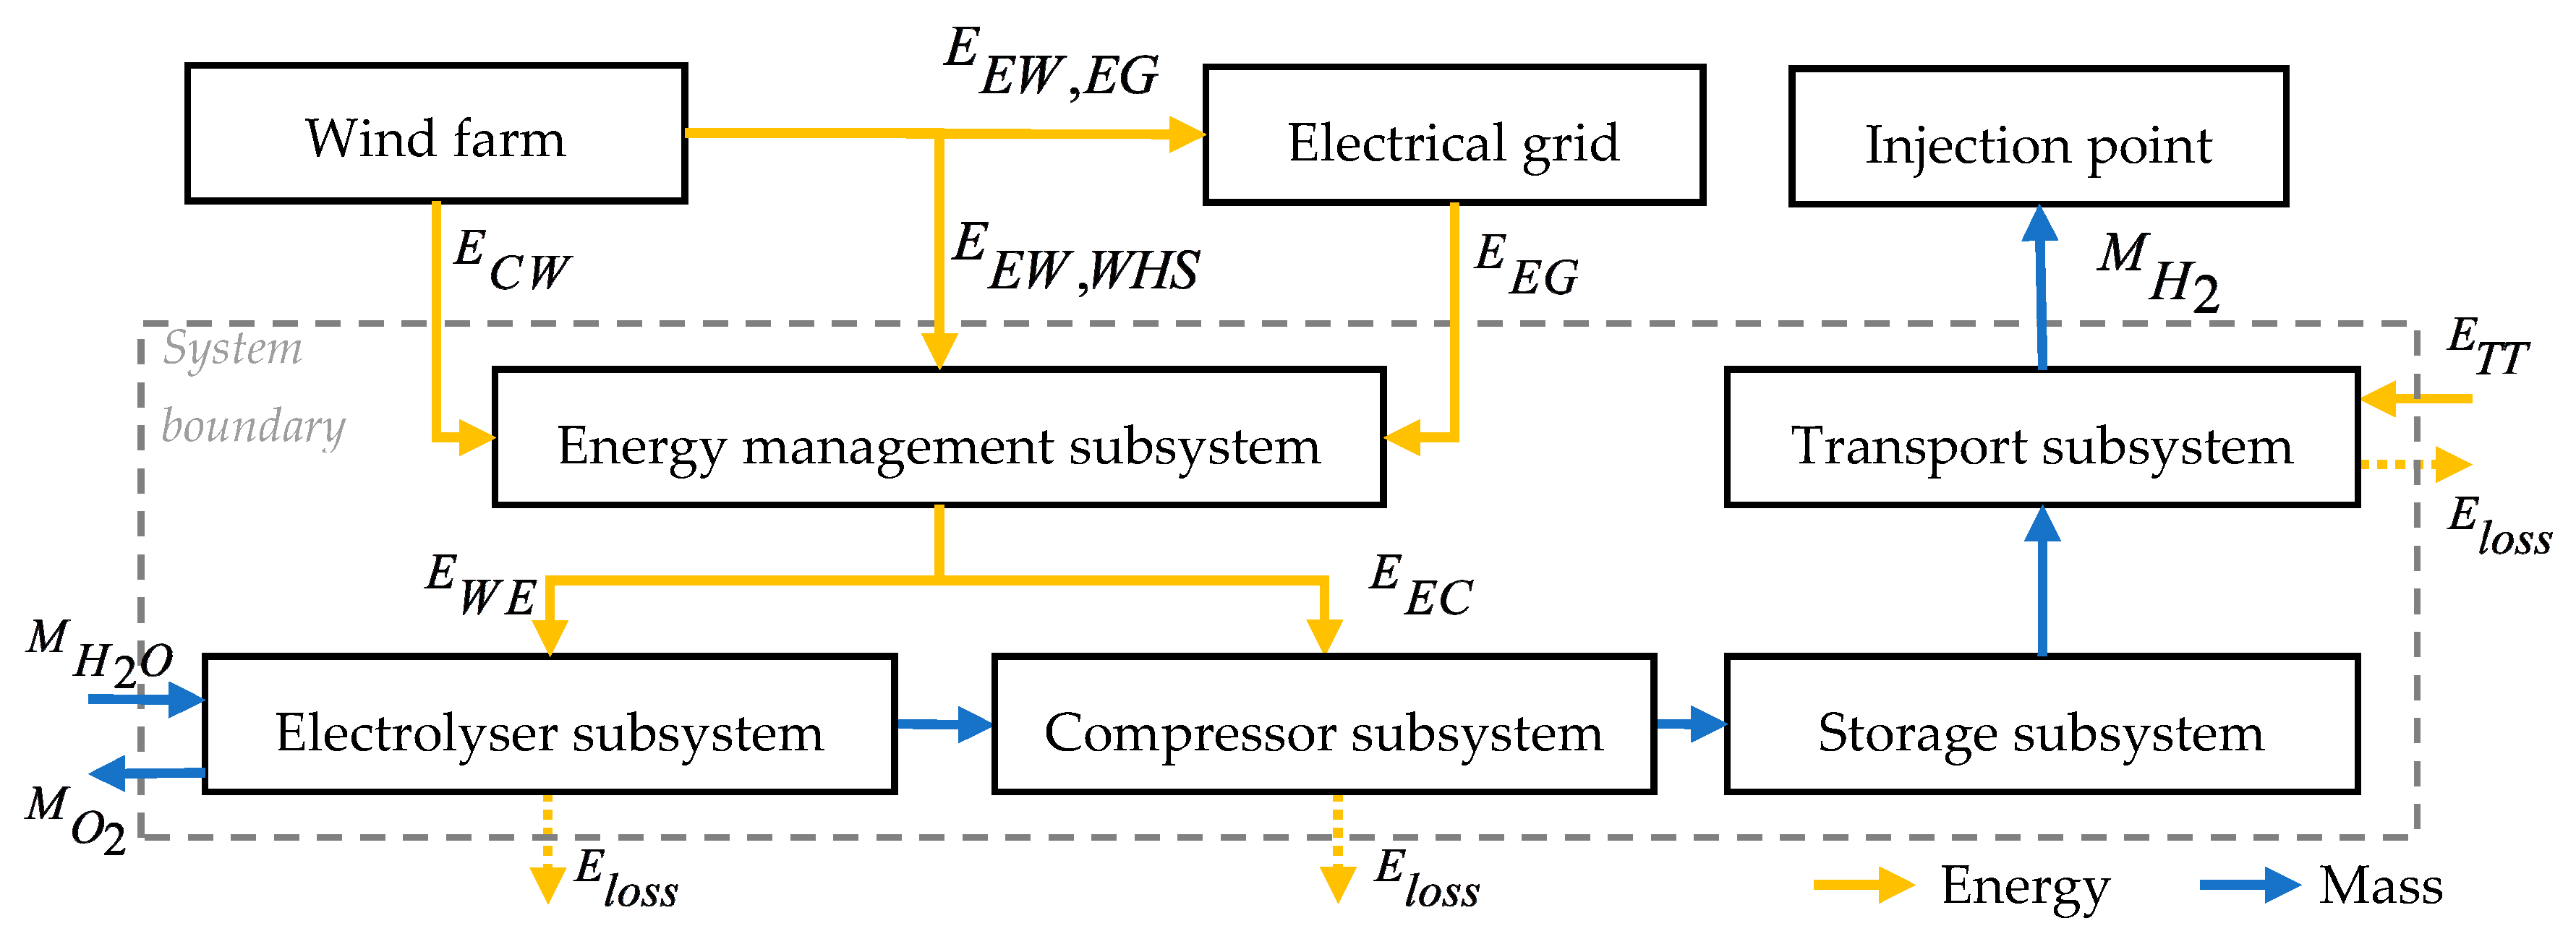
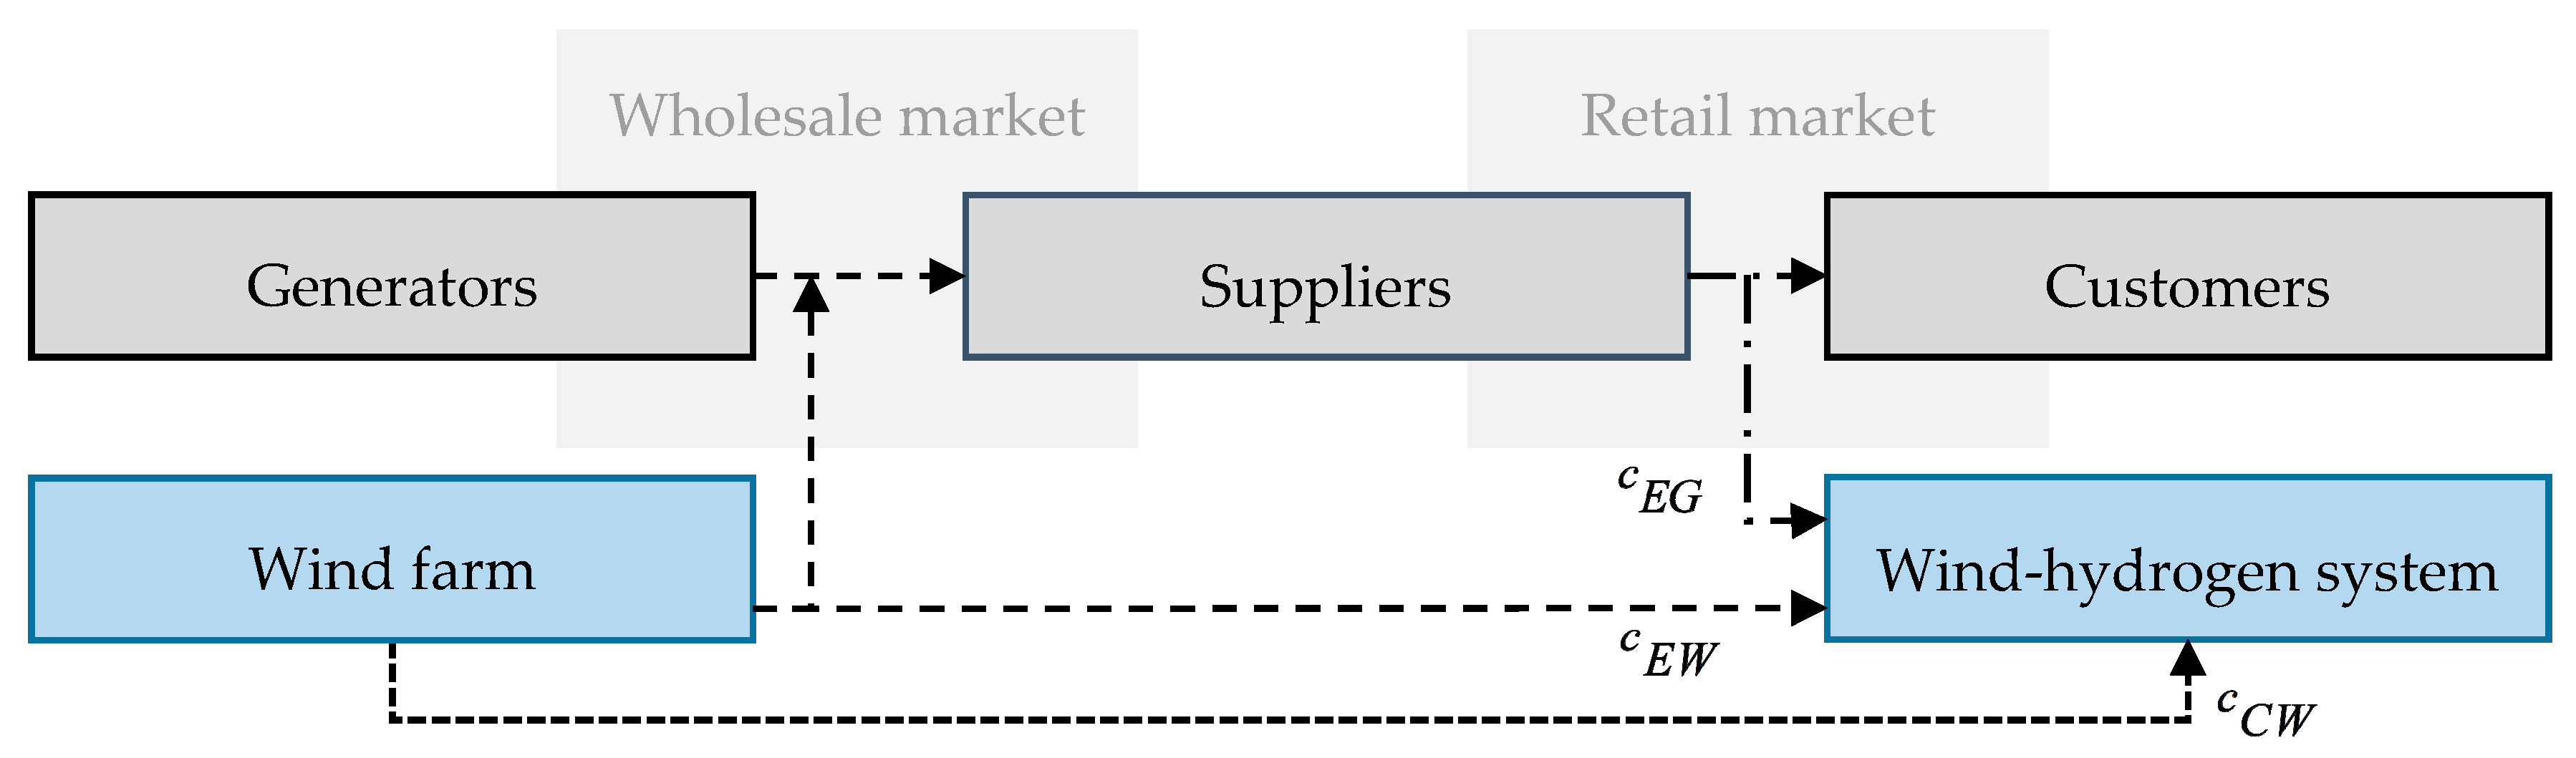
2.1. System and Scenario Description

In this study, the system of hydrogen production from wind energy is named the wind-hydrogen system (WHS) and, because it is intended to reduce curtailment and constraint, is proposed to be located at each existing wind farm in Ireland. The WHS comprises subsystems such as energy management, electrolyser, compressor, storage and transport subsystems. As illustrated in Figure 1, the energy management subsystem controls, converts and distributes curtailed electricity (ECW) and exportable electricity (EEW) from the wind farm, as well as grid electricity (EEG) to the water electrolyser (EWE) and electric compressor (EEC) subsystems. The next subsystem is the electrolyser to convert water (MH2O) to hydrogen (MH2) and oxygen (MO2). The electrolyser subsystem includes a power supply, water pump, water treatment, safety devices, heat exchanger, water electrolyser stacks, demisters, gas separators and dryers [19]. Afterwards, hydrogen is compressed and cooled in the subsequent subsystem before temporarily being stored in the storage subsystem. Operating conditions of the subsystems are described in the technical parameters in Section 2.2 of the techno-economic submodel. The last subsystem, the transport subsystem aims to deliver hydrogen to the nearest gas grid injection point via tube trailer with energy requirement (ETT) from a diesel-fuelled truck, which is described in Section 2.5 of the transportation submodel.
Three scenarios for electrolyser operation mode are defined to analyse the impacts of (1) primarily utilising curtailed electricity in “curtailed wind” operation, (2) additionally using exportable electricity to increase the electrolyser capacity factor (λWE, defined in Equation (1)) in “available wind” operation, and (3) maximising λWE by additionally using grid electricity in “full capacity” operation. Due to the intermittency of curtailed electricity profiles, grid electricity is required as a backup whenever electrolyser minimum input energy is not met. A minimum 5% of electrolyser nominal power (PWE) is kept to maintain the economic lifetime of the electrolyser stack [20].
λ W E = E C W + E E W + E E G 8760 P W E

2.1.1. First Scenario: Curtailed Wind Operation

In curtailed wind operation, electrolyser operation is dependent on the occurrence of curtailed electricity and is backed up by grid electricity to produce hydrogen. This is illustrated in Figure 2a for a 0.1 MWe electrolyser operating over three days. Due to exportable electricity not being considered in this scenario, this results in very low electrolyser capacity factor, which in turn results in high production cost.

2.1.2. Second Scenario: Available Wind Operation

This operation mainly relies on the availability of wind energy. In addition to curtailment, the WHS also receives extra energy input from exportable electricity to increase electrolyser capacity factor. The electrolyser is also assisted by grid electricity to cover its minimum energy input in the absence of wind energy as shown in Figure 2b This results in lower production costs than the first scenario.

2.1.3. Third Scenario: Full Capacity Operation

To maximise hydrogen production, the electrolyser can be operated at full capacity. To achieve this, in addition to curtailed and available wind electricity, the supply of grid electricity to electrolyser is increased so that electrolyser capacity factor can reach 100%, as illustrated in Figure 2c.

2.2. Techno-Economic Submodel

Levelized cost of hydrogen (LCOH) is defined as the key techno-economic parameter in the optimisation [21,22,23]. The total LCOH (LCOHtotal) is the sum of LCOH for production (LCOHprod) and transport (LCOHtrans) as expressed in Equation (2). LCOHprod represents the total discounted present value of investment, operation, and maintenance costs during system lifetime per unit mass of hydrogen produced. Equation (3) shows how LCOHprod is calculated. Ideally, the cost of hydrogen injection is included in the analysis. However, the price to facilitate hydrogen injection from gas network operators is not available at the moment. Additionally, there is no regulation on how much hydrogen can be injected to gas grid. The allocation of hydrogen in volume percentage in the gas network is important for sizing the additional equipment for handling hydrogen at injection points. A review by Quarton et al. emphasises the strong relation between permitted hydrogen injection (vol%) and injection cost [13].
L C O H t o t a l = L C O H p r o d + L C O H t r a n s
L C O H p r o d = T = 0 T = τ W H S C I n v ( 1 + r ) T + T = 0 T = τ W H S C F O M ( 1 + r ) T + T = 0 T = τ W H S C V O M ( 1 + r ) T T = 0 T = τ W H S M H 2 ( 1 + r ) T
The total expenses of hydrogen production include the total investment capital cost (CInv), and fixed (CFOM) and variable (CVOM) operation and maintenance costs. The model assumes a discount rate (r) of 6% over a 20-year system economic lifetime (τWHS) [11]. The discount rate reflects the financial return and project risk [24]. In a recent study of hydrogen production from wind, Glenk et al. uses discount rates between 4 and 6% [25]. Equation (4) shows how CInv is calculated.
C I n v = C W E + C E C + C S V + C E M + C I C S + C E n g + C O t h e r
Investment capital cost comprises costs for the water electrolyser (CWE), electric compressor (CEC), storage vessel (CSV), energy management unit (CEM), interconnection, commissioning and start-up (CICS), engineering (CEng) and other items (COther). Evaluation by Schmidt et al. mentions that innovations in an inexpensive and more efficient catalyst can decrease the cost of the electrolyser [26]. Additionally, a review by Proost et al. shows significant potential cost reduction from new arrangements of electrolyser stacks in the future [27]. Modelling work by Glenk et al. estimates that electrolyser cost can fall to half of its current cost in the future [25]. Two sets of parameters are considered: (1) current and (2) future techno-economic parameters. Current techno-economic parameters include all the available technologies today as well as their cost. Future techno-economic parameters consider published learning curves and projections for upcoming technology and their costs in 2030. The values and respective references used for these costs are presented in Table 1.
Fixed operation and maintenance cost includes the electrolyser (COM,WE), compressor (COM,EC) and storage (COM,SV), together with a stack replacement (CSR), as shown in Equation (5). Variable operation and maintenance costs includes electricity (CEL) and water costs (CH2O), as shown in Equation (6).
C F O M = C O M ,   W E + C O M , E C + C O M , S V + C S R
C V O M = C E L + C H 2 O
The calculation of CEL is calculated from annual energy consumption of curtailed electricity, exportable electricity and grid electricity and their respective electricity prices, as expressed in Equation (7).
C E L = ( E C W × c C W ) + ( E E W × c E W ) + ( E E G × c E G )
According to [23,28,29], electricity price has a significant impact on LCOHprod. Therefore, this study identifies and applies representative electricity prices (c) based on each energy source. There are two electricity markets considered in this study: (1) the retail market in which electricity is purchased by end users from electricity suppliers, and (2) the wholesale market in which electricity is purchased by electricity suppliers from electricity generators [30]. As illustrated in Figure 3, the price for grid electricity (cEG) follows the electricity price in the retail market. The electricity price in the wholesale market is defined as the price for exportable electricity (cEW). Curtailed electricity is considered to be purchased at the minimum selling price of wind electricity as represented by the average levelized cost of electricity (LCOE) of onshore wind (cCW). The low and high values of each electricity price are listed in Table 1.
Curtailed, exportable and grid electricity each comprise input energy to electrolyser and compressor as expressed in Equations (8)–(10) respectively.
E C W = ( E C W , W E + E C W , E C )  
E E W = ( E E W , W E + E E W , E C )
E E G = ( E E G , W E + E E G , E C )
The water price (PH2O) and annual water consumption (MH2O) are used to calculate CH2O as expressed in Equation (11). The price used for water can be found in Table 1.
C H 2 O = ( M H 2 O × P H 2 O )
Annual water consumption can be calculated using Equation (12) from total input energy for the electrolyser (EWE, Equation (13)) and specific energy consumption of the electrolyser system (µWE). The method to calculate optimum electrolysers size at each WHS is explained in Section 2.3.
M H 2 = E W E μ W E
E W E = E C W , W E + E E W , W E + E E G , W E
For each wind farm, each electrolyser operation scenario has different portions of curtailed, exportable and grid electricity to the electrolyser. In the first scenario, the curtailed and grid electricity portion for electrolyser is calculated using Equations (14) and (16). There are two conditions to calculate curtailed power. The first is when curtailed wind power (PCW) at time (t) exceeds electrolyser rated power (PWE). In this case, PCW is set to the size of electrolyser rated power (PWE). It means some curtailed wind can be wasted at small electrolyser sizes. The second condition is to accommodate when PCW is lower than PWE. These two conditions are is expressed in Equation (17). PWE is started from 0.01 MWe to the size of wind farm (PWF). In the first scenario, exportable wind is not introduced to the WHS. Therefore, exportable electricity equals zero. When grid electricity is required to maintain a minimum of 5% of PWE, it is expressed in Equation (19), which is the same approach used in a previous study by [7].
In the second scenario of available wind operation, curtailed, exportable and grid electricity are calculated with Equations (14)–(16) respectively. Curtailed power is calculated using Equation (17). Equation (18) shows the calculation of exportable wind power (PEW). The calculation of back-up power from the grid is expressed in Equation (20).
In the third scenario of full capacity operation, curtailed, exportable and grid electricity are calculated from Equations (14)–(16), respectively. Power from curtailed wind, exportable wind and grid can be calculated using Equations (17), (18) and (21), respectively.
E C W , W E = t = 0 T P C W , W E ( t ) × Δ t ( t )
E E W , W E = t = 0 T P E W , W E ( t ) × Δ t ( t )
E E G , W E = t = 0 T P E G , W E ( t ) × Δ t ( t )
P C W , W E ( t ) = min ( P W E , P C W ( t ) )
P E W , W E ( t ) = min ( P W E P C W , W E ( t ) , P E W ( t ) )
P E G , W E ( t ) = min ( 5 % P W E , P C W , W E ( t ) )
P E G , W E ( t ) = min ( 5 % P W E , P C W , W E ( t ) + P E W ( t ) )
P E G , W E ( t ) = P W E P C W , W E ( t ) P E W , W E ( t )
Total required energy input to the electric compressor (EEC) is the summary of curtailed, exportable and grid electricity that are used to operate compressor as expressed in Equation (22). The calculation of each annual curtailed, exportable and grid electricity can be seen in Equations (23)–(25). Required curtailed power at time t follows Equation (26). There are two conditions to prioritise the use of curtailed wind. The conditions are when curtailed power is larger than the required power to run the electrolyser and compressor, and when curtailed power is larger than the required power to run the electrolyser, but not enough to run the compressor. The contribution of exportable power at time t is calculated with Equation (27). The back-up power from the grid is added when energies from curtailed and exportable winds are not enough to run the compressor as expressed in Equation (28). The power demand to compress hydrogen can be calculated from flow rate (mH2) at time t and the specific energy consumption of the electric compressor (µEC).
E E C = E C W , E C + E E W , E C + E E G , E C
E C W , E C = t = 0 T P C W , E C ( t ) × Δ t ( t )
E E W , E C = t = 0 T P E W , E C ( t ) × Δ t ( t )
E E G , E C = t = 0 T P E G , E C ( t ) × Δ t ( t )
P C W , E C ( t ) = min ( ( m H 2 ( t ) × μ E C ) , P W E P C W ( t ) )
P E W , E C ( t ) = min ( ( m H 2 ( t ) × μ E C ) P C W ( t ) , P E W ( t ) P W E P C W ( t ) )
P E G , E C ( t ) = ( m H 2 ( t ) × μ E C ) P C W , E C ( t ) P E W , E C ( t )
In terms of technical parameters, this study models proton exchange membrane (PEM) electrolyser technology mainly due to its fast response time to intermittent power like wind, compared to alkaline or solid oxide electrolysis cells [26], which operate at higher temperatures. The material in an electrolyser stack can degrade with time [26], which affects the stack lifetime. A study by [26] predicts that the specific energy consumption (µWE) and degradation of the electrolyser may be lower in the future. The detailed technical parameters of the WHS are shown in Table 2.
Reciprocating compressors are widely used in the hydrogen industry, so are used in this study. Hydrogen is compressed from 30 barg to 300 barg. It requires two stages to preserve a temperature of 135 °C at the discharge point [19,36,37].
For buffer storage, bundles of steel cylinders are selected due to their capability to store hydrogen gas up to 300 barg from 10 h to many months [19]. Hydrogen is modelled as being stored in the storage system before it is delivered to the nearest gas grid injection point by truck.

2.3. System Sizing Submodel

Several WHS pilot plants already operate across Europe. The electrolyser comprises up to 40% of total capital expenditure, followed by the compressor and storage vessels [23,38]. Therefore, in the design of the WHS, the electrolyser is sized first. Compressor and storage vessel sizes are scaled according to the electrolyser.
When cost curves from the literature [19,25,26,27,31] are employed, this has the effect of turning all components’ costs into functions of electrolyser size (PWE,n), as presented in Table 1. For each wind farm capacity (PWF) larger than 10 MWe, LCOHprod is calculated using Equation (3) with different electrolyser sizes from n = 0.01 MWe to PWF with increments of 0.05 MWe for each scenario. The trend of LCOHprod is examined, with the electrolyser size that results in the minimum LCOHprod (PWE,opt). This is deemed to be the optimum for that wind farm.
After calculating the optimum electrolyser size for all wind farms larger than 10 MWe, a statistical model, which is described below, is developed to find PWE,opt for those smaller than 10 MWe. Data collection for all sizes of wind farm is described in Section 2.4.

2.4. Wind Curtailment Submodel

According to [42], the most influential aspects to WHS’s economic performance are the hydrogen production system capacity and annual curtailed electricity, which are also depended on wind farm size. Ireland’s Single Electricity Market Operator (SEMO) stores the required data to calculate curtailed electricity profiles of large Irish wind farms (PWF > 10 MWe). Therefore, in this study, the calculation of curtailed electricity is divided into two segments, (1) for wind farms larger than 10 MWe, and (2) for those smaller than 10 MWe.

2.4.1. Wind Farms Larger than 10 MWe

This accounts for 74 out of the 312 wind farms currently operating in Ireland. There are three types of hourly data that can be obtained from the SEMO website (Submit an inquiry to the authors via e-mail to those who wish to access this data.): actual availability of wind power that can be delivered to the electrical grid (PAW), quantity of dispatch instruction from SEMO (PDQ) and metered generation of exported power by a wind farm (PMG) [43]. In practice, PMG can be different from PDQ, known as uninstructed imbalance. According to [44], the calculation of total annual curtailed, exportable and grid electricity are shown in Equations (29)–(31), respectively. The hourly power from curtailed, exportable and grid are calculated using Equations (32)–(34), respectively. In condition of PAWPDQ, curtailed wind energy at time t is equal to zero.
  E A W = t = 0 T P A W ( t ) × Δ t ( t )
  E E W = t = 0 T P E W ( t ) × Δ t ( t )
  E C W = t = 0 T P C W ( t ) × Δ t ( t )
P A W ( t ) = P A W ( t )   ,   if   P A W ( t ) > P D Q ( t )
P E W ( t ) = m a x   ( P D Q ( t ) , P M G ( t ) )   ,   if   P A W ( t ) > P D Q ( t )
P C W ( t ) = P A W ( t ) P E W ( t )

2.4.2. Wind Farms Smaller than 10 MWe

Since not all of wind farms have this level of hourly data available from SEMO, ECW can also be approximated from regional annual average values for wind curtailment rate (ECW,%) and EAW as shown in Equation (35). EAW is approximated from the reported PWF and the average capacity factor for the wind farm’s macro-region (λWF ), as represented in Equation (36).
E C W = E C W , % × E A W
E A W = 8760 × P W F × λ W F
The current average of ECW,% in the island of Ireland is 6%, as reported in [2]. It regionally varies between 4.1% and 9.4% [2]. According to [3], the average ECW,% could be up to 7% in the future. Current λWF in the Republic of Ireland (RoI) and Northern Ireland (NI) are 28% and 22%, respectively [2]. This study assumes the same values of λWF in the future.

2.5. Transportation Submodel

A transportation cost submodel is presented here that calculates the transportation cost of moving hydrogen from each wind farm to its nearest grid injection location. Evaluation by [45,46] identify at least 42 locations of above ground installations (AGIs) that can potentially be used for gas injection into the gas network in the Republic of Ireland [47]; 10 AGIs are spread across Northern Ireland. In total, there are 52 potential injection locations in the island of Ireland.
A 300-barg tube trailer is operated to deliver 500 kg hydrogen per trip [48]. The tube trailer is built from steel cylinders, which is considered to be mature technology. Therefore, the techno-economic parameters in hydrogen transport with a steel-based tube trailer is not expected to change in the future, as listed in Table 3 [19]. The tube trailer is hauled by diesel truck to the injection location and returned to the wind farm. The required energy to transport hydrogen (ETT) is calculated using specific energy consumption per kilometric (αTT) of the diesel truck and the total distance as expressed in Equation (37). The model assumes a third-party company operates the truck to haul the tube trailer.
E T T = ( α T T × L A G I × N t r i p × 2 )
The closest-facility algorithm in the ArcGIS Geographic Information System (GIS) software does two measurements: (1) identification on each WHS to be directed to suitable AGI based on its nearest distance, and (2) identification of the shortest road route from WHS to its respective AGI. For wind farms, this study identifies 238 locations in RoI [49] and 74 locations in NI [50]. The detailed road network in the island of Ireland is obtained from [51], which includes motorway, primary road, secondary road, tertiary road and trunk road. The parameters used to determine transportation costs are obtained from [19,24,48] and listed in Table 3. The LCOHtrans is the total discounted present value of investment in tube trailers (CInv,TT), and operation and maintenance costs (COM,TT), during system lifetime per kg of hydrogen, as shown below.
L C O H t r a n s = t = 0 t = τ W H S C I n v , T T ( 1 + r ) t + t = 0 t = τ W H S C O M , T T ( 1 + r ) t t = 0 t = τ W H S M H 2 ( 1 + r ) t
Equation (39) is used to calculate total operation and maintenance cost of the tube trailer. In these equations, CO,TT is the operational cost per kilometre, CM,TT is the maintenance cost per kilometre, LAGI is the shortest distance between wind farm and injection point, Ntrip is the total trip numbers per year (the return trip is represented by 2) and CR,TT is a ten-yearly tube trailer retesting cost.
C O M , T T = ( ( C ˙ O , T T + C ˙ M , T T ) × L A G I × N t r i p × 2 ) + C R , T T
To minimise travel costs for each wind farm, Ntrip is measured with the average length of storage time (tSV) which is based on hourly average production kg/hr (mH2) and tube trailer capacity (MTT), as shown below.
N t r i p = 365 t S V / 24
t S V = M T T m H 2

2.6. Solution Algorithm Overview

WHSs are designed to be decentralized and placed at each Irish wind farm to maximize the usage of curtailed and constrained electricity throughout the island. The hourly power generation data from at least 74 wind farms are accessible at the SEMO website. For each wind farm, electrolyser sizes (PWE) from 0.01 MWe to the wind farm’s rated capacity (PWF) are used to compute the levelized cost of hydrogen production (LCOHprod) as described above. The electrolyser size that minimises LCOHprod is defined as PWE,opt. Afterwards, the LCOHtrans is calculated as described above and added to the LCOHprod to obtain LCOHtotal. As shown in Figure 4, essential values are indicated by square boxes, where submodels are illustrated in round edge boxes. To aid understanding of the algorithm, data preparation are coloured with light red, system sizing for all scenarios with dark blue, hydrogen production with light blue, and hydrogen transportation with yellow.

3. Results and Discussions

3.1. System Sizing for a Sample Wind Farm

The cumulative available wind power profile (curtailed plus exportable electricity) of Ballincollig Hill wind farm in 2015 is illustrated in Figure 5. The blue area shows exportable electricity to the grid, and green indicates curtailed electricity. The wind farm capacity, wind farm capacity factor and wind curtailment are 15 MW, 31% and 13%, respectively. Curtailment occurs most of the time during the year with various amount. 50% of curtailment is less than 2.2 MW of instantaneous power. The highest rate of curtailed power is 11 MW.
From the iterative calculation of LCOHprod, LCOHprod of curtailed wind operation drops from 40 €/kg for a 0.01 MWe electrolyser to its lowest level of 18–20 €/kg for a 1.5 MW electrolyser, as illustrated in Figure 6. The LCOHprod is relatively high due to a low electrolyser capacity factor of 20%. When exportable electricity is also introduced to the WHS in the second scenario, the minimum LCOHprod drops to 7 €/kg for the same electrolyser size but with an electrolyser capacity factor near 80%. In the third scenario, LCOHprod further reduces to 6 €/kg due to the fact that more hydrogen can be produced at a capacity factor of 100%. The system sizing model optimally prioritised ECW to be the energy source of the electrolyser and compressor, and found the optimal electrolyser size for all scenarios of 1.5 MWe. Hydrogen production from an electrolyser smaller than 0.5 MWe fails to benefit from economies of scale. For electrolysers larger than 1.5 MWe, operating in the curtailed electricity only scenario, electrolyser capacity factor decreases and LCOHprod dramatically increases. This does not significantly affect the second scenario due to the supply of exportable wind to the electrolyser. The increase of LCOHprod in the second scenario can be seen at electrolyser sizes beyond 7.5 MWe, where all curtailed electricity is consumed by the electrolyser. The LCOHprod of the third scenario shows a slight decrease due to more hydrogen being produced when electrolyser capacity factor is maintained at 100%.
In comparison to the result from Beccali et al., if wind penetration and wind curtailment rate in Sicily, Italy are 41% and 10%, respectively, then the optimum hydrogen production cost by using only curtailed wind is 33 €/kg at electrolyser size of 0.5 MWe. On the other hand, it is difficult to compare the study from Zhang et al. due to the fact that hydrogen production cost is not used as the main parameter, but hydrogen price and payback period. Based on payback period, 6 MWe is used to utilise a wind curtailment rate of 28% with a hydrogen price in the range of 3 to 4 €/kg in full capacity operation, without compression and storage. Details of the cost contribution to LCOH can be seen in Section 3.6 of the sensitivity analysis of the techno-economic parameters.

3.2. Optimal System Sizing for all Irish Wind Farms

In total, there are 312 wind farms the island of Ireland, of which only 74, with rated output of over 10 MWe have detailed hourly data. Therefore, a method is developed to size electrolysers for the rest of the 238 wind farms. Based on the results from the 74 wind farms, statistical curve-fitting models are derived and used for optimal electrolyser sizing and annual hydrogen production for the remainder. These models are shown in Equations (42) and (43), respectively.
P W E , o p t = 0.3868 × E C W + 0.01
M H 2 = 22.426 × E C W 0.8503
Annual curtailed electricity and optimum electrolyser sizes for all Irish wind farms are shown in Figure 7. Optimum electrolyser sizes are found to range between 10 kWe and 8 MWe. From this point, the annual hydrogen production capacity can be calculated for all existing Irish wind farms. With current techno-economic parameters, each scenario results in indicated in Figure 8. The total annual hydrogen production capacity for first, second, and third scenarios are 13, 32, and 39 kilotonnes per year, respectively. Using future parameters, the hydrogen capacity slightly increases for each WHS due to higher electrolyser efficiency. In this case, the total production capacity for first, second, and third scenarios are 16, 39, and 49 kilotonnes per year, respectively.

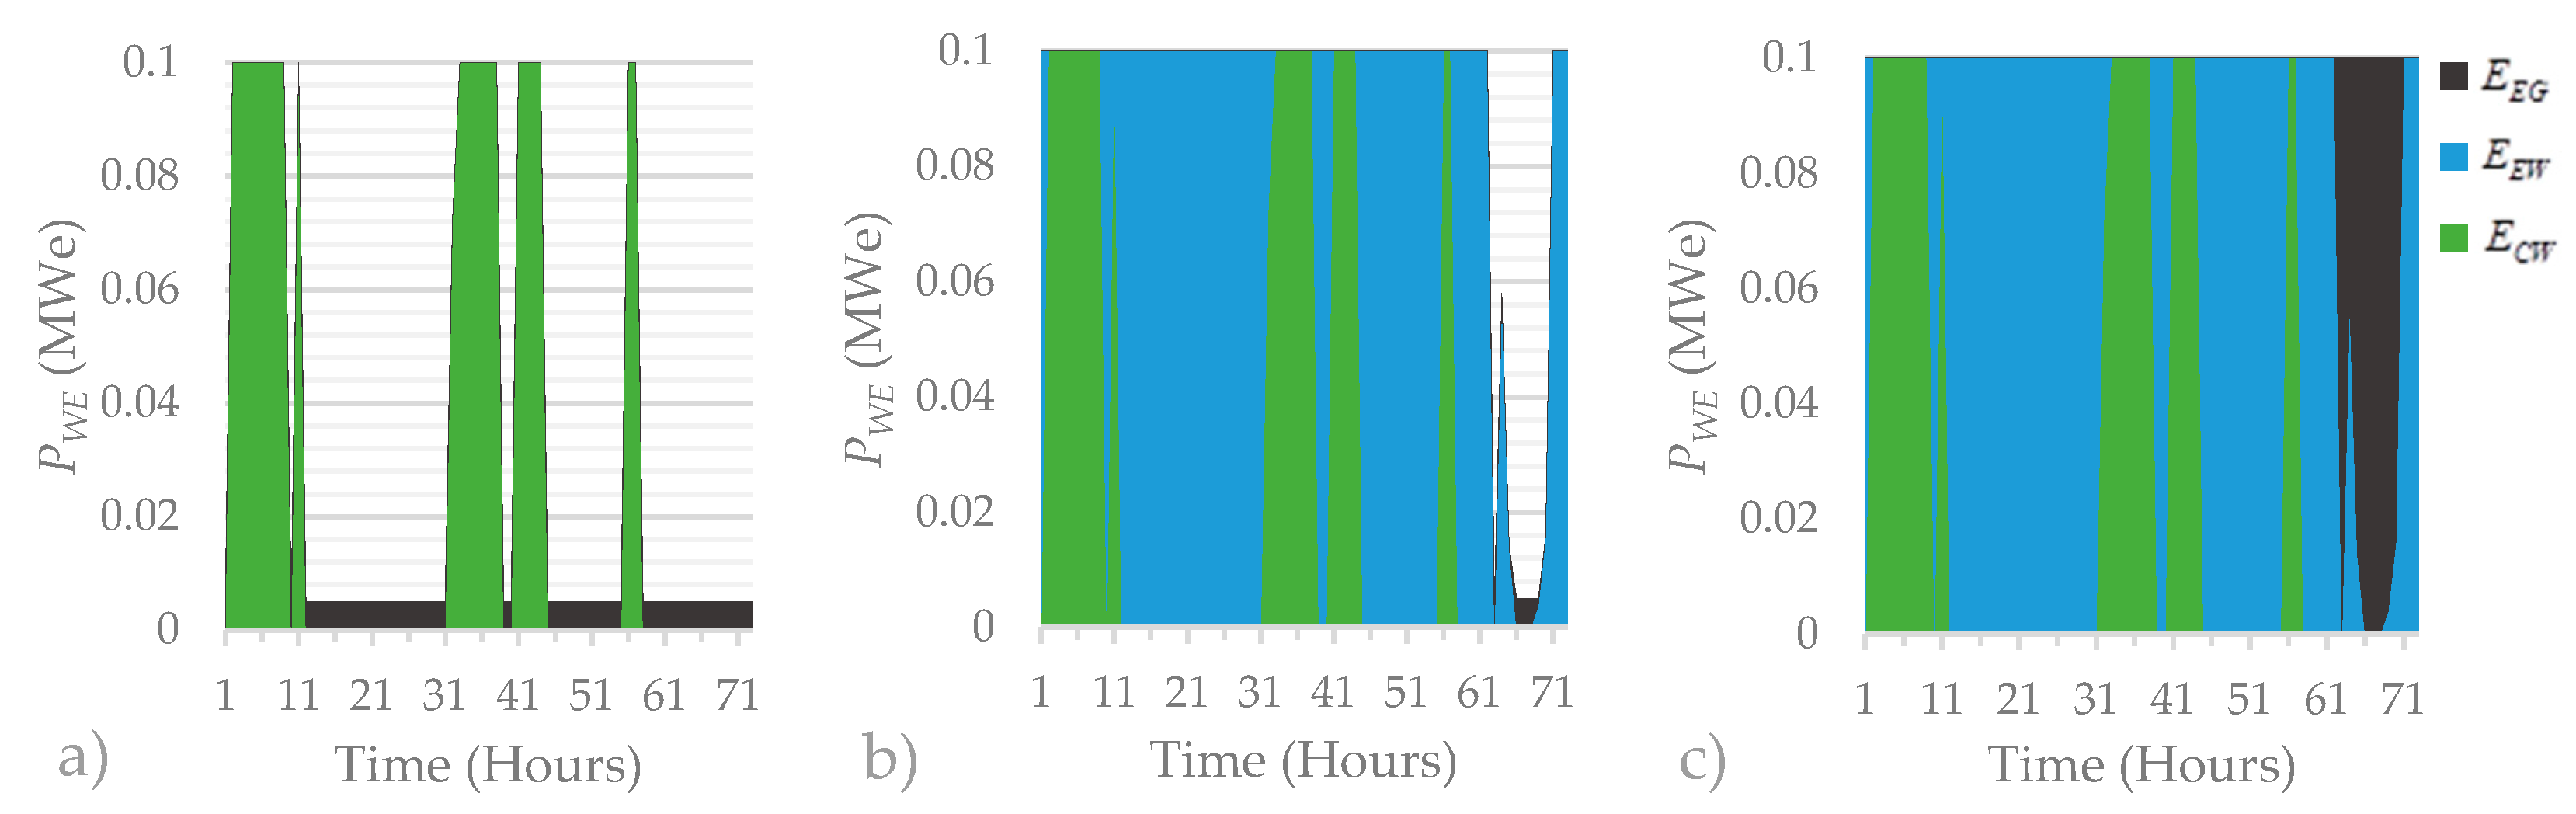
3.3. Energy Analyis for all Scenarios

In the curtailed wind operation scenario, 87% of energy input to electrolyer is from curtailed electricity and the rest is backed up by grid electricity to maintain electrolyser idle power, as illustrated in the Sankey diagram in Figure 9. In the available wind operation scenario, exportable electricity dominates hydrogen production at 63%, followed by curtailed and grid electricity at 36% and <1%, respectively. When electrolysers at all WHSs run at full capacity, the relative contributions of curtailed, exportable, and grid electricity are 29%, 51% and 19%, respectively. By using the higher heating value hydrogen of 39.41 kWh/kg, the overall system efficiencies at all existing Irish wind farms for current and future technologies are 71% and 83%, respectively.

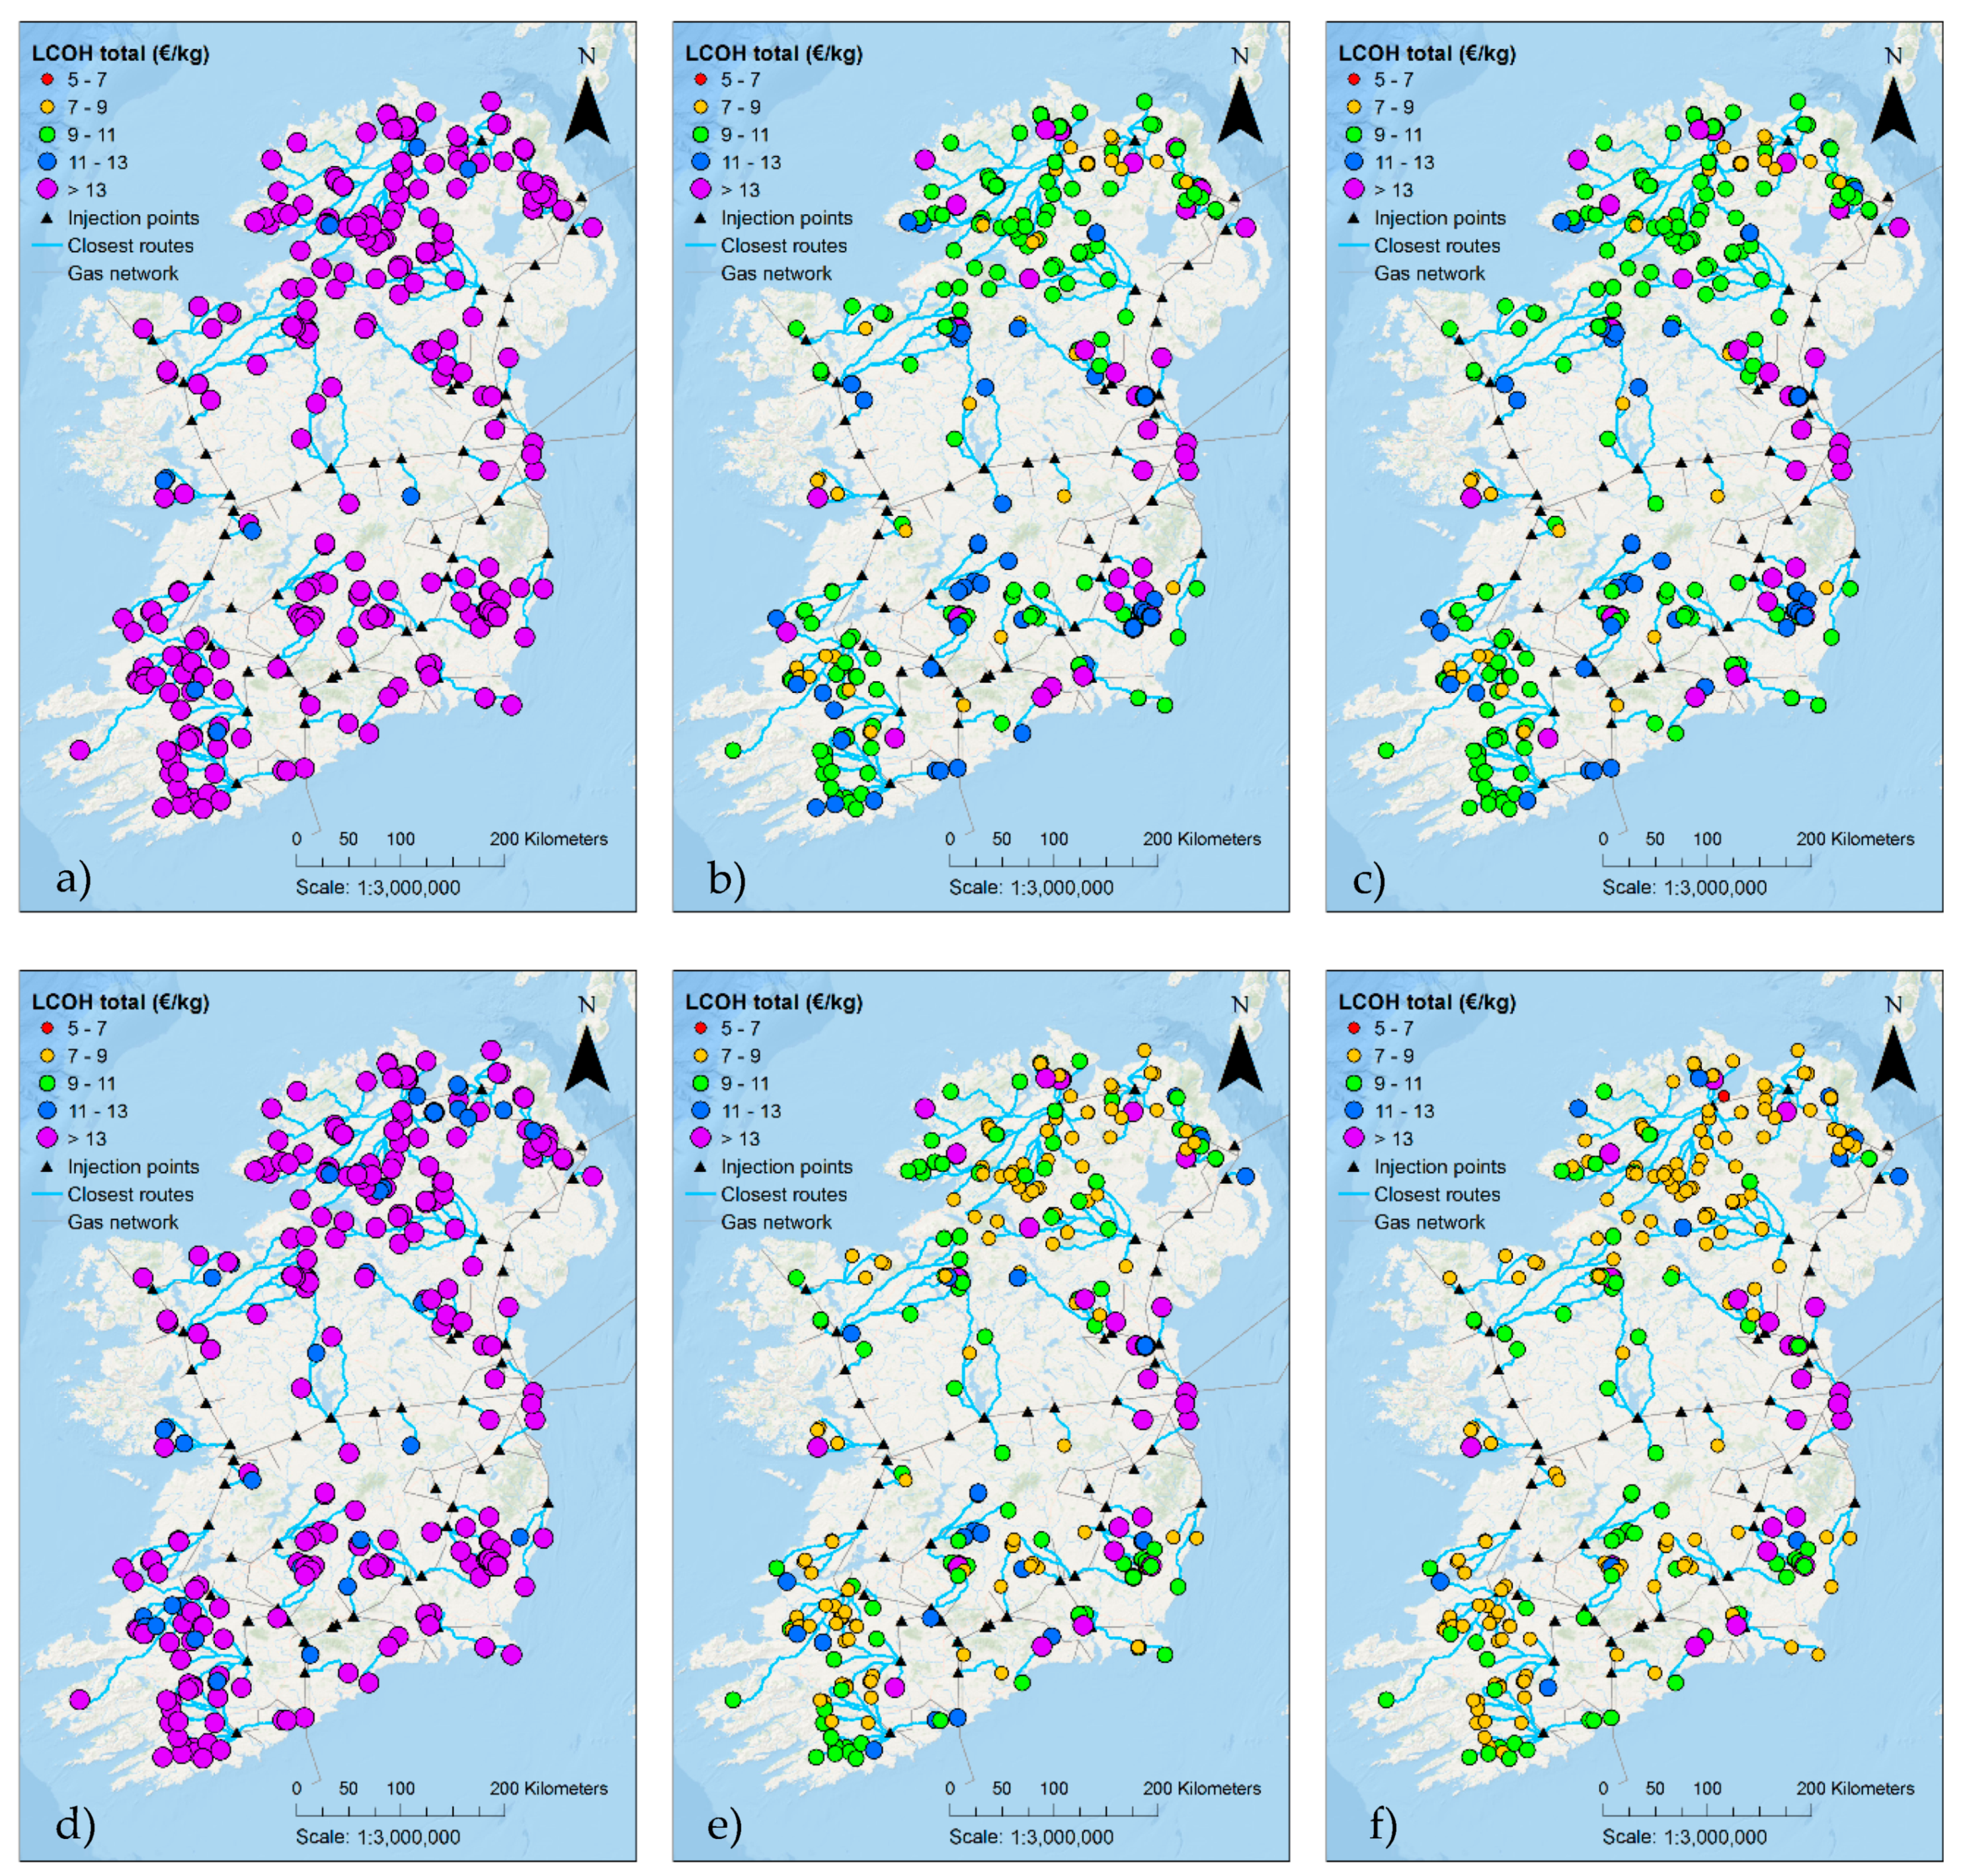
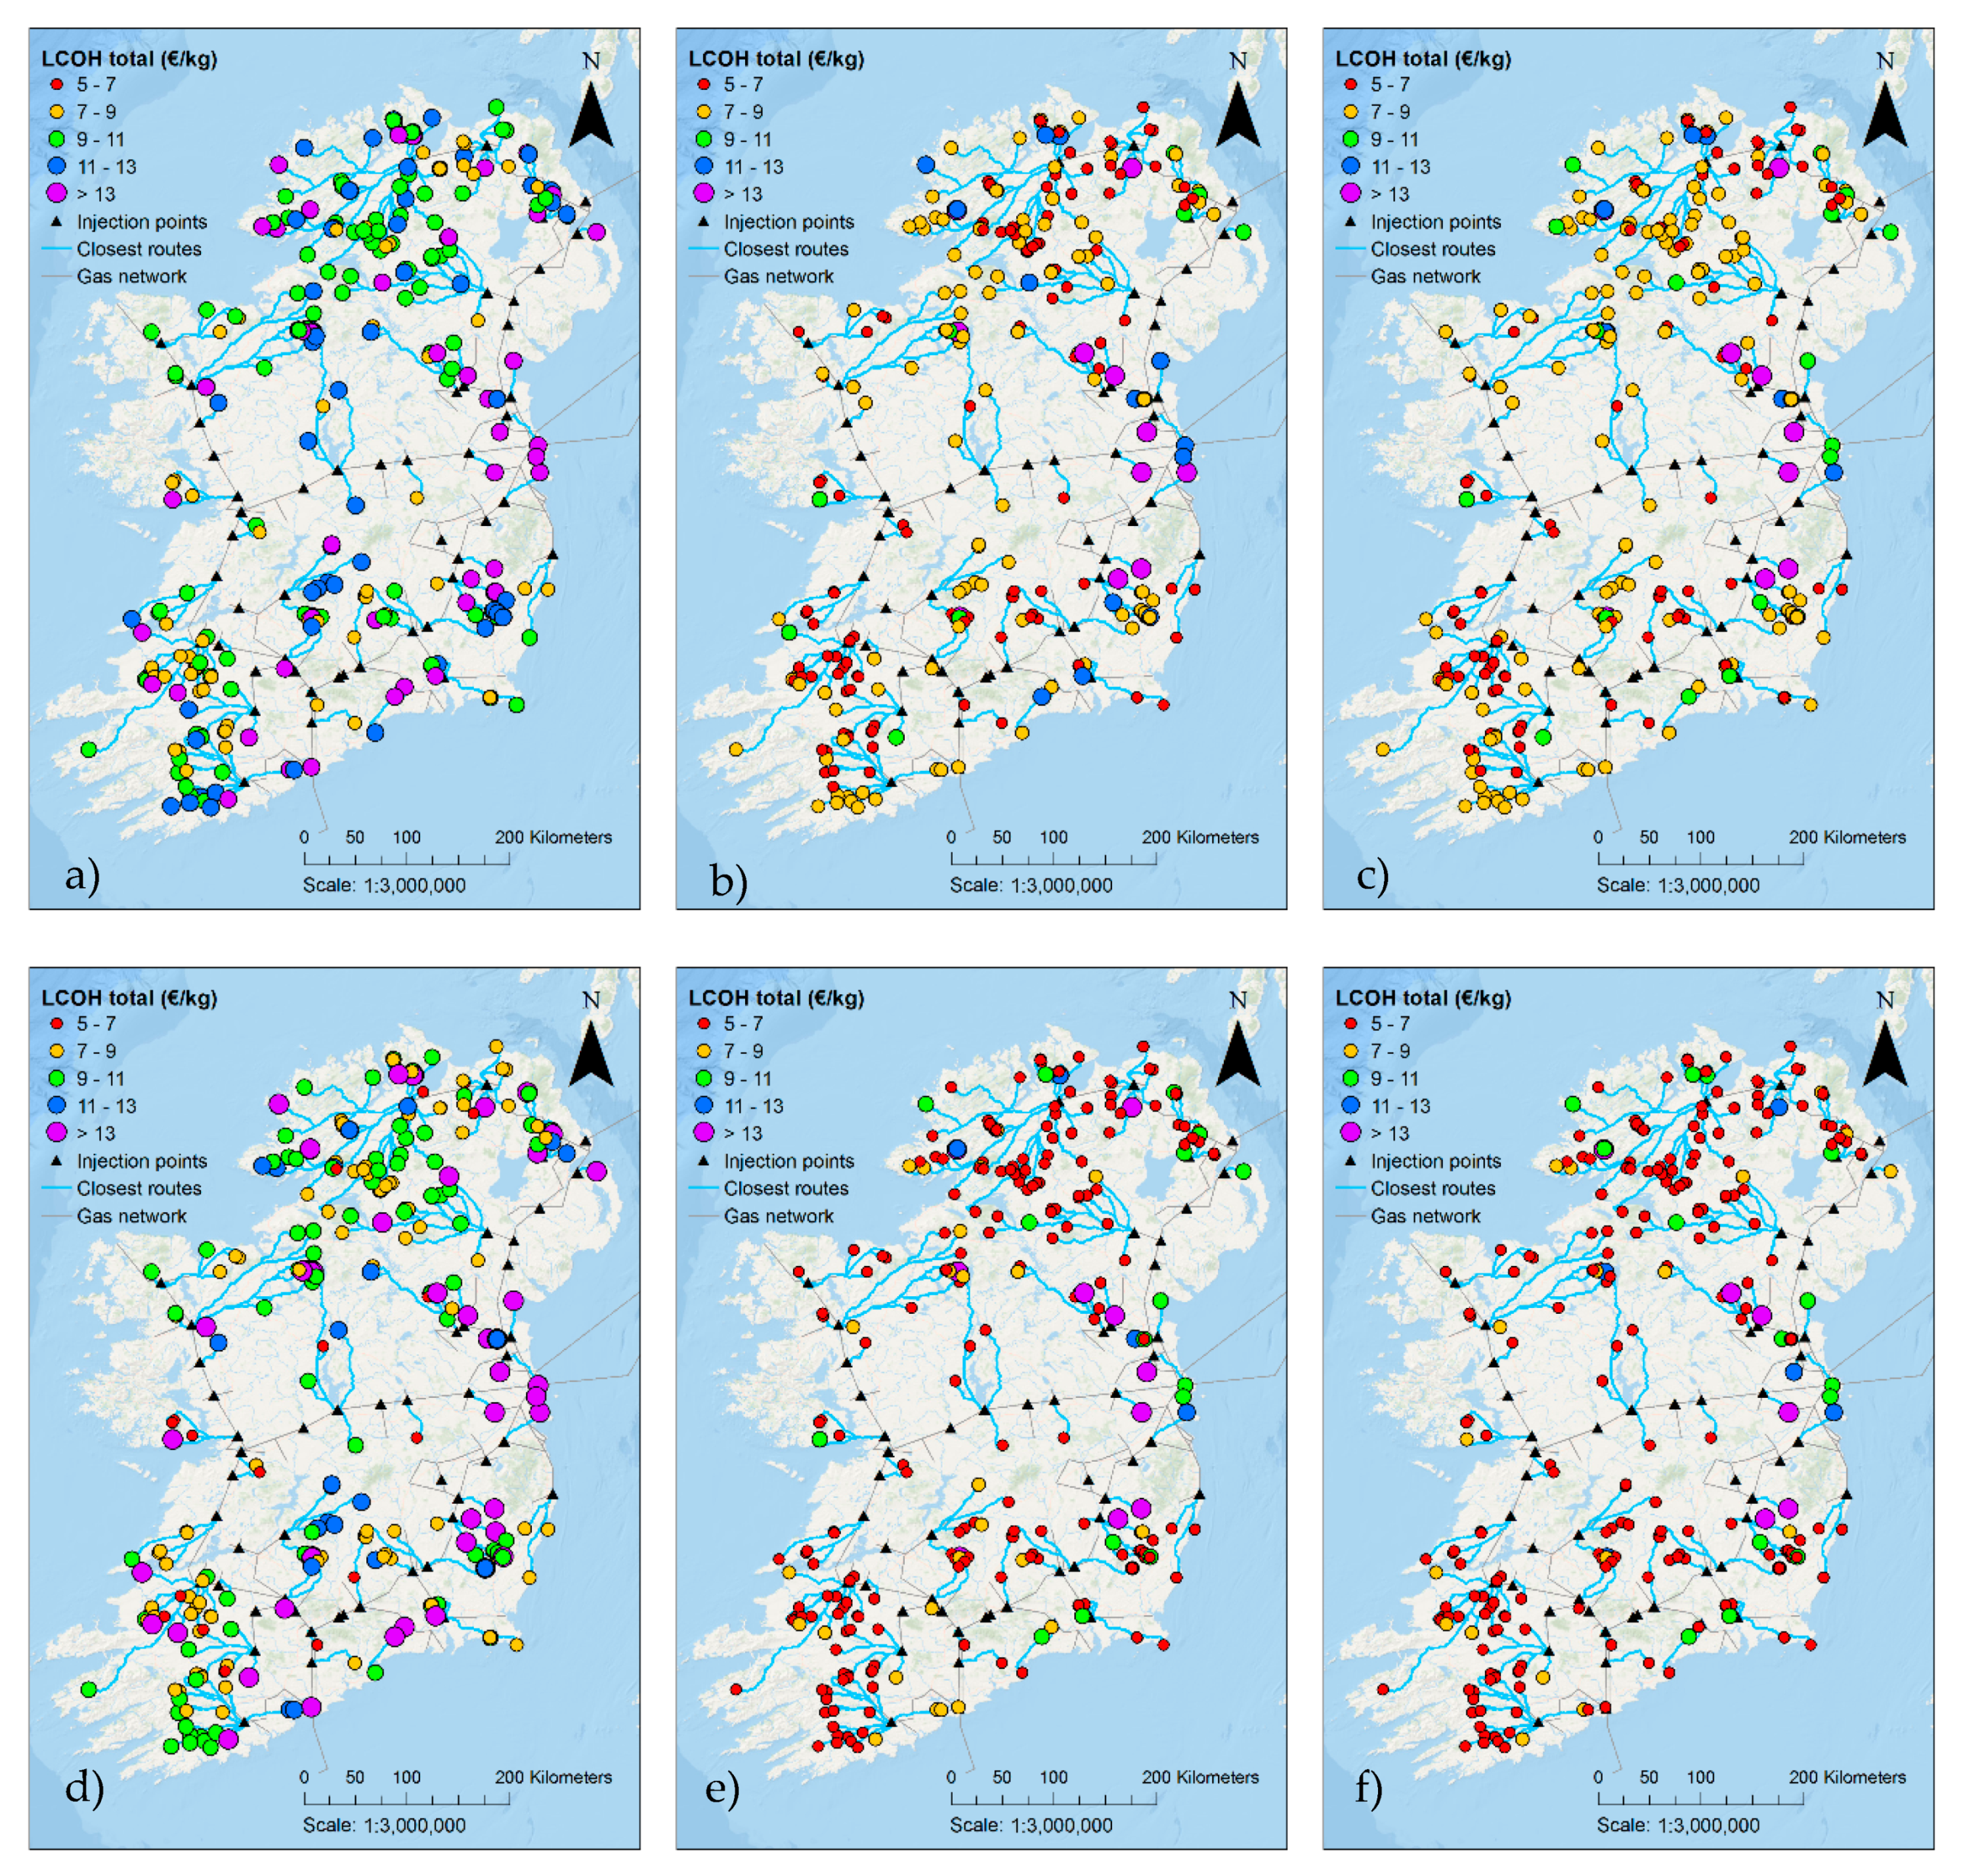
3.4. LCOH Analysis for All Scenarios

The LCOHtotal for each WHS using current and future techno-economic parameters can be seen in Figure 10 and Figure 11, respectively. Each figure represents a different scenario and electricity price. At low or high electricity prices, the LCOHtotal at most of wind farms in the first scenario (curtailed only) is higher than 13 €/kg with averages of 23 €/kg and 24 €/kg for low and high electricity prices. This figure is mostly contributed to by wind farms with capacity of below 5 MWe. When exportable wind is also included in the second scenario, the average LCOHtotal drops to 10–11 €/kg. Only wind farms smaller than 1 MWe have LCOHtotal higher than 13 €/kg, due to insufficient hydrogen production to cover investment, operation, maintenance and transportation expenses. When maximum electrolyser capacity factor is maintained in the third scenario, the average LCOHtotal of all Irish wind farms is 9–11 €/kg, with only few wind farms below 0.1 MWe left with LCOHtotal higher than 13 €/kg. By 2030, hydrogen production at WHS becomes more attractive, with average LCOHtotal for first, second, and third scenarios of 14–15 €/kg, 7–8 €/kg and 6–8 €/kg, respectively.

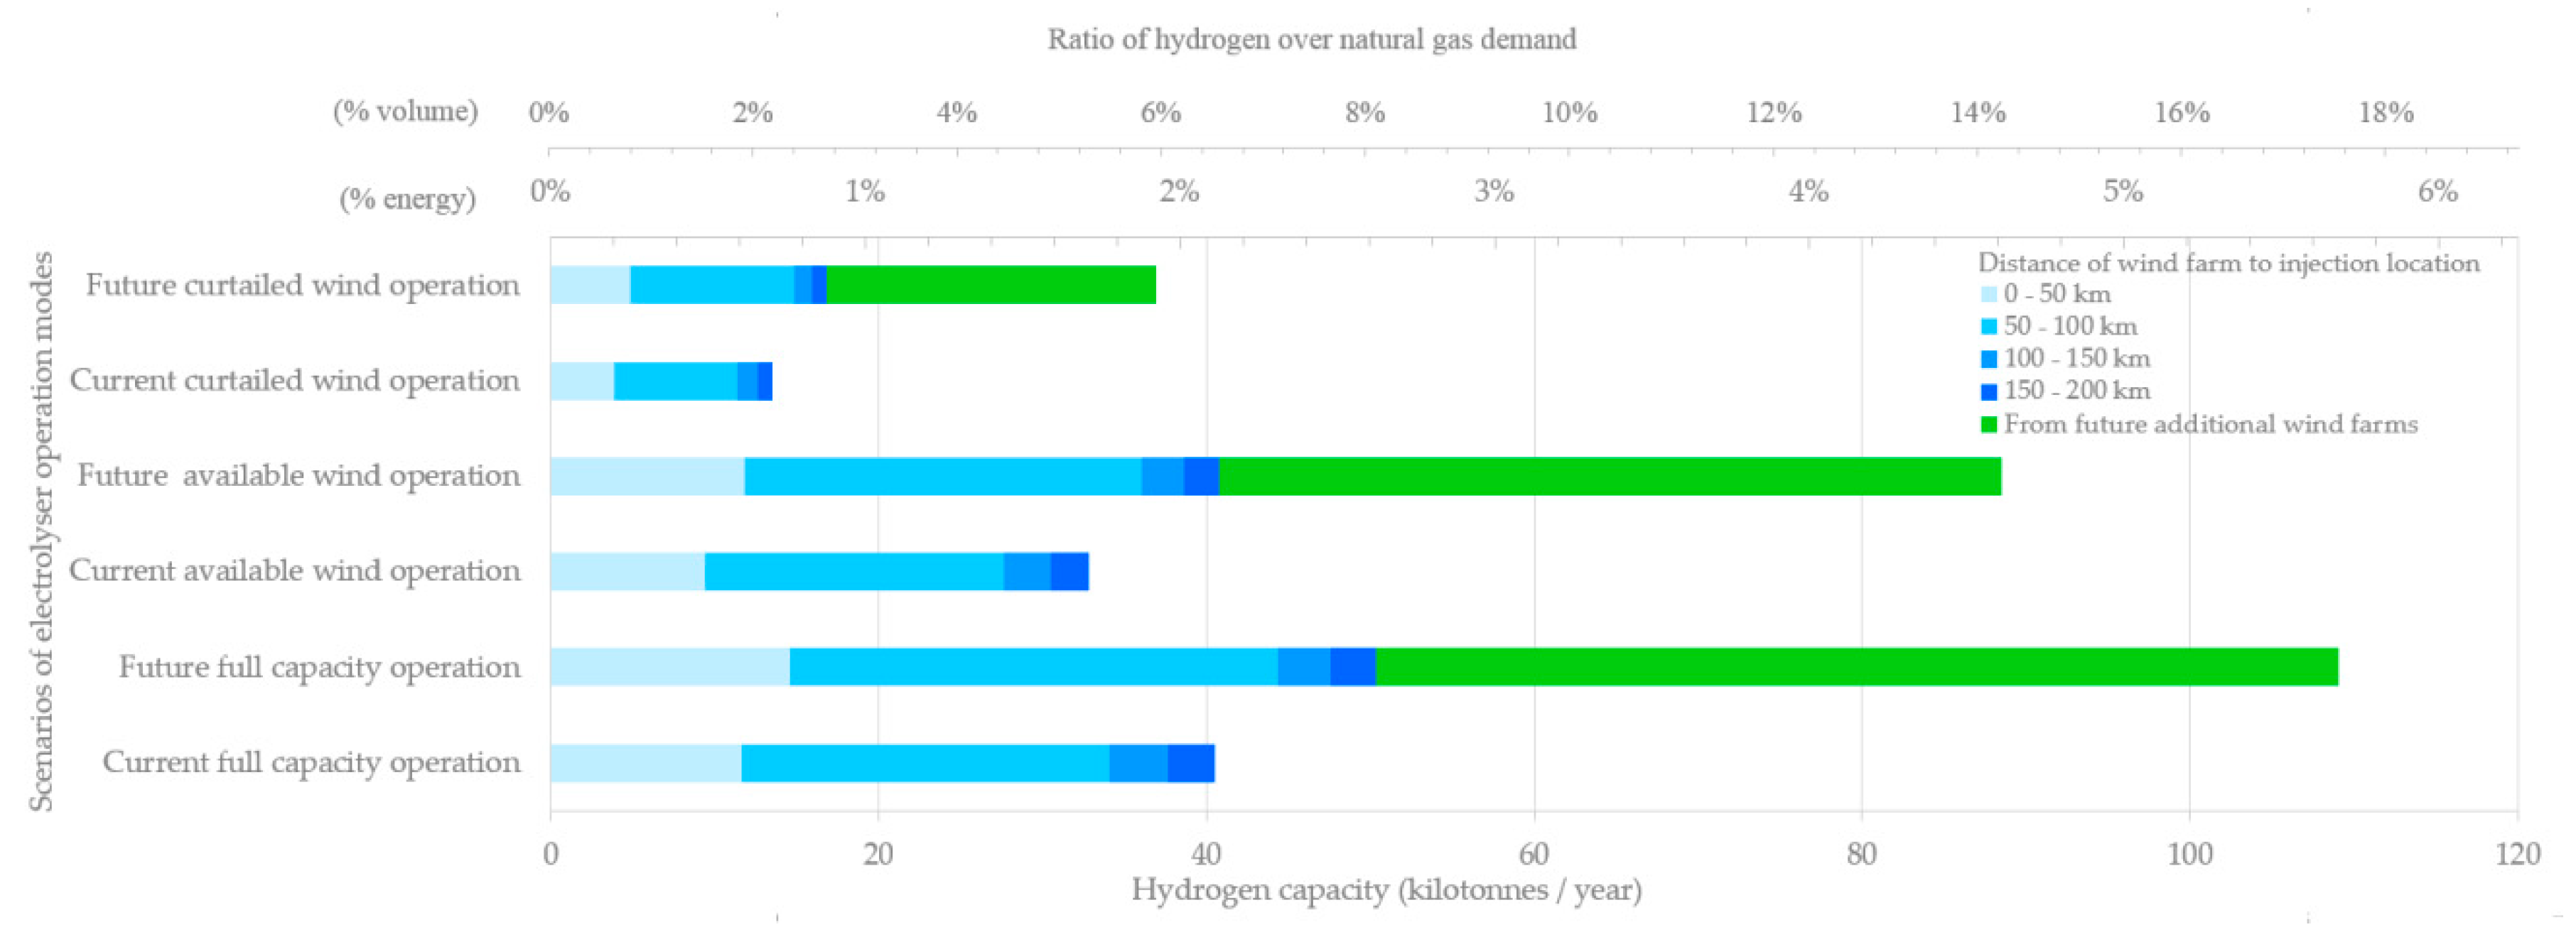
3.5. Overall Share of Hydrogen in Natural Gas Network

Figure 12 shows that at least 84% of hydrogen capacity is located not more than 100 km from the nearest gas injection location, with the longest distance reaching 195 km. The total hydrogen production potential using current techno-economic parameters at all existing wind farms in the island of Ireland for full capacity operation reaches 39 kilotonnes. This increases to 49 kilotonnes using future techno-economic parameters. This is equivalent to nearly 3% of current natural gas energy demand. When additional wind capacity of more than one-hundred percent of today’s capacity and curtailment rate of 7% in the future [3] are considered, the potential of wind-produced hydrogen to substitute energy from natural gas reaches almost 6%.

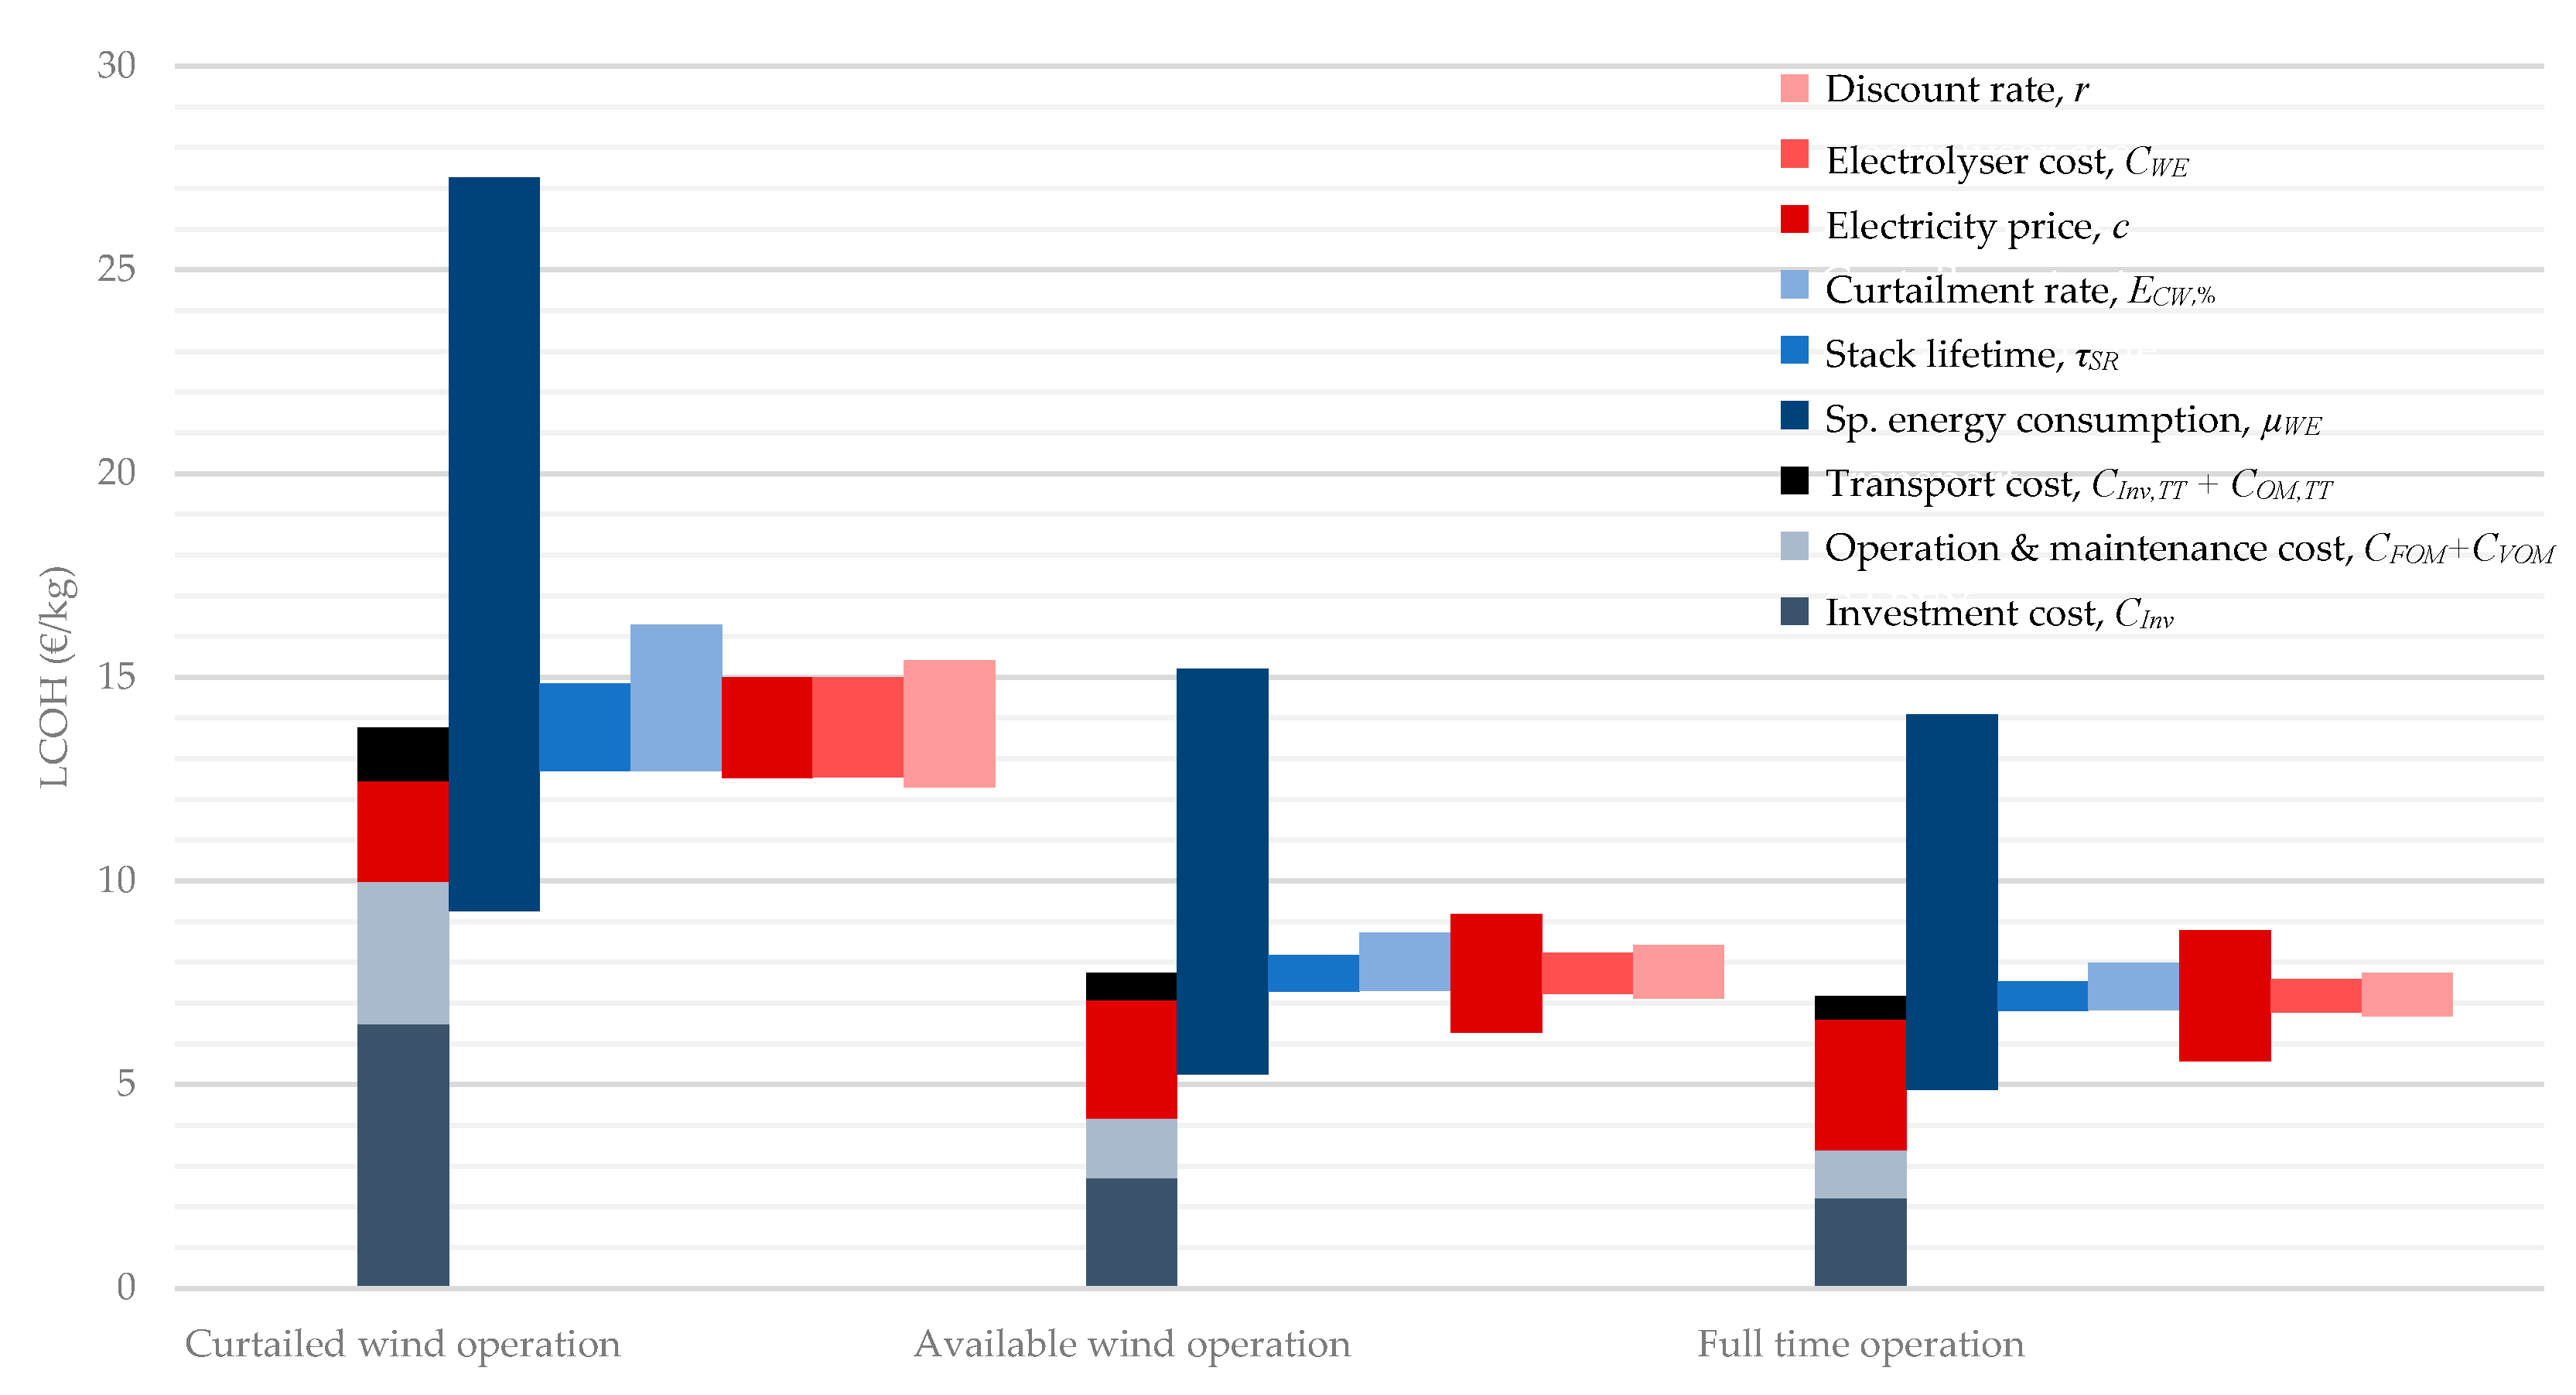
3.6. Sensitivity Analysis of Techno-Economic Parameters

The results of sensitivity analysis for Screggagh wind farm with capacity of 20 MWe are shown in Figure 13. The technical parameters in the analysis include curtailment percentage, stack lifetime and electrolyser specific energy consumption. The economic parameters in the analysis are discount rate, capital cost of electrolyser, and electricity price. The value of each parameter is changed by −50% and 50% of its initial value. Electrolyser specific energy consumption accounts for the most sensitive parameter for all scenarios, followed by curtailment percentage and stack lifetime. The LCOHtotal will further decrease when economic parameters such as capital cost of electrolyser decreases in the future. The cost share of different cost components to LCOHtotal can also be seen in Figure 13. The relative increase in the importance of electricity price as electrolyser operating hours increase from curtailed only operation to full time operation is notable.

3.7. Technical Challenges for Injection into the Natural Gas Network

In hydrogen injection into natural gas network, several challenges are encountered from (1) technical, (2) economic, and (3) the regulatory perspectives. The two main technical perspectives are from the gas network operator and the final consumer. The gas network operator implements parameters to maintain gas quality such as the Wobbe Index. The Wobbe index (MJ/m³) is the ratio of gross calorific value to relative density. It indicates the rate of heat flow from the gas burner. Low Wobbe Index results in increased propensity for flame lift and flame extinction, leading to incomplete combustion and hazardous emissions. High Wobbe Index results in over-heating and carbon monoxide formation [53]. The increase of hydrogen concentration in natural gas reduces volumetric gross calorific value and relative density, which eventually affect Wobbe Index. Therefore, the parameters for gas quality in transmission and distribution have to be improved for more hydrogen to be transported by the gas grid in the future. The other technical aspect in gas transmission and distribution is gas handling at the injection location. The required equipment and installation have to be identified to safely transfer hydrogen from tube trailer to gas pipeline. Each AGI might have different technical characteristics and capacity to accommodate hydrogen. As shown previously in Figure 10 and Figure 11, each AGI is connected to different numbers of WHSs, where each WHS has a different hydrogen capacity. If curtailed wind and available wind operations are considered, the daily hydrogen supply is highly dependent on wind availability. This means additional storage at each AGI is required to ensure the continuity and stability of gas supply. Further studies are required to quantify the hydrogen storage and other required equipment at AGIs. Additionally, it is necessary to ensure the hydrogen concentration to be equivalent across the pipeline at different locations with gas metering. At final consumer locations, when the concentration of hydrogen at natural gas is high, system adjustment may be required as studied by [54]. A review by [55] shows hydrogen must be preserved at a certain fraction to maintain the performance of domestic appliances in the residential and commercial sectors. In the power sector, modern gas turbine power plants can burn over 50% hydrogen by volume in natural gas. But by and large, such plants require modification to the combustion system when the fuel contains high levels of hydrogen, as evaluated by [56].
In terms of economic challenges, the injection cost is difficult to estimate due to as yet unidentified injection equipment. The specification of required equipment can assist the formulation of hydrogen injection costs. The additional cost of injection and distribution in the gas network is required to be added to LCOHtotal. As described in Section 2.2, current analysis only includes hydrogen production and transportation to the injection location.
Hydrogen from future onshore and offshore wind farms has even greater potential to be delivered to the Irish gas network. However, hydrogen is not yet regulated in the same way as biomethane injection into the gas network. To facilitate biomethane injection, Ireland introduced an injection price [57] as well as gas quality parameters [58]. The same approach is required for hydrogen in the near future.

4. Conclusions

A wind-hydrogen system (WHS) is designed to harness either curtailed wind power or a combination of curtailed and exportable wind with support from grid electricity to produce hydrogen and transport it to the Irish natural gas gird. Electrolyser operation is modelled under three different scenarios: (1) curtailed wind operation, (2) available wind operation and (3) full capacity operation. LCOH is used as the key techno-economic parameter in the techno-economic optimisation and evaluation of WHS. In designing a WHS capacity, a novel algorithm is used to prioritise the use of curtailed wind to power electrolyser and compressor. All the equipment costs for hydrogen production are made to be functions of electrolyser size, which is also a novel correlation-based approach.
The calculation of optimum electrolyser size, giving the minimum production costs for 74 wind farms (>10 MWe), is performed iteratively from 10 kWe to its wind farm capacity by using an hourly curtailed wind profile at each wind farm. From these results, a statistical model is defined to calculate optimum electrolyser power capacity for the remaining 238 smaller wind farms in Ireland. The minimum hydrogen production cost can be calculated using a statistical model from three essential values of wind farm capacity, percentage of curtailed wind and wind farm capacity factor. Afterwards, GIS is used to pair each WHS with its nearest AGI and identify the shortest road route between them. Low and high electricity prices are also used in the evaluation. The opportunity of having more competitive equipment costs and technical performance in the future is also considered.
As a result, most existing Irish wind farms that rely only on curtailed wind have a hydrogen production and transportation cost of more than 13 €/kg. When an electrolyser operates with available wind or at full capacity, WHSs show better techno-economic performance, as reflected by its lower cost hydrogen. As indicated by high hydrogen production and transportation costs, it is found that some of wind farm capacities are not suitable for hydrogen production and transportation to the gas network. Wind farm capacities lower than 5 MWe are not suitable to be operated only with curtailed wind, wind farms below 1 MWe are not suitable to depend on available wind, and wind farms below 0.1 MWe are not suitable even when the electrolyser is operating at full capacity. Results also show that 84% of the hydrogen supply potential in Ireland is located not more than 100 km to the nearest injection point with the total costs of 9–11 €/kg at full capacity operation. In the future, the total cost can reach 6–8 €/kg at the same operation scenario. With this hydrogen production cost, the WHS also provides additional economic value to a wind farm due to the fact that curtailed wind is purchased as much as the the average LCOE of onshore wind farms. The most sensitive parameters of WHS that possibly change in the future are the percentage of curtailed wind, stack lifetime, electrolyser efficiency, and electrolyser capital cost. The future potential of hydrogen capacity from current wind capacities reaches 49 kilotonnes which is equivalent to nearly 3% energy demand of natural gas in Ireland. Additional wind capacities in the future can even elevate the potential of hydrogen to substitute energy from natural gas to almost 6%, or slightly higher than current natural gas supply from Kinsale gas field. This potential can be fully exploited after technical, economic, and regulation challenges in hydrogen injection at potential sites are answered. The recommendation to energy stakeholders is to structure and establish a regulation for hydrogen injection to the gas grid. This can motivate further study and development on hydrogen injection and eventually stimulate more renewables in the gas network, particularly from renewable hydrogen.
The future stage of this work is to reduce dependency on grid electricity by system integration to other renewable sources. It is also essential to advance the developed hydrogen production model by modifying the arrangement of the electrolyser with multiple different electrolyser sizes and combining the existing design with a battery system. Alternative hydrogen transportation mechanisms such as liquid hydrogen and a dedicated hydrogen pipeline from the wind farm are also necessary to be technically and economically compared. At an injection location, details of new required equipment and installation at the AGI are necessary to be investigated for a secure and stable hydrogen supply.

Author Contributions

All authors discussed and edited the manuscript. The authors contributed to the manuscript equally. All authors have read and agreed to the published version of the manuscript.

Funding

This research received financial support from the GENCOMM project (GENerating energy secure COMMunities through smart renewable hydrogen) funded by EU Interreg Northwest Europe programme (project number NWE334).

Acknowledgments

The authors acknowledge financial support from the GENCOMM project (GENerating energy secure COMMunities through smart renewable hydrogen) funded by EU Interreg Northwest Europe programme (project number NWE334) and support from the Ryan Institute at NUI Galway and MaREI, the SFI Research Centre for Energy, Climate and Marine. The authors are grateful to Diana Raine and Ian Williamson of HyEnergy Ltd for sharing their technical knowledge.

Conflicts of Interest

The authors declare no conflict of interest.

Abbreviations

All abbreviations in the manuscript are listed below:
AGIAbove ground installation
c Electricity price, €/kWh
C Cost, €
C ˙ Kilometric cost, €/km
E Energy, MWh
GISGeographic Information System
GNIGas Networks Ireland
L Distance between wind farm and AGI, km
L C O E Levelised cost of energy, €/MWh
L C O H Levelised cost of hydrogen, €/kg
M Annual mass, kg/year
m Average mass, kg/hour
N Number of trips per year, trips/y
n Electrolyser specific size, MWe
p Pressure, barg
P Power, MWe
r Discount rate, %
t Time, hour
T Time, year
SEMOSingle Electricity Market Operator
Greek symbols
λ Capacity factor, %
τ Economic lifetime, year
μ Specific energy consumption, kWh/kg
α Specific energy consumption, kWh/km
Subscripts and superscripts
AWAvailable wind
ECElectric compressor
CWCurtailed wind
DQDispatch quantity
ELElectricity
EMEnergy management unit
EngEngineering
EWExportable wind
FOMFixed operation & maintenance
EGElectricity grid
H2Hydrogen gas
H2OWater
ICSInterconnection, commissioning, and start-up
inInlet condition
invInvestment capital
MGMetered generation
O2Oxygen gas
OMOperation and maintenance
optOptimum size
OtherOther expenditure
outOutlet condition
prodProduction
RRetest of tube trailer
SRElectrolyser stack replacement
SVStorage vessel
totalSummary of production and transportation
transTransportation
tripOccurrence of hydrogen delivery
TTTube trailer
VOMVariable operation & maintenance
WEWater electrolyser
WFWind farm
WHSWind-hydrogen system

References

  1. IRENA. Renewable Capacity Statistics 2019, International Renewable Energy Agency (IRENA); IRENA: Abu Dhabi, UAE, 2019.
  2. EirGrid; SONI. Annual Renewable Energy Constraint and Curtailment Report 2018; EirGrid: Dublin, Ireland, 2019. [Google Scholar]
  3. Turner, M.; Zhang, Y.; Rix, O. 70 By 30: A 70% Renewable Electricity Vision for Ireland in 2030; Baringa Partners LLP: London, UK, 2018. [Google Scholar]
  4. Department of Communications Climate Action & Environment of Government of Ireland. Renewable Electricity Support Scheme (RESS); Department of Communications Climate Action & Environment of Government of Ireland: Dublin, Ireland, 2020.
  5. WindEurope. WindEurope Views on Curtailment of Wind Power and its Links to Priority Dispatch; WindEurope: Brussels, Belgium, 2016. [Google Scholar]
  6. Garrigle, E.V.M.; Deane, J.P.; Leahy, P.G. How much wind energy will be curtailed on the 2020 Irish power system? Renew. Energy 2013, 55, 544–553. [Google Scholar] [CrossRef] [Green Version]
  7. Zhang, G.; Wan, X. A wind-hydrogen energy storage system model for massive wind energy curtailment. Int. J. Hydrogen Energy 2014, 39, 1243–1252. [Google Scholar] [CrossRef]
  8. Reddi, K.; Elgowainy, A.; Rustagi, N.; Gupta, E. Techno-economic analysis of conventional and advanced high-pressure tube trailer configurations for compressed hydrogen gas transportation and refueling. Int. J. Hydrogen Energy 2018, 43, 4428–4438. [Google Scholar] [CrossRef]
  9. Melaina, M.; Antonia, O.; Penev, M. Blending Hydrogen into Natural Gas Pipeline Networks: A Review of Key Issues; National Renewable Energy Laboratory: Golden, CO, USA, 2013.
  10. SEAI. Energy in Ireland; SEAI: Dublin, Ireland, 2019. [Google Scholar]
  11. Beccali, M.; Brunone, S.; Finocchiaro, P.; Galletto, J.M. Method for size optimisation of large wind-hydrogen systems with high penetration on power grids. Appl. Energy 2013, 102, 534–544. [Google Scholar] [CrossRef] [Green Version]
  12. Ashrafi, Z.N.; Ghasemian, M.; Shahrestani, M.I.; Khodabandeh, E.; Sedaghat, A. Evaluation of hydrogen production from harvesting wind energy at high altitudes in Iran by three extrapolating Weibull methods. Int. J. Hydrogen Energy 2018, 43, 3110–3132. [Google Scholar] [CrossRef]
  13. Quarton, C.J.; Samsatli, S. Power-to-gas for injection into the gas grid: What can we learn from real-life projects, economic assessments and systems modelling? Renew. Sustain. Energy Rev. 2018, 98, 302–316. [Google Scholar] [CrossRef]
  14. Vo Truc, T.Q.; Xia, A.; Wall, D.M.; Murphy, J.D. Use of surplus wind electricity in Ireland to produce compressed renewable gaseous transport fuel through biological power to gas systems. Renew. Energy 2017, 105, 495–504. [Google Scholar]
  15. McDonagh, S.; Deane, P.; Rajendran, K.; Murphy, J.D. Are electrofuels a sustainable transport fuel? Analysis of the effect of controls on carbon, curtailment, and cost of hydrogen. Appl. Energy 2019, 247, 716–730. [Google Scholar] [CrossRef]
  16. Singlitico, A.; Goggins, J.; Monaghan, R.F.D. Evaluation of the potential and geospatial distribution of waste and residues for bio-SNG production: A case study for the Republic of Ireland. Renew. Sustain. Energy Rev. 2018, 98, 288–301. [Google Scholar] [CrossRef]
  17. Singlitico, A.; Goggins, J.; Monaghan, R.F.D. Life Cycle Assessment-Based Multiobjective Optimisation of Synthetic Natural Gas Supply Chain: A Case Study for the Republic of Ireland. J. Clean. Prod. 2020, in press. [Google Scholar] [CrossRef]
  18. Gas Networks Ireland. Vision 2050: A Net Zero Carbon Gas Network for Ireland; Gas Networks Ireland: Cork, Ireland, 2019. [Google Scholar]
  19. Chardonnet, C.; Giordano, V.; de Vos, L.; Bart, F. Study on Early Business Cases for H2 in Energy Storage and More Broadly Power to H2 Applications; FCH-JU: Brussels, Belgium, 2017. [Google Scholar]
  20. Götz, M.; Lefebvre, J.; Mörs, F.; Koch, A.M.; Graf, F.; Bajohr, S.; Reimert, R.; Kolb, T. Renewable Power-to-Gas: A technological and economic review. Renew. Energy 2016, 85, 1371–1390. [Google Scholar] [CrossRef] [Green Version]
  21. Kuckshinrichs, W.; Ketelaer, T.; Koj, J.C. Economic analysis of improved alkaline water electrolysis. Front. Energy Res. 2017, 5, 1. [Google Scholar] [CrossRef] [Green Version]
  22. Siyal, S.H.; Mentis, D.; Howells, M. Economic analysis of standalone wind-powered hydrogen refueling stations for road transport at selected sites in Sweden. Int. J. Hydrogen Energy 2015, 40, 9855–9865. [Google Scholar] [CrossRef]
  23. Viktorsson, L.; Heinonen, J.T.; Skulason, J.B.; Unnthorsson, R. A step towards the hydrogen economy - A life cycle cost analysis of a hydrogen refueling station. Energies 2017, 10, 763. [Google Scholar] [CrossRef]
  24. Scottish Entreprise. Constrained Renewables and Green Hydrogen Production Study Final Report; Scottish Entreprise: Glasgow, UK, 2018. [Google Scholar]
  25. Glenk, G.; Reichelstein, S. Economics of converting renewable power to hydrogen. Nat. Energy 2019, 4, 216–222. [Google Scholar] [CrossRef]
  26. Schmidt, O.; Gambhir, A.; Staffell, I.; Hawkes, A.; Nelson, J.; Few, S. Future cost and performance of water electrolysis: An expert elicitation study. Int. J. Hydrogen Energy 2017, 42, 30470–30492. [Google Scholar] [CrossRef]
  27. Proost, J. State-of-the art CAPEX data for water electrolysers, and their impact on renewable hydrogen price settings. Int. J. Hydrogen Energy 2019, 44, 4406–4413. [Google Scholar] [CrossRef]
  28. Linnemann, J.; Steinberger-Wilckens, R. Realistic costs of wind-hydrogen vehicle fuel production. Int. J. Hydrogen Energy 2007, 32, 1492–1499. [Google Scholar] [CrossRef]
  29. Greiner, C.J.; KorpÅs, M.; Holen, A.T. A Norwegian case study on the production of hydrogen from wind power. Int. J. Hydrogen Energy 2007, 32, 1500–1507. [Google Scholar] [CrossRef]
  30. SEM Committee. SEM Monitoring Report: Q3 2018 November 2018; SEM Committee: Dublin, Ireland, 2018. [Google Scholar]
  31. Parra, D.; Valverde, L.; Pino, F.J.; Patel, M.K. A review on the role, cost and value of hydrogen energy systems for deep decarbonisation. Renew. Sustain. Energy Rev. 2019, 101, 279–294. [Google Scholar] [CrossRef]
  32. SEAI. Electricity & Gas Prices in Ireland; Sustainable Energy Authority of Ireland: Dublin, Ireland, 2018. [Google Scholar]
  33. SEM Committee. Single Electricity Market Performance; SEM Committee: Dublin, Ireland, 2019. [Google Scholar]
  34. Louw, A.; Boyle, R.; Strahan, D.; Collins, B.; Kimmel, M.; Giannakopoulou, E.; Becker, L. Global Trends in Renewable Energy Investment 2018; Frankfurt School of Finance & Management gGmbH.: Frankfurt, Germany, 2018. [Google Scholar]
  35. National Competitiveness Council. Costs of Doing Business in Ireland 2018; National Competitiveness Council: Makati, Philippines, 2018. [Google Scholar]
  36. Léon, A. Hydrogen Storage. In Hydrogen Technology: Mobile and Portable Applications; Springer: Berlin, Germany, 2008; p. 86. [Google Scholar]
  37. Hall, S. Fans, Blowers, and Compressors. In Rules of Thumb for Chemical Engineers; Gulf Professional Publishing: Houston, TX, USA, 2012; p. 123. [Google Scholar]
  38. Saur, G. Wind-To-Hydrogen Project: Electrolyzer Capital Cost Study; Technical Report NREL/TP-550-44103; National Renewable Energy Laboratory: Golden, CO, USA, 2008.
  39. Papadopoulos, V.; Desmet, J.; Knockaert, J.; Develder, C. Improving the utilization factor of a PEM electrolyzer powered by a 15 MW PV park by combining wind power and battery storage—Feasibility study. Int. J. Hydrogen Energy 2018, 43, 16468–16478. [Google Scholar] [CrossRef]
  40. Bertuccioli, L.; Chan, A.; Hart, D.; Lehner, F.; Madden, B.; Standen, E. Study on Development of Water Electrolysis in the EU—Final Report; FCH JU: Bruxelles, Belgium, 2014. [Google Scholar]
  41. Buttler, A.; Spliethoff, H. Current status of water electrolysis for energy storage, grid balancing and sector coupling via power-to-gas and power-to-liquids: A review. Renew. Sustain. Energy Rev. 2018, 82, 2440–2454. [Google Scholar] [CrossRef]
  42. Jiang, Y.; Deng, Z.; You, S. Size optimization and economic analysis of a coupled wind-hydrogen system with curtailment decisions. Int. J. Hydrogen Energy 2019, 44, 19658–19666. [Google Scholar] [CrossRef]
  43. TSC-Part-B-Glossary. Single Electricity Market Operator. 2018. Available online: www.sem-o.com/MarketDevelopment/MarketRules/Glossary.docx (accessed on 10 August 2018).
  44. EirGrid; SONI. Annual Renewable Energy Constraint and Curtailment Report 2014; EirGrid: Dublin, Ireland, 2015; pp. 1–28. [Google Scholar]
  45. O’Shea, R.; Wall, D.; Kilgallon, I.; Murphy, J.D. Assessment of the impact of incentives and of scale on the build order and location of biomethane facilities and the feedstock they utilise. Appl. Energy 2016, 182, 394–408. [Google Scholar] [CrossRef]
  46. Singlitico, A.; Kilgallon, I.; Goggins, J.; Monaghan, R.F.D. GIS-based techno-economic optimisation of a regional supply chain for large-scale deployment of bio-SNG in a natural gas network. Appl. Energy 2019, 250, 1036–1052. [Google Scholar] [CrossRef]
  47. GNI (UK) Limited. Northern Ireland Gas Capacity Statement 2018/19; GNI (UK) Limited: London, UK, 2018. [Google Scholar]
  48. Barbier, F. Hydrogen Distribution Infrastructure for an Energy System: Present Status and Perspectives of Technologies; John Wiley & Sons, Inc.: Hoboken, NJ, USA, 2013; pp. 1–33. [Google Scholar]
  49. SEAI Wind Mapping System. 2016. Available online: http://maps.seai.ie/wind/ (accessed on 10 October 2019).
  50. RenewableUK. Onshore Wind Farms in the UK. 2016. Available online: https://www.arcgis.com/home/item.html?id=8bad1da3b2d14a90bf22a7d0b52dc9b3 (accessed on 10 October 2019).
  51. Geofabrik GmbH. OpenStreetMap Data Extracts. 2019. Available online: http://download.geofabrik.de/ (accessed on 10 January 2019).
  52. Gas Networks Ireland. The Future of Transport—Case Study: Comparison of a Natural Gas Truck Versus a Diesel Truck; Gas Networks Ireland: Cork, Ireland, 2014. [Google Scholar]
  53. Roberts, S.; Williams, T. Common Arrangements for Gas: Final Report on the Requirements for a Single Natural Gas Quality Standard for Northern Ireland and the Republic of Ireland; CRU Ireland: Tallaght, Ireland, 2008. [Google Scholar]
  54. Leicher, J.; Nowakowski, T.; Giese, A.; Görner, K. Power-to-gas and the consequences: Impact of higher hydrogen concentrations in natural gas on industrial combustion processes. Energy Procedia 2017, 120, 96–103. [Google Scholar] [CrossRef]
  55. De Vries, H.; Mokhov, A.V.; Levinsky, H.B. The impact of natural gas/hydrogen mixtures on the performance of end-use equipment: Interchangeability analysis for domestic appliances. Appl. Energy 2017, 208, 1007–1019. [Google Scholar] [CrossRef]
  56. Andersson, M.; Larfeldt, J.; Larsson, A.; Finansierats, D.S.H. Co-Firing with Hydrogen in Industrial Gas Turbines (Sameldning Med Vätgas i Industriella Gasturbiner); Svenskt gastekniskt center: Malmö, Sweden, 2013. [Google Scholar]
  57. Commission for Regulation of Utilities. Gas Networks Ireland Transmission Tariffs and Allowed Revenue 2019/20; Commission for Regulation of Utilities: Tallaght, Ireland, 2019; p. 13. [Google Scholar]
  58. Commission for Regulation of Utilities. Biogas injection into the Natural Gas Grid; Commission for Regulation of Utilities: Tallaght, Ireland, 2013. [Google Scholar]
Figure 1. Block diagram of a wind-hydrogen system (WHS) which is located at each wind farm in Ireland.
Energies 13 01798 g001
Figure 2. Scenarios of electrolyser operation mode: (a) curtailed wind operation, (b) available wind operation, and (c) full capacity operation.
Energies 13 01798 g002
Figure 3. Electricity prices in the wind-hydrogen system.
Energies 13 01798 g003
Figure 4. Algorithm to calculate the L C O H t o t a l .
Energies 13 01798 g004
Figure 5. Cumulative wind power profile of a sample wind farm.
Energies 13 01798 g005
Figure 6. Calculated LCOHprod for Ballincollig Hill wind farm as a function of electrolyser size for all operation scenarios.
Energies 13 01798 g006
Figure 7. Wind farm distribution on the island of Ireland: (a) total energy of curtailed wind (ECW) and (b) optimum electrolyser size (PWE,opt) at each wind farm in Ireland.
Energies 13 01798 g007
Figure 8. Capacity of annual hydrogen production (MH2) with current parameters of (a) curtailed wind operation, (b) available wind operation, and (c) full capacity operation, calculated by the techno-economic submodel for all wind farms in the island of Ireland.
Energies 13 01798 g008
Figure 9. Energy flows (GWh) using (1) current and (2) future techno-economic parameters to all WHSs in Ireland of (a) curtailed wind operation, (b) available wind operation, and (c) full capacity operation.
Energies 13 01798 g009
Figure 10. Current LCOHtotal of (a) curtailed wind operation at high electricity prices, (b) available wind operation at high electricity prices, and (c) full capacity operation at high electricity prices, (d) curtailed wind operation at low electricity prices, (e) available wind operation at low electricity prices, and (f) full capacity operation at low electricity prices, calculated by the WHS model for all wind farms in Ireland.
Energies 13 01798 g010
Figure 11. Future LCOHtotal of (a) curtailed wind operation at high electricity prices, (b) available wind operation at high electricity prices, (c) full capacity operation at high electricity prices, (d) curtailed wind operation at low electricity prices, (e) available wind operation at low electricity prices, and (f) full capacity operation at low electricity prices, calculated by the WHS model for all wind farms in Ireland.
Energies 13 01798 g011
Figure 12. Distribution of hydrogen capacity relative to Irish natural gas demand, as functions of distance from WHS to injection points.
Energies 13 01798 g012
Figure 13. Sensitivity analysis of the techno-economic parameters.
Energies 13 01798 g013
Table 1. Economic parameters in WHS, calculated using cost curve data from [19,25,26,27,31].
Cost ComponentSymbolUnitValuesRef
Investment costCurrentFuture
Electrolyser C W E 2498 × P W E , n 0.925 1249 × P W E , n 0.925 [25,26,27]
Compressor C E C 4948 × P W E , n 0.66 4948 × P W E , n 0.66 [19,31]
Storage vessel C S V 470 × ( M ˙ H 2 × t S V ) 470 × ( M ˙ H 2 × t S V ) [19,31]
Main equipment C M E C W E + C E C C W E + C E C [19]
Energy mgt. unit C E M 10 % × C M E 10 % × C M E [19]
Interconnection C I C S 20 % × C M E 20 % × C M E [19]
Engineering C E n g 15 % × C M E 15 % × C M E [19]
Other cost C O t h e r 1.5652 × P W E , n 0.154 × C M E 1.5652 × P W E , n 0.154 × C M E [19]
Operation & maintenance costCurrentFuture
Electrolyser C O M ,   W E 167.42 × P W E , n 0.305 × C W E 167.42 × P W E , n 0.305 × C W E [19]
Compressor C O M , E C 2 % × C E C 2 % × C E C [19]
Storage vessel C O M ,   S V 2 % × C S V 2 % × C S V [19]
Stack replacement C S R 874 × P W E , n 0.925 437 × P W E , n 0.925 [25,27]
Electricity & water pricesLowHigh
Grid electricity c G E €/kWh0.1040.157[32]
Exportable wind c E W €/kWh0.0720.093[33]
Curtailed wind c C W €/kWh0.0500.065[34]
Water c H 2 O €/m32.382.38[35]
Table 2. Technical parameters in WHS.
ParametersSymbolUnitsValuesRef.
Electrolyser subsystemCurrentFuture
Electrolyser rated power PWE,nMWe0.01 to PWF0.01 to PWF[19]
Operating pressurepWEbarg3030[39]
Specific energy consumption µWEkWhe/kg5547[26,40,41]
Water consumptionρWEL/kg1515[19]
Stack lifetimeτSRyears58[26]
Compressor subsystemCurrentFuture
Pressure inputpEC,inbarg3030[19]
Pressure outputpEC,outbarg300300[19]
Specific energy consumptionµECkWhe/kg1.71.7[19,37]
Storage subsystemCurrentFuture
Operating pressurepSVbarg300300[22]
Table 3. Techno-economic parameters in the transportation submodel.
ParametersSymbolUnitValuesRef
Economic parametersCurrentFuture
Tube trailer cost C I n v , T T 232,000232,000[24]
Operational cost C ˙ O , T T €/km1.91.9[24]
Maintenance cost C ˙ M , T T €/km0.130.13[24]
Retest cost C R , T T 30 % × C T T 30 % × C T T [19]
Technical parametersCurrentFuture
Tube trailer capacity M T T kg500500[48]
Operating pressure p T T barg300300[48]
Kilometric energy consumption α T T kWh/km1.771.77[52]
Trip numbers N t r i p Trips/yearCalculated by Equation (41)
WHS distance to AGI L A G I kmDetermined by GIS closest-facility algorithm for each wind farm
Average production per hour m H 2 kg/hourmH2 calculated by Equation (12), then divided with 8760 h

