Abstract
In order to provide specific references and suggestions for the design and operation of underground pumping stations, in this paper, an experimental model of an underground pumping station, including 4 pumps and 2 pump intakes (primary and secondary), was obtained through similitude of fluid mechanics. The phase diagrams of various vortices, in terms of different dimensionless numbers are presented, which can reveal their appearance and evolution process. Three specific cases with different vortex flows were analyzed. The experiment results may provide a reference for the current design guidelines for underground pumping stations.
1. Introduction
With the increasing requirements for urban environment and land resources, underground pumping stations are being widely applied in underground mines, nuclear power plants, sewage treatment plants, and groundwater diversion projects, etc. [1,2,3,4].
Underground pumping stations are named because, in contrast to conventional pumping stations (Figure 1a), they are located partly or fully below the ground level, usually 10–100 meters or more underground (Figure 1b), corresponding to the topographic height of the inflow. This leads to a deep water-collecting well (primary pump intake). It is noted that in underground pumping stations, it is usually necessary to position a secondary pump intake to facilitate the maintenance and desilting works on the high content of impurities, silt, and other solid particles in the water. The secondary pump intake is pressurized rather than open, which is an important factor affecting the formation of various vortices inside the pump intakes.
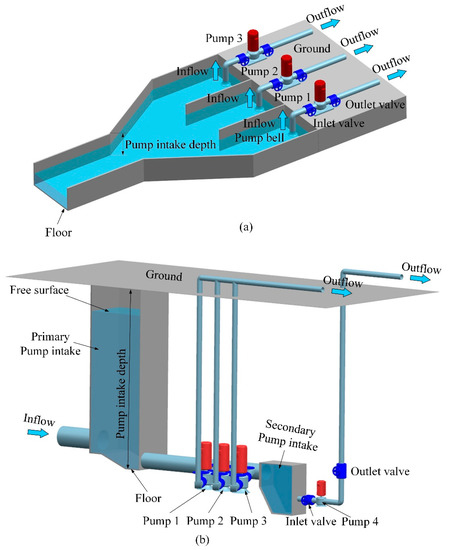
Figure 1.
Pump intake and pump pipeline system of different pumping stations. (a) Conventional pumping station, (b) underground pumping station.
It was shown that the vortex flows at the pump intakes may cause performance deteriorations to the conventional pumping stations, e.g., a decrease in efficiency, mechanical vibrations, and even forced pump shutdown [5,6,7,8]. A number of research studies have focused on the experimental and numerical capture of the vortex flows, and the flow distribution around the pipe bell in the intake channel.
The literature study of vortices captures, and the evolution of relevant flow patterns mainly include the following: Rajendran et al. [9] applied particle image velocimetry (PIV) technique to measure the vortices on a specific plane in water-pump intake bays. The experimental results showed that some vortices exhibited intermittent bimodal properties, in terms of their occurring positions. Anwar et al. [10] carried out experiments on the free-vortex at horizontal intake when the radial Reynolds number (Re = Q/νh, where Q = is the discharge through intake, ν is the kinematic viscosity of test fluid, and h is the submergence depth above intake axis), and the Weber number (We = ρQ2h/A2σ, where ρ is the mass density, Q is the discharge through intake, h is the submergence depth above intake axis, A is the cross-section area of intake pipe, and σ is the surface tension of test fluid) were larger than 3 × 10⁴ and 104, respectively. By using different shapes of the bell-mouth, the working efficiency of the intake was hardly improved. Echavez et al. [11] performed high-speed photographic observations on the three-dimensional structure of a vertical vortex flow. The results show that the axial flow in the core zone was important in the vortex formation and development. Andersen et al. [12] studied the free-surface vortex through the superposition of two explicit visual effects of the flow by adding fluorescent dyes to the surface and the bottom. It was found that unstable bubbles appeared on the top of the free-surface vortex with a high rotating velocity. Choi et al. [13] found that the submerged vortex intensity in the vicinity of side walls was higher than both the near rear wall and the upstream region of the bell-mouth through a pump sump model. Cristofano et al. [14] studied free surface-vortex with different air content using visualization technology and divided the observed vortex into different levels. The parameters having significant influences on the vortex state were defined. The theoretical analyses of the influencing mechanism of these factors were carried out and verified by the model experiments. Kim et al. [15] investigated the effectiveness of an anti-vortex device (AVD) to suppress the vortex occurrence in a single intake pump intake model through model experiments. It was found that the maximum swirl angle was 10.9° when there were no AVDs. On the other hand, when the ADVs existed, the maximum swirl angle (, Vz was the axial mean velocity, and Vθ is the tangential mean velocity at the swirl meter) was reduced to 2.7°. According to the analysis of the time regularity of the PIV experimental results, Duarte [16] found that the flow in the pump intake had a certain statistical unsteady characteristic and recommended a characteristic frequency of oscillation, which related to the clearance between the measurement section and the intake pipe.
On the other hand, studies were carried out on the geometric scaling and the flow distribution around the pipe bell. Padmanabhan et al. [5] compared the distributions of the internal flow field between one full-sized and two reduced-scale (geometric scales of 1:2 and 1:4, respectively) models of a pump sump. The scale effects on the swirl flow in the intake pipe and the loss at the inlet of the intake were shown. Eguchi et al. [17] used three models of different scales and showed that the critical Froude (Fr) number (, where U = reference velocity, g = gravitational acceleration, and L = the representative length or span length), above which the gas entrainment appeared, and its size drastically decreased as the scale factor increased. Mansa et al. [8] found that various vortices appeared around the bell-mouth, affecting the performance of the intake by PIV technology. Kirst et al. [18,19] optimized the performance of the vertical pump system by installing a baffle wall after evaluating the inflow conditions in the structure of the pump intake of a compact sewage pump station model, which was verified by the experiment.
As for underground pumping stations, research on their complicated internal flow pattern has not been carried out systematically, and the existing research on the underground pumping station mainly focuses on the civil structures [20], layout [2], and stability [21], etc. In this context, the present paper attempts to answer the following questions:
- 1)
- How are the vortices distributed in the underground pumping station?
- 2)
- What is the mechanism of the complex flow pattern in the underground pumping station?
- 3)
- What are the influencing parameters of the vortices in the underground pumping station?
Obviously, the solution to these problems is of positive significance for better understanding of the complex flow pattern in underground pumping stations. The results of this paper give engineering experience and provide an essential reference for the design and optimization of underground pumping stations in the future.
In this paper, an experimental model based on the first large-scale underground pumping station in China was obtained through the similitude of fluid mechanics. In addition to the Design Standards of American Hydraulic Society for the Pump Intake and definitions of free surface vortices and subsurface vortices by the ALDEN laboratory [22,23], newly identified free surface vortices and subsurface vortices are presented through a large number of test results.
2. Experimental Setup
2.1. Nondimensional Parameters Influencing Vortex Flows in Pump Intake
In this section, nondimensional parameters affecting the dynamics of the vortex in pump intake, i.e., Reynolds number Re, Froude number Fr are firstly derived through an analysis of normalized Navier–Stokes equations. The effects of the dimensionless submergence depth in the dimensionless velocity solution are also presented.
A cylindrical polar coordinate system was set up to analyze the free-surface vortices (Figure 2).
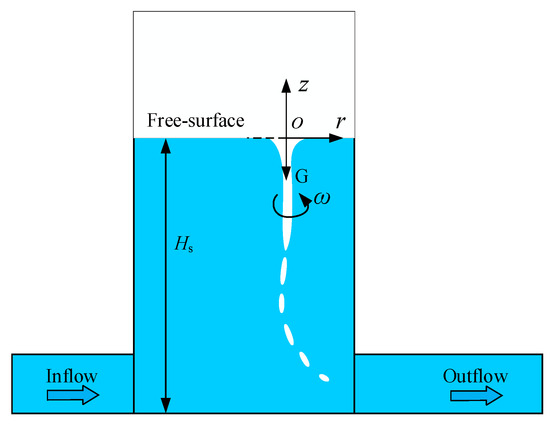
Figure 2.
Bottom horizontal suction of underground pumping stations.
Considering the cases of steady axisymmetric vortices, the velocities, pressure, and the length can be scaled as [23,24]:
where Ur, Uz, and Uθ are the velocity components in the radial, axial, and tangential directions, respectively. p is the pressure, b is the width of the pump intake, Hs is the submergence as shown in Figure 2, D is the diameter of the main intake pipe, Q is the flow rate of the pump station, Γ is the flow circulation around a vortex near the intake pipe, and ρ is the density of the fluid. Note that Uz is scaled by the average axial velocity in the intake pipe, and Ur is scaled by the mean velocity in the pump intake.
Navier–Stokes equations in a cylindrical coordinate system are then normalized as:
where . ΓN, Fr, and Re are the normalized flow circulation, Froude number and Reynolds number (the definitions of these dimensionless numbers are to smooth the logic of dimensionless analysis and highlight the influence of flow rate Q and submergence HS on the vortex flow patterns in the underground pumping station in the present paper), respectively [23,24]:
Here, ΓN is a purely kinematic parameter. In the present experiments, r* and Uz* are both of order 1. Meanwhile, the value of is 107–109. Thus, the influence of Fr is much greater than Re in the z-momentum equation. Hence it is assumed that Fr similarity, along with the geometric similarity, will ensure similarity of circulation. The ratio of the model to prototype Fr is 0.82, 0.86, and 0.90 for three cases respectively, in other words, the proportion of inertial force to gravity in the model is basically the same as that in the prototype. On the other hand, it should be noted that the geometric of the test bench is obtained on the basis of Reynolds similarity, that is, the Reynolds number of the prototype and the model is exactly the same.
For the free-surface vortex, the Weber number similarity should be considered also. In order to keep the effects of viscosity and surface tension small, the experimental conditions must be maintained above the critical values of Re and We [25,26]. Here, considering the surface tension of the free surface, neglecting the atmospheric pressure, the free-surface boundary condition is given as
where is the Laplace pressure. σ is the surface tension coefficient, and r1 and r2 are the principal radii of curvature of the surface. According to the relationships in Equation (1), Equation (4) becomes
where , . Weber number We is defined as [16]
The surface tension effects are negligible at the water intakes with a horizontal suction pipe when We > 370 [5]. The main nondimensional parameters affecting the internal flow in the present study are listed in Table 1.

Table 1.
Pump intake dimensionless parameters.
Besides, the cavitation numbers in the main pipe for case 1, 2, and 3 is 12, 10, and 33, respectively, i.e., the cavitation did not occur in there for all cases presented in this experiment.
Meanwhile, referencing the velocity components of the steady axisymmetric vortices [27,28,29,30], it can be normalized by Equation (1) as
where rm is the radius of the vortex core, a is an independent variable. In Equations (7)–(9), it can be found that the relative submergence and the relative water level influence the axial and tangential velocities. The submergence (critical water level) plays a significant role in the formation and evolution of the vortices in the underground pumping station.
2.2. Normalized Geometric Parameters of the Experimental Facility
The research object of this paper is the first large-scale underground pumping station in China (Wuhan Beihu Sewage Underground Pumping Station, which collects sewage by urban underground pipelines and discharges it to the next level after industrial purification treatment). In the underground pumping station of this paper, two pump intakes are utilized. Namely, a primary pump intake is mainly used to store water, and the secondary pump intake is mainly used to remove impurities from the water, including sand sediments, sludge, and other solid pollutants, especially in the sewage pumping station.
The operation of each pump set is determined by the upstream flow rate and other factors (such as water level in the primary pump intake and regular maintenance of pump set). The pumps can be used in a group or individually. The experimental model is obtained referring to the related regulations [31,32,33,34]. The geometric scale between the pump station and the model was finally decided as 10:1. The depth of the prototype primary pump intake of the underground pumping station was HP = 45.8 m, and the maximum flow rate of each pump set in the main pipeline was Qmax = 3.87 m3/s, thus giving the corresponding dimensionless as HP* = 32.25 and Qmax* = 774, respectively. The volume and height of the model primary pump intake of the test rig were 2.38 m3 and 1.8 m, respectively.
Combining the analysis of Section 2.1, the dimensionless geometric parameters of the experimental facility of the underground pumping station are shown in Table 2, normalized by the main pipe diameter.
Table 2.
Dimensionless geometric parameters of the experiment facility.
2.3. Experimental Facility
According to the design standards above, the experimental facility was designed and manufactured, as shown in Figure 3. To observe and record the various complex flow patterns inside the intake, 4 Polymethyl Methacrylate (PMMA) were sealed and fixed on the predesigned and retained stainless steel frame on the side wall 1 of the primary pump intake with flat head socket hexagon screws. In order to observe the flow patterns at the inlet and outlet of each pump, the inlet and outlet sections of pumps 1–3 (as shown in Figure 3a), and the outlet section of pump 4 were specially made of transparent pipes. To observe the complex flow pattern inside the secondary pump intake at the entrance of pump 4, the side wall 2 wes composed of PMMA, as shown in Figure 3c,d. An ultrasonic water level meter with accuracy to within 1.0% full scale (FS) was installed at the primary pump intake. The magnetic flow meter (1.0% FS) and the ultrasonic flow meters (1.5% FS) were installed at the outlet pipe of each pump to measure the flow rate from 0 to 90 m3/h. Considering the uncertainty of the experiment, the repeatability of each case was verified, i.e., duplicating each test to eliminate statistical errors due to instabilities of the test rig as much as possible.
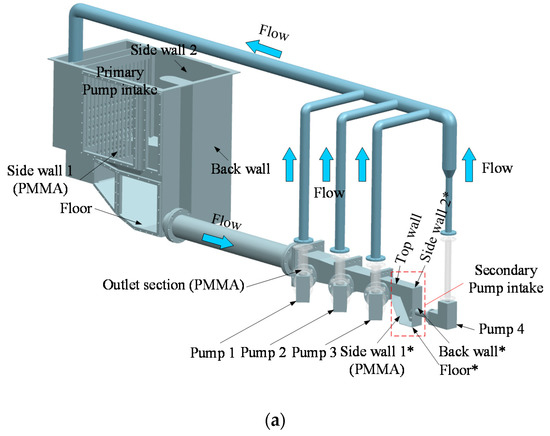
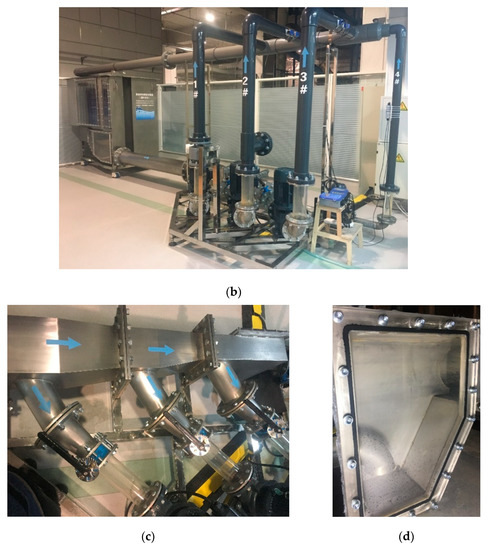
Figure 3.
The experimental facility. (a) 3D model (the asterisk indicates the secondary pump intake), (b) circulation loop, (c) connection between the branch and main pipes of pump 1–3, (d) secondary pump intake.
2.4. Experimental Process
More than ten cases were designed for convenience of comparison, and three cases were chosen to show the diversity of vortex types, referencing the operational conditions in practice. Therefore, at the high-water level, different Re cases (case 1 and 2) and low water level (case 3) were selected for comparison and comprehensive analysis, as shown in Table 3 (‘×3’ means the first, second, and third pumps are running, and ‘+1’ means the fourth pump is in operation). The experimental procedure is described as follows.
Table 3.
Operating conditions.
To initiate the experiments, water needed to be filled to the highest level of the working conditions, i.e., . Then the pumps were turned on in sequence with rotating speeds increasing slowly to reach the target water level. Then, g the rotating speed of the pump was regulated to obtain the interested flowrate. The flow patterns were recorded by a high-speed camera. The observations and measurements were performed when the flow rate and water level were stable for 20 minutes. The repeatability and frequency of related test phenomena were evaluated to minimize systematic errors. The water level was measured by both an infrared water level meter and a water level scale in the primary pump intake. The valve at the bottom of the secondary pump intake was then open to lower the water level to the case 3 ().
3. Results and Analysis
3.1. Classification of Free- and Sub-Surface Vortex
Based on the experimental results of this research, the following classification of free- and sub-surface vortex is proposed, as shown in Figure 4. In the evolution process of the free-surface vortex, with the increase of the turbulence of the free surface flow, the surface swirl becomes the surface dimple. Further, a dyeing vortex and vortex pulling floating trash without air occurs gradually in the intake with increasing intensity of swirl and intake pipe suction. Finally, the vortex pulling air bubble group forms when the free surface fluctuates violently, and the bubble group is rotating with a certain vertical circumference. On the other hand, when the free surface motion is not violent, vortex pulling serial air bubbles appear, and eventually, the full air core is pumped into the intake pipe, as shown in Figure 4a. For the sub-surface vortex, with the coupling of the swirl flow near the walls and the suction of the intake pipe, the sub-surface swirl flow develops into the dye vortex (define). Then, if the water contains air, the air bubbles group, and serial air bubbles are formed and sucked into the intake pipe gradually. Finally, due to the great suction, the air core is formed and pumped into the intake pipe, as shown in Figure 4b. It should be pointed out that the V-level free-surface vortex, the III- and IV-level submerged vortices are presented by a large number of experimental processes in this paper, which may be caused by the violent fluctuation of the water surface or the high air content of the fluid in the test.
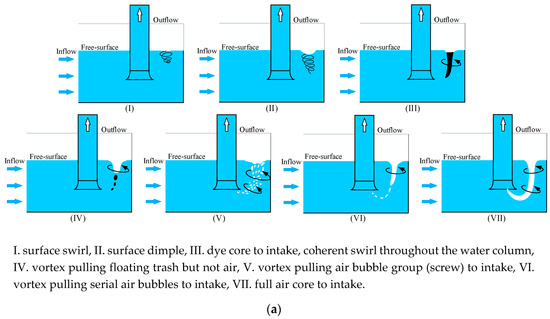
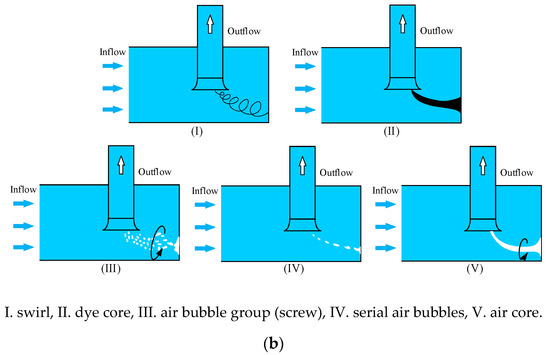
Figure 4.
Vortex classification. (a) Free-surface vortex. (b) sub-surface vortex.
3.2. Vortex Distribution Phase Diagram
According to the analysis in Section 2.1, the dimensionless parameters reflecting the water level, vortices formation, and flow in the pump intake of underground pumping stations are and Re, respectively. Therefore, in order to understand the appearance and evolution of the various vortices in the primary and secondary pump intakes of the underground pumping station under different cases, all vortices are presented in ~Re diagram (Figure 5). They are classified into free-surface vortices (7 levels) and sub-surface vortices (5 levels). The corresponding vortex patterns occurring in the primary and the secondary pump intake are drawn in Figure 5a,b, respectively. Note that high-level free-surface vortices and sub-surface vortices appear in the primary and secondary pump intake at low Reynolds number (Re = 1.43 × 10⁵) and low water level (). As the Reynolds number (Re = 4.01 × 10⁵) and water level () increase, the high-level free-surface vortices decreases, and the high-level sub-surface vortices still exist. When the water level remains unchanged, and the Reynolds number continues to increase (Re = 4.45 × 10⁵), high-level free-surface vortices and sub-surface vortices appear in the primary and secondary pump intakes. Such operating conditions should be avoided to reduce adverse consequences, e.g., pump efficiency decreases, cavitation and cavitation erosion, and accidental pump shutdown. The above three representative cases will be analyzed in detail below, and are marked in Figure 5. In addition, it should be highlighted that the research on the vortex distribution phase diagram has mainly been about the free-surface vortex to date, such as Anwar et al.’s [10] study, based on pipe intake experimental results; without a bellmouth, a variation of coefficient of discharge with circulation parameter was obtained, which can be used to predict the appearance of a free-vortex when the values of the nondimensional parameters, besides, the vortex region divided the strong vortex region and dimple region to estimate the free-vortex type roughly. Echavez and McCann [11] found that when the free-surface vortex or axial discharge is less than a certain value, the free-surface vortex discharge does not go entirely through the central pipe, and based on the experimental results, the limit values at which the flows separated was obtained. It can be found that once the limit is reached, an increase in axial discharge originates such that the depth of the air core augments rapidly until it reaches the bottom of the tank. Cristofano et al. [14] carried out an experiment and determined the free-surface vortex occurrence map. The results indicated that the No vortices (Stage 1 and Stage 1) Stage 2 transition zones were quite well defined, while the Stage 2 (gas entrainment transition zone) was characterized by some mismatches; this probably means that other dimensionless groups (Fr and We), which were not considered in the map, affected in a non-negligible way the physical dynamics of the gas entrainment phenomenon. Furthermore, in some cases, the high flow rate at inlets disturbed the water free surface, introducing oscillations and tiny waves that seem to have an inhibitory effect on the free-surface vortex intensification and the gas entrainment occurrence. But similar methods are seldom used in the research on the various vortices of the conventional pump station. Furthermore, there is no related reference in the research on the sub-surface vortex. Besides, similar investigation on the underground pumping station has not appeared. Therefore, compared with the study on the vortex flow patterns in a conventional pump station, based on the summary of relevant research and significant experimental experience, we have summarized the vortex distribution phase diagram and obtained Figure 5, in order to help the readers better understand the evolution of complex vortex flow patterns for different water level and Reynolds number in the underground pumping station, from a macro perspective.
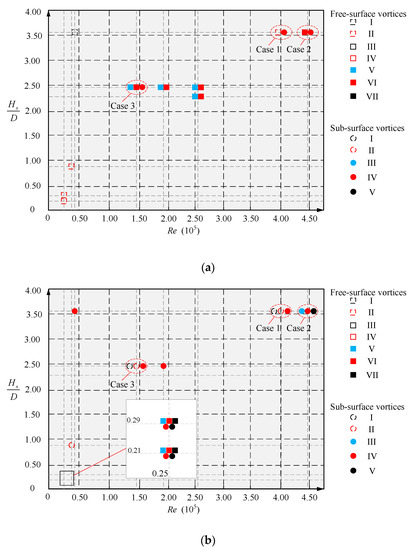
Figure 5.
Distributions of vortices in the pump intake of the underground pumping station. (a) Vortex patterns in the primary pump intake. (b) Vortex patterns in the secondary pump intake.
3.3. Case Study
3.3.1. Case 1: Re = 4.01 × 10⁵ and
In case 1, there was no free-surface vortex above level III in the primary pump intake, as shown in Figure 6. A level IV sub-surface vortex was formed under the top wall of the main pipe and the secondary pump intake. These gases mainly came from the dissolved gases in the water and the sub-surface vortex attached to the top wall, caused by the suction effect at the branch inlet of each pump. Due to the suction effect of pump 3, the intermittent suction vortex on the top wall was formed, as shown in Figure 6b. This vortex was sucked into the inlet of pump 3, which may lead to the deterioration of pump 3 performance, e.g., affecting the operation stability and even causing pump shutdown.
Figure 6.
The flow patterns in primary and secondary pump intakes for case 1. (a) No obvious vortices in the primary pump intake, (b) level IV sub-surface vortex in the vicinity of the inlet of pump 3 on the top wall of the secondary pump intake.
Figure 7 shows the evolution process of the sub-surface vortex generated in the primary pump intake for case 1. The vortex was sucked into the inlet of the branch pipe of pump 3. Due to the main pipe flow, the sub-surface vortex presented a ‘U’ shape along the flow direction. In Figure 7b,c, the ‘U’ shaped flow presented an up-and-down swing pattern parallel to the mainstream flow direction, which was mainly caused by the turbulent flow in the main pipe. After a period of time, due to the cascade effect of turbulence and viscous dissipation of fluid, the sub-surface vortex fractures and decomposed into a certain amount of interrupted vortex zones, as shown in Figure 7d.
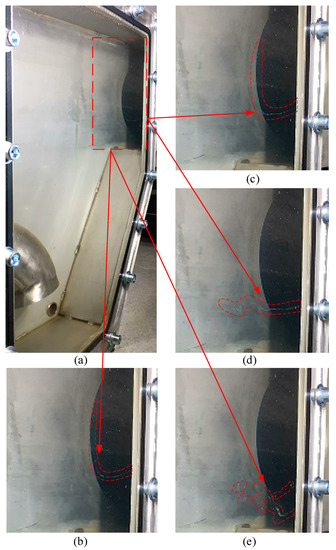
Figure 7.
The evolution process of the sub-surface vortex in the primary pump intake. (a) Pump 3 inlet, (b–e) sub-surface vortex sucked downstream to the inlet of pump 3.
3.3.2. Case 2: Re = 4.45 × 10⁵ and
The evolution of a free-surface vortex for case 2 in the primary pump intake is shown in Figure 8. Due to the centrifugal force, part of the air in the free-surface vortex rope was separated and formed into an air cluster independently. The preliminary process of the air cluster is illustrated in Figure 8a. The larger air clusters were then thrown out of the main vortex rope and disintegrated (as shown in Figure 8b,c). Finally, the separated air fragments were all sucked into the next installations along with the free-surface vortex rope (as shown in Figure 8d).
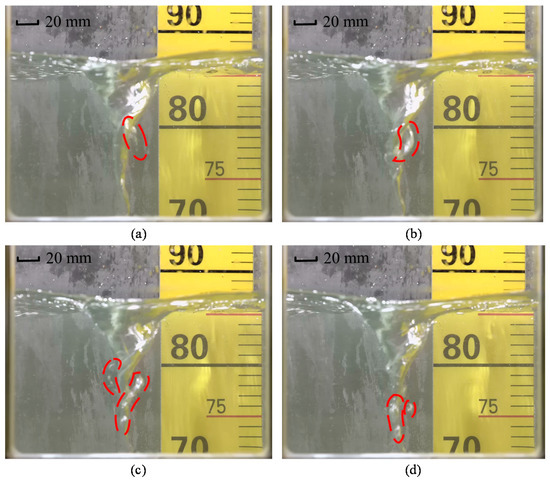
Figure 8.
The process of free-surface vortex shedding air cores under centrifugal force in the primary pump intake. (a) The preliminary process of the air cluster; (b,c) the larger air clusters were then thrown out of the main vortex rope and disintegrated; (d) the separated air fragments were all sucked into the next installations along with the free-surface vortex rope.
Based on the in-house code, the image recognition technology [33] is applied in the original experimental results; the identified experimental results (Figure 9b,d, and Figure 10b) were obtained in MATLAB. First, the real-time experimental results were compared with the background data (the water in the pump intake without pump running), and then the vortex area was extracted. Then, the threshold method (each pixel is given a gray value of 0–255 degrees for recognition) was used to further identify the vortex area and its contour.
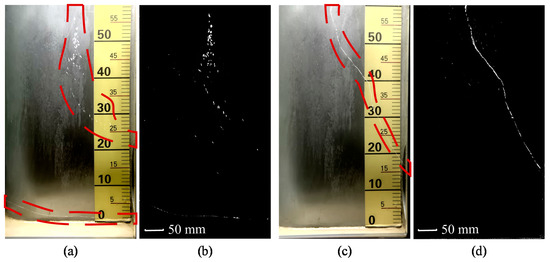
Figure 9.
(a,b) level V free-surface and level V sub-surface vortices original results and the related gray recognition results, (c,d) original level VII free-surface and related gray recognition results in the primary pump intake.
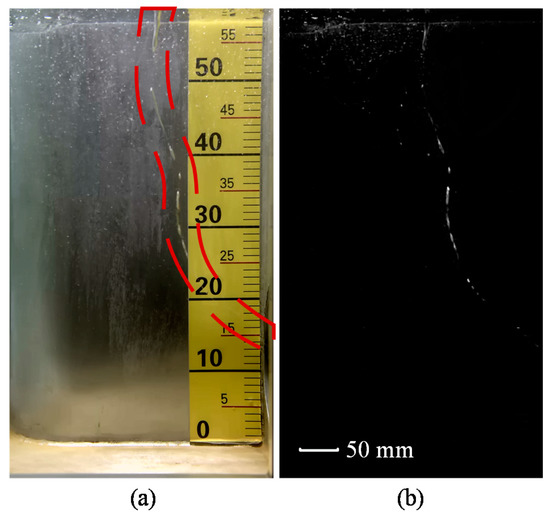
Figure 10.
(a) Original level VI free-surface vortices, and (b) the related gray recognition results in the primary pump intake.
The operating conditional difference between the cases 1 and 2 was that in case 2, pump 4 was open, and the water in the primary pump intake was subjected to a more intense suction effect. Therefore, the sub-surface vortex and free-surface vortex (screw) (Figure 9a,b) appeared in the primary pump intake. Due to the violent fluctuation of the free surface, these air bubbles on the free surface began to rotate around a certain axis and gathered (as shown in Figure 9a,b), some of them were sucked into the main pipe or the next pump inlet and may have affected the operational efficiency of the pump. Some of these bubbles were trapped into the secondary pump intake, coupled with the complex flow pattern, and then formed a variety of sub-surface vortices in the secondary pump intake. Figure 9a,b (there were both the sub-surface vortex and free-surface vortex and the sub-surface vortex attached to the side wall 2 of the primary pump intake) shows the sub-surface vortex formation process in the primary pump intake and Figure 7 describes one of the evolution processes after the sub-surface vortex was pumped downstream. Besides, level VII free-surface vortex was formed in the primary pump intake (Figure 10a,b), which was continuously suctioned into the main pipe and the next installations.
In case 2, since pump 4 was working, flow patterns were more complex in the secondary pump intake. The suction of pump 4 had influence, on top of the complex flow patterns in the primary pump intake that were carried by the main flow to the secondary pump intake. A large number of bubbles that coalesced near the top wall of the secondary pump intake were partly caused by the free-surface vortex in the primary pump intake. The sub-surface vortex in the primary pump intake was pumped to the secondary pump intake, and the vortex rope formed by its dissipative fracture. Some air bubbles may have occupied near the top wall of the secondary pump intake, and then been sucked into the pump 4. As shown in Figure 11a, the back wall attached vortex formed by the intake pipe due to the strong suction effect located in the middle and lower part of the back wall of the secondary pump intake. Figure 11b shows the intermittent suction vortex near the top wall of the secondary pump intake. As mentioned above, the formation of the cavity region on the top wall was mainly due to the gas in the water, various vortices carrying gas in the primary pump intake, cavitation (some cases), and the suction effect of the intake pipe. Figure 11c shows the phenomenon of spiral air bubbles being pumped into the intake pipe on the top wall of the secondary pump intake. These bubbles were mainly caused by the bubbles in the water and the free-surface vortex in the primary pump intake.
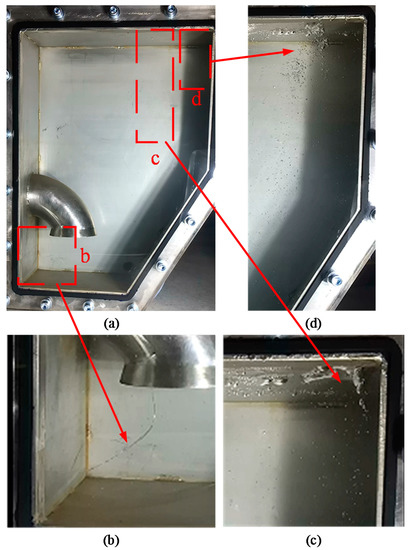
Figure 11.
Vortices in the secondary pump intake. (a) Vortex location, (b) back wall attached-vortex, (c) vortex pulling serial air bubbles from top wall to the secondary pump intake, (d) vortex pulling air bubble group (screw) from top wall to the secondary pump intake.
3.3.3. Case 3: Re = 1.43 × 10⁵ and
Compared with case 2, in case 3 the water level was decreased and the flow rate was increased. Intermittent free-surface vortex occured frequently in the primary pump intake. The vortex appeared parallel to the side wall of the primary pump intake, as shown in Figure 10a,b, which was intermittently suctioned into the main pipe and the next installations. Along with the strong suction effect of the main pipe, in this case, the air was pumped continually into the bottom of the vortex.
In this case, the flow rates of pumps 1–3 were increased significantly, and the flow rate of pump 4 connected to the secondary pump intake was stable. The flow pattern in the secondary pump intake was relatively stable compared with case 2, as can be seen from the evolution process of the flow pattern inside the secondary pump intake (Figure 12). A small bubble was formed on the top wall of the secondary pump intake, shown in Figure 12a. With the internal flow of the secondary pump intake, the bubbles moved randomly near the top wall. These bubbles converged to form a new bubble with a larger geometric radius. Due to surface tension and the internal pressure of the secondary pump intake, the sub-surface vortex showed an ellipsoidal shape with the long axis parallel to the top wall. Two large bubbles with the same geometric scale appeared, which were far away from each other, as shown in Figure 12. With further progress of internal flow in the secondary pump intake above, two large bubbles with a relatively long-distance moved in a spiral around an unfixed circle, and the distance between them became increasingly smaller (as shown in Figure 12c). Finally, the above two bubbles fused into a larger one, and this moved to a position near the secondary pump intake. At this time, due to its large volume and the suction effect of the intake pipe in the secondary pump intake, the bubble presented as a cone pattern, and the top of the cone gradually fell off andwas sucked into the intake pipe, as shown in Figure 12d.
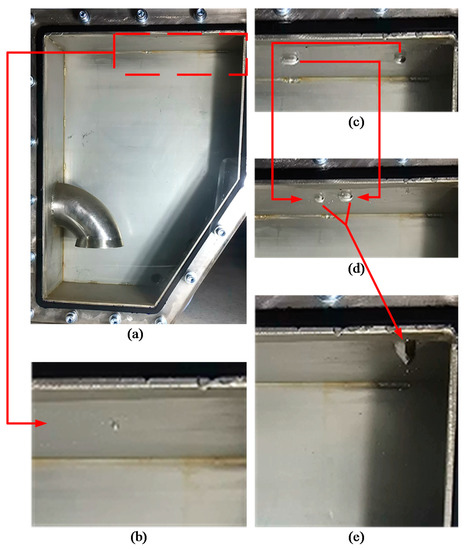
Figure 12.
Vortex in the secondary pump intake. (a) The observation area of the top wall of the secondary pump intake, (b–e) evolution of vortex pulling serial air bubbles on the top wall of the secondary pump intake.
3.4. Vortex Area Evolution Diagram
It is well known that the vortex volume (air volume) has a direct effect on the suction capacity on the inlet of the pump, i.e., it plays an important role in the performance of the pump [11,14]. Based on this consideration, the vortex volume is an important parameter, and it is of great significance to reveal the vortex volume of various vortices in the primary pump intake based on the variation of the projected area of the vortex, in the two-dimensional frame with time. Figure 13 shows the projected area of the vortex evolution in the primary pump intake of the underground pumping station, which is the projected area ratio of the free-surface vortex and sub-surface vortex in the background of the primary pump intake in the field of view, based on the image recognition technology [35]; where, the projected area ratio of vortex rope is the ratio of the captured area of the vortex rope to the area of the background, represented by A (%). The abscissa is the number of shooting frames, represented by N; here, the processed results are based on the results of continuous 30 s shooting (photographic speed 60 fps). From the perspective of the projected area of the vortex, the evolution of the ratio of the projected area of the free-surface vortex and the subsurface vortex in the primary pump intake under three different conditions can be quantitatively observed.
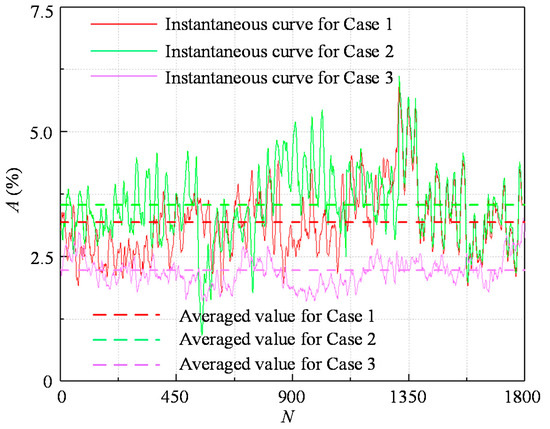
Figure 13.
Vortex area evolution in the pump intake of the underground pumping station.
For case 1, the vortex projected area was relatively low when N < 450, which means that the vortex was not fully formed, only an occasional number of bubbles were sucked into the main pipe, and then the free-surface vortex was gradually formed, a large number of bubbles, despite the full air core, were sucked into the main pipe. A similar situation occured for case 2, but the time moved back about 450–900 frames. In cases 1 and 2, especially when N = 1300, the peak value of A appeared, which indicated that the free-surface vortex and subsurface vortex were captured at the same time. Compared with the above two cases, the A value for case 3 was lower, which was mainly due to the lower occurrence of the sub-surface vortex. Besides, between the N = 900 and N = 1200, the free-surface vortex gradually transformed into serial air bubbles, or a very thin vortex rope, which led to the lower value of A. In Figure 13, the averaged value of the projected area ratio is the sum of the projected area of the vortex in each time and divides it by the number of shooting frames. The evolution vortex in each case can be reflected thoroughly, based on this point of view. All of the presented phenomena were consistent with the experimental results, which shows the validity and reliability of the analysis method.
4. Discussion
A number of recommendations can be given to the design and operation of an underground pumping station, based on the results of this research. Although for a lower Re (Re < 1.5 × 10⁵), a lower level free-surface vortex occurs, it is recommended to run at a higher water level if possible to eliminate the related vortices. It is also strongly suggested that underground pumping station should operate at a high-water level ( > 3.0) when 1.5 × 10⁵ < Re <3.0 × 10⁵. For high Re (Re > 4.0 × 10⁵), the application of vortex elimination devices should be considered when the water level cannot be raised infinitely. Moreover, it is recommended to refer to the relevant operation in the primary pump intake for the sewage pipe maintenance in the secondary pump intake (for example, shut down the pump and use a lower flow rate pump for relevant work to eliminate or reduce the vortices within pump intake).
On the other hand, for the underground pumping station engineering design, based on the experimental results of the present paper and our experimental experience, it is suggested that the sharp corner in the pump intake and the sharp edge of the supply pipe should be rounded of as much as possible, which mainly result in the undesirable flow patterns such as vibration, and stagnation in the actual operation of the underground pumping station, which may even lead it to be out of order.
5. Conclusions
The similarity theory of fluid mechanics was utilized to obtain the physical experimental model with the model ratio of 10:1. According to the different pipe structures of the pumping station, the quantitative and qualitative analysis of related flow patterns was carried out based on the Reynolds number Re and the relative submergence . The evolution process of various vortices in the primary and secondary pump intake of a typical underground pumping station were obtained. The various vortex patterns were classified into free-surface vortices (VII levels) and sub-surface vortices (V levels), through a large number of test results.
It was found by the experiments that: in case 1, there was no obvious free-surface vortex and sub-surface vortex in the primary pump intake. Due to the suction effect in the inlet of pump 3, the intermittent suction sub-surface vortex was formed near the top wall of the main pipe. In addition, the sub-surface vortex in the primary pump intake was pumped to the branch inlet. The sub-surface vortex presented a ‘U’ shape along the flow direction and finally fractures. For a larger flow rate, there was a free-surface intermittent suction vortex in the primary pump intake, and there were back wall vortex and air bubble group vortex in the secondary pump intake in case 2. These bad suction flow patterns directly caused the inflow conditions of related pump groups to get worse. In case 3 with the lower water level, multiple free-surface vortices appeared in the primary pump intake frequently, and the maximum tip depth reached 0.69d. At the same time, a large amount of air with strong rotation at the top of the tip was pumped into the main pipe in the form of bubbles. Due to the strong suction effect of the intake pipe in the secondary pump intake, the volume of the bubble began to increase. The bubble presented as a cone pattern and was pumped into the intake pipe intermittently. Furthermore, all kinds of vortex phenomena were marked in different dimensionless water level and Reynolds number maps, to connect and reveal the emergence and development evolution process of various vortices in the primary and secondary pump intake of the underground pumping station.
The experiment results show that the related design and operation criteria and dimensionless analysis of underground pumping stations proposed in this paper are effective and feasible. The free-surface and sub-surface vortices were observed, which had an important reference meaning for the analysis and suppression of vortex in future research. The next research will focus on the quantitative pump group performance and the evolution process of pump group performance along with the bad flow patterns. In addition, this model might have great potential to be implemented in the current design guidelines for the underground pumping station.
Author Contributions
Conceptualization, M.G., B.C., and H.Z.; methodology, M.G., S.L., and Z.Z.; validation, M.G., S.L., and Z.Z.; formal analysis, M.G., Z.Z., and D.L.; investigation, Z.Z. and S.L.; data curation, M.G., Z.Z., and S.L.; writing-original draft preparation, M.G., Z.Z., and S.L.; writing-review and editing, M.G. and Z.Z.; supervision, S.L. and Z.Z.; project administration, M.G., Z.Z., and S.L.; funding acquisition, M.G., Z.Z., S.L., and D.L. All authors have read and agreed to the published version of the manuscript.
Funding
This research was funded by the National Key R&D Program of China (2018YFB0606103), the National Natural Science Foundation of China (No.51876100, 51909132), and the Open Research Fund Program of State Key Laboratory of Hydroscience and Engineering (sklhse-2018-E-02).
Conflicts of Interest
The authors declare that they have no conflict of interest.
References
- Wongkaew, K.; Owyang, M.S. Seismic design of a gargantuan underground pump station. Tunn. Undergr. Space Technol. Inc. Trenchless Technol. Res. 2004, 19, 512. [Google Scholar]
- Mostkov, V.M.; Kubetskii, V.L. Underground pumping station. Hydrotech. Constr. 1997, 31, 528–532. [Google Scholar] [CrossRef]
- Hasan, A.N.; Twala, B. Improving single classifiers prediction accuracy for underground water pump station in a gold mine using ensemble techniques. In Proceedings of the IEEE EUROCON 2015—International Conference on Computer as a Tool (EUROCON), Salamanca, Spain, 8–11 September 2015. [Google Scholar]
- Samarajiva, P.; Gosain, N. Investigation and Failure Analysis of Deep Underground Sewage Pump Station; Structures Congress, ASCE: Orlando, FL, USA, 2010. [Google Scholar]
- Padmanabhan, M.; George, E.H. Scale effects in pump sump models. J. Hydraul. Eng. 1984, 110, 1540–1556. [Google Scholar] [CrossRef]
- Guo, M.; Tang, X.L.; Su, Y.W.; Wang, F.J.; Li, X.Q. Applications of three-dimensional LBM-LES combined model for pump intakes. Commun. Comput. Phys. 2018, 1, 104–122. [Google Scholar] [CrossRef]
- Yildirim, N.; Kocabas, F. Critical submergence for intakes in open channel flow. J. Hydrau. Eng. 1995, 121, 900–905. [Google Scholar] [CrossRef]
- Mansa, K.; Wu, Y.L.; Li, Y.; Li, X.; Xu, Y. Flow measurement in the model pump suction sump with baffle by means of LDV and PIV. J. Hydrol. Hydromech. 2003, 51, 138–143. [Google Scholar]
- Rajendran, V.P.; Patel, V.C. Measurement of vortices in a model pump-intake bay by PIV. J. Hydraul. Eng. 2000, 126, 322–334. [Google Scholar] [CrossRef]
- Anwar, H.O.; Weller, J.A.; Amphlett, M.B. Similarity of free-vortex at horizontal intake. J. Hydraul. Res. 1978, 16, 95–105. [Google Scholar] [CrossRef]
- Echavez, G.; McCann, E. An experimental study on the free surface vertical vortex. Exp. Fluids 2002, 33, 414–421. [Google Scholar] [CrossRef]
- Andersen, A.; Bohr, T.; Stenum, B.; Rasmussen, J.J.; Lautrup, B. Anatomy of a bathtub vortex. Phys. Rev. Lett. 2003, 91, 104502. [Google Scholar] [CrossRef]
- Choi, J.W.; Choi, Y.D.; Kim, C.G.; Lee, Y.H. Flow uniformity in a multi-intake pump sump model. J. Mech. Sci. Technol. 2010, 24, 1389–1400. [Google Scholar] [CrossRef]
- Cristofano, L.; Nobili, M.; Caruso, G. Experimental Study on Unstable Free Surface Vortices and Gas Entrainment Onset Conditions. Exp. Therm. Fluid. Sci. 2014, 42, 265–270. [Google Scholar] [CrossRef]
- Kim, C.G.; Kim, B.H.; Bang, B.H.; Lee, Y.H. Experimental and CFD Analysis for Prediction of Vortex and Swirl Angle in the Pump Sump Station Model. IOP Conference Ser. Mater. Sci. Eng. 2015, 72, 18–21. [Google Scholar] [CrossRef]
- Duarte, A. Experimental and Numerical Analyses of Water-Pump Intakes. Ph.D. Thesis, University of Hannover, Hannover, Germany, 2005. [Google Scholar]
- Eguchi, Y.; Tanaka, N. Experimental study on scale effect on gas entrainment at free surface. Nucl. Eng. Des. 1994, 146, 363–371. [Google Scholar] [CrossRef]
- Kilian, K.; Hellmann, D.H. Optimization of Approach Flow Conditions of Vertical Pumping System by Computational Analysis and Physical Model Investigation. In Proceedings of the ASME 2010 3rd Joint US-European Fluids Engineering Summer Meeting and 8th International Conference on Nanochannels, Microchannels, and Minichannels, Montreal, MO, Canada, 1–5 August 2010. [Google Scholar]
- Kirst, K.; Hellmann, D.H.; Kothe, B.; Springer, P. Physical Model Investigation of a Compact Waste Water Pumping Station. Int. J. Fluid Mach. Syst. 2010, 3, 285–291. [Google Scholar] [CrossRef]
- Wu, Y.Y. Characteristic analysis of rock mass quality surrounding underground plant cavern at pumping storage hudropower station. J. Eng. Geol. 2009, 17, 76–80. [Google Scholar]
- Chen, D.P.; Liu, L.P.; Zhao, L.X.; Zhang, Y. Stability Analysis of an Underground Pumping Station Group of China. Appl. Mech. Mater. 2017, 865, 403–408. [Google Scholar] [CrossRef]
- Hydraulic Institute. American National Standard for Pump Intake Design; ANSI-HI 9.8-1998 Pump Intake Design; Hydraulic Institute: Horsholm, Denmark, 1998. [Google Scholar]
- Knauss, J. Swirling Flow Problems at Intakes; A. A. Balkema: Rotterdam, Netherlands, 1987. [Google Scholar]
- Ansar, M. Experimental and Theoretical Studies of Pump-Approach Flow Distributions at Water Intakes. Ph.D. Thesis, The university of Iowa, owa City, IA, USA, 1997. [Google Scholar]
- Möller, G.; Detert, M.; Robert, M.B. Vortex-Induced Air Entrainment Rates at Intakes. J. Hydraul. Res. 2015, 141, 1–8. [Google Scholar] [CrossRef]
- Keller, J.; Möller, G.; Robert, M.B. PIV measurements of air-core intake vortices. Flow. Meas. Instrum. 2014, 40, 74–81. [Google Scholar] [CrossRef]
- Wu, J.Z.; Ma, H.Y.; Zhou, M.D. Vorticity and Vortex Dynamics; Springer: Berlin, Germany, 2007. [Google Scholar]
- Chen, Y.L.; Wu, C.; Ye, M.; Ju, X.M. Hydraulic characteristics of vertical vortex at hydraulic intakes. J. Hydrodyn. 2007, 19, 143–149. [Google Scholar] [CrossRef]
- Stepanyants, Y.A.; Yeoh, G.H. Stationary bathtub vortices and a critical regime of liquid discharge. J. Fluid Mech. 2008, 604, 77–98. [Google Scholar] [CrossRef]
- Odgaard, A.J. Free Surface Air Core Vortex. J. Hydraul. Eng. 1986, 112, 610–620. [Google Scholar] [CrossRef]
- The Ministry of Water Resource of People’s Republic of China. Specification for Normal Hydraulic Model Test; SL 155-2012; China Water & Power Press: Beijing, China, 2012. (In Chinese) [Google Scholar]
- The Ministry of Water Resource of People’s Republic of China. Design Code for Pumping Station; GB/T 50265-2010; China Planning Press: Beijing, China, 2011. (In Chinese) [Google Scholar]
- Shanghai Municipal Engineering Design Institute (Group) Co., LTD. Specification for Design of Drainage Pumping Station in Municipality; DGJ08-22-2003; China Architecture & Building Press: Beijing, China, 2003. (In Chinese) [Google Scholar]
- Japan Society of Mechanical Engineers. Standard Method for Model Testing the Performance of a Pump Sump; S004-1984; Japan Society of Mechanical Engineers: Tokyo, Japan, 1984. [Google Scholar]
- Zhang, H.C.; Zuo, Z.G.; Mørch, K.A.; Liu, S.H. Thermodynamic effects on Venturi cavitation characteristics. Phys. Fluids. 2019, 31, 097107. [Google Scholar]


© 2020 by the authors. Licensee MDPI, Basel, Switzerland. This article is an open access article distributed under the terms and conditions of the Creative Commons Attribution (CC BY) license (http://creativecommons.org/licenses/by/4.0/).