Article

Numerical Study of the Normal Impinging Water Jet at Different Impinging Height, Based on Wray–Agarwal Turbulence Model

1
State Key Laboratory of Water Resources and Hydropower Engineering Science, Wuhan University, Wuhan 430072, China
2
School of Aerospace and Mechanical Engineering/Flight College, Changzhou Institute of Technology, Changzhou 213032, China
3
College of Hydraulic Science and Engineering, Yangzhou University, Yangzhou 225009, China
4
Key Laboratory of Fluid and Power Machinery, Ministry of Education, School of Energy & Power Engineering, Xihua University, Chengdu 610039, China
*
Author to whom correspondence should be addressed.
Energies 2020, 13(7), 1744; https://doi.org/10.3390/en13071744
Submission received: 9 March 2020 / Revised: 31 March 2020 / Accepted: 3 April 2020 / Published: 5 April 2020
(This article belongs to the Special Issue Engineering Fluid Dynamics 2019-2020)

Abstract

:
As a kind of water jet technology with strong impinging force and simple structure, the submerged impinging water jet can produce strong scouring action on subaqueous sediments. In order to investigate the flow field characteristics and impinging pressure of submerged impinging water jets at different impinging heights, the Wray-Agarwal (W-A) turbulence model is used for calculation. The velocity distribution and flow field structure at different impinging heights (1 ≤ H/D ≤ 8), and the impinging pressure distribution at the impingement plate under different Reynolds numbers (11, 700 ≤ Re ≤ 35100) are studied. The results show that with the increase of the impinging height, the diffusion degree increases and the velocity decreases gradually when the jet reaches the impingement region. The fluid accelerates first and then decelerates near the stagnation point. The maximum impinging pressure and the impinging pressure coefficient decrease with the increase of the impinging height, but the effective impinging pressure range remains unchanged. In this paper, the distribution characteristics of the impinging pressure in the region of the impingement plate at different heights are clarified, which provides theoretical support for the prediction method of the impinging pressure.

1. Introduction

Impinging jets are widely used in many fields, such as waste treatment, irrigation and drainage, cooling and heating, chemical vapor deposition and so on. The flow characteristics of the impinging jet depend on the nozzle shape, the Reynolds number at the exit of the jet, the distance from the nozzle to the impingement plate, and the impinging angle (the angle between the center axis of the jet nozzle and the impingement plate), etc. In order to study the flow structure of impinging jet, domestic and foreign scholars have used hot wire anemometer, laser Doppler velocimeter, particle image velocimetry and other technologies for experimental research [1,2,3,4,5], and different turbulence models are also used for numerical calculation [6,7,8]. According to the impinging angle, the submerged water jet flow can be divided into vertical impinging jet (θ = 90° ) and oblique impinging jet (0° < θ < 90°). The impinging jet can be divided into three regions: free-jet region, impingement region and wall-jet region [9]. In the free-jet region, the flow characteristics are similar to that of the free jet. When the jet fluid moves towards the impingement plate, the surrounding fluid is sucked in and the overall velocity is attenuated; when the jet fluid approaches the impingement plate, the axial velocity decreases gradually, and the direction changes in the impingement region 1D to 2D away from the impingement plate. In the downstream of the impingement region, the jet fluid diffuses outward, almost parallel to the impingement plate; as the jet fluid exchanges momentum with the ambient fluid, the impinging jet eventually develops into a wall jet.
With the rapid development of computational fluid dynamics (CFD) technology, many scholars have applied CFD to solve complex problems encountered in engineering such as turbomachinery [10,11,12,13,14]. At the same time, some scholars have conducted a lot of research on vertical submerged impinging water jets through CFD. Chen et al. [15] studied the evolution mechanism and characteristics of the submerged laminar round jet in a viscous homogenous shallow water layer through computational modeling. In order to visualize the formation and evolution of the flow pattern, the volume of fluid (VOF) method was adopted, to simulate the free surface of the water layer below the air and to trace the jet fluid. The results show that the jet forms a class of quasi-two-dimensional (Q2D) vortex structures in the ambient fluid, with unequal influence from the bottom wall and free surface. Amamou et al. [16] computationally investigated a turbulent round jet issuing into a uniform counterflow stream. The simulation was carried out using the Reynolds stress model. Numerical results agree well with experimental results and the penetration and spreading of the jet are studied. Chen et al. [17] used a SIMPLE algorithm and RNG k-ε turbulence model to analyze the flow field of the plane jet in the semi-closed space with inclined impinging plate (θ = 30°, 60°, 90°), the results show that the change of impingement angle has a significant effect on the flow field structure. Guo et al. [18] studied the three-dimensional numerical simulation of the flow field of the oblique jet, by using the two turbulence models of k-ε and large eddy simulation, the results show that the large eddy simulation can accurately reveal the evolution process of the oblique submerged jet flow field and the shear and mixing mechanism of energy dissipation. Afroz et al. [19] presented the results of a numerical investigation of fluid flow and heat transfer due to a turbulent annular jet impingement on an isothermally heated flat surface. Annular impinging jets enhance the heat transfer and spread it more uniformly over the impingement surface compared to the round impinging jet, and have one noteworthy characteristic of forming a reverse stagnation flow. Huang et al. [20] used the numerical tool of arbitrary Lagrangian–Eulerian formulations to model the arc-curved jet impacting these different solid surface types, and a double/multiple-peaked pressure structure is observed for the cases of the water jet impacting the concave and convex solid surfaces. Stahl et al. [21] used large-eddy simulations to examine the primary flow phenomena for two adjacently placed round jets, with identical and dissimilar exit conditions, impinging on a ground plane. Particular emphasis was placed on the dynamics of the fountain flow between the jets, entrainment, vortex tube formation and acoustic feedback mechanisms. Battistin et al. [22] established a numerical model to describe the impinging water jet, and incorporated it into the solver to evaluate the model capability. After a careful verification, the proposed model is validated through comparisons with the similarity solution of the wedge impact with constant entry velocity. Singh et al. [23] numerically studied the flow characteristics of a turbulent offset jet impinging on a wavy wall surface. The variation in integral constant of momentum flux, wall shear stress, and pressure along the wall is presented and compared. Wienand et al. [24] made numerical results of a turbulent impinging jet on a flat plate, and four different jet-to-plate distances from H/D = 2 to 14 had been considered at a jet Reynolds number of 23,000. The results show the influence of the dimensionless distance of the first node near the wall on flow and heat transfer characteristics. In summary, the existing numerical studies on impinging jets are based on common commercial turbulence models.
In this paper, the W-A (Wray–Agarwal) turbulence model was used to calculate the submerged impinging jet at different impinging heights (1 ≤ H/D ≤ 8), and the influence of impinging heights on the vertical jet flow field was studied. In this study, a common circular jet was selected, and the jet was a fully-developed round jet.

2. Computational Model

2.1. Geometric Model and Boundary Conditions

The vertical jet fluid is sprayed into a square water tank through a round copper pipe perpendicular to the bottom wall surface, as shown in Figure 1. The jet fluid flows in from the copper pipe, and the inlet of the copper pipe is the Inlet surface; the outflow from the left and right side walls is the Outlet surface; the top surface of the water tank contacts with the air, which is the free surface; the other surfaces are the wall surface. D is the inner diameter of the copper pipe, which is selected as 20 mm. H is the vertical distance from the end face of the vertical jet nozzle to the bottom surface. In this paper, the impinging height H/D = 1–8 was set. As shown in the figure, in order to better describe the motion in the jet flow field, the intersection of the extension line of the nozzle axis and the impingement plate was taken as the origin of the coordinate system, and the rectangular coordinate system oxyz was established.
Setting of boundary conditions: (1) inlet: velocity inlet was adopted, and the velocity was evenly distributed, different inlet conditions are shown in Table 1; (2) outlet: pressure outlet, and the pressure value was set as 0 Pa; (3) free surface: the rigid-lid assumption was adopted, and the symmetrical surface was set; (4) wall surface: fixed wall surface with no slip; (5) reference pressure was set to 0 Pa.

2.2. Mesh Information

The calculation domain should be discretized before simulation. In this study, the whole calculation domain was divided into structural mesh by ICEM software, to shorten the calculating time. The total number of elements is 950,8963, which is near ten million. Due to the fact that the number of elements is rather large, the working capacity of the common computer, which has a CPU with 10 cores and RAM with 64G, has reached a limit. The greater the number of elements, the greater the calculation accuracy, therefore, it’s not necessary to prove the mesh independence for the model. The value of the mesh quality is greater than 0.67, which fully meets the need of calculation accuracy. Moreover, the time of every calculation case will last for 5–7 days under the premise that 8 cores are used. The mesh can be shown in Figure 2.

2.3. Wray–Agarwal Turbulence Model

The Wray–Agarwal (W-A) turbulence model is a single-equation model developed based on the k - ω turbulence model. Wray et al. [25] used Wray-Agarwal (W-A), SA and SST k-ω turbulence model to simulate several classical separation flows, and compared with the experimental results, it was found that the W-A model predicted the separation and reattachment characteristics of the boundary layer more accurately.
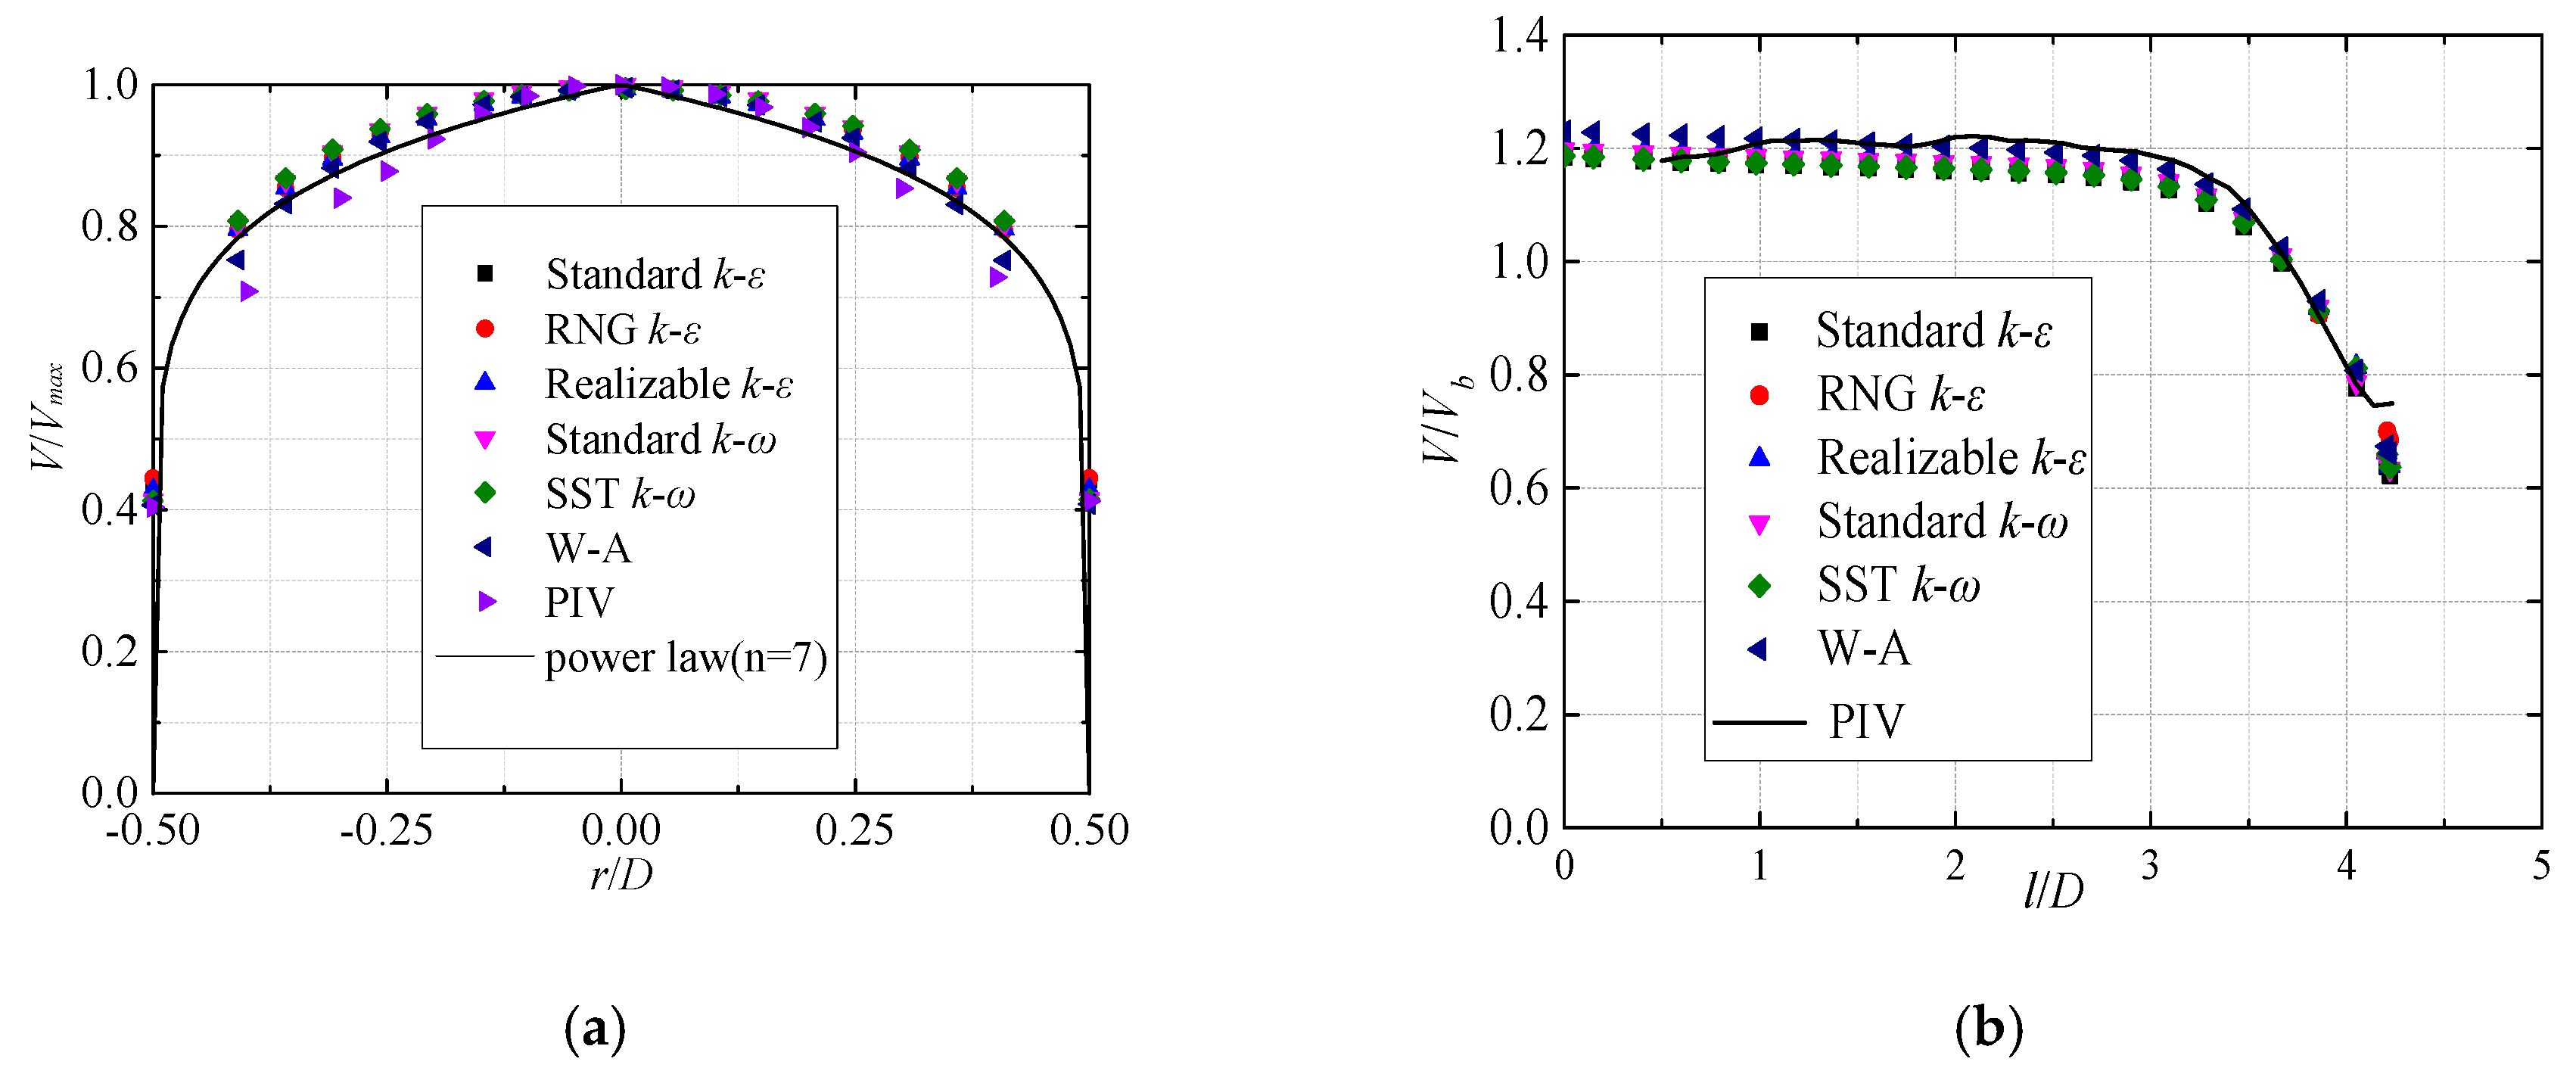
From our previous studies on the oblique impinging jet with the impinging angle of θ = 45° and impinging height of H/D = 3, the Wray-Agarwal, standard k-ε, RNG k-ε, realizable k-ε, standard k-ω, and SST k-ω turbulence models were used for numerical calculations, which were also compared with the experimental data of PIV.
Figure 3a shows the comparison between the numerical velocity V/Vmax with the empirical formula V/Vmax = (1−2r/D)1/n for the fully developed circular jet. Where, V is the velocity at any position of the jet exit; Vmax is the maximum velocity at the jet exit; Vb represents the bulk velocity at the jet exit, which can be defined as Vb = 4QD2 (Q is the flow rate of the jet); r represents the radial direction. When n = 7, the formula is considered to be approximately consistent with the fully developed velocity distribution of the circular jet [26]. It can be seen from the figure that the numerical results by applying different turbulence models are in good agreements with the empirical formula, indicating that the flow at the jet exit is a fully developed jet flow. Among them, the result calculated by the W-A turbulence model is closest to the empirical formula.
Figure 3b illustrates the axial velocity V/Vb in the centerline of the jet, with different turbulence models. It can be seen that the axial velocity remains basically unchanged in the free jet region (about 0 ≤ l/D ≤ 3), and decreases rapidly in the impinging region (about 3 < l/D ≤ 4.24). In the free jet region, the axial velocity calculated by the W-A turbulence model is greater than that by other models, and the velocity in the impinging region is approximately the same. In the initial stage of the free jet region (about 0 ≤ l/D ≤ 0.8), the experimental data are smaller than the calculation result with the W-A turbulence model, and the experimental data in the region (1 ≤ l/D ≤ 1.5) agree well with the calculation results. Finally, it is found that, compared with other turbulence models, the calculation results with the W-A turbulence model agree well with the experimental data.
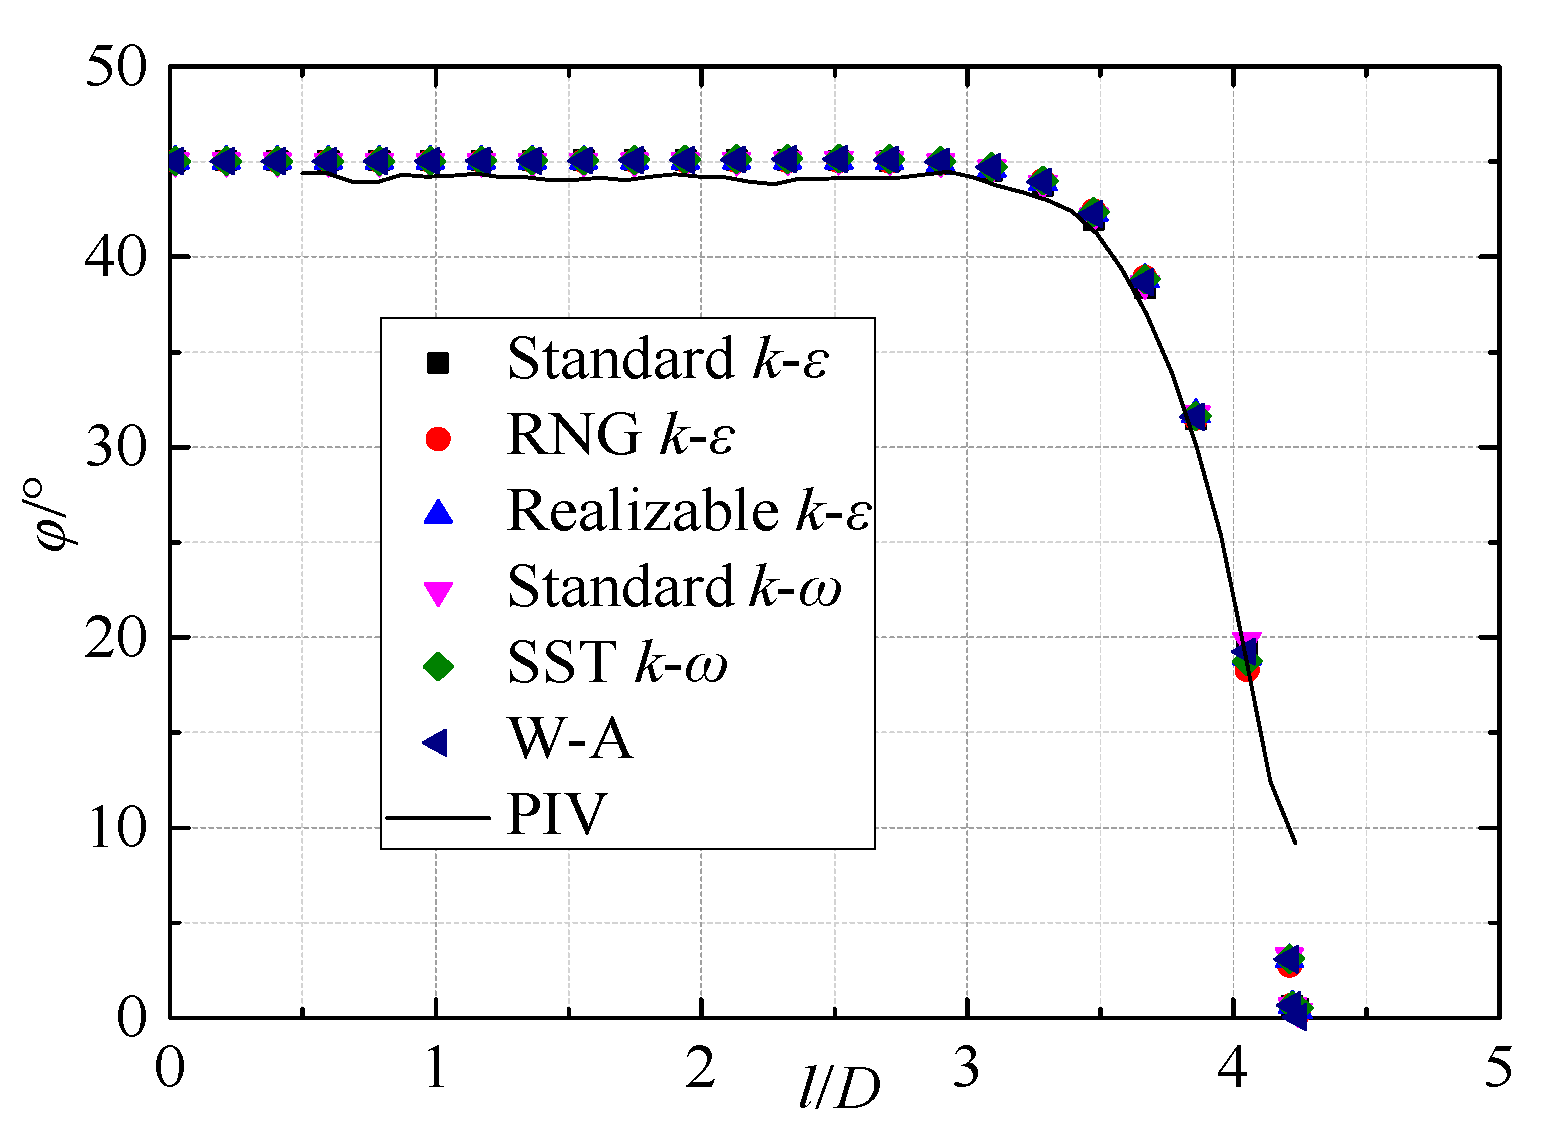
The flow angle φ of the impinging water jet, which is defined as φ = arctan (Vz/Vx), can represent the flow direction at any point in the middle section (oxz section) of the jet. Figure 4 shows the distribution of the flow angle on the centerline of the jet. In the free jet region (about 0 ≤ l/D ≤ 3), the flow angle is maintained at about 45 degrees, while it rapidly decreases to zero in the impinging region (about 3 < l/D ≤ 4.24). Except for the near-wall region, the flow angles calculated by different turbulence models are in good agreement with the experimental results.

3. Results and Discussion

3.1. Analysis of Vertical Submerged Jet Flow Field under Different Impinging Heights

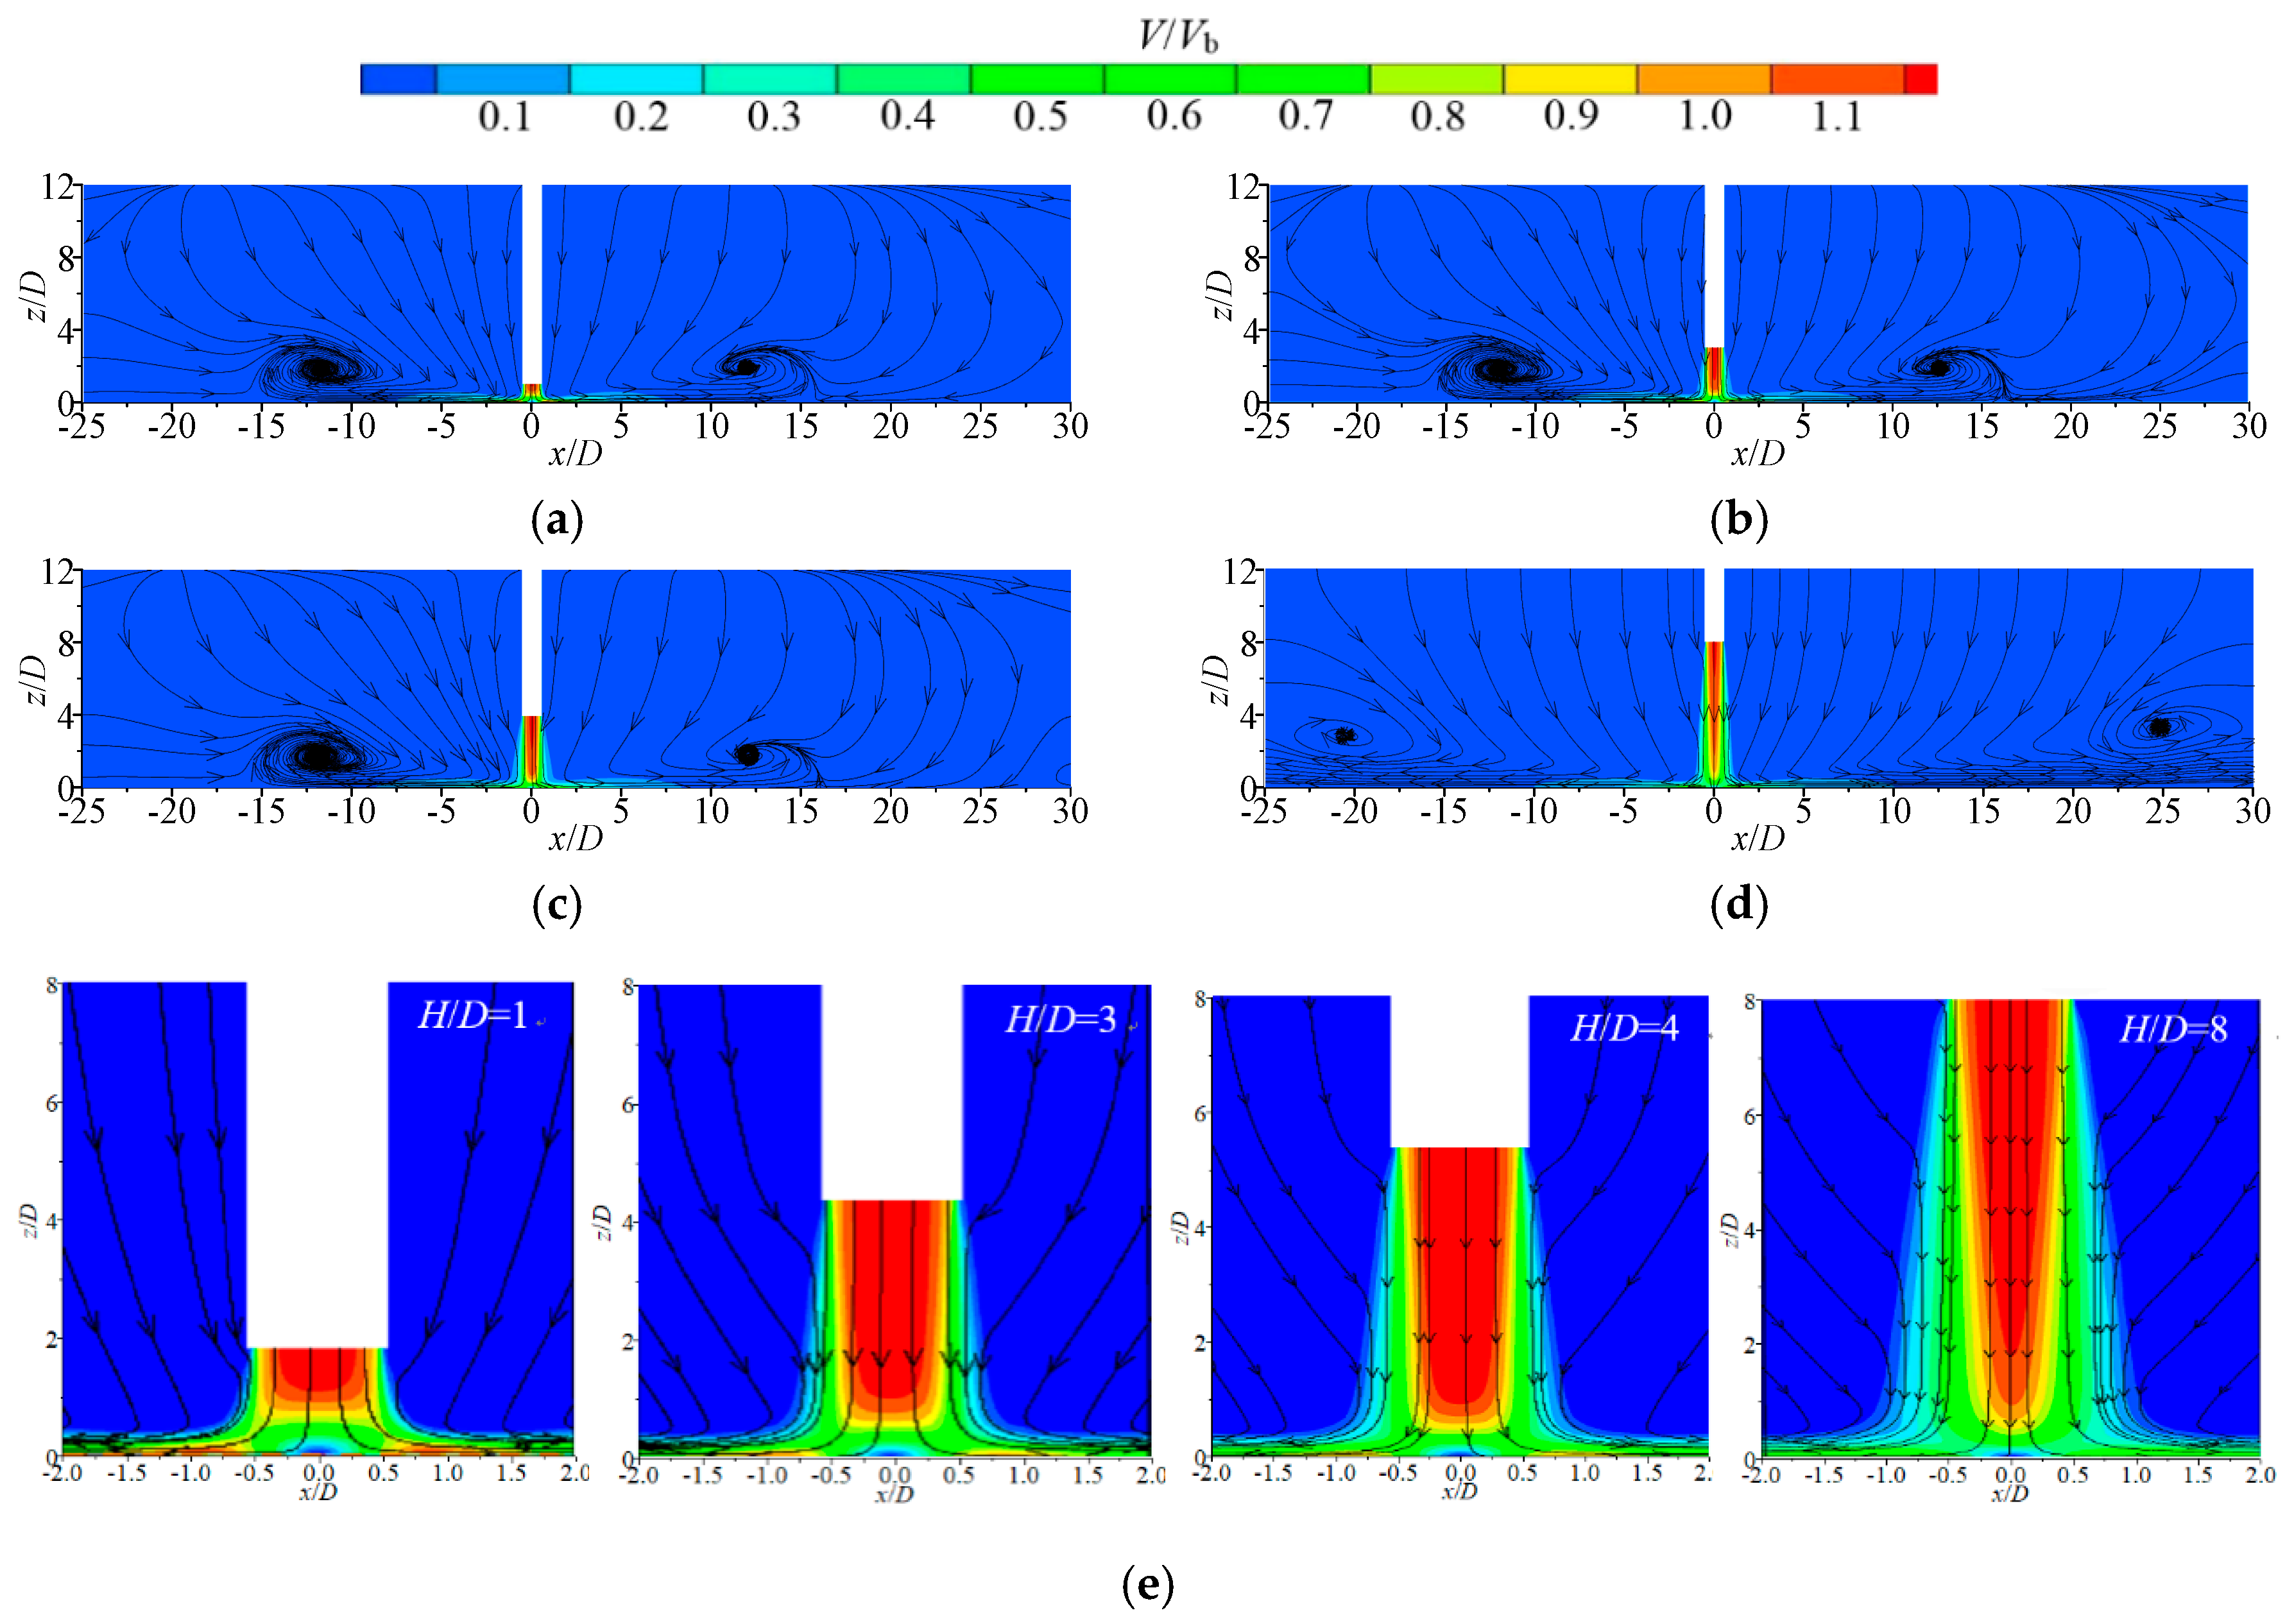
Figure 5 shows the mid-section (y/D = 0) V/Vb contour and streamline (Re = 35,100) of the jet at various impinging heights. When H/D = 1, a pair of vortices of similar size appear in the jet flow field; When H/D ≤ 3, the size of the vortex is almost unchanged; thereafter the range of influence of the vortex becomes larger as the impinging height increases. When H/D = 8, the vortex position is close to the left and right exit surfaces.
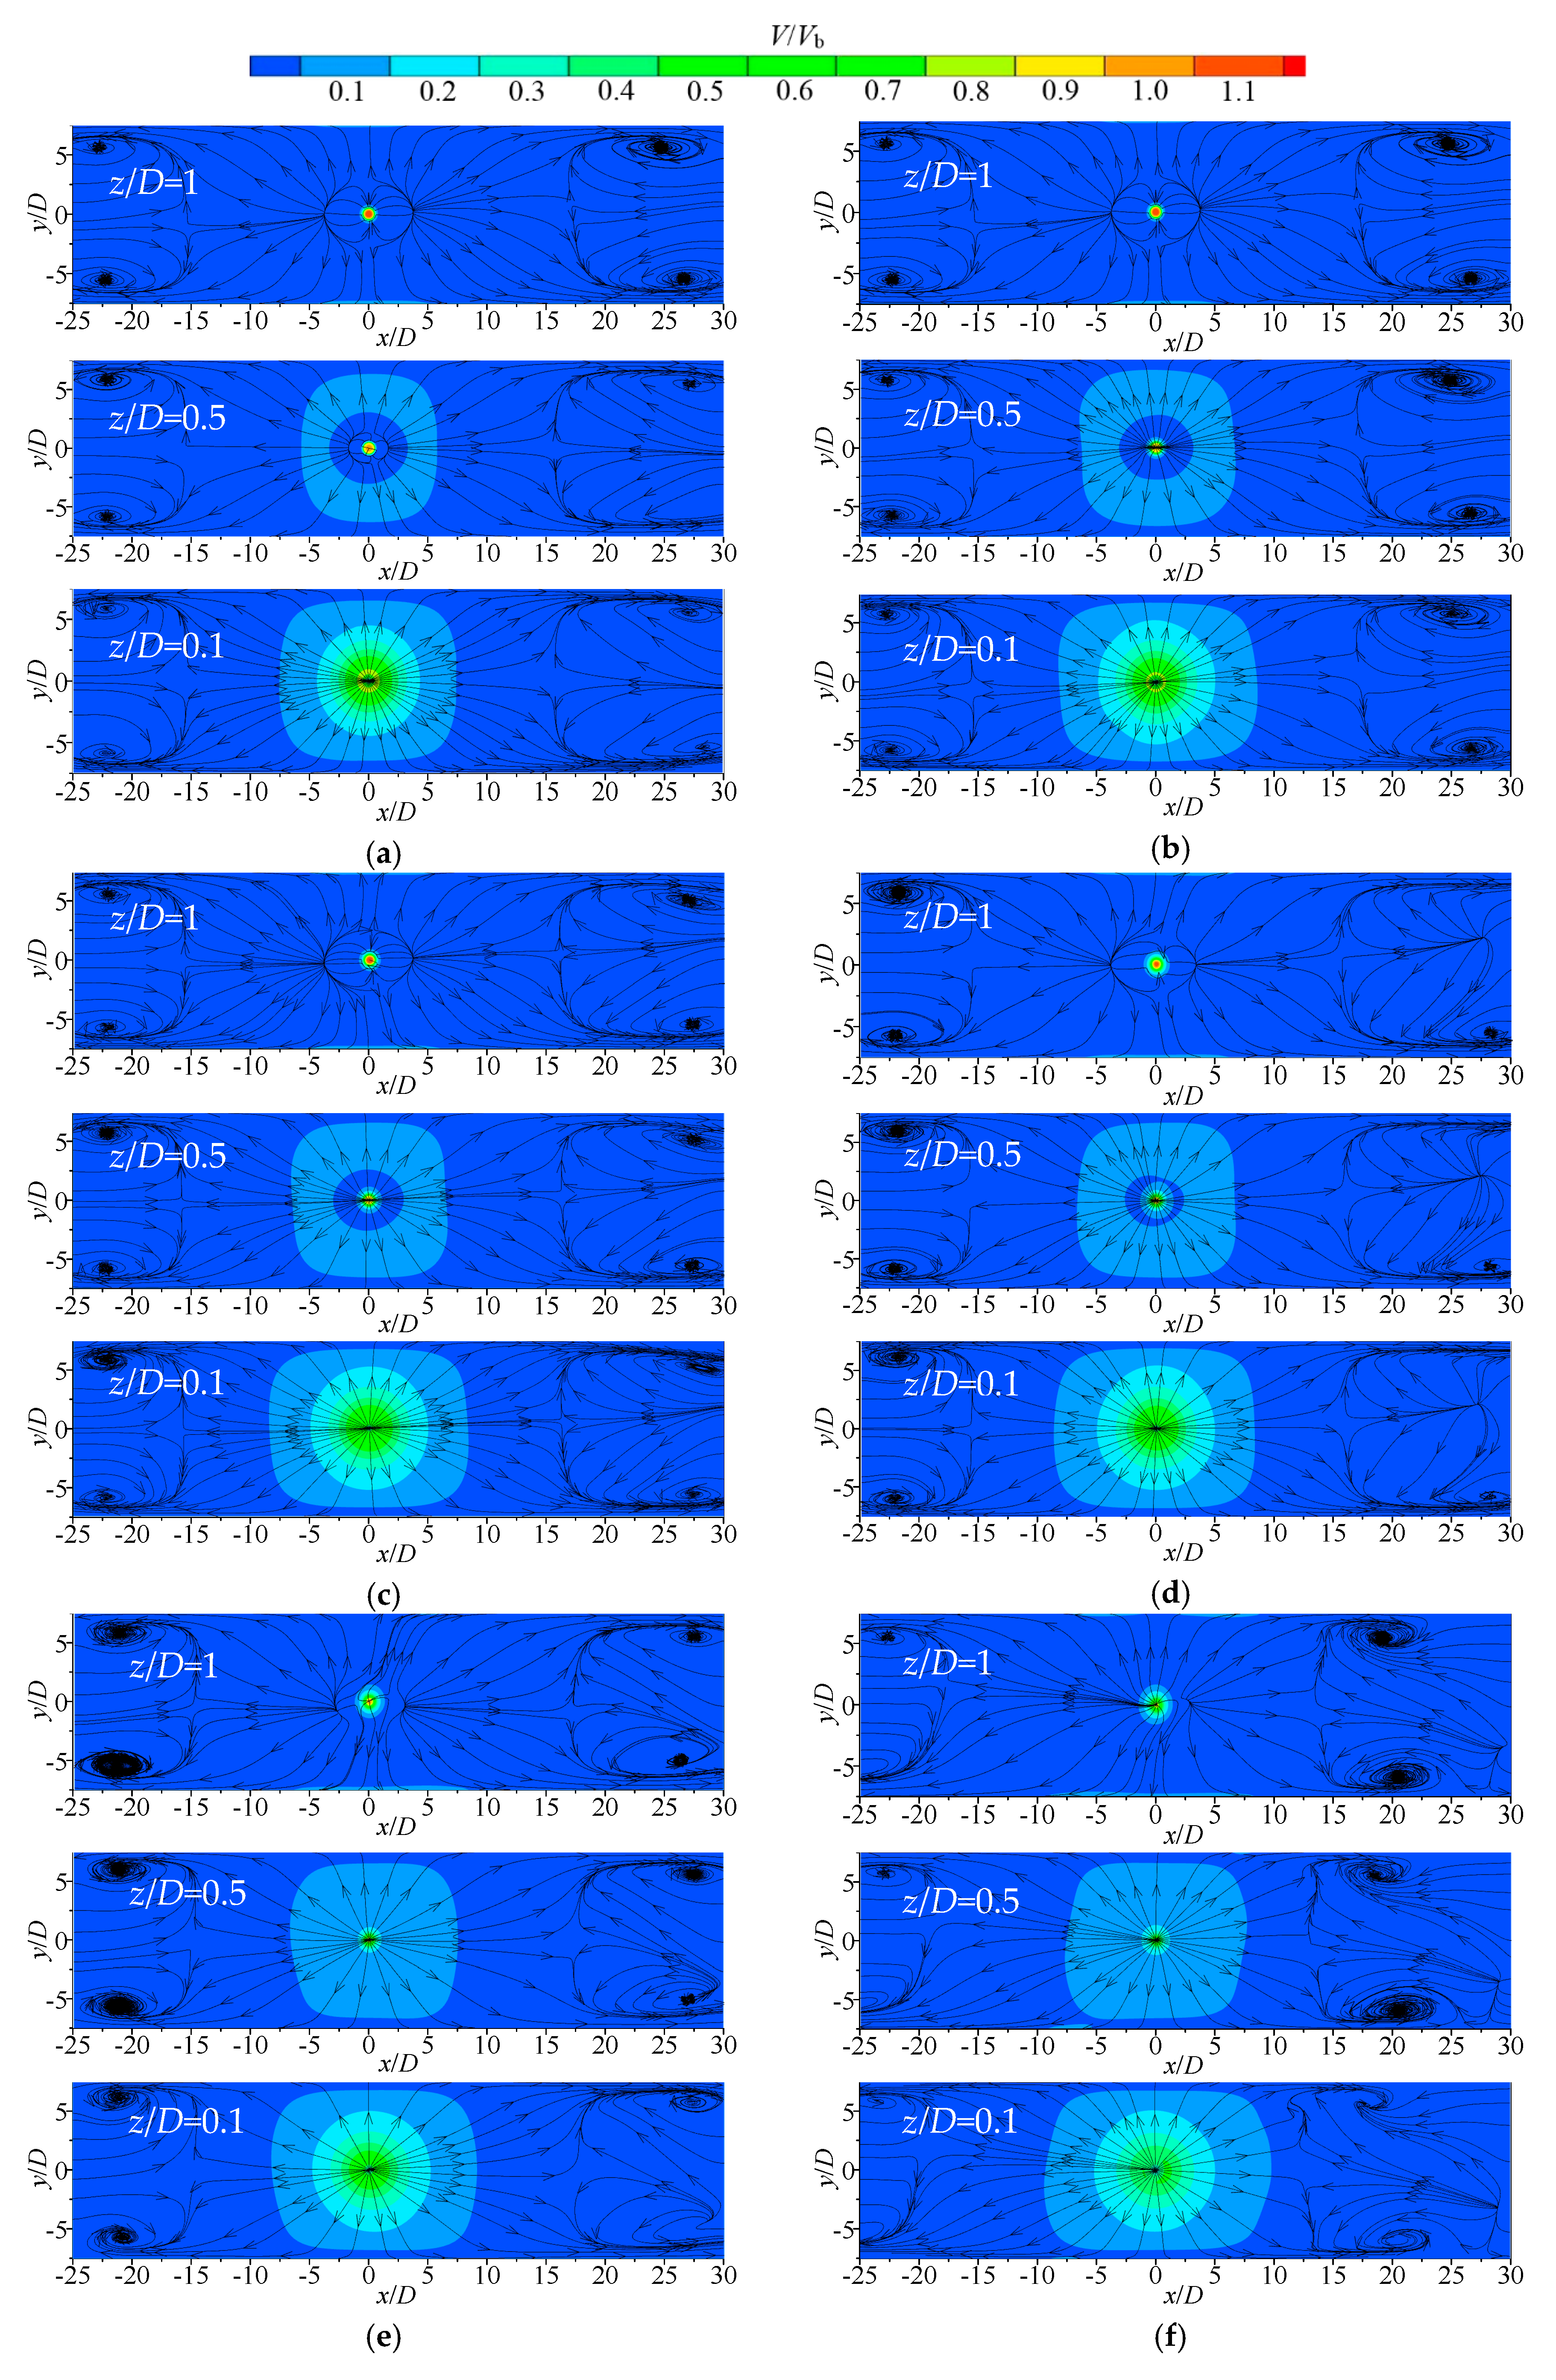
Figure 6 shows the cross section (z/D = 1, 0.5, 0.1) velocity V/Vb contour and streamline (Re = 35,100) of the jet at various impinging heights. When H/D = 1, the velocity contour and streamline of the jet have good symmetry with respect to the section in the jet; There are two pairs of vortices near the left and right exit of z/D = 1 section; At the z/D = 0.5 section, the jet velocity contour is distributed in a ring shape, and a ring with zero velocity appears. The outer boundary of the jet at the z/D = 0.5 section is affected by the front and rear wall surfaces, and the velocity contour is square outside and circular inside. With the increase of the impinging height, the area of the ring with a zero velocity at z/D = 0.5 gradually decreases, indicating that the thickness of the jet from the impingement region to the wall-jet region gradually increases. It can be seen from the figure that the velocity distribution and streamline of the jet at different heights at the section with z/D = 0.1 are similar.
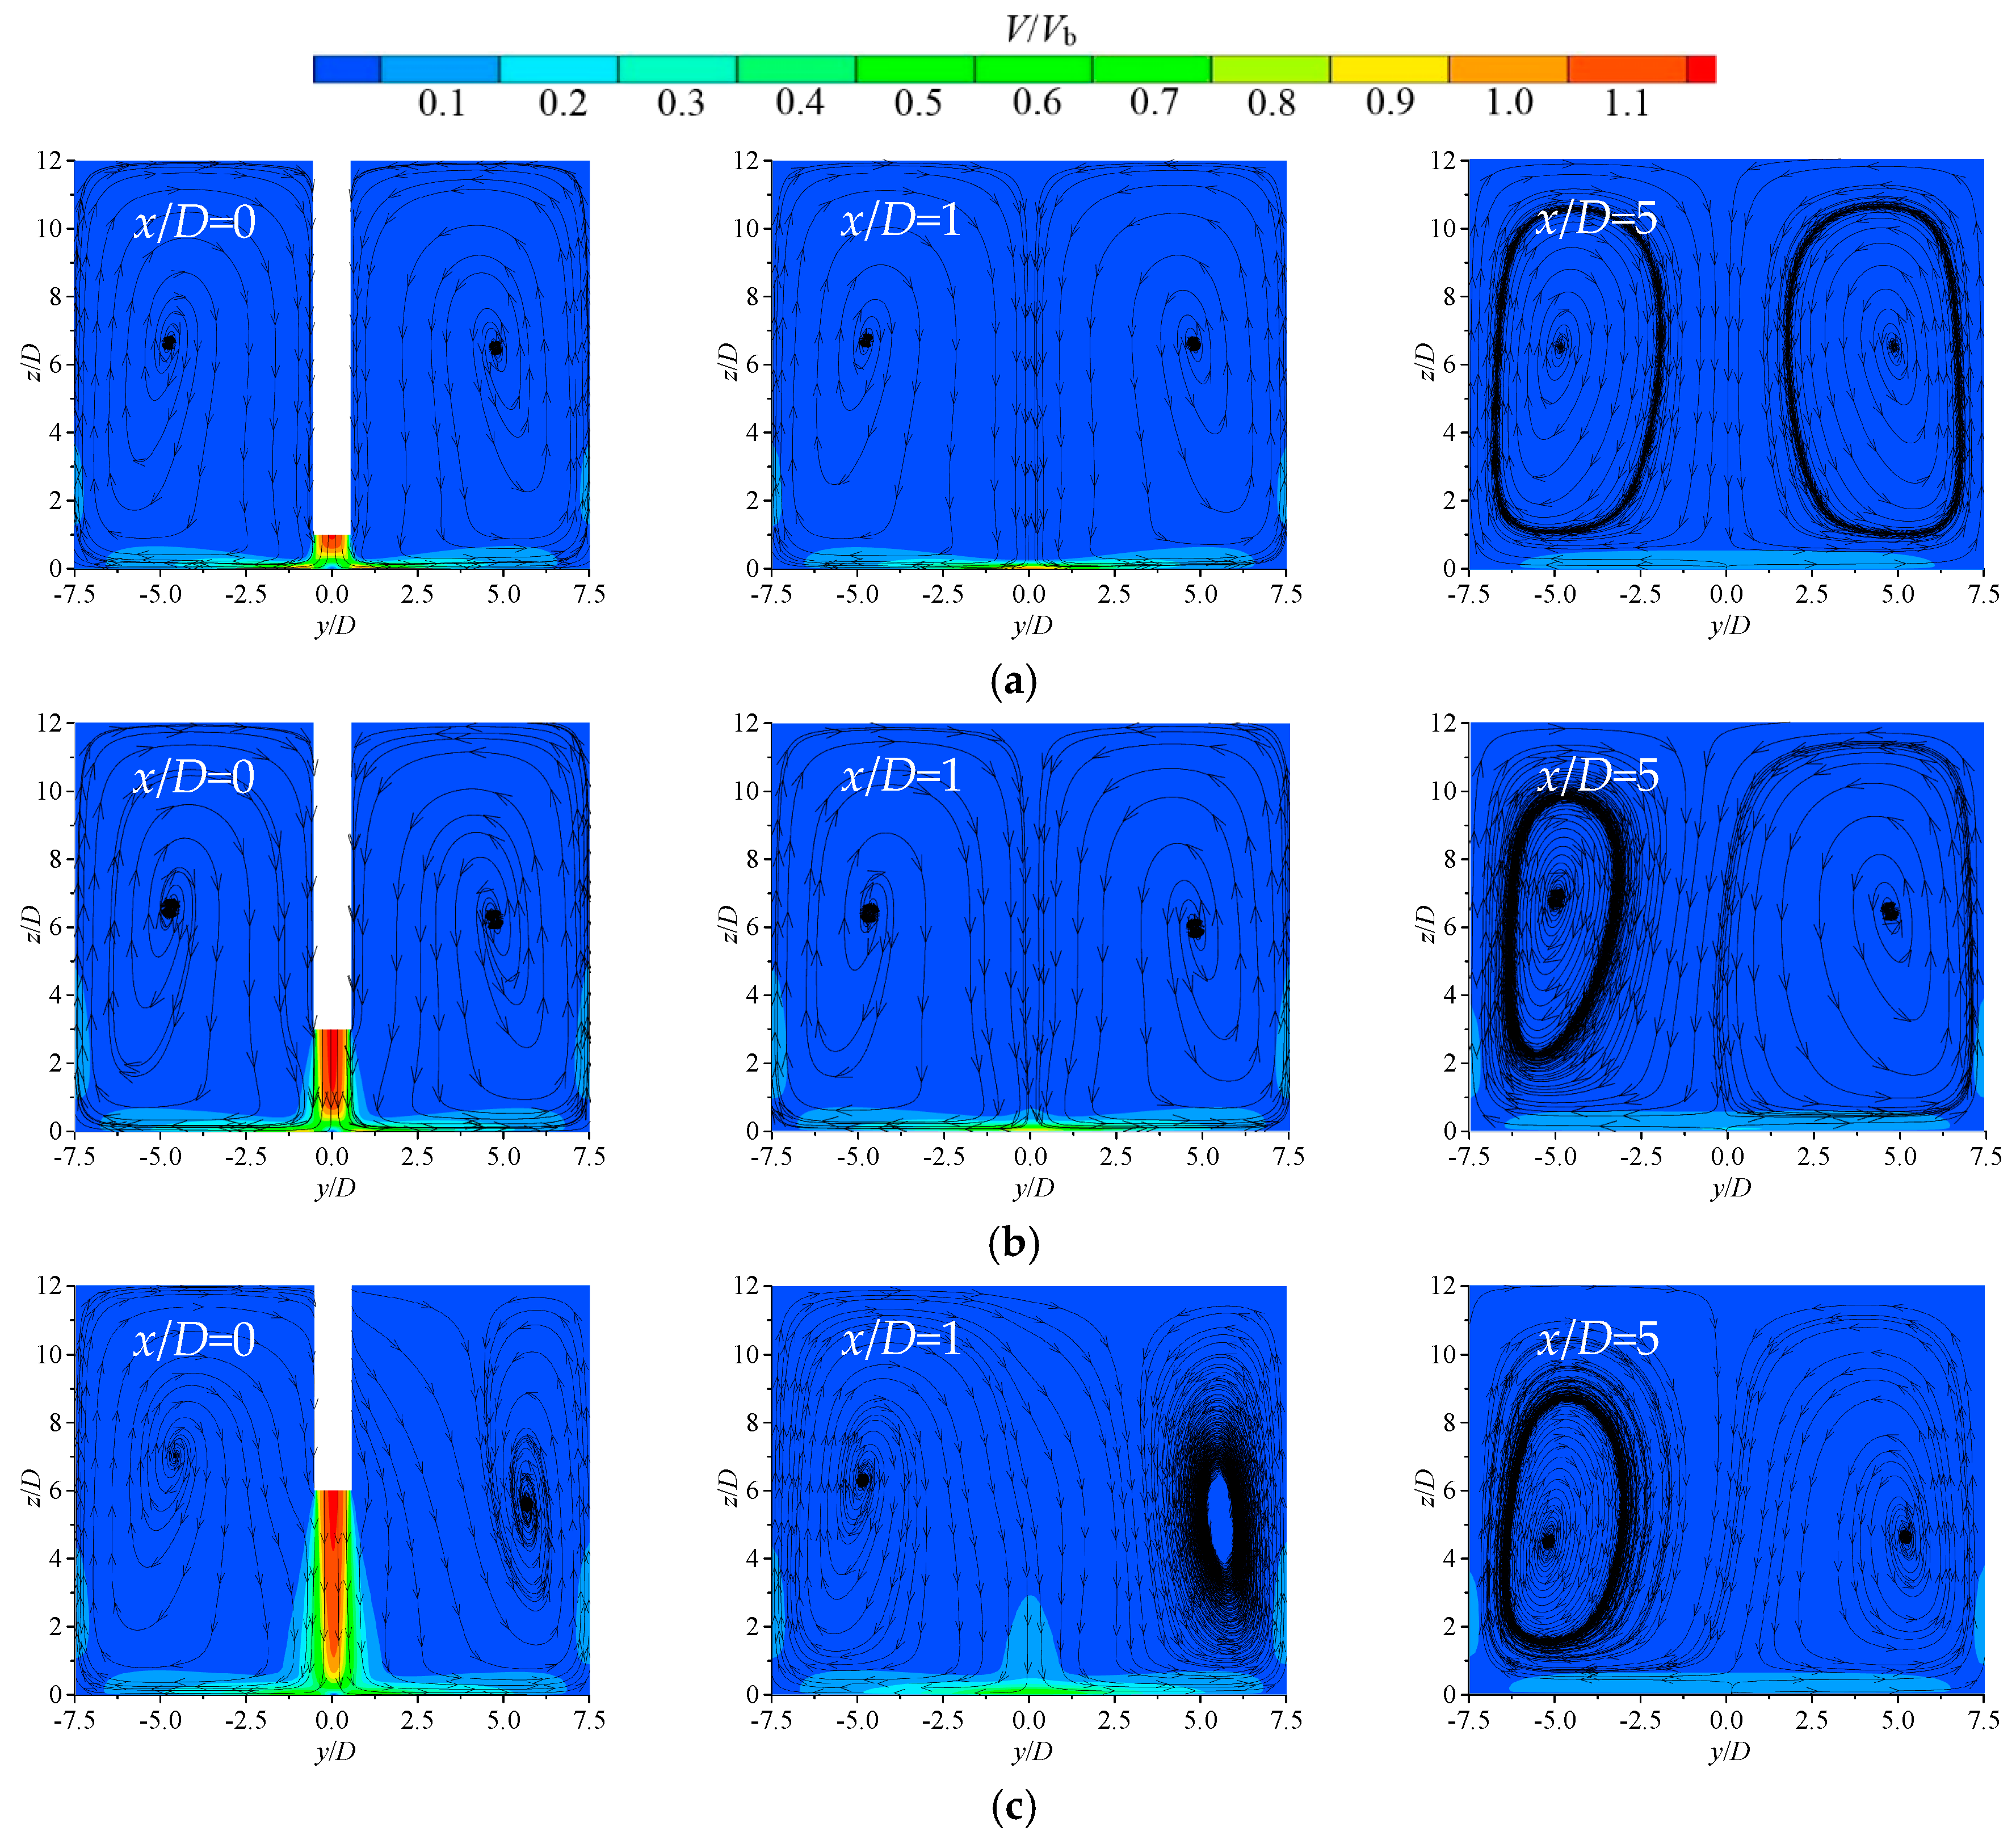
Figure 7 shows the vertical cross section (x/D = 0, 1, 5) velocity V/Vb contour and streamline (Re = 35100) of the jet at various impinging heights. The contour of V/Vb in the vertical cross section can reflect the lateral (y-direction) diffusion of the wall-jet region, and the streamline can reflect the development of vortex. When H/D = 1, the thickness of the wall jet increases as x increases; on the x/D = 0 section near the two side wall surfaces, a pair of vortices are generated symmetrically; the thickness of the wall jet decreases first and then increases. When H/D = 3, the thickness of the wall jet increases and the vortex size is almost the same at the vertical cross section of the jet at the same position. When H/D = 6, the vortex is asymmetric in the flow field.
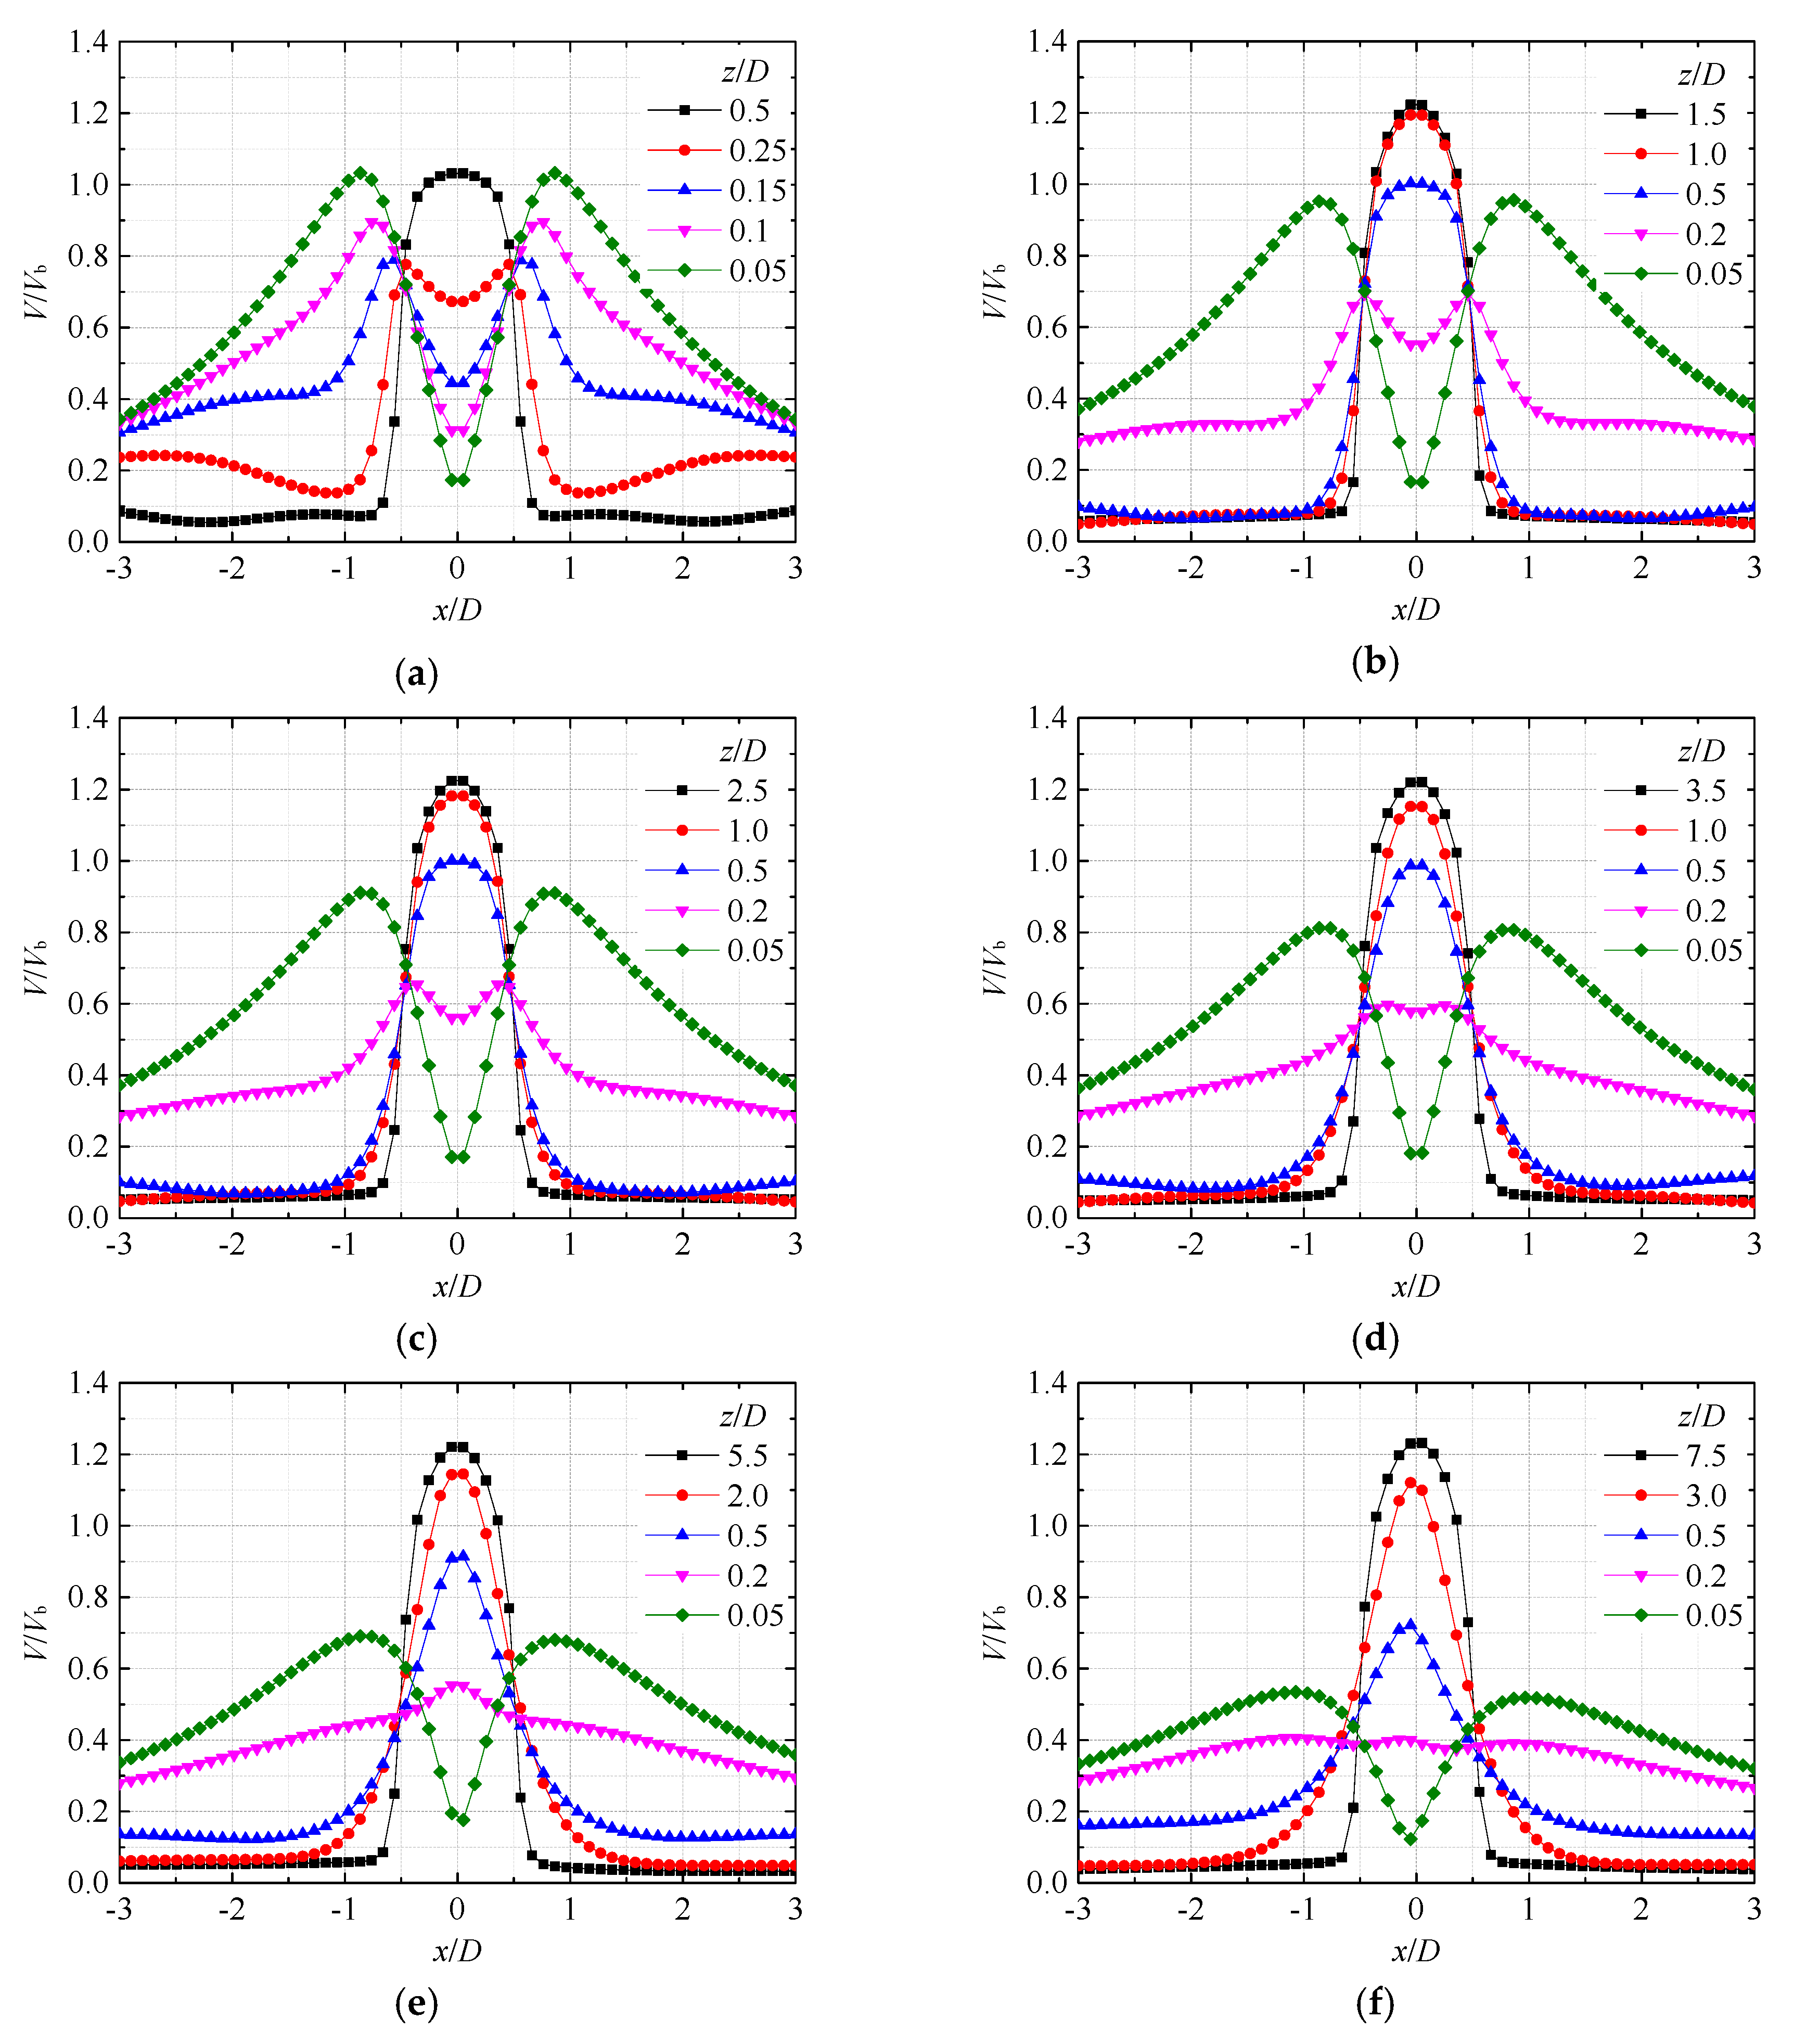
Figure 8 shows the radial distribution of the axial velocity V/Vb of the jet at various impinging heights (Re = 35,100). When H/D = 1, the velocity distribution has a good symmetry; when z/D ≤ 0.25, the jet velocity presents a double hump distribution, and two velocity peaks are observed at different x values; with the decrease of z, the velocity on the axis decreases gradually, but the velocity peak increases gradually. When H/D = 2, the velocity distribution remains the same in the region of 1 ≤ z/D ≤ 1.5, and the jet is in the core region. With the increase of the impinging height, the range of the jet core region gradually increased, and the position of the double hump velocity near the impingement plate gradually.
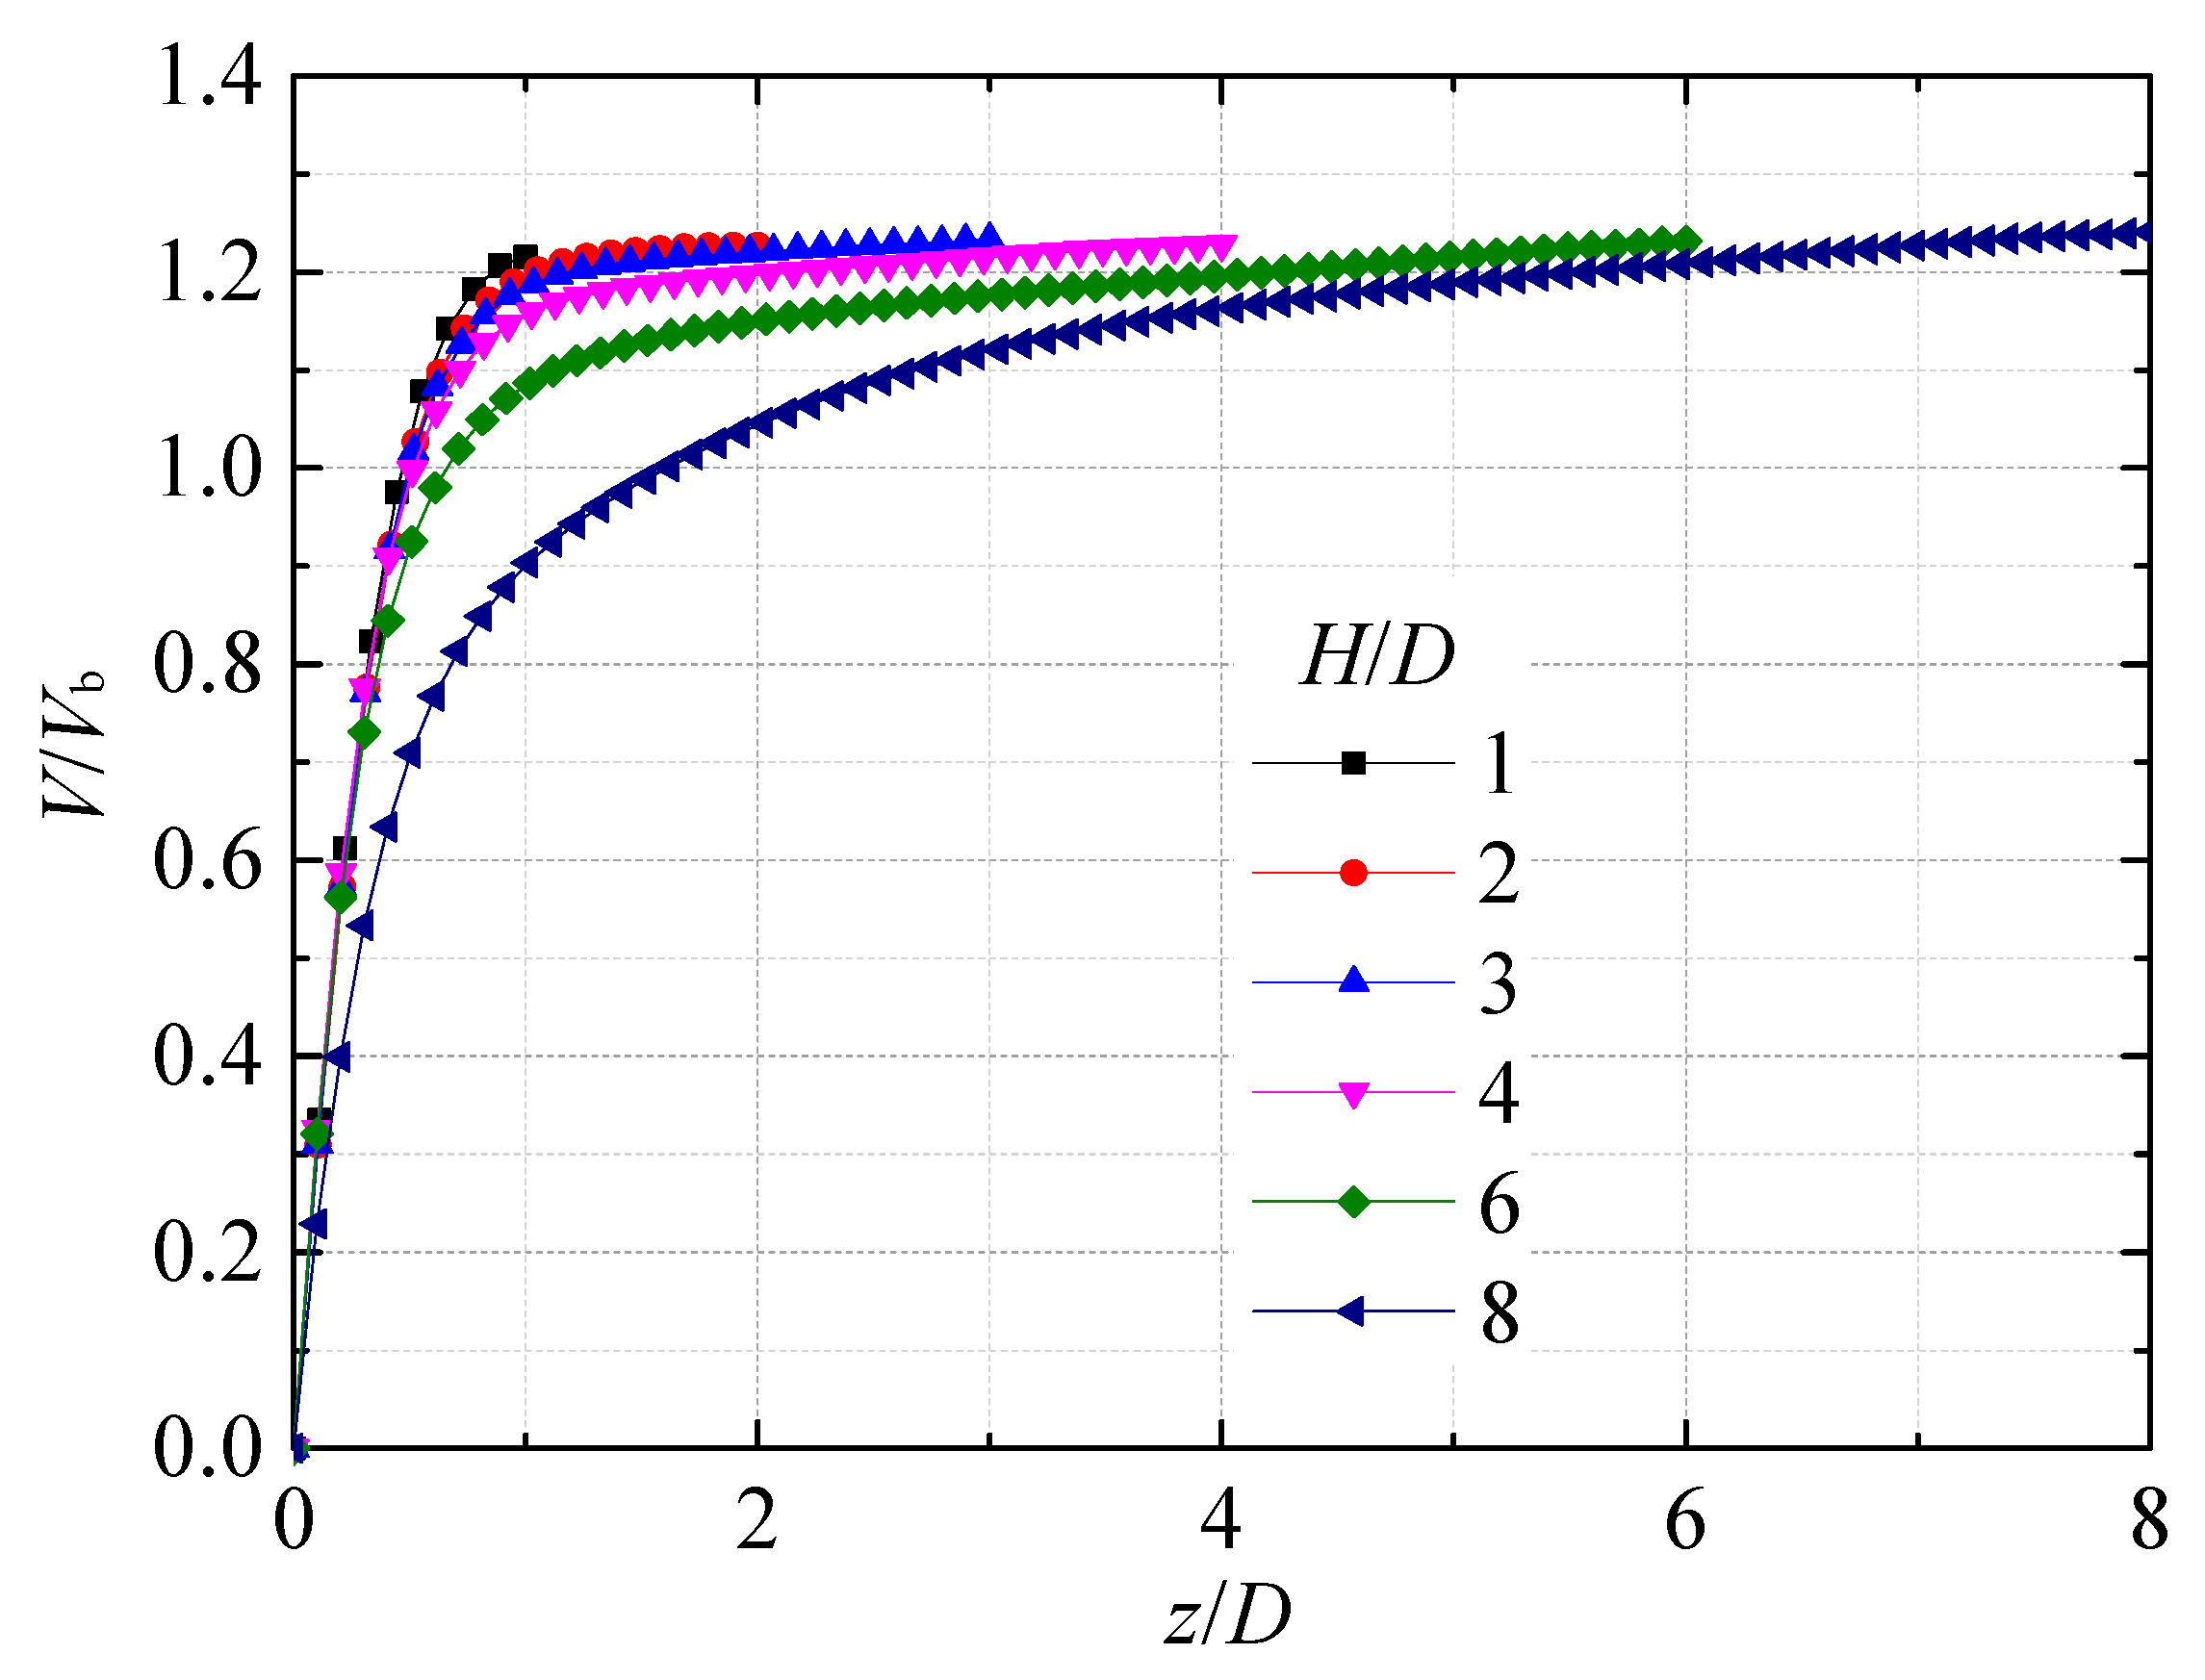
Figure 9 shows the velocity V/Vb distribution along the jet centerline (Re = 35,100). It can be seen that the velocity in the core region of the jet remains almost unchanged, and the velocity in the impinging region decreases rapidly. The height of the impinging region is about 1D, and the velocity on the impingement plate is 0. When H/D ≥ 6, the jet has a transition zone, and the velocity decreases when the fluid reaches the impinging region.
Figure 10 and Figure 11 show the dimensionless horizontal velocity component and vertical velocity component distributions at different x positions (Re = 35,100). It can be seen from Figure 9 that when H/D = 1, the horizontal velocity component reaches a maximum value at x/D = 0.8, which is about 1.05; when H/D = 3, the maximum horizontal velocity component is about 0.95. When H/D = 6, the horizontal velocity component reaches the maximum value at x/D = 1, which is about 0.72. As shown in Figure 10, as x increases, the vertical velocity component gradually decreases.
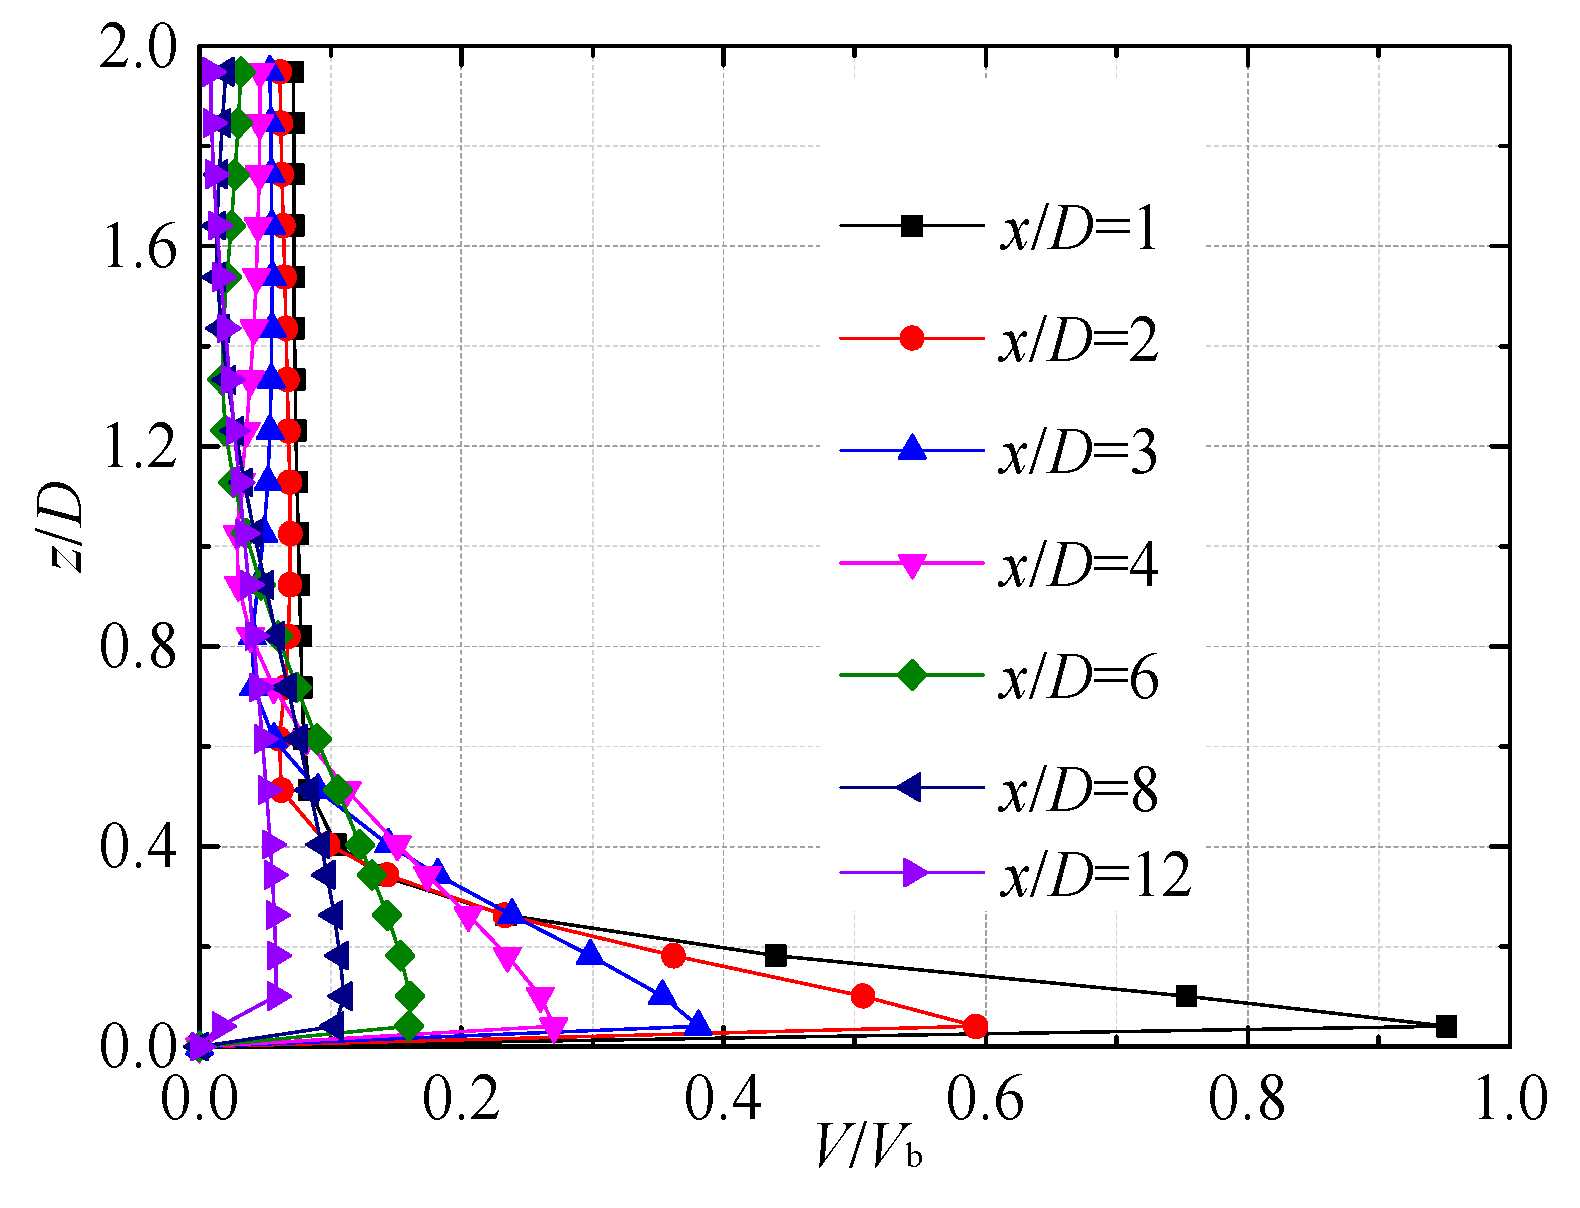
Figure 12 shows the axial distribution of the average velocity V/Vb at different x positions (H/D = 3, Re = 35,100). It can be seen that, with the development of the wall jet, the local maximum velocity decreases gradually, and the thickness of the wall jet increases gradually. Figure 13 shows the maximum velocity Vm/Vb distribution of the wall jet in the forward flow direction (Re = 35,100). As shown in the figure, when H/D ≤ 8, there is a large difference in the value of Vm/Vb at different impinging heights in the region of x/D ≤ 2, and a small difference in the region of x/D > 2, and the fitting formula Vm/Vb = (x/D)−1 is very consistent.

3.2. Time-Averaged Impinging Pressure Distribution

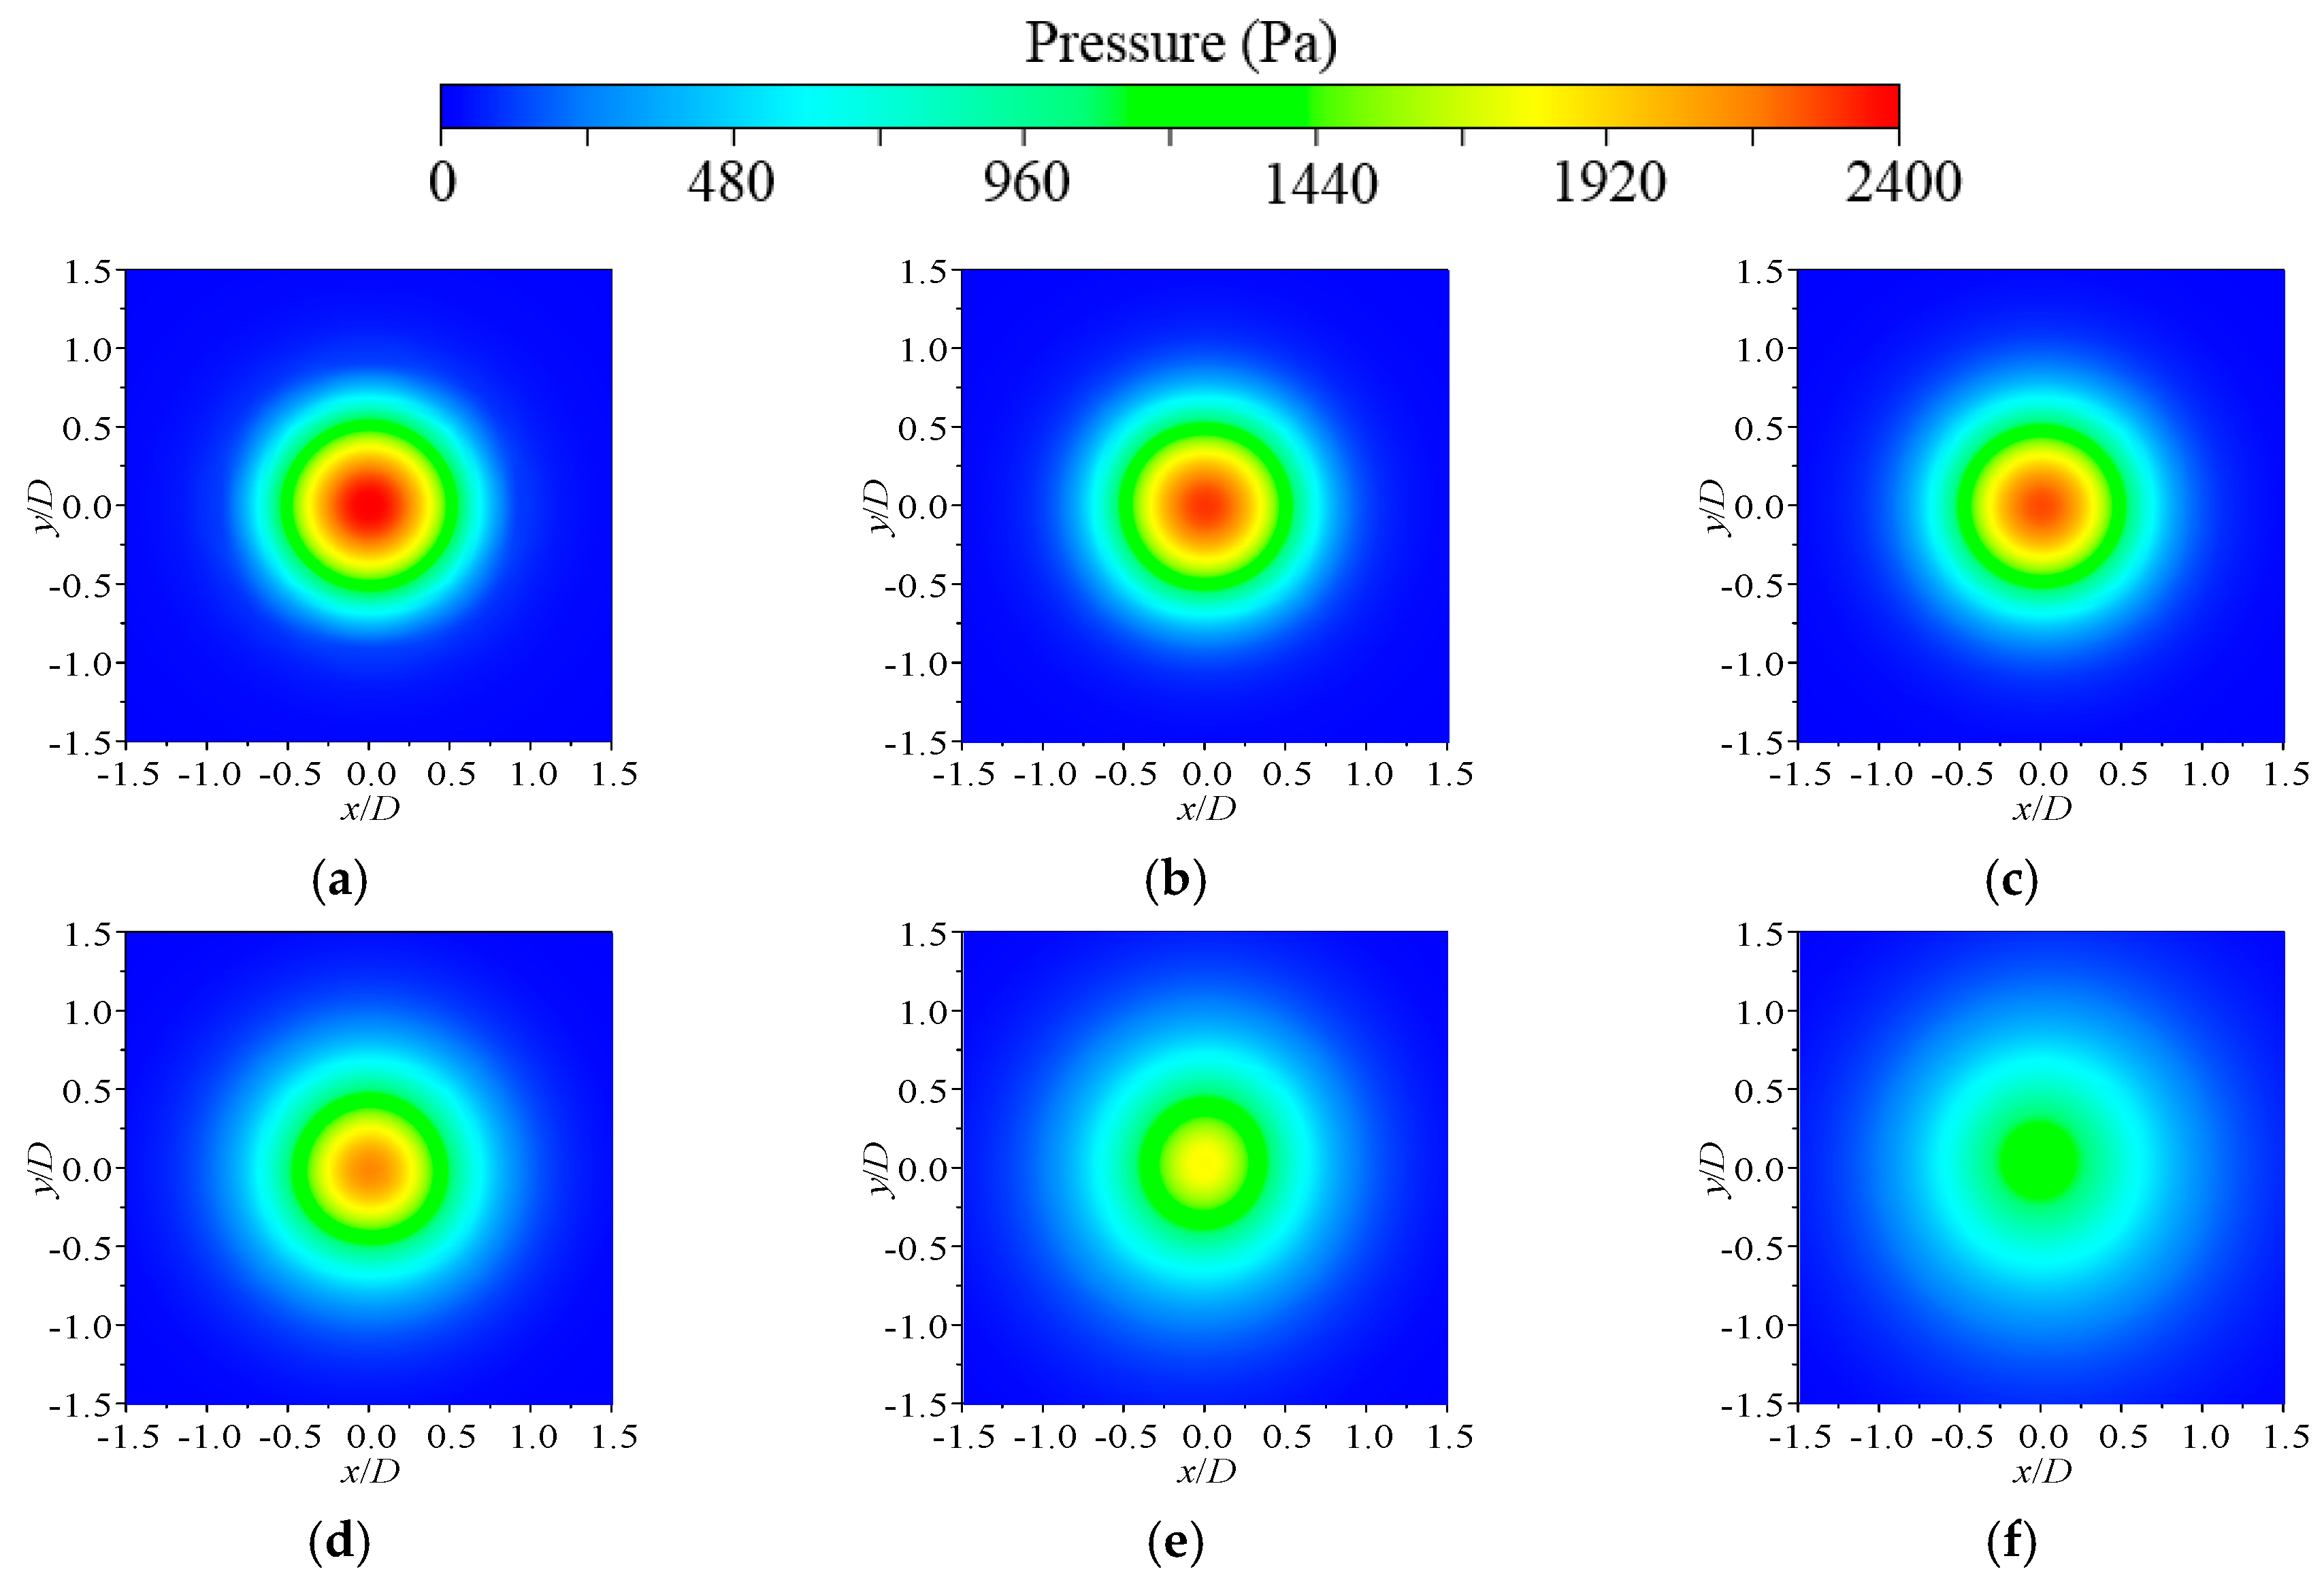
Figure 14 shows the pressure contour (Re = 35,100) of the impingement plane (oxy plane) with different impinging heights. When H/D = 1, the pressure on the impingement plate is circular and symmetrical, and the maximum pressure is obtained at the impinging point. As the impinging height increases, the maximum impinging pressure on the impingement plane gradually decreases.
Figure 15 shows the change of the maximum pressure coefficient Cpmax with H/D, and the numerical results are fitted with a straight line. The fitting formula is:
C pmax = P m a x P 0 1 2 ρ V b 2 = 0.012 ( H D ) 2 + 0.011 H D + 1.539
The applicable range of formula (1) is θ = 90°, 11,700 ≤ Re ≤ 35,100. It can be seen that the decreasing rate of Cpmax gradually increases with H/D.
Figure 16 shows the distribution of the pressure coefficient Cp on the x-axis at different heights. It can be seen that Cp increases first and then decreases with the increase of x. The effective impinging pressure range is within −2 ≤ x/D ≤ 2, which is independent of the impinging height. The impinging pressure is dimensionless treated with P/Pmax as the ordinate and x/D as the abscissa. The pressure distribution under different impinging heights is shown in Figure 17. It can be seen that the jet pressure distributions at different impinging heights are similar. When H/D ≤ 6, the dimensionless pressure distribution is almost the same. When H/D = 8, the dimensionless pressure distribution range increases, and the pressure concentration degree decreases.

4. Conclusions

In this manuscript, submerged impinging water jets with different impinging heights were investigated in depth, by using CFD based on the W-A turbulence model, and the conclusions can be shown as follows:
(1) The jet flow is highly dependent on the impinging height H, but is relatively insensitive to Re. The normalized mean velocity V/Vb along the jet centerline remains constant in the potential-core region, and decreases rapidly in the transition zone and the impinging region. With the increase of impinging height, the diffusion degree of the jet flow reaching the impinging region increases and the velocity decreases gradually. Near the stagnation point, the fluid velocity increases first and then decreases.
(2) In the impinging region, the jet decelerates rapidly and starts to flow along the wall in the transverse direction. With the increase of impinging height, the value of the maximum axial velocity Vm/Vb decreases rapidly in the region of x/D ≤ 2 (impinging region), while it remains basically unchanged in the region of x/D > 2 (wall-jet region), which also keeps consistent with x/D. It shows that the velocity distribution in the wall-jet region is relatively insensitive to impinging height.
(3) The pressure coefficient Cp along the plane mainly concentrates on the impinging region in the range −2 ≤ x/D ≤ 2, with the maximum value being observed at the stagnant point. The maximum impinging pressure coefficient at the impinging plate decreases with the impinging height, and the decreasing rate increases constantly.

Author Contributions

Data curation, H.W.; Formal analysis, Z.Q.; Writing—original draft, C.W. and D.Z.; Writing—review and editing, T.W. All authors have read and agreed to the published version of the manuscript.

Funding

This research was funded by the National Natural Science Foundation of China (No. 51979240 and 51609105), Priority Academic Program Development of Jiangsu Higher Education Institutions (grant number PAPD), Open Research Subject of Key Laboratory of Fluid and Power Machinery (Xihua University), Ministry of Education (szjj2016-061), Changzhou Sci&Tech Program (Grant No. CJ20190048), Visiting Researcher Fund Program of State Key Laboratory of Water Resources and Hydropower Engineering Science (2017SDG02).

Conflicts of Interest

The authors declare no conflicts of interest.

References

  1. Cooper, D.; Jackson, D.C.; Launder, B.E.; Liao, G.X. Impinging jet studies for turbulence model assessment-I. Flow-field experiments. Int. J. Heat Mass Transfer. 1993, 36, 2675–2684. [Google Scholar] [CrossRef]
  2. Naib, S.A.; Sanders, J. Oblique and Vertical Jet Dispersion in Channels. J. Hydraul. Eng. 1997, 123, 456–462. [Google Scholar] [CrossRef]
  3. Wang, C.; Wang, X.; Shi, W.; Lu, W.; Ling, Z. Experimental Investigation on Impingement of a Submerged Circular Water Jet at Varying Impinging Angles and Reynolds Numbers. Exp. Therm. Fluid Sci. 2017, 89, 189–198. [Google Scholar] [CrossRef]
  4. Krishnan, G.; Mohseni, K. An experimental study of a radial wall jet formed by the normal impingement of a round synthetic jet. Eur. J. Mech. B-Fluid. 2010, 29, 269–277. [Google Scholar] [CrossRef]
  5. Shestakov, M.V.; Dulin, V.M.; Tokarev, M.P.; Sikovsky, D.P.; Markovich, D.M. PIV study of large-scale flow organisation in slot jets. Int. J. Heat Fluid Flow. 2015, 51, 335–352. [Google Scholar] [CrossRef]
  6. Lu, Z.; Lu, Y.; Xia, B.; Liu, Y.; Zhao, L.; Ge, Z.; Zuo, W. Numerical simulation on hydrodynamic characteristics of percussion pulsed jet. J. China Univ. Pet. Ed. Nat. Sci. 2013, 37, 104–108. [Google Scholar]
  7. Craft, T.J.; Graham, L.J.W.; Launder, B.E. Impinging jet studies for turbulence model assessment—II. An examination of the performance of four turbulence models. Int. J. Heat Mass Transfer. 1993, 36, 2685–2697. [Google Scholar] [CrossRef]
  8. Baughn, J.W.; Shimizu, S. Heat transfer measurements from a surface with uniform heat flux and an impinging jet. J. Heat Transfer. 1989, 111, 1096–1098. [Google Scholar] [CrossRef]
  9. Gutmark, E.; Wolfshtein, M.; Wygnanski, I. The plane turbulent impinging jet. J. Fluid Mech. 1978, 88, 737–756. [Google Scholar] [CrossRef]
  10. Wang, C.; Chen, X.; Qiu, N.; Zhu, Y.; Shi, W. Numerical and experimental study on the pressure fluctuation, vibration, and noise of multistage pump with radial diffuser. J. Braz. Soc. Mech. Sci. Eng. 2018, 40, 481. [Google Scholar] [CrossRef]
  11. Wang, H.; Long, B.; Wang, C.; Han, C.; Li, L. Effects of the Impeller Blade with a Slot Structure on the Centrifugal Pump Performance. Energies 2020, 13, 1628. [Google Scholar] [CrossRef]
  12. Shi, L.; Zhu, J.; Tang, F.; Wang, C. Multi-disciplinary optimization design of axial-flow pump impellers based on the approximation model. Energies 2020, 13, 779. [Google Scholar] [CrossRef] [Green Version]
  13. He, X.; Zhang, Y.; Wang, C.; Zhang, C.; Cheng, L.; Chen, K.; Hu, B. Influence of critical wall roughness on the performance of double-channel sewage pump. Energies 2020, 13, 464. [Google Scholar] [CrossRef] [Green Version]
  14. Wang, H.; Long, B.; Yang, Y.; Xiao, Y.; Wang, C. Modelling the influence of inlet angle change on the performance of submersible well pumps. Int. J. Simul. Model. 2020, 19, 100–111. [Google Scholar] [CrossRef]
  15. Chen, K.; Zhao, K.; You, Y. Numerical study on flow structure of a shallow laminar round jet. J. Shanghai Jiaotong Univ. 2017, 22, 257–264. [Google Scholar] [CrossRef]
  16. Amamou, A.; Habli, S.; Saïd, N.M.; Bournot, P.; Le Palec, G. Numerical study of turbulent round jet in a uniform counterflow using a second order Reynolds Stress Model. J. Hydro-Environ. Res. 2015, 9, 482–495. [Google Scholar] [CrossRef]
  17. Chen, Q.; Xu, Z.; Wu, Y.; Zhang, Y. Numerical analysis of a planar oblique impinging jet flow field. J. Eng. Thermophys. 2005, 02, 237–239. [Google Scholar]
  18. Guo, W.; Li, L.; Liu, C.; Li, N. Study on the Flow Field of a Submerged Jet. Adv. Eng. Sci. 2017, 49, 35–43. [Google Scholar]
  19. Afroz, F.; Sharif, M.A.R. Numerical study of turbulent annular impinging jet flow and heat transfer from a flat surface. Appl. Therm. Eng. 2018, 138, 154–172. [Google Scholar] [CrossRef]
  20. Huang, F.; Li, S.; Zhao, Y.; Liu, Y. A numerical study on the transient impulsive pressure of a water jet impacting nonplanar solid surfaces. J. Mech. Sci. Technol. 2018, 32, 4209–4221. [Google Scholar] [CrossRef]
  21. Stahl, S.L.; Gaitonde, D.V. Computational Investigation of Dual Impinging Jet Dynamics at Mixed Operating Conditions. In Proceedings of the AIAA Scitech 2020 Forum, Reno, NV, USA, 15–19 June 2020; p. 0818. [Google Scholar]
  22. Battistin, D.; Iafrati, A. A numerical model for the jet flow generated by water impact. J. Eng. Math. 2004, 48, 353–374. [Google Scholar] [CrossRef]
  23. Singh, T.P.; Kumar, A.; Satapathy, A.K. Fluid flow analysis of a turbulent offset jet impinging on a wavy wall surface, Part C. J. Mech. Eng. Sci. 2020, 234, 544–563. [Google Scholar] [CrossRef]
  24. Wienand, J.; Riedelsheimer, A.; Weigand, B. Numerical study of a turbulent impinging jet for different jet-to-plate distances using two-equation turbulence models. Eur. J. Mech. B/Fluids 2017, 61, 210–217. [Google Scholar] [CrossRef] [Green Version]
  25. Han, X.; Wray, T.J.; Fiola, C.; Agarwal, R.K. Computation of Flow in S Ducts With Wray–Agarwal One-Equation Turbulence Model. J. Propuls. Power 2015, 31, 1338–1349. [Google Scholar] [CrossRef]
  26. Fairweather, M.; Hargrave, G. Experimental investigation of an axisymmetric, impinging turbulent jet. 1. Velocity field. Exp. Fluids 2002, 33, 464–471. [Google Scholar] [CrossRef]
Figure 1. Three-dimensional submerged vertical jet.
Energies 13 01744 g001
Figure 2. Middle section of the mesh of the impinging jet model: (a) oxz plane without jet; (b) oyz plane without jet; (c) enlarged jet rotating 90 degrees clockwise.
Energies 13 01744 g002
Figure 3. Verification of Wray-Agarwal turbulence model: (a) Profiles of the normalized axial velocity V/Vmax near the jet exit; (b) Normalized mean axial velocity V/Vmax profiles along the centerline of the impinging jet.
Energies 13 01744 g003
Figure 4. Flow angle φ along the jet centerline.
Energies 13 01744 g004
Figure 5. Normalized mean velocity V/Vb contour and streamline of mid-section on submerged impinging jet at various impinging heights:(a) H/D = 1; (b) H/D = 3; (c) H/D = 4; (d) H/D = 8; (e) enlarged view on the impinging region.
Energies 13 01744 g005
Figure 6. Normalized mean velocity V/Vb contour and streamline of different cross sections on submerged impinging jet at various impinging heights: (a) H/D = 1; (b) H/D = 2; (c) H/D = 3; (d) H/D = 4; (e) H/D = 6; (f) H/D = 8.
Energies 13 01744 g006
Figure 7. Normalized mean velocity V/Vb contour and streamline of different vertical cross sections on submerged impinging jet at various impinging height: (a) H/D = 1; (b) H/D = 3; (c) H/D = 6.
Energies 13 01744 g007
Figure 8. Radial profile development of the normalized mean axial velocity V/Vb at various impinging height: (a) H/D = 1; (b) H/D = 2; (c) H/D = 3; (d) H/D = 4; (e) H/D = 6; (f) H/D = 8.
Energies 13 01744 g008
Figure 9. Normalized mean axial velocity V/Vb along the jet centerline.
Energies 13 01744 g009
Figure 10. Development of mean horizontal velocity (Vx/Vb) along the horizontal direction at different vertical locations on the near-wall region:(a) H/D = 1; (b) H/D = 3; (c) H/D = 6; (d) H/D = 8.
Energies 13 01744 g010
Figure 11. Development of mean vertical velocity (Vz/Vb) along the horizontal direction at different vertical locations on the near-wall region: (a) H/D = 1; (b) H/D = 3; (c) H/D = 6; (d) H/D = 8.
Energies 13 01744 g011
Figure 12. Variation of normalized average velocity V/Vb.
Energies 13 01744 g012
Figure 13. Variation of normalized maximum velocity Vm/Vb along the x direction.
Energies 13 01744 g013
Figure 14. Pressure contour of the plane (oxy plane) of jet at various impinging height: (a) H/D = 1; (b) H/D = 2; (c) H/D = 3; (d) H/D = 4; (e) H/D = 6; (f) H/D = 8.
Energies 13 01744 g014
Figure 15. Variation of Cpmax as a function of H/D.
Energies 13 01744 g015
Figure 16. Variation of the pressure coefficient Cp along the x axis in the flow direction.
Energies 13 01744 g016
Figure 17. Variation of the pressure P/Pmax along the x axis in the flow direction.
Energies 13 01744 g017
Table 1. Computational conditions of submerged impinging jet.
ParametersCondition 1Condition 2Condition 3
Inlet velocity(m/s)0.5851.171.76
Re11,70023,40035,100