Revision of Threshold Luminance Levels in Tunnels Aiming to Minimize Energy Consumption at No Cost: Methodology and Case Studies †

 ,
,  ,
, 
 and
and
Abstract
1. Introduction
2. Materials and Methods
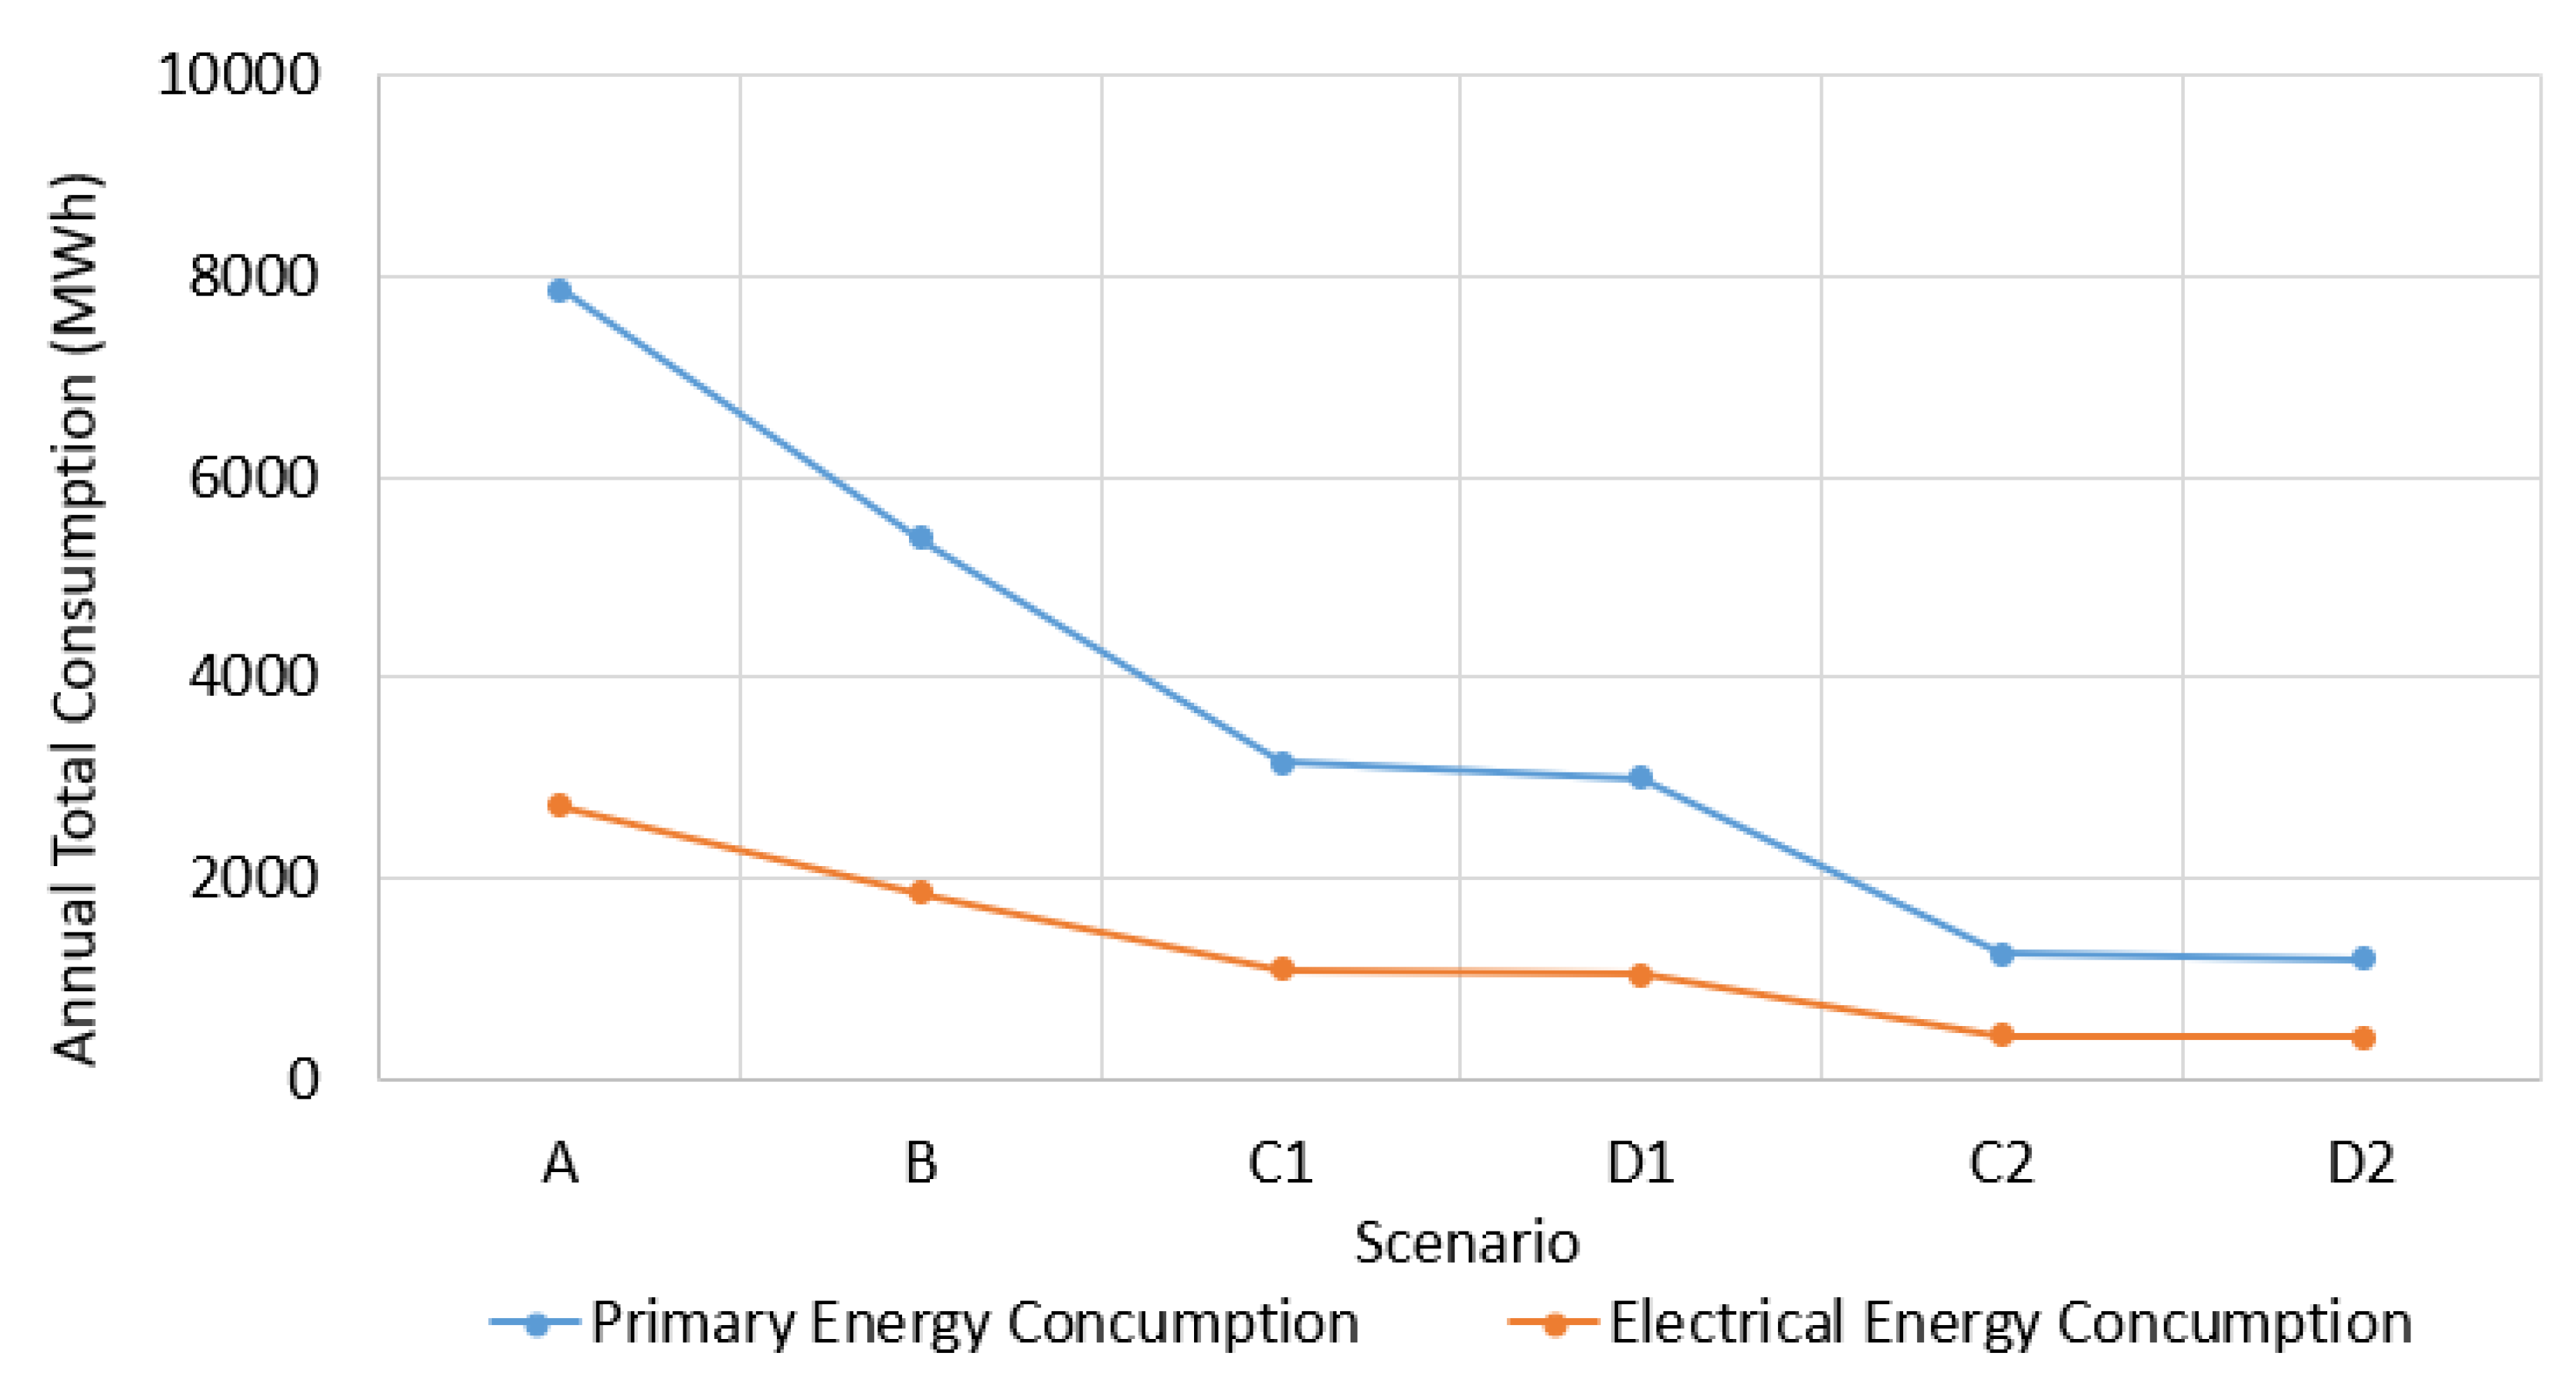
- Scenario A: Switching control with existing Lth values.
- Scenario B: Switching control with newly calculated Lth’ values.
- Scenario C1: LED Retrofit 10% step control dimming (Lth).
- Scenario C2: LED Retrofit 10% step control dimming (Lth’).
- Scenario D1: LED Retrofit continuous dimming (Lth).
- Scenario D2: LED Retrofit continuous dimming (Lth’).
2.1. Existing Lighting Infrastructure
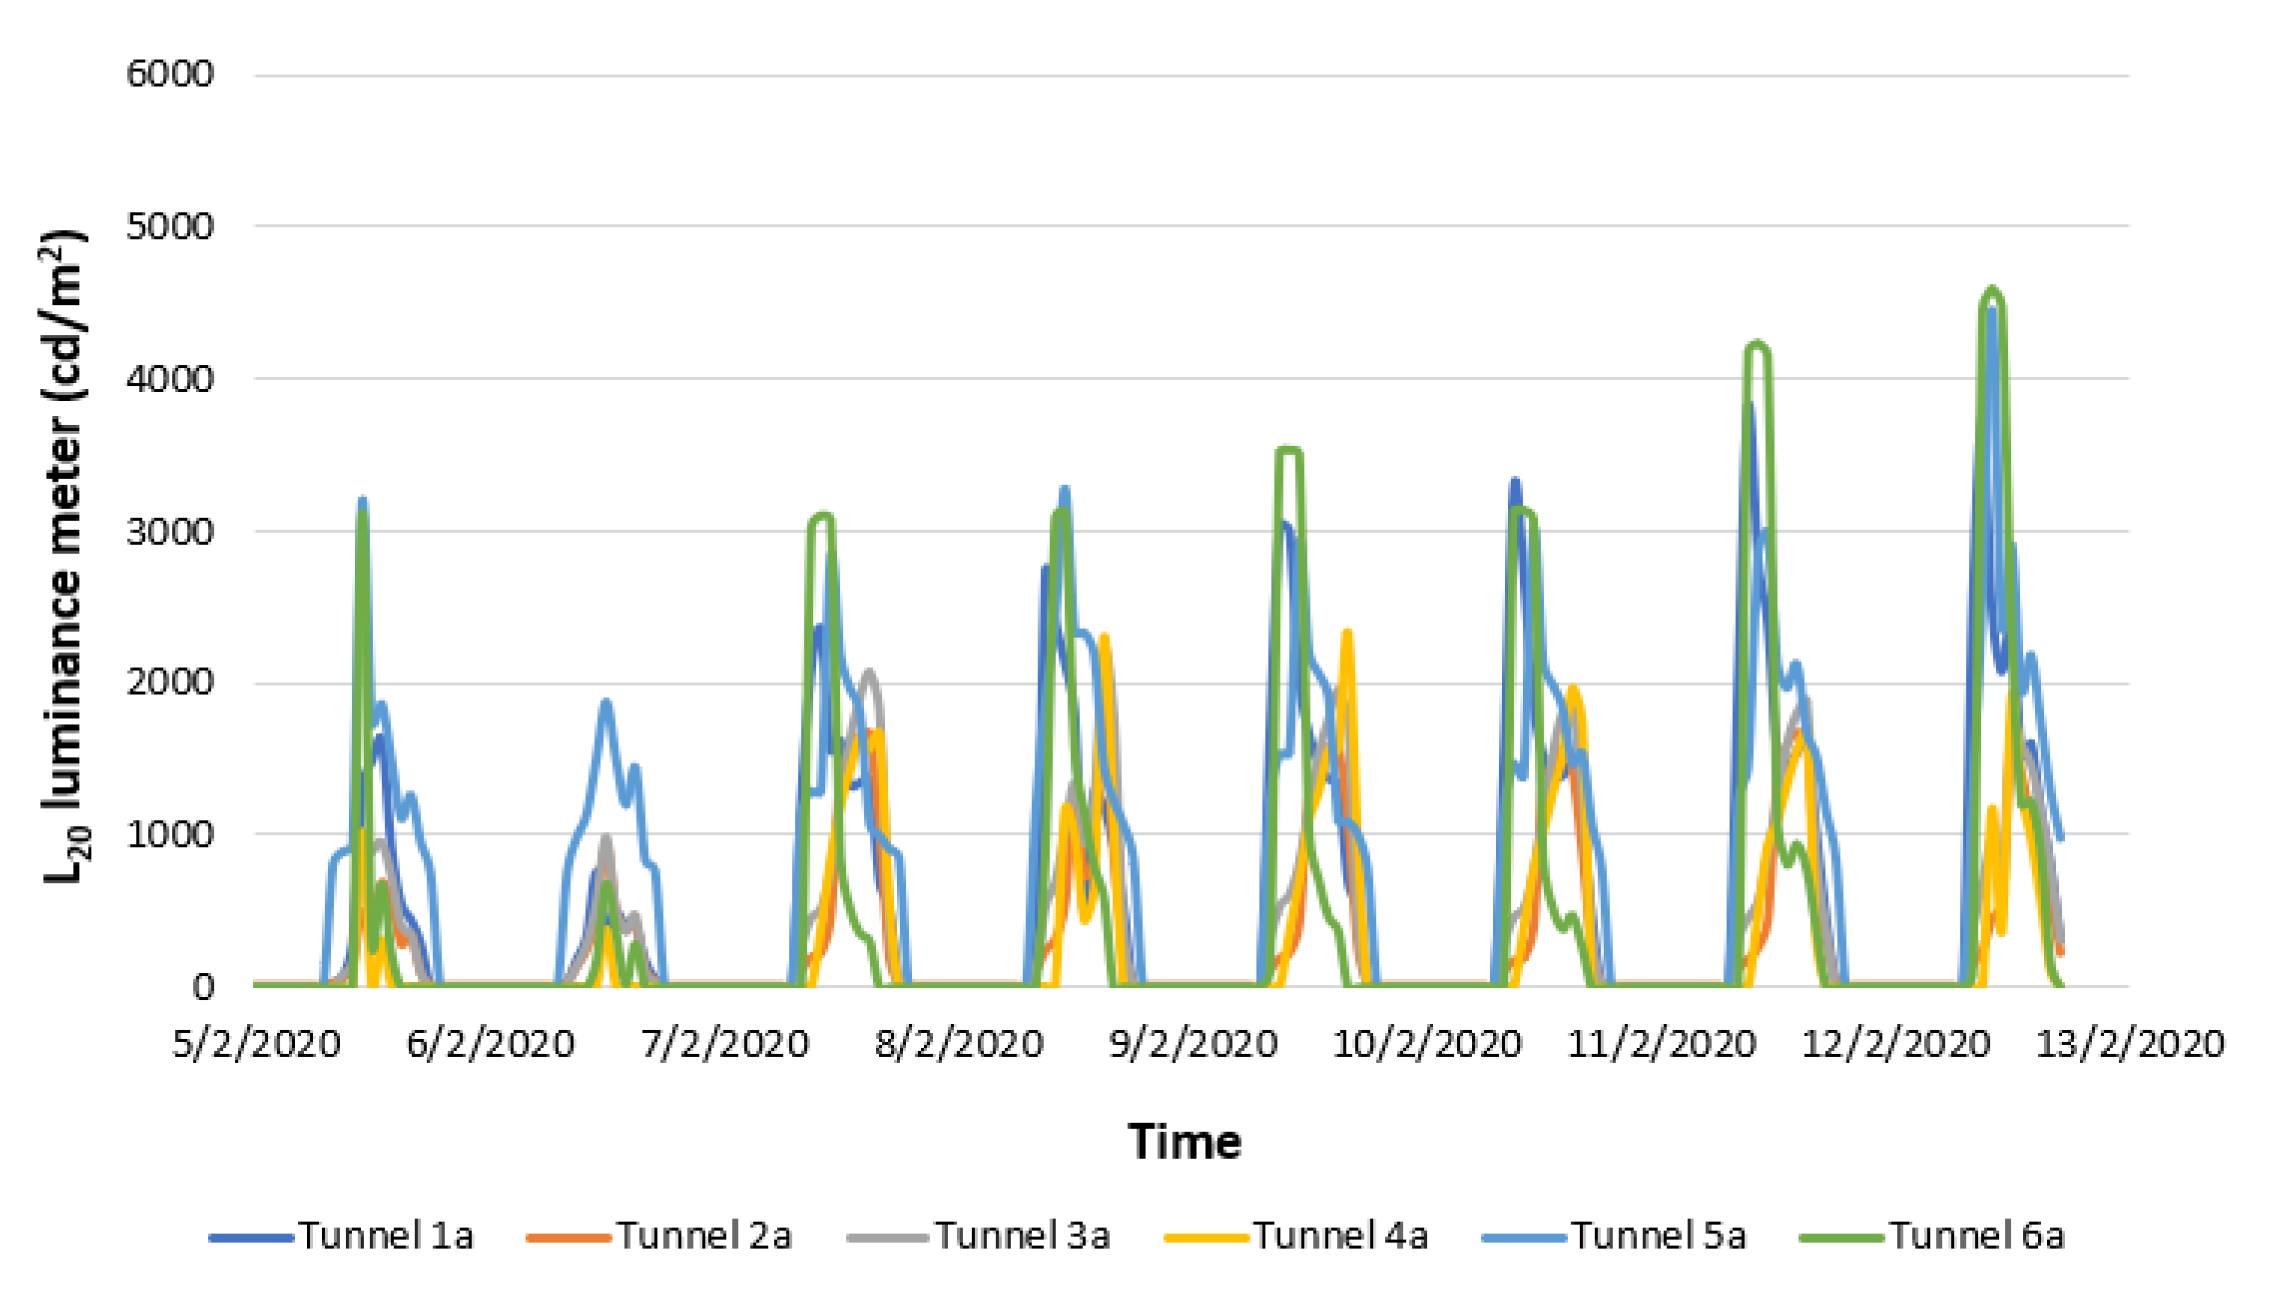
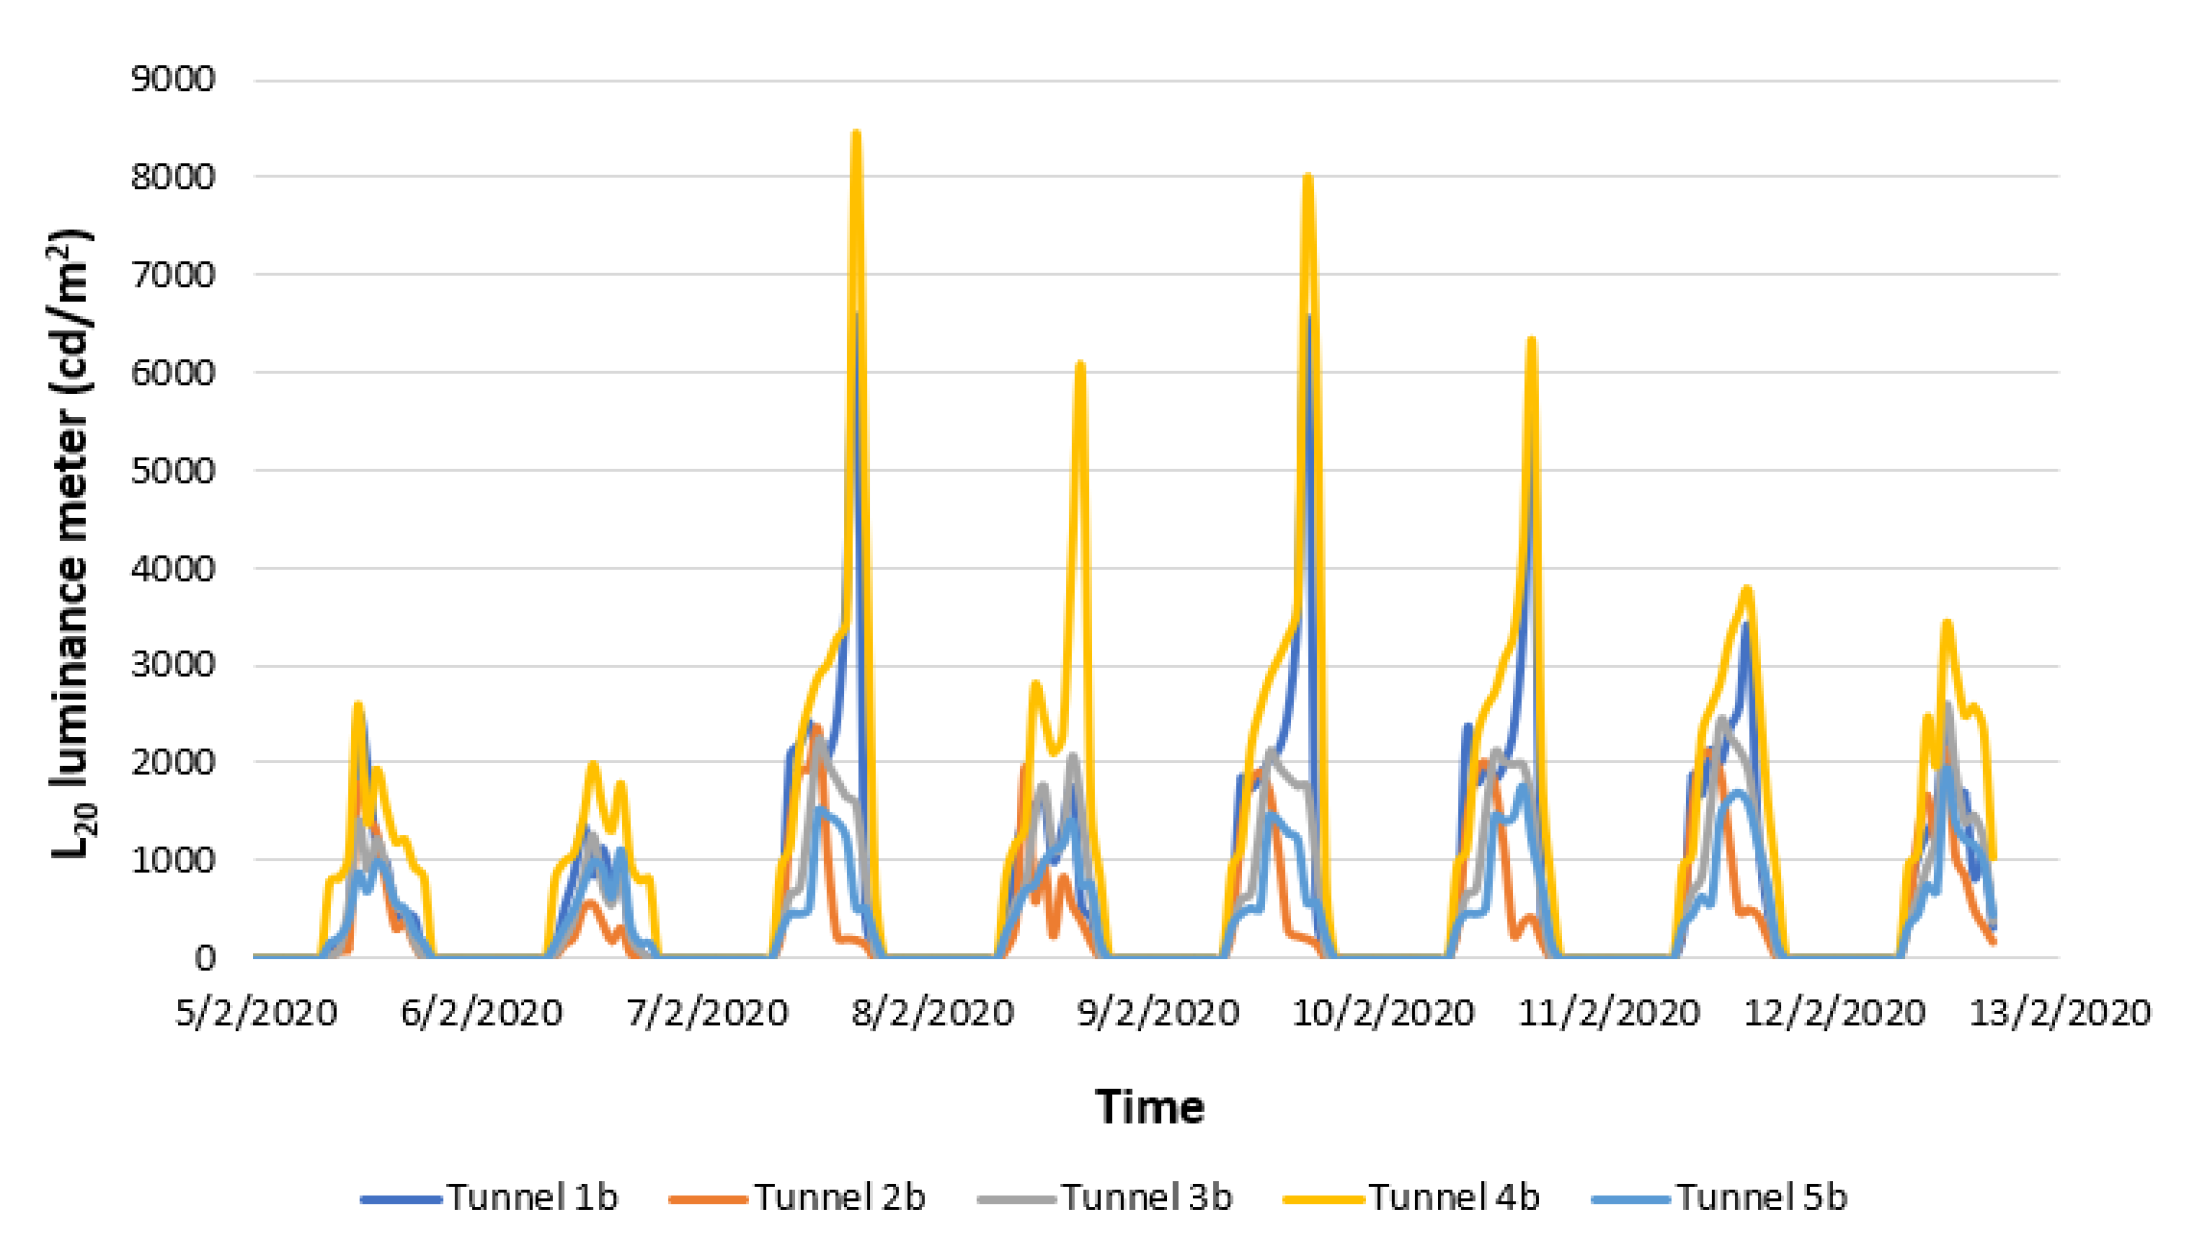
2.2. Luminance Calculations (L20)
3. Results
3.1. Defining Switching Control
3.1.1. Existing Switching (Scenario A)
3.1.2. Proposed Switching (Scenario B)
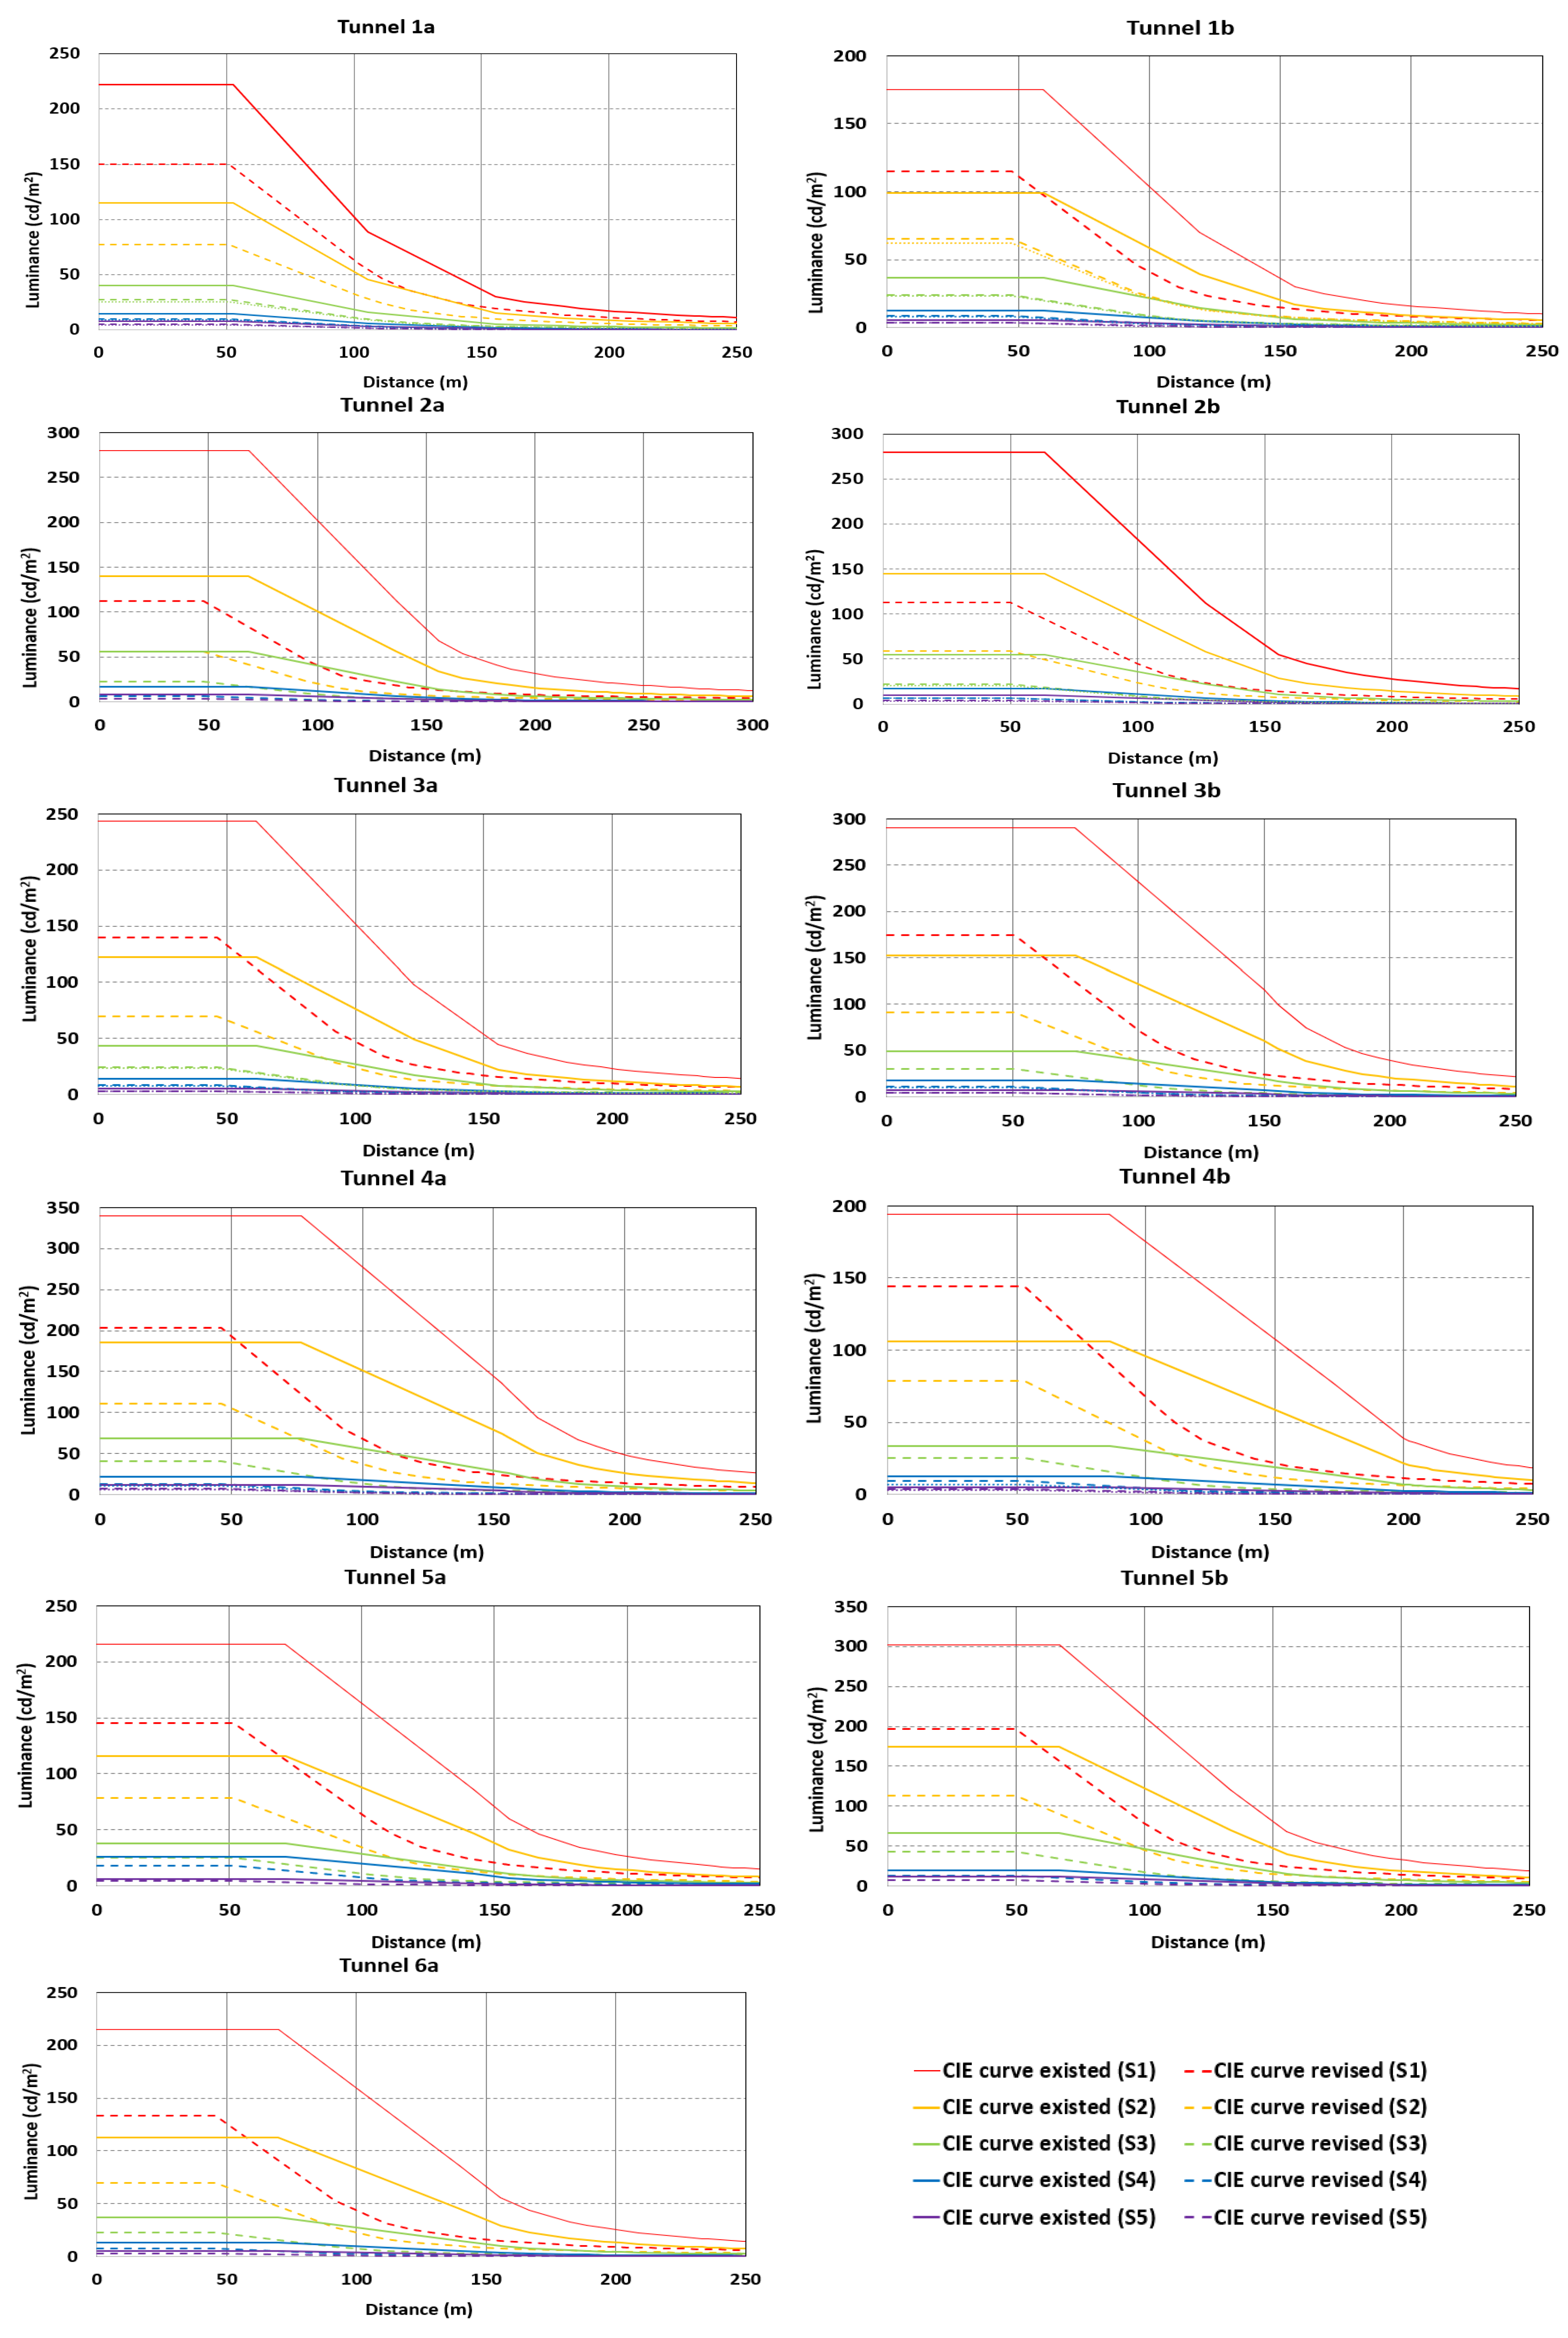
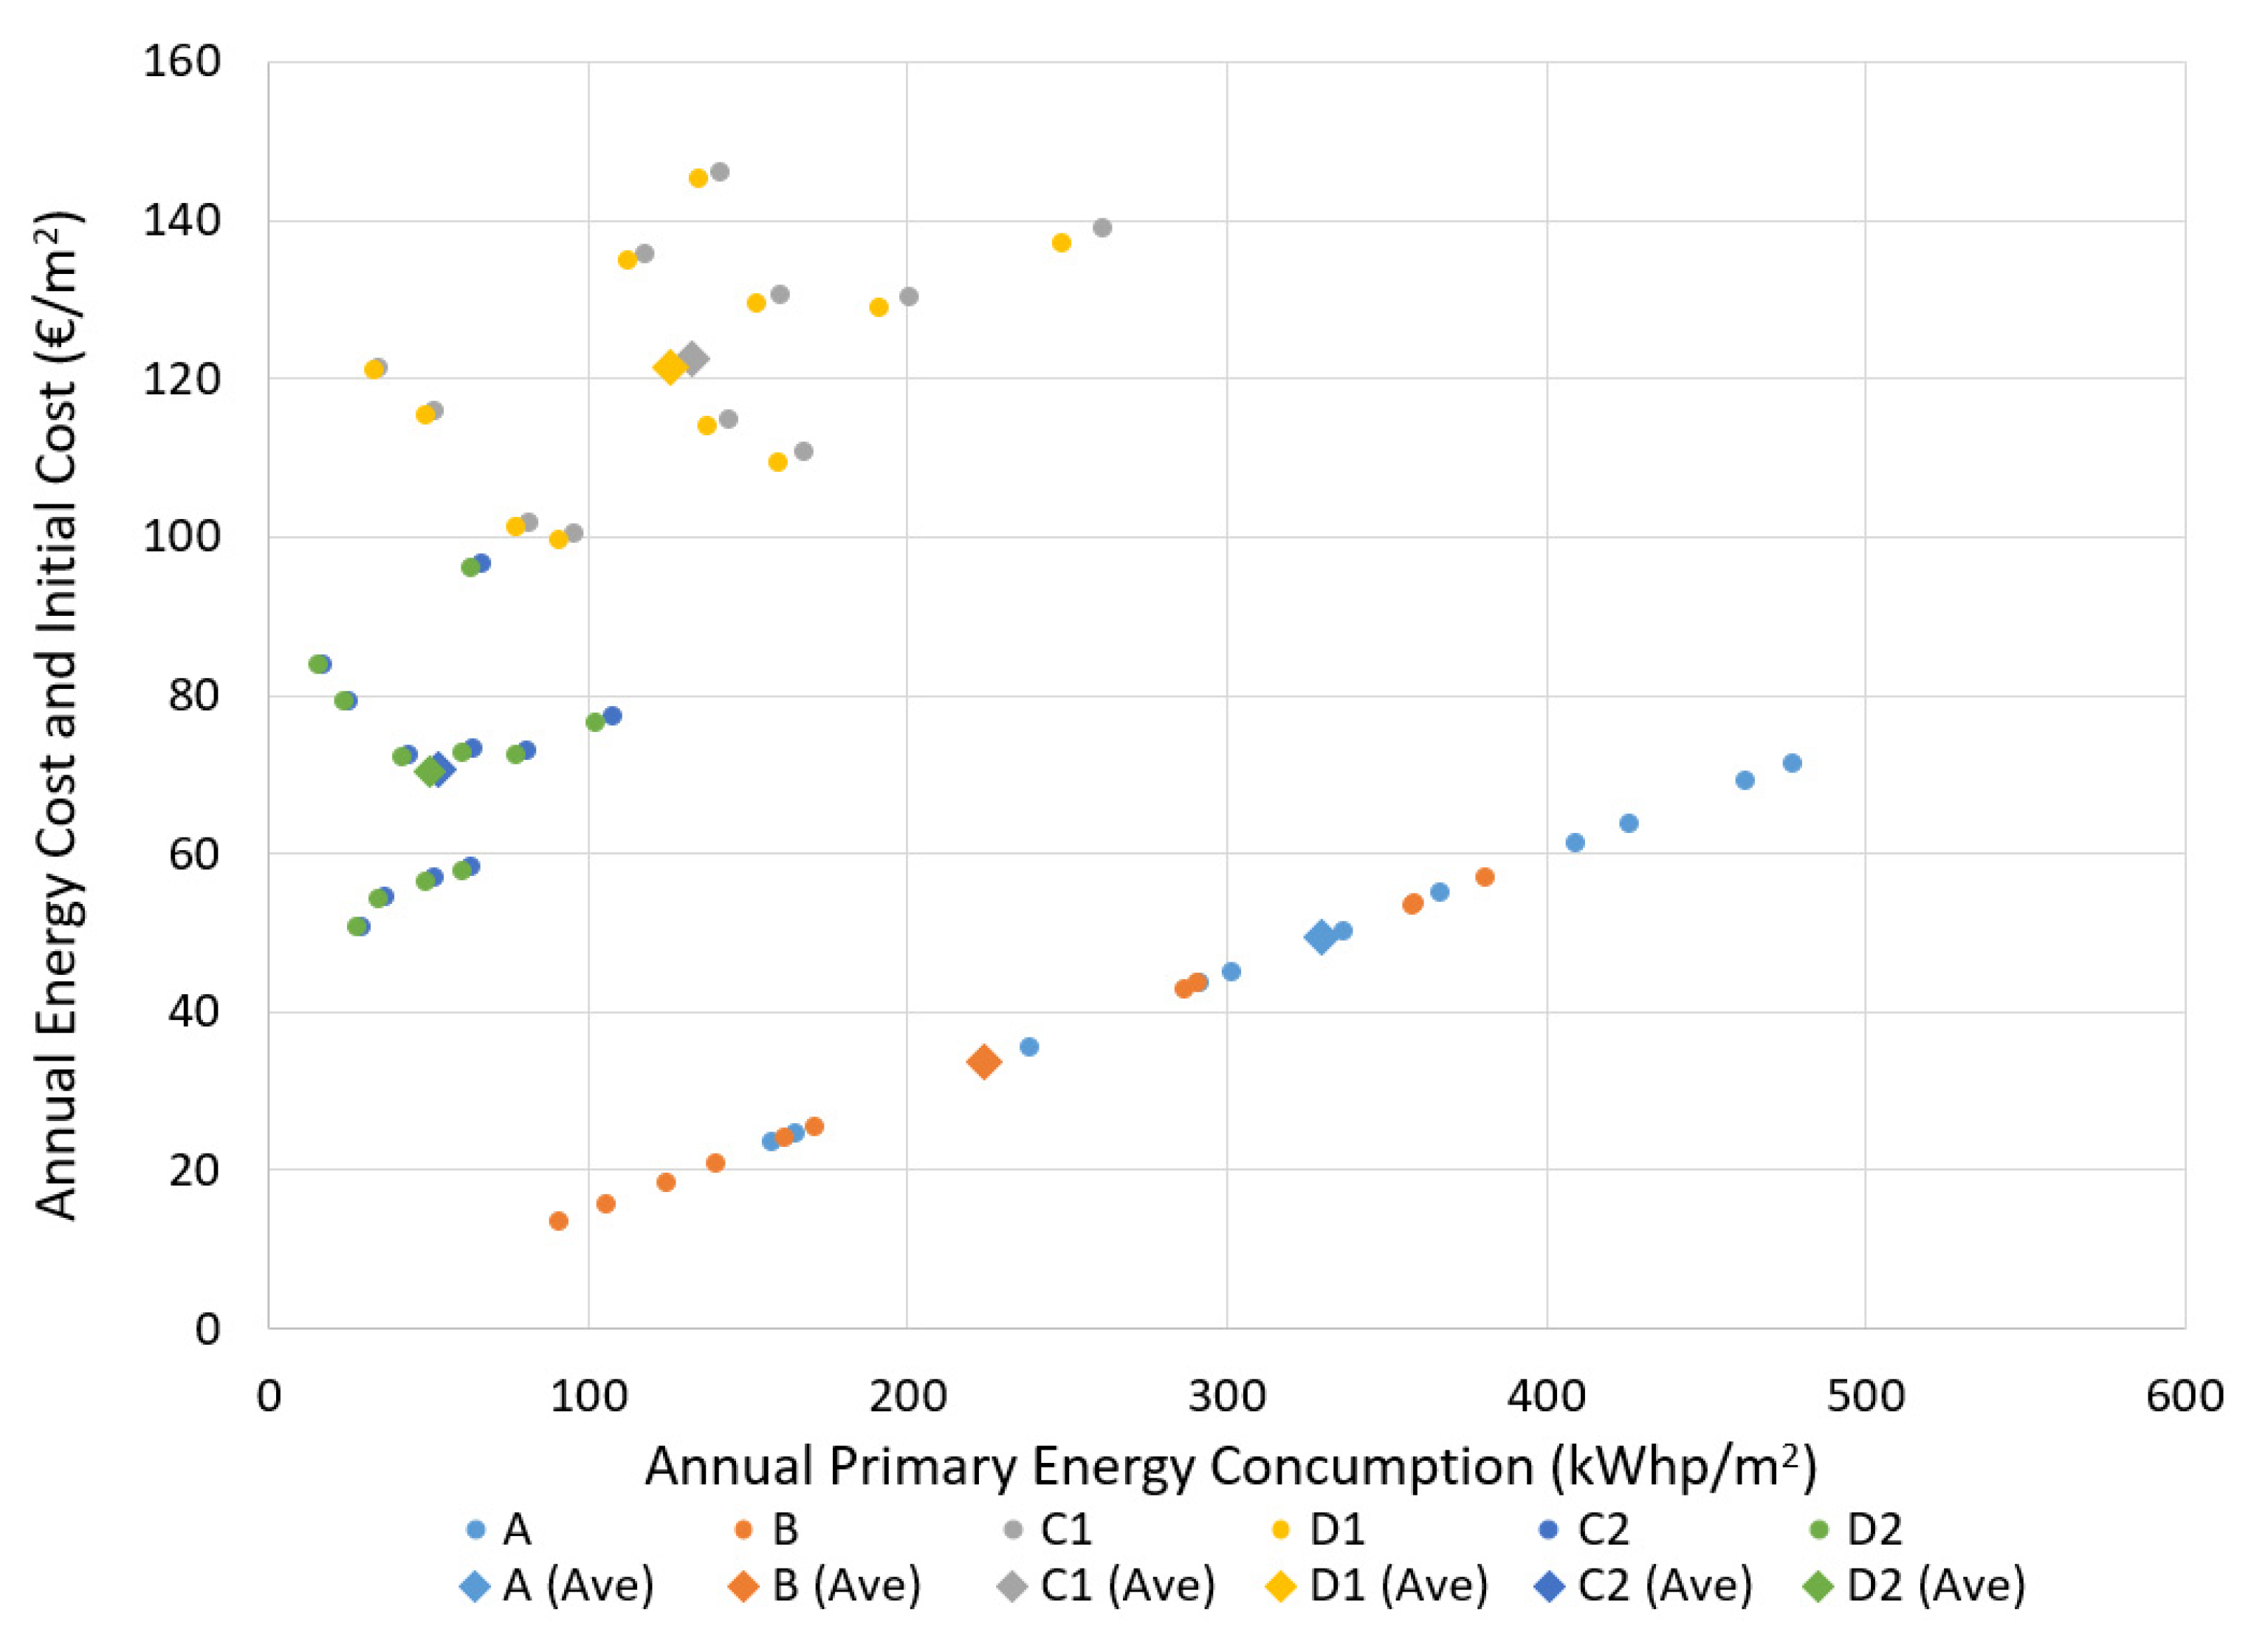
3.2. Use of LED Luminaires (Scenarios C1, D1, C2, and D2)
3.3. Energy Calculations
- Scenario A: Switching control with existing Lth values.
- Scenario B: Switching control with newly calculated Lth’ values.
- Scenario C1: LED Retrofit 10% step control dimming (Lth).
- Scenario C2: LED Retrofit 10% step control dimming (Lth’).
- Scenario D1: LED Retrofit continuous dimming (Lth).
- Scenario D2: LED Retrofit continuous dimming (Lth’).
4. Discussion and Conclusions
Author Contributions
Funding
Acknowledgments
Conflicts of Interest
Nomenclature
| Factor k | Threshold zone luminance ratio (k) at a point: the ratio between the threshold zone luminance Lth and the access zone luminance L20. Typical values are given by [31] |
| Lth | Threshold zone luminance, the average road surface luminance of a transverse strip at a given location in the threshold zone of the tunnel (as a function of the measurement grid). |
| Lth (S1) | Lth (SN) is the Lth of the initial design of the existing tunnel for SN light stage, SN is the corresponding lighting stage (S1, S2, etc.) |
| Lth’ (SN) | Lth’ (S1) is the luminance requirement for the new threshold zone for S1 stage |
| L20 | Average luminance contained in a conical field of view, subtending an angle of 20° with the apex at the position of the eye of an approaching driver and aimed at the left of the tunnel mouth. L20 is assessed from a point at a distance equal to the stopping distance from the tunnel portal at the middle of the relevant carriage-way or traffic lane. |
| L20 formula: Lc | Typical values of sky luminance depending the driving direction given by [31] |
| L20 formula: LR | Typical values of road luminance depending the driving direction given by [31] |
| L20 formula: LE | Typical values of surrounding luminance depending the driving direction given by [31] |
| L20 formula: γ | Percentage of the area of the sky covering the area contributing to the L20 value at the tunnel entrance |
| L20 formula: ρ | Percentage of the area of the road covering the area contributing to the L20 value at the tunnel entrance |
| L20 formula: ε | Percentage of the area of the surrounding covering the area contributing to the L20 value at the tunnel entrance |
| Over Lit Triggering Percentage (OLTP) | Lth (SN)/Lth’ (S1) Where Lth (SN) is the Lth of the initial design of the existing tunnel for SN light stage, Lth’ (S1) is the luminance requirement for the new threshold zone for S1 stage and SN is the corresponding lighting stage (S1 for N=1, S2 for N=2, etc.). Thereafter OLTPRSN represents (in percentage) the new triggering of each of the existing lighting circuit for SN light stage. This percentage is necessary for the specification of the new triggering of the existed lighting circuits based on the new lower lighting requirements. It is evident that the proposed triggering will now depend on the Lth’ and since the existing lighting achieves specific lighting levels due to the existing lighting circuits, their triggering has to be redefined. |
References
- Zissis, G. Energy consumption and environmental and economic impact of lighting: The current situation. In Handbook of Advanced Lighting Technology; Karlicek, R., Sun, C.C., Zissis, G., Ma, R., Eds.; Springer: Cham, Switzerland, 2016; pp. 1–13. [Google Scholar] [CrossRef]
- Traverso, M.; Donatello, S.; Moons, H.; Rodriguez Quintero, R.; Gama Caldas, M.; Wolf, O. Revision of the EU Green Public Procurement Criteria for Road Lighting and Traffic Signals; EUR 29631 EN; Publications Office of the European Union: Luxembourg, 2019; JRC115406; ISBN 978-92-79-99077-9. [Google Scholar] [CrossRef]
- Ntanos, S.; Kyriakopoulos, G.; Skordoulis, M.; Chalikias, M.; Arabatzis, G. An application of the new environmental paradigm (NEP) scale in a Greek context. Energies 2019, 12, 239. [Google Scholar] [CrossRef]
- Arabatzis, G.; Kyriakopoulos, G.; Tsialis, P. Typology of regional units based on RES plants: The case of Greece. Renew. Sustain. Energy Rev. 2017, 78, 1424–1434. [Google Scholar] [CrossRef]
- Kolovos, K.G.; Kyriakopoulos, G.; Chalikias, M.S. Co-evaluation of basic wood fuel types used as alternative heating sources to existing energy network. J. Environ. Prot. Ecol. 2011, 12, 733–742. [Google Scholar]
- Grigoropoulos, C.; Doulos, L.; Zerefos, S.; Tsangrassoulis, A.; Bhusal, P. Estimating the benefits of increasing the recycling rate of lamps from the domestic sector: Methodology, opportunities and case study. Waste Manag. 2020, 101, 188–199. [Google Scholar] [CrossRef] [PubMed]
- Mehri, A.; Sajedifar, J.; Abbasi, M.; Naimabadi, A.; Mohammadi, A.A.; Teimori, G.H.; Zakerian, S.A. Safety evaluation of lighting at very long tunnels on the basis of visual adaptation. Saf. Sci. 2019, 116, 196–207. [Google Scholar] [CrossRef]
- Han, X.; Shao, Y.; Yang, S.; Yu, P. Entropy-Based Effect Evaluation of Delineators in Tunnels on Drivers’ Gaze Behavior. Entropy 2020, 22, 113. [Google Scholar] [CrossRef]
- Peña-García, A.; Hurtado, A.; Aguilar-Luzón, M.C. Impact of public lighting on pedestrians’ perception of safety and well-being. Saf. Sci. 2015, 78, 142–148. [Google Scholar] [CrossRef]
- Gilandeh, S.S.; Hosseinlou, M.H.; Anarkooli, A.J. Examining bus driver behavior as a function of roadway features under daytime and nighttime lighting conditions: Driving simulator study. Saf. Sci. 2018, 110, 142–151. [Google Scholar] [CrossRef]
- Ye, Z.T.; Chen, C.L.; Chen, L.-C.; Tien, C.H.; Nguyen, H.T.; Wang, H.-C. Hollow Light Guide Module Involving Mini Light-Emitting Diodes for Asymmetric Luminous Planar Illuminators. Energies 2019, 12, 2755. [Google Scholar] [CrossRef]
- Djuretic, A.; Kostic, M. Actual energy savings when replacing high-pressure sodium with LED luminaires in street lighting. Energy 2018, 157, 367–378. [Google Scholar] [CrossRef]
- Djuretic, A.; Skerovic, V.; Arsic, N.; Kostic, M. Luminous flux to input power ratio, power factor and harmonics when dimming high-pressure sodium and LED luminaires used in road lighting. Lighting Res. Technol. 2019, 51, 304–323. [Google Scholar] [CrossRef]
- Anthopoulou, E.; Doulos, L. The effect of the continuous energy efficient upgrading of LED street lighting technology: The case study of Egnatia Odos. In Proceedings of the 2019 Second Balkan Junior Conference on Lighting (Balkan Light Junior), Plovdiv, Bulgaria, 19–21 September 2019. Category number CFP19BLJ-ART; Code 153526. [Google Scholar] [CrossRef]
- Moretti, L.; Cantisani, G.; Carrarini, L.; Bezzi, F.; Cherubini, V.; Nicotra, S. Italian Road Tunnels: Economic and Environmental Effects of an On-Going Project to Reduce Lighting Consumption. Sustainability 2019, 11, 4631. [Google Scholar] [CrossRef]
- Jettanasen, C.; Ngaopitakkul, A. Characteristics and Effects of Conducted Emission from Grid-Connected and Stand-Alone Micro-Inverters in a Nano-Grid Road Lighting System. Sustainability 2019, 11, 5690. [Google Scholar] [CrossRef]
- Hermoso-Orzáez, M.J.; Lozano-Miralles, J.A.; Lopez-Garcia, R.; Brito, P. Environmental Criteria for Assessing the Competitiveness of Public Tenders with the Replacement of Large-Scale LEDs in the Outdoor Lighting of Cities as a Key Element for Sustainable Development: Case Study Applied with PROMETHEE Methodology. Sustainability 2019, 11, 5982. [Google Scholar] [CrossRef]
- Ogando-Martínez, A.; Troncoso-Pastoriza, F.; Eguía-Oller, P.; Granada-Álvarez, E.; Erkoreka, A. Model Calibration Methodology to Assess the Actual Lighting Conditions of a Road Infrastructure. Infrastructures 2020, 5, 2. [Google Scholar] [CrossRef]
- Pracki, P.; Skarżyński, K. A Multi-Criteria Assessment Procedure for Outdoor Lighting at the Design Stage. Sustainability 2020, 12, 1330. [Google Scholar] [CrossRef]
- Doulos, L.T.; Sioutis, I.; Kontaxis, P.A.; Zissis, G.; Faidas, K. A decision support system for assessment of street lighting tenders based on energy performance indicators and environmental criteria: Overview, methodology and case study. Sustain. Cities Soc. 2019, 51, 101759. [Google Scholar] [CrossRef]
- Peña-García, A.; Sędziwy, A. Optimizing Lighting of Rural Roads and Protected Areas with White Light: A Compromise among Light Pollution, Energy Savings, and Visibility. LEUKOS 2019, 16, 147–156. [Google Scholar] [CrossRef]
- Ardavani, O.; Zerefos, S.; Doulos, L.T. Redesigning the exterior lighting as part of the urban landscape: The role of transgenic bioluminescent plants in Mediterranean urban and suburban lighting environments. J. Clean. Prod. 2020, 242, 118477. [Google Scholar] [CrossRef]
- Bará, S.; Lima, R.C.; Zamorano, J. Monitoring Long-Term Trends in the Anthropogenic Night Sky Brightness. Sustainability 2019, 11, 3070. [Google Scholar] [CrossRef]
- Galatanu, C.D.; Husch, M.; Canale, L.; Lucache, D. Targeting the Light Pollution: A Study Case. In Proceedings of the IEEE International Conference on Environment and Electrical Engineering and 2019 IEEE Industrial and Commercial Power Systems Europe, EEEIC/I and CPS Europe, Genoa, Italy, 11–14 June 2019. Article number 8783515. [Google Scholar]
- Kyba, C.C.M.; Wagner, J.M.; Kuechly, H.U.; Walker, C.E.; Elvidge, C.D.; Falchi, F.; Ruhtz, T.; Fischer, J.; Hölker, F. Citizen Science Provides Valuable Data for Monitoring Global Night Sky Luminance. Sci. Rep. 2013, 3, 1835. [Google Scholar] [CrossRef] [PubMed]
- Papalambrou, A.; Doulos, L.T. Identifying, Examining, and Planning Areas Protected from Light Pollution. The Case Study of Planning the First National Dark Sky Park in Greece. Sustainability 2019, 11, 5963. [Google Scholar] [CrossRef]
- Zielinska-Dabkowska, K.M.; Hartmann, J.; Sigillo, C. LED Light Sources and Their Complex Set-Up for Visually and Biologically Effective Illumination for Ornamental Indoor Plants. Sustainability 2019, 11, 2642. [Google Scholar] [CrossRef]
- Zielinska-Dabkowska, K.M.; Xavia, K. Global Approaches to Reduce Light Pollution from Media Architecture and Non-Static, Self-Luminous LED Displays for Mixed-Use Urban Developments. Sustainability 2019, 11, 3446. [Google Scholar] [CrossRef]
- International Commission on Illumination. Guide on the Limitation of the Effects of Obtrusive Light from Outdoor Lighting Installations, 2nd ed.; Technical Report CIE 150; International Commission on Illumination: Vienna, Austria, 2017; ISBN 978-3-902842-48-0. [Google Scholar]
- Schulte-Römer, N.; Meier, J.; Dannemann, E.; Söding, M. Lighting Professionals versus Light Pollution Experts? Investigating Views on an Emerging Environmental Concern. Sustainability 2019, 11, 1696. [Google Scholar] [CrossRef]
- European Committee for Standardization. European Norm CR 14380 Lighting Applications—Tunnel Lighting; European Committee for Standardization: Brussels, Belgium, 2003. [Google Scholar]
- International Commission on Illumination. Guide for the Lighting of Road Tunnels and Underpasses; Technical Report CIE 88; International Commission on Illumination: Vienna, Austria, 2004; ISBN 3 901 906 31 2. [Google Scholar]
- Mavridou, T.; Doulos, L.T. Evaluation of Different Roof Types Concerning Daylight in Industrial Buildings during the Initial Design Phase: Methodology and Case Study. Buildings 2019, 9, 170. [Google Scholar] [CrossRef]
- Mantzourani, K.; Doulos, L.; Kontadakis, A.; Tsangrassoulis, A. The effect of the daylight zone on lighting energy savings. IOP Conf. Ser. Earth Environ. Sci. 2020, 410, 012099. [Google Scholar] [CrossRef]
- Kontadakis, A.; Doulos, L.; Mantzourani, A.; Tsangrassoulis, A. Performance assessment of an active sunlight redirection system in areas with different climate: A comparison. IOP Conf. Ser. Earth Environ. Sci. 2020, 410, 012098. [Google Scholar] [CrossRef]
- Moretti, L.; Cantisani, G.; di Mascio, P. Management of road tunnels: Construction, maintenance and lighting costs. Tunn. Undergr. Space Technol. 2016, 51, 84–89. [Google Scholar] [CrossRef]
- Moretti, L.; Cantisani, G.; di Mascio, P.; Caro, S. Technical and economic evaluation of lighting and pavement in Italian road tunnels. Tunn. Undergr. Space Technol. 2017, 65, 42–52. [Google Scholar] [CrossRef]
- López, J.C.; Grindlay, A.L.; Peña-García, A. A proposal for evaluation of energy consumption and sustainability of road tunnels: The sustainability vector. Tunn. Undergr. Space Technol. 2017, 65, 53–61. [Google Scholar] [CrossRef]
- Peña-García, A.; Escribano, R.; Gil-Martín, L.M.; Espín-Estrella, A. Computational optimization of semi-transparent tension structures for the use of solar light in road tunnels. Tunn. Undergr. Space Technol. 2012, 32, 127–131. [Google Scholar] [CrossRef]
- Pena-Garcia, A.; Lopez, J.C.; Grindlay, A.L. Decrease of energy demands of lighting installations in road tunnels based in the forestation of portal surroundings with climbing plants. Tunn. Undergr. Space Technol. 2015, 46, 111–115. [Google Scholar] [CrossRef]
- García-Trenasa, T.; Lópeza, J.C.; Peña-García, A. Proposal to forest Alpine tunnels surroundings to enhance energy savings from the lighting installations. Towards a standard procedure. Tunn. Undergr. Space Technol. 2018, 78, 1–7. [Google Scholar] [CrossRef]
- Onaygil, S.; Guler, O.; Erkin, E. Determination of the effects of structural properties on tunnel lighting with examples from Turkey. Tunn. Undergr. Space Technol. 2003, 18, 85–91. [Google Scholar] [CrossRef]
- Cantisani, G.; D’Andrea, A.; Moretti, L. Natural lighting of road pre-tunnels: A methodology to assess the luminance on the pavement—Part I. Tunnelling and Underground Space Technology 2018, 73, 37–47. [Google Scholar] [CrossRef]
- Drakou, D.; Burattini, C.; Bisegna, F.; Gugliermetti, F. Study of a daylight ‘‘filter” zone in tunnels. In Proceedings of the IEEE 15th International Conference on Environment and Electrical Engineering (EEEIC), Rome, Italy, 10–13 June 2015; pp. 649–652. [Google Scholar]
- Drakou, D.; Celucci, L.; Burattini, C.; Nardecchia, F.; Gugliermetti, F. Study for optimizing the daylight ‘‘filter” in a pre-tunnel structure. In Proceedings of the IEEE 16th International Conference on Environment and Electrical Engineering (EEEIC), Florence, Italy, 7–10 June 2016; p. 4. [Google Scholar]
- Kontadakis, A.; Tsangrassoulis, A.; Doulos, L.; Zerefos, S. A Review of Light Shelf Designs for Daylit Environments. Sustainability 2018, 10, 71. [Google Scholar] [CrossRef]
- Tsangrassoulis, A.; Doulos, L.; Santamouris, M.; Fontoynont, M.; Maamari, F.; Wilson, M.; Jacobs, A.; Solomon, J.; Zimmerman, A.; Pohl, W.; et al. On the energy efficiency of a prototype hybrid daylighting system. Sol. Energy 2005, 79, 56–64. [Google Scholar] [CrossRef]
- Gil-Martín, L.; Peña-García, A.; Jiménez, A.; Hernández-Montes, E. Hernández-Montes. Study of light-pipes for the use of sunlight in road tunnels: From a scale model to real tunnels. Tunn. Undergr. Space Technol. 2014, 41, 82–87. [Google Scholar] [CrossRef]
- Peña-García, A.; Gil-Martín, L.; Hernández-Montes, E. Use of sunlight in road tunnels: An approach to the improvement of light-pipes’ efficacy through heliostats. Tunn. Undergr. Space Technol. 2016, 60, 135–140. [Google Scholar] [CrossRef]
- Gil-Martín, L.; Peña-García, A.; Hernández-Montes, E.; Espín-Estrella, A. Tension structures: A way towards sustainable lighting in road tunnels. Tunn. Undergr. Space Technol. 2011, 26, 223–227. [Google Scholar] [CrossRef]
- Peña-García, A.; Gómez-Lorente, D. Installation of solar panels in the surroundings of tunnel portals: A double-targeted strategy to decrease lighting requirements and consumption. Tunn. Undergr. Space Technol. 2020, 97, 103251. [Google Scholar] [CrossRef]
- Peña-García, A.; Gil-Martín, L. Study of pergolas for energy savings in road tunnels. Comparison with tension structures. Tunn. Undergr. Space Technol. 2013, 35, 172–177. [Google Scholar] [CrossRef]
- Gil-Martín, L.; Gómez-Guzmán, A.; Peña-García, A. Use of diffusers materials to improve the homogeneity of sunlight under pergolas installed in road tunnels portals for energy savings. Tunn. Undergr. Space Technol. 2015, 48, 123–128. [Google Scholar] [CrossRef]
- Salam, A.O.A.; Mezher, K. Energy saving in tunnels lighting using shading structures. In Proceedings of the 2014 International Renewable and Sustainable Energy Conference (IRSEC), Ouarzazate, Morocco, 17–19 October 2014; pp. 519–524, IRSEC 2014 7059842. [Google Scholar]
- Peña-García, A. The impact of lighting on drivers well-being and safety in very long underground roads: New challenges for new infrastructures. Tunn. Undergr. Space Technol. 2018, 80, 38–43. [Google Scholar] [CrossRef]
- Galatanu, C.D.; Canale, L.; Zissis, G.; Gherasim, I. Measuring the Driver Exposure to the Light Pollution Developing Experimental Setup. In Proceedings of the 2018 IEEE International Conference on Environment and Electrical Engineering and 2018 IEEE Industrial and Commercial Power Systems Europe (EEEIC/I&CPS Europe), Palermo, Italy, 12–15 June 2018; pp. 1–6. [Google Scholar] [CrossRef]
- Galatanu, C.D.; Canale, L.; Lucache, D.D.; Zissis, G. Reduction in Light Pollution by Measurements According to EN 13201 Standard. In Proceedings of the 2018 International Conference and Exposition on Electrical and Power Engineering (EPE), Iasi, Romania, 18–19 October 2018; pp. 1074–1079. [Google Scholar] [CrossRef]
- Lopez, J.; Peña-García, A. Determination of lighting and energy demands of road tunnels using vehicle based photographs of the portal gates: An accessible and safe tool for tunnel renewal and maintenance. Tunn. Undergr. Space Technol. 2018, 78, 8–15. [Google Scholar] [CrossRef]
- Li, S. An optimal model for tunnel lighting control systems. Tunn. Undergr. Space Technol. 2015, 49, 328–335. [Google Scholar] [CrossRef]
- Doulos, L.; Tsangrassoulis, A.; Kontaxis, P.; Kontadakis, A.; Topalis, F. Harvesting daylight with LED or T5 fluorescent lamps? The role of dimming. Energy Build. 2017, 140, 336–347. [Google Scholar] [CrossRef]
- Doulos, L.; Tsangrassoulis, A.; Topalis, F. Quantifying energy savings in daylight responsive systems: The role of dimming electronic ballasts. Energy Build. 2008, 40, 36–50. [Google Scholar] [CrossRef]
- Adam, G.; Kontaxis, P.; Doulos, L.; Madias, E.-N.; Bouroussis, C.; Topalis, F.V. Embedded microcontroller with a CCD camera as a digital lighting control system. Electronics 2019, 8, 33. [Google Scholar] [CrossRef]
- Doulos, L.; Tsangrassoulis, A.; Topalis, F. Multi-criteria decision analysis to select the optimum position and proper field of view of a photosensor. Energy Convers. Manag. 2014, 86, 1069–1077. [Google Scholar] [CrossRef]
- Topalis, F.V.; Doulos, L.T. Ambient Light Sensor Integration (Book Chapter). In Handbook of Advanced Lighting Technology; Sun, C.C., Zissis, G., Ma, R., Eds.; Springer: Cham, Switzerland, 2017; pp. 607–634. [Google Scholar] [CrossRef]
- Madias, E.-N.; Doulos, L.; Kontaxis, P.; Topalis, F. A decision support system for techno-economic evaluation of indoor lighting systems with LED luminaires. Oper. Res. 2019, 1–20. [Google Scholar] [CrossRef]
- Manolis, E.; Doulos, L.T.; Niavis, S.; Canale, L. The impact of energy efficiency indicators on the office lighting planning and its implications for office lighting market. In Proceedings of the 2019 IEEE International Conference on Environment and Electrical Engineering and 2019 IEEE Industrial and Commercial Power Systems Europe (EEEIC/I&CPS Europe), Genova, Italy, 11–14 June 2019; pp. 1–6. [Google Scholar] [CrossRef]
- Doulos, L.; Kontadakis, A.; Madias, E.; Sinou, M.; Tsangrassoulis, A. Minimizing energy consumption for artificial lighting in a typical classroom of a Hellenic public school aiming for near Zero Energy Building using LED DC luminaires and daylight harvesting systems. Energy Build. 2019, 194, 201–217. [Google Scholar] [CrossRef]
- Pachamanov, A.; Pachamanova, D. Optimization of the light distribution of luminaries for tunnel and street lighting. Eng. Optim. 2008, 40, 47–65. [Google Scholar] [CrossRef]
- Salata, F.; Golasi, I.; Bovenzi, S.; de Lieto Vollaro, E.; Pagliaro, F.; Cellucci, L.; Coppi, M.; Gugliermetti, F.; de Lieto Vollaro, A. Energy Optimization of Road Tunnel Lighting Systems. Sustainability 2015, 7, 9664–9680. [Google Scholar] [CrossRef]
- Salata, F.; Golasi, I.; Poliziani, A.; Futia, A.; de Lieto Vollaro, E.; Coppi, M.; de Lieto Vollaro, A. Management Optimization of the Luminous Flux Regulation of a Lighting System in Road Tunnels. A First Approach to the Exertion of Predictive Control Systems. Sustainability 2016, 8, 1092. [Google Scholar] [CrossRef]
- Doulos, L.T.; Sioutis, I.; Tsangrassoulis, A.; Canale, L.; Faidas, K. Minimizing lighting consumption in existing tunnels using a no-cost fine-tuning method for switching lighting stages according revised luminance levels. In Proceedings of the 2019 IEEE International Conference on Environment and Electrical Engineering and 2019 IEEE Industrial and Commercial Power Systems Europe (EEEIC/I&CPS Europe), Genova, Italy, 11–14 June 2019; pp. 1–6. [Google Scholar] [CrossRef]
- RELUX Tunnel Lighting Simulation Tool. Available online: https://reluxnet.relux.com/en/ (accessed on 28 February 2020).
- Rigamonti, L.; Grosso, M.; Giugliano, M. Life cycle assessment for optimising the level of separated collection in integrated MSW management systems. Waste Manag. 2009, 29, 934–944. [Google Scholar] [CrossRef]
- Kourkoumpas, D.-S.; Karellas, S.; Kouloumoundras, S.; Koufodimos, G.; Grammelis, P.; Kakaras, E. Comparison of Waste-to-Energy Processes by Means of Life Cycle Analysis Principles regarding the Global Warming Potential Impact: Applied Case Studies in Greece, France and Germany. Waste Biomass Valorization 2015, 6, 605–621. [Google Scholar] [CrossRef]
- Greek Energy Efficiency Regulation of Buildings; Journal of the Government of the Hellenic Republic (ΔΕΠΕΑ/οικ.178581): Athens, Greece, 2017.
- International Commission on Illumination. Technical Committee 4-53 (2020). Tunnel Lighting Evolution. Available online: http://www.cie.co.at/technicalcommittees/tunnel-lighting-evolution (accessed on 28 February 2020).
- Wojnicki, I.; Kotulski, L. Empirical Study of How Traffic Intensity Detector Parameters Influence Dynamic Street Lighting Energy Consumption: A Case Study in Krakow, Poland. Sustainability 2018, 10, 1221. [Google Scholar] [CrossRef]
- Wojnicki, I.; Ernst, S.; Kotulski, L. Economic Impact of Intelligent Dynamic Control in Urban Outdoor Lighting. Energies 2016, 9, 314. [Google Scholar] [CrossRef]
- Shahzad, G.; Yang, H.; Ahmad, A.W.; Lee, C.; Gul, S.; Heekwon, Y.; Chankil, L. Energy-Efficient Intelligent Street Lighting System Using Traffic-Adaptive Control. IEEE Sens. J. 2016, 16, 5397–5405. [Google Scholar] [CrossRef]
- Wojnicki, I.; Komnata, K.; Kotulski, L. Comparative Study of Road Lighting Efficiency in the Context of CEN/TR 13201 2004 and 2014 Lighting Standards and Dynamic Control. Energies 2019, 12, 1524. [Google Scholar] [CrossRef]
- Sȩdziwy, A. Sustainable Street Lighting Design Supported by Hypergraph-Based Computational Model. Sustainability 2016, 8, 13. [Google Scholar] [CrossRef]
- Lau, S.P.; Merrett, G.V.; Weddell, A.S.; White, N.M. A traffic-aware street lighting scheme for Smart Cities using autonomous networked sensors. Comput. Electr. Eng. 2015, 45, 192–207. [Google Scholar] [CrossRef]
- Nellore, K.; Hancke, G.P. A Survey on Urban Traffic Management System Using Wireless Sensor Networks. Sensors 2016, 16, 157. [Google Scholar] [CrossRef] [PubMed]
- Vaaja, M.; Kurkela, M.; Maksimainen, M.; Virtanen, J.; Kukko, A.; Lehtola, V.V.; Hyyppä, J.; Hyyppä, H. Mobile mapping of night-time road environment lighting conditions. Photogramm. J. Finl. 2018, 26, 1–17. [Google Scholar] [CrossRef]
- Kurkela, M.; Maksimainen, M.; Vaaja, M.T.; Virtanen, J.; Kukko, A.; Hyyppä, J.; Hyyppä, H. Camera preparation and performance for 3D luminance mapping of road environments. Photogramm. J. Finl. 2017, 25, 1–23. [Google Scholar] [CrossRef]
- Vaaja, M.T.; Kurkela, M.; Virtanen, J.-P.; Maksimainen, M.; Hyyppä, H.; Hyyppä, J.; Tetri, E. Luminance-Corrected 3D Point Clouds for Road and Street Environments. Remote Sens. 2015, 7, 11389–11402. [Google Scholar] [CrossRef]
- Wojnicki, I.; Kotulski, L.; Sędziwy, A.; Ernst, S. Application of Distributed Graph Transformations to Automated Generation of Control Patterns for Intelligent Lighting Systems. J. Comput. Sci. 2017, 23, 20–30. [Google Scholar] [CrossRef]
- Wojnicki, I.; Kotulski, L. Improving Control Efficiency of Dynamic Street Lighting by Utilizing the Dual Graph Grammar Concept. Energies 2018, 11, 402. [Google Scholar] [CrossRef]
- Sędziwy, A.; Kotulski, L. Multi-agent System Supporting Automated GIS-based Photometric Computations. Procedia Comput. Sci. 2016, 80, 824–833. [Google Scholar] [CrossRef]


| Tunnel | Length (m) | Length of Entrance Zone (m) | Length of Interior Zone (m) | Threshold Luminance Lth (cd/m2) |
|---|---|---|---|---|
| 1a | 702.1 | 310.7 | 391.4 | 222 |
| 1b | 656.4 | 308.1 | 348.3 | 175 |
| 2a | 2474.7 | 312.0 | 2162.7 | 280 |
| 2b | 2457.6 | 312.0 | 2145.6 | 280 |
| 3a | 253.4 | 252.0 | 1.4 | 244 |
| 3b | 253.4 | 250.7 | 2.7 | 290 |
| 4a | 294.0 | 280.9 | 13.1 | 340 |
| 4b | 286.7 | 286.7 | 0.0 | 194 |
| 5a | 272.4 | 272.4 | 0.0 | 216 |
| 5b | 273.0 | 268.5 | 4.5 | 303 |
| 6a | 510.3 | 318.3 | 192.0 | 215 |
| Tunnel | Installed Power (kW) | Power density (W/m2) | kW/km | Number of Luminaires | Luminaire/m | Length (m) |
|---|---|---|---|---|---|---|
| 1a | 123.8 | 53.1 | 398.4 | 305 | 0.98 | 310.7 |
| 1b | 125.0 | 54.1 | 405.6 | 305 | 0.99 | 308.1 |
| 2a | 126.3 | 54.0 | 404.8 | 306 | 0.98 | 312.0 |
| 2b | 126.5 | 54.1 | 405.6 | 310 | 0.99 | 312.0 |
| 3a | 97.0 | 51.3 | 384.8 | 222 | 0.88 | 252.0 |
| 3b | 96.8 | 51.5 | 386.0 | 221 | 0.88 | 250.7 |
| 4a | 134.1 | 63.7 | 477.4 | 290 | 1.03 | 280.9 |
| 4b | 99.6 | 46.3 | 347.4 | 235 | 0.82 | 286.7 |
| 5a | 110.2 | 54.0 | 404.6 | 262 | 0.96 | 272.4 |
| 5b | 123.2 | 61.2 | 458.8 | 334 | 1.24 | 268.5 |
| 6a | 127.9 | 53.6 | 401.7 | 312 | 0.98 | 318.3 |
| Tunnel | Installed Power (kW) | Power Density (W/m2) | kW/km | Number of Luminaires | Luminaire/m | Length (m) |
|---|---|---|---|---|---|---|
| 1a | 30.2 | 5.7 | 43.1 | 160 | 0.23 | 702.1 |
| 1b | 24.2 | 4.9 | 36.8 | 133 | 0.20 | 656.4 |
| 2a | 144.5 | 7.8 | 58.4 | 744 | 0.30 | 2474.7 |
| 2b | 129.4 | 7.0 | 52.6 | 630 | 0.26 | 2457.6 |
| 3a | 12.2 | 6.4 | 48.3 | 54 | 0.21 | 253.4 |
| 3b | 12.2 | 6.4 | 48.3 | 54 | 0.21 | 253.4 |
| 4a | 20.1 | 9.1 | 68.4 | 82 | 0.28 | 294.0 |
| 4b | 15.5 | 7.2 | 54.0 | 64 | 0.22 | 286.7 |
| 5a | 3.2 | 1.6 | 11.9 | 26 | 0.10 | 272.4 |
| 5b | 3.1 | 1.5 | 11.2 | 24 | 0.09 | 273.0 |
| 6a | 13.7 | 3.6 | 26.8 | 80 | 0.16 | 510.3 |
| Tunnel | 1a | 1b | 2a | 2b | 3a | 3b |
| Driving direction | East Southeast | South West | East Southeast | West | East Northeast | West |
| γ (%) of sky | 7.2% | 0% | 0.0% | 0% | 10.92% | 14.9% |
| Lc (Sky) (kcd/m2) | 13 | 14 | 13 | 12 | 11 | 12 |
| ρ (%) of road | 42.8% | 40.4% | 40.4% | 41.8% | 38.73% | 39.4% |
| LR (Road) (kcd/m2) | 4.25 | 4.5 | 4.25 | 4 | 3.75 | 4 |
| ε (%) of surrounding – vegetation | 37.1% | 50.8% | 51.0% | 50.0% | 41.46% | 36.0% |
| LE (Vegetation) (kcd/m2) | 2 | 2 | 2 | 2 | 2 | 2 |
| ε (%) of surrounding – buildings | 3.7% | 2.8% | 2.7% | 2.5% | 3% | 4.1% |
| LE (Buildings) (kcd/m2) | 5.5 | 5 | 5.5 | 6 | 6.5 | 6 |
| ε (%) of surrounding - rock | 0.0% | 0.0% | 0.0% | 0.0% | 0% | 0.0% |
| LE (Rock) (kcd/m2) | 1.75 | 1.5 | 1.75 | 2 | 2.25 | 2 |
| Tunnel | 4a | 4b | 5a | 5b | 6a | - |
| Driving direction | East Northeast | West Southwest | East Southeast | West | East Southeast | - |
| γ (%) of sky | 21.5% | 0.0% | 0.0% | 12.8% | 3.4% | - |
| Lc (Sky) (kcd/m2) [31] | 11 | 13 | 13 | 12 | 13 | - |
| ρ (%) of road | 42.2% | 41.3% | 37.8% | 37.8% | 37.8% | - |
| LR (Road) (kcd/m2) [31] | 3.75 | 4.25 | 4.25 | 4 | 4.25 | - |
| ε (%) of surrounding – vegetation | 10.5% | 32.8% | 27.0% | 12.3% | 32.3% | - |
| LE (Vegetation) (kcd/m2) [31] | 2 | 2 | 2 | 2 | 2 | - |
| ε (%) of surrounding – buildings | 18.3% | 20.0% | 26.4% | 27.1% | 14.7% | - |
| LE (Buildings) (kcd/m2) [31] | 6.5 | 5.5 | 5.5 | 6 | 5.5 | - |
| ε (%) of surrounding - rock | 0.0% | 0.0% | 0.0% | 0.0% | 0.0% | - |
| LE (Rock) (kcd/m2) [31] | 2.25 | 1.75 | 1.75 | 2 | 1.75 | - |
| Tunnel | L20 (cd/m2) (1) | k Factor [31] (2) | Lth‘ (cd/m2) (3) = (1) · (2) |
|---|---|---|---|
| 1a | 3704 | 0.040 | 148 |
| 1b | 2970 | 0.039 | 116 |
| 2a | 2885 | 0.039 | 113 |
| 2b | 2824 | 0.040 | 113 |
| 3a | 3684 | 0.038 | 140 |
| 3b | 4326 | 0.040 | 173 |
| 4a | 5354 | 0.038 | 203 |
| 4b | 3511 | 0.041 | 144 |
| 5a | 3598 | 0.040 | 144 |
| 5b | 4912 | 0.040 | 196 |
| 6a | 3502 | 0.038 | 133 |
| Tunnel Class | Stopping Distance SD (m) | ||
|---|---|---|---|
| 60 | 100 | 160 | |
| 2 | 0.03 | 0.04 | 0.05 |
| Tunnel | Lighting Stage | Light Output | Switching on/off, L20 Luminance Signal for SCADA (cd/m2) | Power of Luminaires in Operation per Stage (kW) | Power of Luminaires per Stage (kW) | Luminaires in Operation per Stage | Luminaires per Stage |
|---|---|---|---|---|---|---|---|
| S1 | 100% | 1530 | 123.8 | 56.5 | 305 | 123 | |
| S2 | 50% | 630 | 67.3 | 34.0 | 182 | 80 | |
| 1a | S3 | 20% | 225 | 33.4 | 21.5 | 102 | 51 |
| S4 | 6% | 90 | 11.8 | 6.8 | 51 | 25 | |
| S5 | 3% | 27 | 5.0 | 5.0 | 26 | 26 | |
| S1 | 100% | 1530 | 125.0 | 57.2 | 305 | 125 | |
| S2 | 50% | 630 | 67.7 | 33.5 | 180 | 78 | |
| 1b | S3 | 20% | 225 | 34.3 | 21.8 | 102 | 50 |
| S4 | 6% | 90 | 12.4 | 7.3 | 52 | 25 | |
| S5 | 3% | 27 | 5.2 | 5.2 | 27 | 27 | |
| S1 | 100% | 1530 | 126.3 | 60.8 | 306 | 135 | |
| S2 | 50% | 630 | 65.5 | 34.3 | 171 | 80 | |
| 2a | S3 | 20% | 225 | 31.2 | 23.6 | 91 | 54 |
| S4 | 6% | 90 | 7.6 | 2.5 | 37 | 10 | |
| S5 | 3% | 27 | 5.2 | 5.2 | 27 | 27 | |
| S1 | 100% | 1530 | 126.5 | 58.1 | 310 | 127 | |
| S2 | 50% | 630 | 68.5 | 32.8 | 183 | 77 | |
| 2b | S3 | 20% | 225 | 35.6 | 23.1 | 106 | 53 |
| S4 | 6% | 90 | 12.5 | 7.6 | 53 | 27 | |
| S5 | 3% | 27 | 5.0 | 5.0 | 26 | 26 | |
| S1 | 100% | 1180 | 97.0 | 50.4 | 222 | 107 | |
| S2 | 50% | 620 | 46.6 | 27.7 | 115 | 59 | |
| 3a | S3 | 20% | 420 | 18.9 | 14.7 | 56 | 32 |
| S4 | 6% | 190 | 4.2 | 0.3 | 24 | 2 | |
| S5 | 3% | 90 | 3.9 | 3.9 | 22 | 22 | |
| S1 | 100% | 1200 | 96.8 | 49.7 | 221 | 105 | |
| S2 | 50% | 850 | 47.0 | 27.7 | 116 | 59 | |
| 3b | S3 | 20% | 420 | 19.4 | 15.2 | 57 | 33 |
| S4 | 6% | 260 | 4.2 | 0.3 | 24 | 2 | |
| S5 | 3% | 90 | 3.9 | 3.9 | 22 | 22 | |
| S1 | 100% | 2370 | 134.1 | 56.5 | 290 | 118 | |
| S2 | 50% | 1100 | 77.6 | 47.8 | 172 | 100 | |
| 4a | S3 | 20% | 600 | 29.8 | 21.4 | 72 | 45 |
| S4 | 6% | 200 | 8.4 | 5.6 | 27 | 12 | |
| S5 | 3% | 90 | 2.8 | 2.8 | 15 | 15 | |
| S1 | 100% | 2000 | 99.6 | 49.1 | 235 | 105 | |
| S2 | 50% | 1000 | 50.5 | 29.5 | 130 | 66 | |
| 4b | S3 | 20% | 650 | 20.9 | 16.0 | 64 | 36 |
| S4 | 6% | 410 | 4.9 | 0.7 | 28 | 4 | |
| S5 | 3% | 270 | 4.3 | 4.3 | 24 | 24 | |
| S1 | 100% | 1800 | 110.2 | 51.6 | 262 | 111 | |
| S2 | 50% | 850 | 58.6 | 30.4 | 151 | 67 | |
| 5a | S3 | 20% | 510 | 28.2 | 17.6 | 84 | 39 |
| S4 | 6% | 360 | 10.6 | 6.7 | 45 | 23 | |
| S5 | 3% | 290 | 4.0 | 4.0 | 22 | 22 | |
| S1 | 100% | 1480 | 147.8 | 59.3 | 334 | 127 | |
| S2 | 50% | 720 | 88.5 | 50.8 | 207 | 110 | |
| 5b | S3 | 20% | 480 | 37.7 | 22.9 | 97 | 50 |
| S4 | 6% | 230 | 14.8 | 9.2 | 47 | 24 | |
| S5 | 3% | 140 | 5.6 | 5.6 | 23 | 23 | |
| S1 | 100% | 1580 | 127.9 | 57.1 | 312 | 125 | |
| S2 | 50% | 830 | 70.7 | 35.2 | 187 | 82 | |
| 6a | S3 | 20% | 370 | 35.5 | 23.1 | 105 | 53 |
| S4 | 6% | 280 | 12.4 | 7.3 | 52 | 26 | |
| S5 | 3% | 100 | 5.2 | 5.2 | 26 | 26 |
| Tun. | Stage | Lth (cd/m2) | Lth’ from Revised CIE Curve (cd/m2) | OLTP due to New Luminance Demand, (%) | Light Output Levels for Existing Switching | L20 Triggering Levels for SCADA (cd/m2) | Light Output Levels for Proposed Switching | New L20 Triggering Levels for SCADA (cd/m2) |
|---|---|---|---|---|---|---|---|---|
| S1 | 222 | 148 | 150% | 50% | 1530 | 75% | 2780 | |
| S2 | 111 | 74 | 75% | 20% | 630 | 30% | 1112 | |
| 1a | S3 | 44 | 30 | 30% | 6% | 225 | 9% | 334 |
| S4 | 13 | 9 | 9% | 3% | 90 | 5% | 167 | |
| S5 | 7 | 4 | 5% | 0% | 27 | 0% | 0 | |
| S1 | 175 | 116 | 151% | 50% | 1530 | 75% | 2238 | |
| S2 | 87 | 58 | 75% | 20% | 630 | 30% | 895 | |
| 1b | S3 | 35 | 23 | 30% | 6% | 225 | 9% | 269 |
| S4 | 10 | 7 | 9% | 3% | 90 | 5% | 134 | |
| S5 | 5 | 3 | 5% | 0% | 27 | 0% | 0 | |
| S1 | 280 | 113 | 249% | 50% | 1530 | No use | No use | |
| S2 | 140 | 56 | 124% | 20% | 630 | 50% | 1436 | |
| 2a | S3 | 56 | 23 | 50% | 6% | 225 | 15% | 431 |
| S4 | 17 | 7 | 15% | 3% | 90 | 7% | 215 | |
| S5 | 8 | 3 | 7% | 0% | 27 | 0% | 0 | |
| S1 | 280 | 113 | 248% | 50% | 1530 | No use | No use | |
| S2 | 140 | 57 | 124% | 20% | 630 | 50% | 1400 | |
| 2b | S3 | 56 | 23 | 50% | 6% | 225 | 15% | 420 |
| S4 | 17 | 7 | 15% | 3% | 90 | 7% | 210 | |
| S5 | 8 | 3 | 7% | 0% | 27 | 0% | 0 | |
| S1 | 244 | 140 | 174% | 50% | 1180 | 87% | 3209 | |
| S2 | 122 | 70 | 87% | 20% | 620 | 35% | 1416 | |
| 3a | S3 | 49 | 25 | 35% | 6% | 420 | 10% | 425 |
| S4 | 15 | 8 | 10% | 3% | 190 | 5% | 212 | |
| S5 | 7 | 4 | 5% | 0% | 90 | 0% | 0 | |
| S1 | 290 | 173 | 168% | 50% | 1200 | 84% | 3626 | |
| S2 | 145 | 82 | 88% | 20% | 850 | 34% | 1451 | |
| 3b | S3 | 58 | 33 | 29% | 6% | 420 | 10% | 435 |
| S4 | 17 | 10 | 11% | 3% | 260 | 5% | 218 | |
| S5 | 9 | 5 | 4% | 0% | 90 | 0% | 0 | |
| S1 | 340 | 203 | 167% | 50% | 2370 | 84% | 4476 | |
| S2 | 170 | 102 | 84% | 20% | 1100 | 33% | 1791 | |
| 4a | S3 | 68 | 41 | 33% | 6% | 600 | 10% | 537 |
| S4 | 20 | 12 | 10% | 3% | 200 | 5% | 269 | |
| S5 | 10 | 6 | 5% | 0% | 90 | 0% | 0 | |
| S1 | 194 | 144 | 135% | 50% | 2000 | 67% | 2366 | |
| S2 | 97 | 72 | 67% | 20% | 1000 | 27% | 947 | |
| 4b | S3 | 39 | 29 | 27% | 6% | 650 | 8% | 284 |
| S4 | 12 | 9 | 8% | 3% | 410 | 4% | 142 | |
| S5 | 6 | 4 | 4% | 0% | 270 | 0% | 0 | |
| S1 | 216 | 144 | 150% | 50% | 1800 | 75% | 2695 | |
| S2 | 108 | 72 | 75% | 20% | 850 | 30% | 1078 | |
| 5a | S3 | 43 | 29 | 30% | 6% | 510 | 9% | 323 |
| S4 | 13 | 9 | 9% | 3% | 360 | 4% | 151 | |
| S5 | 6 | 4 | 4% | 0% | 290 | 0% | 0 | |
| S1 | 303 | 197 | 154% | 50% | 1480 | 77% | 3787 | |
| S2 | 152 | 98 | 77% | 20% | 720 | 31% | 1515 | |
| 5b | S3 | 61 | 39 | 31% | 6% | 480 | 9% | 454 |
| S4 | 18 | 12 | 9% | 3% | 230 | 6% | 296 | |
| S5 | 12 | 8 | 6% | 0% | 140 | 0% | 0 | |
| S1 | 215 | 133 | 161% | 50% | 1580 | 81% | 2826 | |
| S2 | 107 | 57 | 81% | 20% | 830 | 32% | 1131 | |
| 6a | S3 | 43 | 23 | 32% | 6% | 370 | 10% | 339 |
| S4 | 13 | 7 | 10% | 3% | 280 | 5% | 170 | |
| S5 | 6 | 3 | 5% | 0% | 100 | 0% | 0 |
| Tunnel | Installed Power (kW) | Power Density (W/m2) | kW/km | Number of Luminaires | Luminaire/m | Length (m) |
|---|---|---|---|---|---|---|
| 1a | 78.8 | 33.8 | 253.6 | 207 | 0.67 | 310.7 |
| 1b | 60.5 | 26.2 | 196.5 | 165 | 0.54 | 308.1 |
| 2a | 64.3 | 27.5 | 206.1 | 175 | 0.56 | 312.0 |
| 2b | 61.8 | 26.4 | 198.0 | 168 | 0.54 | 312.0 |
| 3a | 72.3 | 38.2 | 286.8 | 186 | 0.74 | 252.0 |
| 3b | 78.3 | 41.6 | 312.3 | 196 | 0.78 | 250.7 |
| 4a | 72.2 | 34.3 | 257.0 | 190 | 0.68 | 280.9 |
| 4b | 68.4 | 31.8 | 238.5 | 179 | 0.62 | 286.7 |
| 5a | 66.3 | 32.4 | 243.2 | 171 | 0.63 | 272.4 |
| 5b | 77.1 | 38.3 | 287.0 | 195 | 0.73 | 268.5 |
| 6a | 66.4 | 27.8 | 208.7 | 186 | 0.58 | 318.3 |
| Tunnel | Installed Power (kW) | Power Density (W/m2) | kW/km | Number of Luminaires | Luminaire/m | Length (m) |
|---|---|---|---|---|---|---|
| 1a | 31.3 | 13.4 | 100.9 | 124 | 0.40 | 310.7 |
| 1b | 22.9 | 9.9 | 74.3 | 94 | 0.31 | 308.1 |
| 2a | 22.5 | 9.6 | 72.0 | 91 | 0.29 | 312.0 |
| 2b | 23.2 | 9.9 | 74.4 | 96 | 0.31 | 312.0 |
| 3a | 26.9 | 14.2 | 106.8 | 104 | 0.41 | 252.0 |
| 3b | 36.9 | 19.6 | 147.1 | 136 | 0.54 | 250.7 |
| 4a | 34.8 | 16.5 | 124.0 | 133 | 0.47 | 280.9 |
| 4b | 28.2 | 13.1 | 98.5 | 110 | 0.38 | 286.7 |
| 5a | 26.7 | 13.1 | 98.0 | 104 | 0.38 | 272.4 |
| 5b | 36.6 | 18.2 | 136.3 | 137 | 0.51 | 268.5 |
| 6a | 23.7 | 9.9 | 74.5 | 98 | 0.31 | 318.3 |
| Lighting Stage | Energy Consumption (kWh) | |||||||
|---|---|---|---|---|---|---|---|---|
| Existing Switching | Proposed Switching | Existing Switching | Proposed Switching | Existing Switching | Proposed Switching | Existing Switching | Proposed Switching | |
| Tunnel | 1a | 1a | 1b | 1b | 2a | 2a | 2b | 2b |
| S1 | 4333 | 743 | 6000 | 2500 | 1389 | 0 | 2404 | 0 |
| S2 | 2221 | 3432 | 1286 | 2843 | 1769 | 786 | 1370 | 1507 |
| S3 | 568 | 835 | 720 | 823 | 842 | 1123 | 1104 | 926 |
| S4 | 35 | 71 | 25 | 37 | 160 | 137 | 225 | 300 |
| S5 | 30 | 25 | 21 | 26 | 21 | 125 | 15 | 95 |
| Total | 7187 | 5106 | 8052 | 6230 | 4181 | 2171 | 5117 | 2828 |
| Tunnel | 3a | 3a | 3b | 3b | 4a | 4a | 4b | 4b |
| S1 | 2910 | 0 | 4259 | 0 | 0 | 0 | 5080 | 4183 |
| S2 | 1025 | 1072 | 423 | 1457 | 1940 | 310 | 1364 | 1313 |
| S3 | 246 | 794 | 446 | 873 | 447 | 1162 | 481 | 690 |
| S4 | 76 | 76 | 29 | 42 | 109 | 76 | 0 | 0 |
| S5 | 20 | 27 | 23 | 35 | 6 | 8 | 0 | 0 |
| Total | 4276 | 1969 | 5181 | 2407 | 2502 | 1557 | 6924 | 6186 |
| Tunnel | 5a | 5a | 5b | 5b | 6a | 6a | - | - |
| S1 | 3857 | 992 | 296 | 0 | 4604 | 2942 | - | - |
| S2 | 3282 | 3868 | 1416 | 0 | 919 | 1485 | - | - |
| S3 | 226 | 677 | 302 | 1056 | 426 | 604 | - | - |
| S4 | 0 | 0 | 178 | 104 | 0 | 37 | - | - |
| S5 | 0 | 0 | 50 | 67 | 21 | 16 | - | - |
| Total | 7364 | 5536 | 2241 | 1226 | 5970 | 5083 | - | - |
| Scenario | Description | Energy Consumption (kWh) | CO2 Emission (tn) | Energy Savings (%) | ||
|---|---|---|---|---|---|---|
| Due to New Lth’ | Due to LED Luminaires | Total | ||||
| A | Switching control with existing Lth | 59,507 | 63.0 | - | - | - |
| B | Switching control with newly calculated Lth’ | 40,784 | 43.2 | 31.5% | - | 31.5% |
| C1 | LED Retrofit 10% step control dimming (Lth) | 23,792 | 25.2 | - | 56.9% | 56.9% |
| D1 | LED Retrofit continuous dimming (Lth) | 22,659 | 24.0 | - | 61.9% | 61.9% |
| C2 | LED Retrofit 10% step control dimming (Lth’) | 9483 | 10.0 | 22.9% | 56.9% | 79.8% |
| D2 | LED Retrofit continuous dimming (Lth’) | 9032 | 9.6 | 22.9% | 61.9% | 84.8% |
© 2020 by the authors. Licensee MDPI, Basel, Switzerland. This article is an open access article distributed under the terms and conditions of the Creative Commons Attribution (CC BY) license (http://creativecommons.org/licenses/by/4.0/).
Share and Cite
Doulos, L.T.; Sioutis, I.; Tsangrassoulis, A.; Canale, L.; Faidas, K. Revision of Threshold Luminance Levels in Tunnels Aiming to Minimize Energy Consumption at No Cost: Methodology and Case Studies. Energies 2020, 13, 1707. https://doi.org/10.3390/en13071707
Doulos LT, Sioutis I, Tsangrassoulis A, Canale L, Faidas K. Revision of Threshold Luminance Levels in Tunnels Aiming to Minimize Energy Consumption at No Cost: Methodology and Case Studies. Energies. 2020; 13(7):1707. https://doi.org/10.3390/en13071707
Chicago/Turabian StyleDoulos, Lambros T., Ioannis Sioutis, Aris Tsangrassoulis, Laurent Canale, and Kostantinos Faidas. 2020. "Revision of Threshold Luminance Levels in Tunnels Aiming to Minimize Energy Consumption at No Cost: Methodology and Case Studies" Energies 13, no. 7: 1707. https://doi.org/10.3390/en13071707
APA StyleDoulos, L. T., Sioutis, I., Tsangrassoulis, A., Canale, L., & Faidas, K. (2020). Revision of Threshold Luminance Levels in Tunnels Aiming to Minimize Energy Consumption at No Cost: Methodology and Case Studies. Energies, 13(7), 1707. https://doi.org/10.3390/en13071707