Abstract
This study focuses on the nanostructure of shale samples with type III kerogen and its effect on methane adsorption capacity. The composition, pore size distribution, and methane adsorption capacities of 12 shale samples were analyzed by using the high-pressure mercury injection experiment, low-temperature N2/CO2 adsorption experiments, and the isothermal methane adsorption experiment. The results show that the total organic carbon (TOC) content of the 12 shale samples ranges from 0.70% to ~35.84%. In shales with type III kerogen, clay minerals and organic matter tend to be deposited simultaneously. When the TOC content is higher than 10%, the clay minerals in these shale samples contribute more than 70% of the total inorganic matter. The CO2 adsorption experimental results show that micropores in shales with type III kerogen are mainly formed in organic matter. However, mesopores and macropores are significantly affected by the contents of clay minerals and quartz. The methane isothermal capacity experimental results show that the Langmuir volume, indicating the maximum methane adsorption capacity, of all the shale samples is between 0.78 cm3/g and 9.26 cm3/g. Moreover, methane is mainly adsorbed in micropores and developed in organic matter, whereas the influence of mesopores and macropores on the methane adsorption capacity of shale with type III kerogen is small. At different stages, the influencing factors of methane adsorption capacity are different. When the TOC content is <1.4% or >4.5%, the methane adsorption capacity is positively correlated with the TOC content. When the TOC content is in the range of 1.4–4.5%, clay minerals have obviously positive effects on the methane adsorption capacity.
1. Introduction
Shale gas is becoming one of the most important natural gas resources in the US, China, and other countries [1,2]. Shale gas is mainly composed of adsorbed gas and free gas [2,3], and adsorbed gas is mainly located on the pore surface of shale [4,5]. The pore system in shale reservoirs is quite complex because of its heterogeneity and multiple scale effect [6,7,8,9,10]. It has been proven that there are large amounts of micropores (<2 nm), mesopores (2–50 nm), and macropores (>50 nm) in organic shale [11]. Among the various pores, pores with diameters smaller than 10 nm are considered to contribute most of the total surface area [12,13,14]. Moreover, based on the formation types, pores in shale can be mainly divided into organic pores, clay pores, interparticle pores, and intraparticle mineral pores [15], and organic pores are proven to contribute the largest proportion of the total pore volume and total surface area [16,17].
As adsorbed gas is considered to be adsorbed on the surface of pores in shale [4,5], the nanopore structure and shale composition have significant effects on the methane adsorption capacity [18,19,20]. It has been proven that a higher organic matter content brings a larger surface area and a larger methane adsorption capacity [21,22,23,24,25]. With increasing total organic carbon (TOC) content, the methane adsorption capacity increases linearly [18,21,26,27,28,29,30]. Comparably, related studies have found that quartz and carbonate have a negative effect on the methane adsorption capacity in shale [25,27,31]. Currently, it is still debated whether clay minerals have a positive effect on methane adsorption capacity in shale. Some studies have found that with increasing the clay mineral content, the methane adsorption capacity substantially increases, especially in the low TOC shales [25,29,32]. However, other studies proposed that clay minerals have a weak [12,23,28,30] or even negative effect on methane adsorption capacity [21,33,34].
Shales can be divided into three types based on their depositional environments: marine facies shale, marine-terrigenous facies shale, and lacustrine facies shale [35]. Marine-terrigenous facies shale is believed to have a large amount of shale gas resources [35]. Currently, the most successful shale gas development is mainly in marine facies shales, such as the Longmaxi formation shale in South China [8,21,30,34], the Marcellus shale [8,21,30,34,36,37], and the Barnett shale in the US [38]. The organic matter type of marine shales is type I or type II [39,40,41]. Additionally, research on shale gas reservoirs has mainly focused on organic shale with type I or type II kerogen [42,43,44]. A comparison of the shale with type III kerogen and the shale with type I kerogen shows that the sedimentary environment and organic matter are different, causing the differences in the nanostructure and methane adsorption capacity [45]. Based on previous studies, type III kerogen has a larger O/C ratio and a smaller H/C ratio than type I or type II kerogen [46]. In addition, due to the different sedimentary environments, shale with type III kerogen has a higher clay content and lower quartz content than shales with type I and type II kerogens [46].
As the mineral composition and organic matter of shale with type III kerogen are different from those of shale with types I and II kerogens [46], the pore structure and methane adsorption behavior of shale with type III kerogen are different from those of shale samples with type I or type II kerogen [26,45]. Although the pore structure and methane adsorption behavior of shale samples with type I and type II kerogen have been well studied [42,43,44], those of shale samples with type III kerogen still need further study. This study aims to investigate how composition and nanopore structure affect the methane adsorption capacity in shale with type III kerogen. Twelve shale samples with type III kerogen were collected from a sample well in China. A high-pressure mercury injection experiment, a low-pressure N2 adsorption experiment, and a low-pressure CO2 adsorption experiment were used to characterize the nanopore structure of the shale samples. In addition, the methane adsorption capacity of these shale samples was obtained by using the methane adsorption isothermal experiment.
2. Samples and Experiment
2.1. Sample Information
In this study, 12 shale samples were collected from the same well in the Huoxi coal field of Shanxi Province, China, and these shale samples were from the Carboniferous–Permian strata. All the shale samples had similar thermal maturities, and the reflectance values (Ro) were approximately 1.3%. In addition, the organic matter in these shale samples is type III. Their TOC content, mineral components, and clay components are listed in Table 1.

Table 1.
Sample information.
The TOC content of the shale samples ranges from 0.70% to 35.84%. Because of the higher TOC content, samples T-11 and T-12 are regarded as carbonaceous shale. It is obvious that quartz and clay minerals were the main mineral components of the samples. The quartz content ranged from 20% to 44%, with an average of 32%, and the total clay mineral content ranged from 47% to 73%, with an average of 62.5%. The clay minerals of all the samples were mainly composed of illite, kaolinite, and mixed-layer illite/smectite.
2.2. Experiments
2.2.1. Low-Temperature Carbon Dioxide Adsorption Experiment
The low-temperature CO2 adsorption experiment was conducted at 0 °C using MicroActive for ASAP 2460 Version 2.01 from Micromeritics. In this experiment, the particle size of these shale samples was 60–80 mesh with a mass of 1.4 g to 1.5 g. All samples were dried and degassed before the analysis. During the experiment, the equilibration interval was 45 s. The CO2 adsorption analysis was mainly used to characterize the micropores in the shale reservoir [11]. All the shale samples’ pore characteristics (0.4–1.1 nm) were obtained by using a density functional theory (DFT) model [47].
2.2.2. Low-Temperature Nitrogen Adsorption Experiment
The low-temperature N2 adsorption experiment was conducted at −196 °C using MicroActive for ASAP 2460 Version 2.01 from Micromeritics following the China standard GB/T 19587-2004. This is suitable to interpret the mesopore structure [11]. The shale samples were pulverized to 60–80 mesh and then dried and degassed before the experiment. In this experiment, the sample masses were about 1.5 g, and the equilibration interval was 30 s. The duration of each experiment was different: the longest experiment was approximately 20 h, while the shortest experiment was approximately 7.5 h. The pore surface (2–200 nm) areas were calculated from the adsorption curves by employing the Brunauer-Emmett-Teller (BET) model [48], and the pore volumes (2–200 nm) were also obtained from the adsorption curves through the Barrett-Joyner-Halenda (BJH) model [49].
2.2.3. High-Pressure Mercury Injection Experiment (HPMI)
The high-pressure mercury injection (HPMI) experiment was performed by using Autopore 9500 from Micromeritics to measure the pore size distribution (5–100,000 nm) according to the China standard GB/T 21650.1-2008. The highest pressure in the HPMI experiment was 230 MPa. Before the experiment, all the shale samples needed to be crushed to about 1 cm3 in volume and dried at 70 °C. It should be noted that the HPMI experiment analyzes the pore throat radius instead of the pore diameters.
2.2.4. Methane Adsorption Experiment
The methane adsorption experiment was conducted by using a Rubotherm IsoSorp-HP Static II gas adsorption analyzer. All shale samples were tested at 55 °C with the pressure ranging from 0–27 MPa. In this experiment, we measured the excess adsorption through the gravimetric method. There are many ways to convert “measured excess adsorbed amount” to "absolute adsorbed amount" and there has been much work on this topic [50]. Considering the density of the adsorbed phase (ρa), we used an adapted three-parameter Langmuir fitting function (Equation (1)) to directly obtain the Langmuir volume (VL) and the Langmuir pressure (PL) [32,51].
where Vex is the volume of gas excess adsorbed (mL/g STP); P is the equilibrium gas pressure (MPa); VL is the Langmuir volume (mL/g STP); PL is the Langmuir pressure (MPa), but many researchers use the Langmuir constant (K) instead of it (PL = K−1); ρg is the gas phase density (g/mL); and ρa is the adsorption phase density (g/mL). In this experiment, VL is considered equivalent to the maximum methane adsorption, which can be used to measure the methane adsorption capacity.
Vex = VL · P/(PL + P) · (1 − ρg/ρa),
3. Results
3.1. Results of the Low-Temperature Carbon Dioxide Adsorption Experiment
Figure 1a,b illustrate the results of the low-temperature carbon dioxide adsorption experiment. The relative pressure (P/P0) in the low-temperature CO2 adsorption experiment is between 0 and 0.03. It can be seen that the CO2 adsorption volumes of these 12 shale samples increase with increasing the relative pressure (P/P0), and when the relative pressure is 0.03, the CO2 adsorbed volumes of these 12 shale samples range from 0.5 cm3/g to 6.5 cm3/g (standard temperature and pressure (STP)). Sample T-5 has the smallest CO2 adsorbed volume (<0.6 cm3/g), whereas samples T-11 and T-12 have relatively high CO2 adsorbed volumes, which are more than 3 cm3/g. Moreover, the CO2 adsorbed capacity of the other nine samples is between 1 cm3/g and 2 cm3/g. The reason for this phenomenon may be that the TOC content of the sample T-5 is the smallest and that of sample T-11 and T-12 is much higher than that of other samples (Table 1).
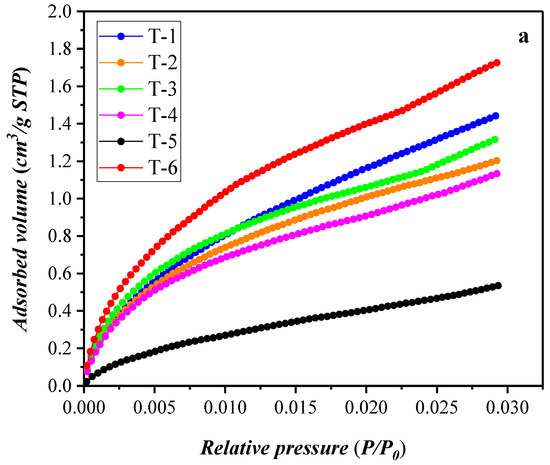
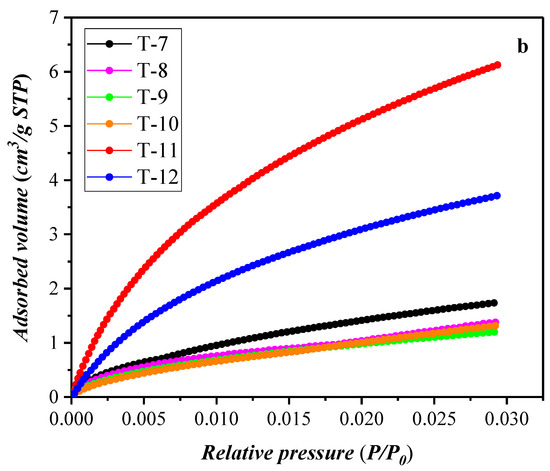
Figure 1.
Carbon dioxide adsorption isotherms at 0 °C for the 12 shale samples: (a) The first six shale samples, (b) The last six shale samples.
In the low-temperature carbon dioxide adsorption experiment, pores with scales of 0.4–1.1 nm in the shale samples were characterized as shown in Figure 2. From the results of Figure 2, it can be seen that pores with a scale of 0.5–0.6 nm have the largest incremental pore volumes, and it indicates that there are many pores with a scale of 0.5–0.6 nm in the tested shale samples.
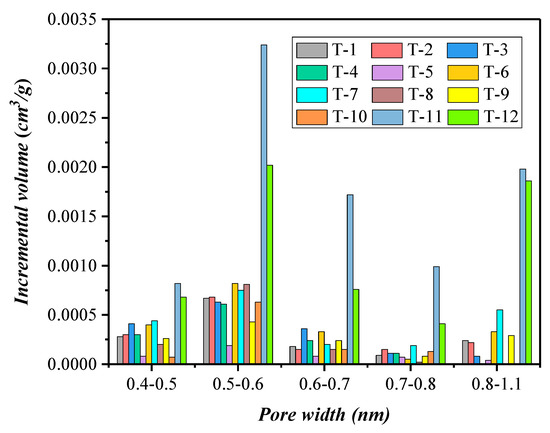
Figure 2.
Pore size distribution obtained from the low-temperature carbon dioxide adsorption experiments for the 12 shale samples.
For samples T-11 and T-12, at each stage, their incremental volumes are much larger than those of other shale samples, which is probably due to the much higher TOC content of T-11 and T-12 (Table 1). When the pore width is 0.4–0.7 nm, the incremental volume of sample T-5 is the smallest, which may be because T-5 has the lowest TOC content (Table 1). The incremental volume of 0.8–1.1 nm pores in T-4, T-8, and T-10 is almost 0 cm3/g, indicating that there are no 0.8–1.1 nm pores in these shale samples.
3.2. Results of the Low-Temperature Nitrogen Adsorption Experiment
As shown in Figure 3a,b, when the relative pressure (P/P0) is too high, the N2 adsorbed volumes of these 12 shale samples range from 2 cm3/g to 13 cm3/g (STP). Sample T-11 has the smallest N2 adsorbed volume, with the reverse being the case in sample T-1. The N2 isotherms of the 12 shale samples are characterized by H3 and H4 types based on the shape of the hysteresis loops [52]. The adsorption isotherms and desorption isotherms of all shale samples become very steep under saturated vapor pressure. For samples T-5, T-7, T-11, and T-12, their nitrogen adsorption capacities are relatively small, indicating that the four shale samples’ pore volumes are small and their hysteresis loops are narrow. In particular, the adsorption isotherms and desorption isotherms of samples T-11 and T-12 are basically coincident. This phenomenon may be due to the lowest clay content of the sample T-5 (Table 1). For the samples T-7, T-11, and T-12, with relatively high TOC contents (Table 1), it may be caused by their clay nanostructure being filled with organic matter [53]. Therefore, as mentioned above, sample T-1 has the largest N2 adsorption capacity probably because it has the highest clay content and relatively low TOC content (Table 1). In comparison, the hysteresis loops of other samples are much larger, and their desorption isotherms decrease significantly at a relative pressure of 0.5.
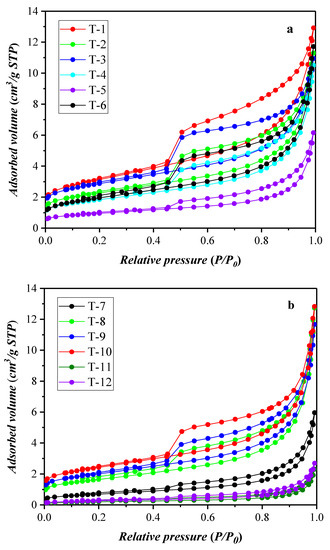
Figure 3.
Nitrogen adsorption/desorption isotherms at −196 °C for the 12 shale samples: (a) The first six shale samples, (b) The last six shale samples.
The low-temperature nitrogen adsorption experiment provides information on pores with scales of 2–200 nm in the shale samples (Figure 4a,b). From the results of Figure 4a,b, it can be found that with increasing pore diameter, on the whole, the incremental pore volume increases for all 12 shale samples. It is clear that the pore size distribution curves of the 12 shale samples have two distinct peaks located at approximately 9 nm and 45 nm, as shown in Figure 4. Furthermore, when the pore diameter is 9 nm, sample T-11 has the smallest incremental pore volume, and sample T-1 has the largest incremental pore volume. Similarly, sample T-11 also has the smallest incremental pore volume when the pore diameter is 45 nm. However, the sample T-8 has the largest incremental pore volume at 45 nm.
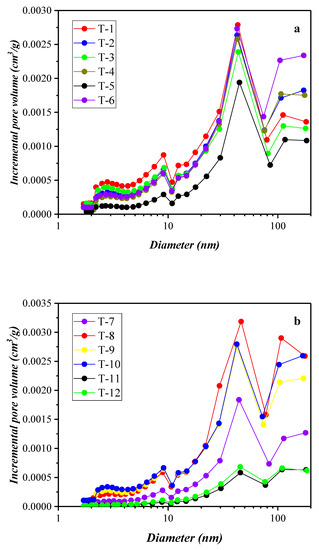
Figure 4.
Pore size distribution obtained from the low-temperature nitrogen adsorption experiment for the 12 shale samples: (a) The first six shale samples, (b) The last six shale samples.
3.3. Results of the High-Pressure Mercury Injection Experiment
As shown in Figure 5a–c, the cumulative mercury injection volumes of these 12 shale samples range from 0.0013 cm3/g to 0.0076 cm3/g. The sample T-8 has the smallest cumulative mercury injection volume, and the sample T-12 has the largest cumulative mercury injection volume. It is obvious that the mercury injection curves of all the samples are similar. At the high-pressure stage (>50 MPa), the mercury injection volume increases rapidly with increasing pressure, mainly because there are large amounts of small pores in all the shale samples. Comparably, the mercury extrusion curves of different shale samples are different. Based on the shapes of the mercury injection and extrusion curves, these 12 shale samples can be divided into three groups (Figure 5a–c). The hysteresis loops of the shale samples in Figure 5a are quite large, especially in the high-pressure stage, which means that the injected mercury is not released when the pressure decreases in the mercury extrusion cycle. Figure 5a shows that almost no mercury is released when the extrusion pressure ranges from 200 MPa to 10 MPa (corresponding pore size: 3–75 nm). This result is mainly because the nanopores with scales of 3–75 nm in these shale samples are mainly ink-bottle shaped, and the mercury is not easily released from these pores [54]. The hysteresis loops of the shale samples in Figure 5b are smaller than those in Figure 5a, which increase gradually with decreasing pressure when the pressure is 10–200 MPa in the mercury extrusion cycle. This result means that the injected mercury is not easily released when the pressure decreases in the mercury extrusion cycle. This result is mainly because some nanopores analyzed at 10–200 MPa (3–75 nm) in these shales are also ink-bottle shaped [54]. The hysteresis loops of the shale samples in Figure 5c are the smallest, especially the mercury injection curves, and the mercury extrusion curves are basically coincident when the pressure is 10–200 MPa. This result is mainly because the nanopores analyzed at 10–200 MPa (3–75 nm) in these shales are mainly open pores, and the mercury is easily released from these pores.
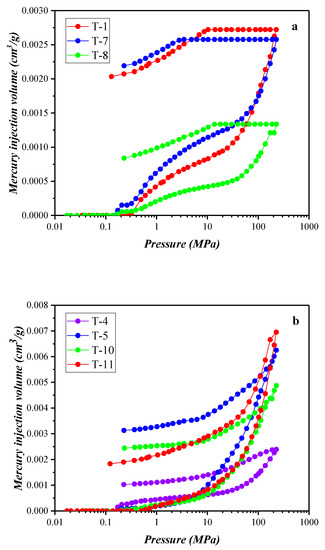
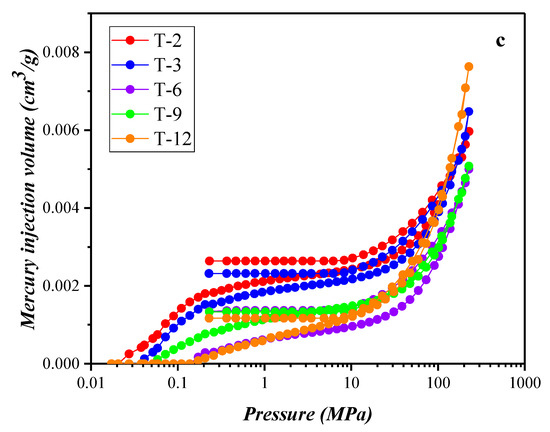
Figure 5.
Intrusive mercury curve for the 12 shale samples: (a) The shale samples with quite large hysteresis loops, (b) The shale samples with medium hysteresis loops, (c) The shale samples with quite small hysteresis loops.
In the high-pressure mercury injection experiment, the pore size distribution of mesopores and macropores is described by the incremental pore volume (Figure 6). It is obvious that the mesopores (2–50 nm) contribute the majority of the total pore volume obtained by the mercury injection experiment for the 12 shale samples. The shale sample T-5 has some macropores with a scale of 50–500 nm, and other shale samples have fewer of these pores. This finding may be because the T-5 shale sample has the highest brittle mineral content (quartz and plagioclase) and the lowest clay content (Table 1). When the pore diameter is 8 or 15 nm, the volume of these pores in all 12 samples is clearly at the peak stage. Overall, the pore volumes of the 12 shale samples gradually decrease with increasing pore diameter. In addition, the other samples, including the samples T-1, T-2, T-3, T-4, T-5, T-6, and T-9, have some macropores with diameters larger than 2000 nm. This phenomenon may be caused by microcracks that were produced during sample preparation.
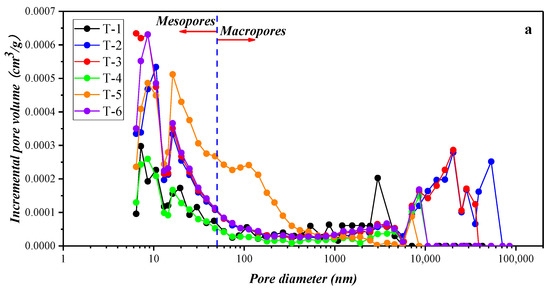
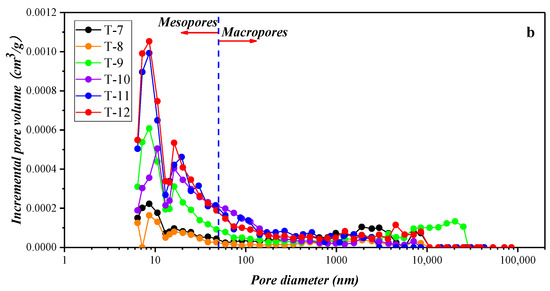
Figure 6.
Pore size distribution by the high-pressure mercury injection experiment for the 12 shale samples: (a) The first six shale samples, (b) The last six shale samples.
3.4. Methane Adsorption Experimental Data
Figure 7 shows the excess methane adsorption data of these shale samples and fitting curves using Equation (1). Moreover, Figure 8 illustrates the absolute methane adsorption data under each pressure of these shale samples. In addition, all the adsorption data in Figure 8 are fitted by the Langmuir equation. The Langmuir volume, indicating the maximum methane adsorption capacity, of all the shale samples ranges from 0.78 cm3/g to 9.26 cm3/g, and the Langmuir pressure ranges from 2.86 MPa to 9.43 MPa. When the pressure is 27 MPa, the excess adsorption volumes of methane in the 12 shale samples are in the range of 0.2–7 cm3/g (Figure 7), and the absolute adsorption volumes of methane range from 0.5 cm3/g to 8.5 cm3/g (Figure 8). The T-5 shale sample always has the smallest excess and absolute adsorption volumes, and T-11 has the largest excess and absolute adsorption volumes. This result may be because the T-5 shale sample has the lowest TOC content and T-11 has the highest TOC content (Table 1).
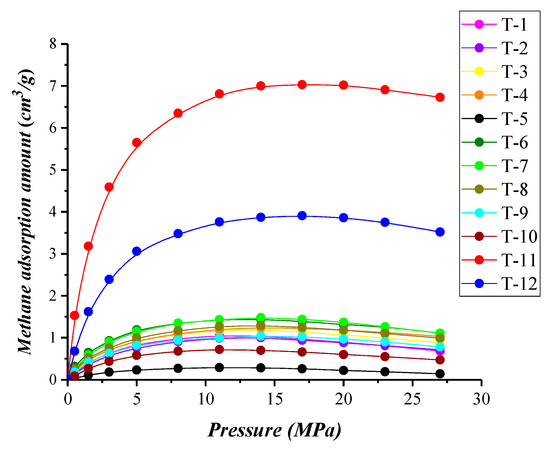
Figure 7.
Excess adsorption of methane at 55 °C in the 12 shale samples, fitted using Equation (1).
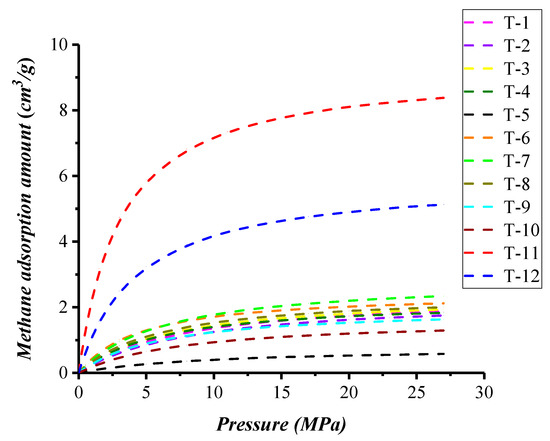
Figure 8.
Langmuir isotherms for absolute adsorption of methane at 55 °C in the 12 shale samples.
As shown in Figure 7, with increasing pressure, the excess adsorption amount of all shale samples first increases and then decreases, reaching the maximum excess adsorption amount at approximately 14 MPa. The absolute adsorption isothermals of all shale samples increase with increasing pressure (Figure 8).
4. Discussion
4.1. Composition of the Shale Samples with Type III Kerogen Formed in the Marine-Terrigenous Environment
The depositional environment has significant effects on the composition of shale with different types of kerogen [45,46,55,56,57]. In addition, for shales with different kerogen types, they have their own relationships between different compositions [34,58,59,60]. For example, for the Longmaxi shale with type I kerogen in southwest China, some quartz is of biological origin, and shale samples with high TOC contents tend to have larger quartz contents [34].
Figure 9a,b show the relationship between the main inorganic mineral constituents (quartz and total clay) and the TOC content, respectively. Due to the wide range of TOC contents in these 12 samples, the relationship between quartz content/total clay content and TOC content is complicated. It is apparent that quartz decreases with increasing TOC content when the TOC is less than 10% (Figure 9a). For samples T-11 and T-12, which have high TOC contents, their quartz contents are much lower than those in other samples (Figure 9a). Similar conclusions have been made in previous studies; that is, quartz content decreases with increasing TOC content [58]. However, some scholars support different conclusions that quartz content increases with increasing TOC content in marine shales [20,59,60,61]. This finding may be due to the different origins of quartz in different types of shales. When quartz in shales is biogenic, the TOC content and quartz content tend to be positively correlated, while other shales have an opposite correlation. As for the shales with type III kerogen, many studies have shown that the quartz of them is mainly formed by plants, and there is almost no biological quartz [46,62]. In addition, from Figure 9b it is clear that clay minerals have a positive correlation with the TOC content, and the shale samples with relatively high TOC contents (T-11 and T-12) have relatively large clay contents, which are larger than 70%. Based on the study by Ma et al., the clay minerals have a large adsorption capacity [63], and these clay minerals adsorb some organic matter during the deposition process [64,65]. Thus, clay minerals and organic matter are often deposited together.
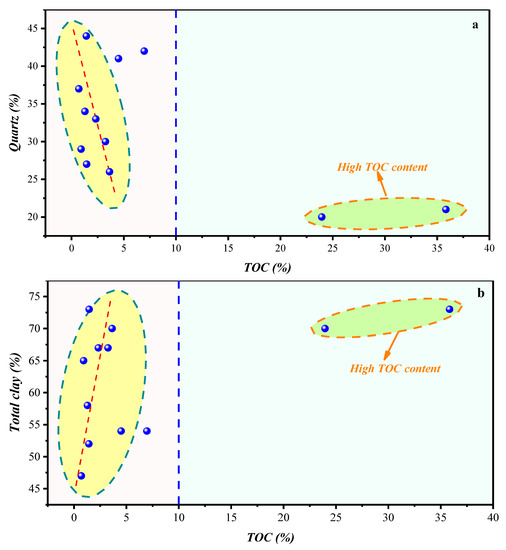
Figure 9.
(a) Relationship between quartz content and TOC content; and (b) relationship between total clay content and TOC content.
4.1.1. Compositional Influence on the Micropores (0.4–1.1 nm) Obtained by the Low-Temperature CO2 Adsorption Experiment
The relationship between the pore volume of pores with scales of 0.4–1.1 nm, which is characterized by the low-temperature CO2 adsorption experiment, and the TOC content is shown in Figure 10a. It can be seen that there is a significant positive correlation between the pores (0.4–1.1 nm) and the TOC content. This finding means that organic matter provides most of the pores with scales of 0.4–1.1 nm in the shale with type III kerogen. Similar results have also been found in shales with type I kerogen based on previous studies [13,20,34]. For all types of shales, organic matter is the major contributor to the pores with scales of 0.4–1.1 nm. As Figure 10b shows, when the quartz content is low (approximately 20%), the volume of pores (0.4–1.1 nm) is large. In contrast, the pore volume is small when the quartz content is higher than 25%, and there is no apparent trend between the pore volume and the quartz content. Figure 10c shows the relationship between the volume of the pores (0.4–1.1 nm) and the total clay content. For samples T-11 and T-12, which have high TOC contents and high total clay contents (Table 1), their volumes of pores (0.4–1.1 nm) are larger than 0.005 cm3/g. However, the pore volumes of other samples are smaller than 0.003 cm3/g, and there is no obvious trend between the pore volumes and the total clay contents. This finding means that quartz and clay minerals have no significant effect on the development of pores (0.4–1.1 nm) in shale with type III kerogen. For the samples T-11 and T-12, the high pore volumes are provided mostly by organic matter.
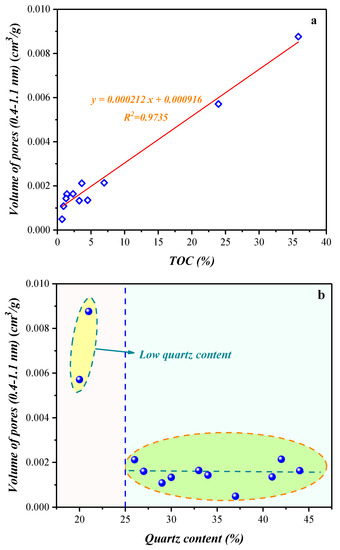
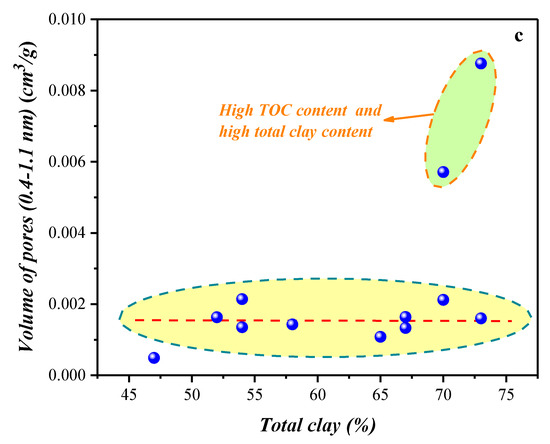
Figure 10.
(a) Relationship between volume of pores (0.4–1.1 nm) by the low-temperature CO2 adsorption experiment and TOC content; (b) relationship between volume of pores (0.4–1.1 nm) by the low-temperature CO2 adsorption experiment and quartz content; and (c) relationship between volume of pores (0.4–1.1 nm) by the low-temperature CO2 adsorption experiment and total clay content.
4.1.2. Compositional Influence on the Mesopores (2–50 nm) and Macropores (50–200 nm) Obtained by the Low-Temperature N2 Adsorption Experiment
As Figure 11a shows, the specific surface area of pores (2–200 nm), which is characterized by the low-temperature N2 adsorption experiment, decreases with increasing TOC content when the TOC content is less than 10%, while the samples (T-11 and T-12) that have high TOC contents (>10%) have smaller specific surface areas. Figure 11b shows the relationship between the specific surface area of pores (2–200 nm) and the quartz content. It is clear that the specific surface area is small for samples with low quartz contents (approximately 20%), while the specific surface area is large when the quartz content is higher than 25%, and it decreases with increasing quartz content. The relationship between the specific surface area of pores (2–200 nm) and the clay content is shown in Figure 11c. The specific surface area is small for samples with high TOC contents and high total clay contents. However, the specific surface area is large for other samples, and it increases with increasing total clay content. It is apparent that clay matter provides most of the pores with scales of 2–200 nm, while organic matter and quartz may inhibit the development of pores (2–200 nm) in shale with type III kerogen.
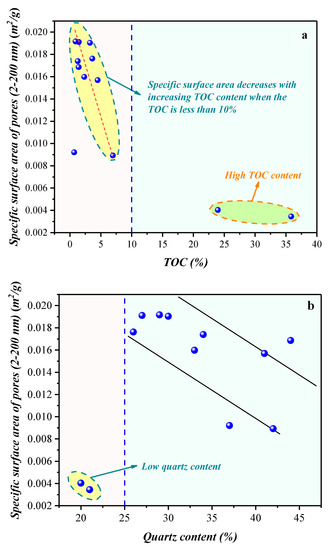
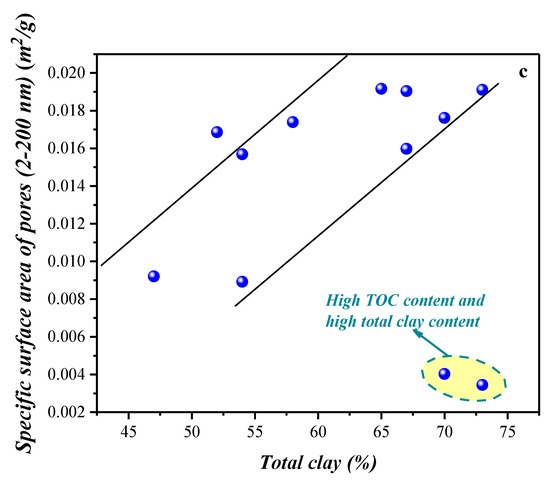
Figure 11.
(a) Relationship between specific surface area of pores (2–200 nm) by the low-temperature N2 adsorption experiment and TOC content; (b) relationship between specific surface area of pores (2–200 nm) by the low-temperature N2 adsorption experiment and quartz content; and (c) relationship between specific surface area of pores (2–200 nm) by the low-temperature N2 adsorption experiment and total clay content.
4.1.3. Compositional Influence on the Mesopores (5–50 nm) and Macropores (50–100,000 nm) Obtained by the HPMI Experiment
The relationship between the pore volume of pores with a scale of 5–100,000 nm, which is characterized by the HPMI experiment, and the TOC content is shown in Figure 12. The pore volume (5–100,000 nm) decreases with increasing TOC content when the TOC is less than 10%. However, the samples T-11 and T-12 with high TOC contents have relatively larger pore volumes (5–100,000 nm), which are larger than the pore volumes of the other samples. This result means that organic matter inhibits the development of pores (5–100,000 nm) in shale with type III kerogen.
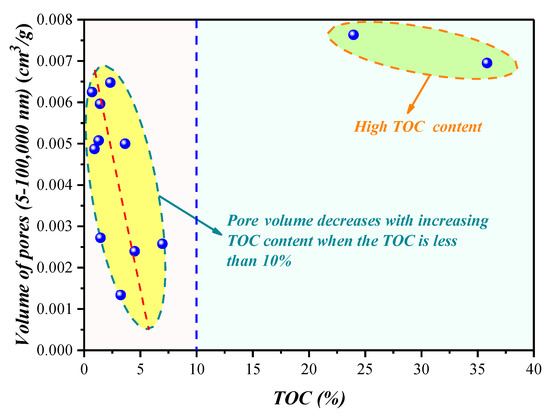
Figure 12.
Relationship between volume of pores (5–100,000 nm) by the high-pressure Hg injection experiment and TOC content.
4.2. Compositional Effects on Methane Adsorption Capacity in Shale with Type III Kerogen
From the results presented in Figure 13a, the relationship between methane adsorption capacity and TOC content for the 12 shale samples can be divided into three stages. The Langmuir volume increases extremely quickly with increasing TOC content when the TOC content is less than 1.4%. Then, the Langmuir volume increases very slowly with increasing TOC content when the TOC content is 1.4–4.5%. Finally, the Langmuir volume increases with increasing TOC content when the TOC is more than 4.5%, but the speed of the increase is not as fast as that in the first stage. Overall, the Langmuir volume increases with increasing TOC content. This similar phenomenon has also been reported in other studies [18,21,26,27,28,30], which suggests that there is a very strong correlation between Langmuir methane adsorption capacity and TOC content. Therefore, an increase in TOC content helps to improve the methane adsorption capacity.
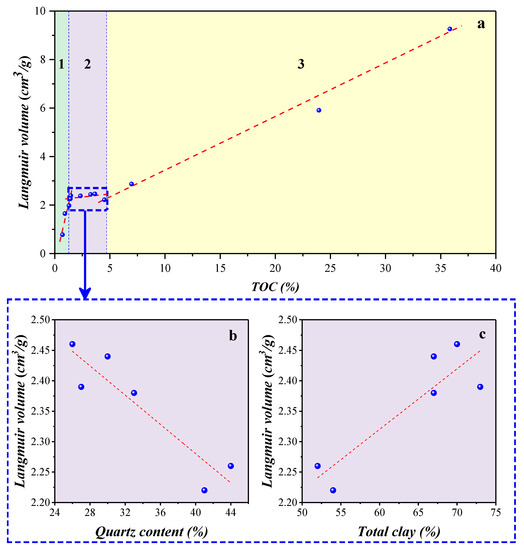
Figure 13.
(a) Relationship between methane adsorption capacity and TOC content for the 12 shale samples; (b) relationship between methane adsorption capacity and quartz content for the shale samples whose TOC content is 1.4–4.5%; and (c) relationship between methane adsorption capacity and total clay content for the shale samples whose TOC content is 1.4–4.5%.
Since an increasing TOC content has no significant effect on the methane adsorption capacity when the TOC content is 1.4–4.5%, several shale samples corresponding to this stage are analyzed separately. These samples have low quartz contents and high clay mineral contents. The relationship between methane adsorption capacity and quartz content or total clay content for these shale samples is shown in Figure 13b,c. The quartz content is negatively correlated with the Langmuir volume (Figure 13b), while the total clay mineral content is positively correlated with the Langmuir volume (Figure 13c). Some scholars support similar conclusions and also agree that methane adsorption capacity increases with decreasing quartz content or increasing total clay content [25,31,32].
The results as proposed above, indicate that the TOC content contributes less to the methane adsorption capacity when the TOC content is 1.4–4.5%. At the same time, the methane adsorption capacity is affected by the quartz content and the clay mineral content. However, the inhibition of methane adsorption capacity by quartz and the promotion of methane adsorption capacity by clay minerals cancel each other out. As a result, the methane adsorption capacity does not change significantly. Studies have shown that organic matter and clay minerals are tightly integrated at nanometer scales [64,65] and organic matter is adsorbed on the internal surface of clay minerals to form organoclay aggregates [66]. This phenomenon may be due to organic matter and clay minerals being deposited together to form the organoclay aggregates, which reduce the adsorption capacity of organic matter to methane when the TOC content is 1.4–4.5%.
4.3. Nanopore Effect on Methane Adsorption Capacity in Shale with Type III Kerogen
The relationship between methane adsorption capacity and nanopores is shown in Figure 14, Figure 15 and Figure 16. As Figure 14 shows, there is an excellent correlation between the Langmuir volume and the volume of pores (0.4–1.1 nm) by the low-temperature carbon dioxide adsorption experiment (R2 = 0.9876). The Langmuir volume is relatively discrete when the pore volume is less than 0.0025 cm3/g (R2 = 0.8038). The relationship between methane adsorption capacity and specific surface area of pores (2–200 nm) for the 12 shale samples by the low-temperature nitrogen adsorption experiment is shown in Figure 15 and can be divided into two stages. The Langmuir volume decreases rapidly as the specific surface area increases when the specific surface area is less than 0.0012 m2/g. Then, the Langmuir volume begins to decrease slowly when the specific surface area is greater than 0.0012 m2/g. The Langmuir volume decreases with increasing pore volume (5–100,000 nm), which is analyzed by the HPMI experiment for the shale samples with low TOC contents. For the samples T-11 and T-12, which have high TOC contents, their pore volume and Langmuir volume are large at the same time (Figure 16).
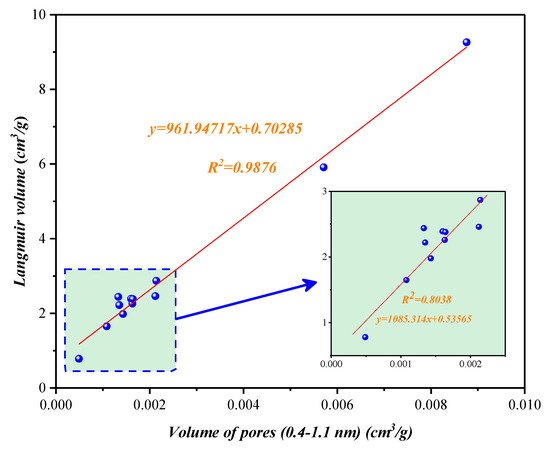
Figure 14.
Relationship between methane adsorption capacity and pore volume (0.1–1.1 nm) for the 12 shale samples by the low-temperature carbon dioxide adsorption experiment.
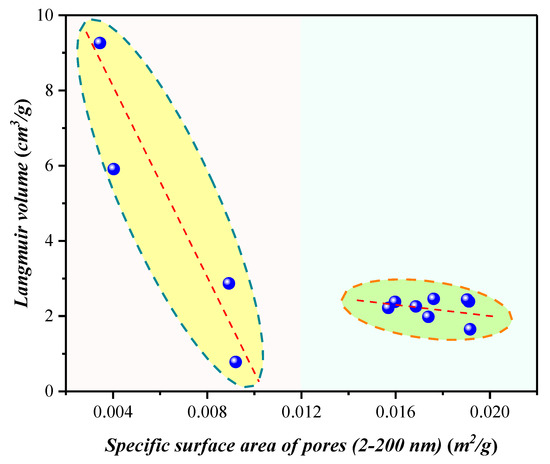
Figure 15.
Relationship between methane adsorption capacity and specific surface area of pores (2–200 nm) for the 12 shale samples by the low-temperature nitrogen adsorption experiment.
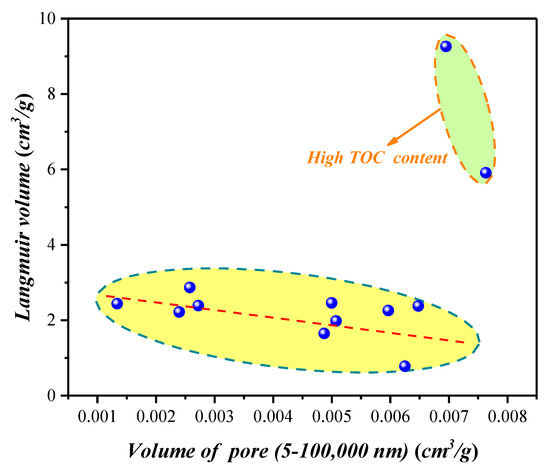
Figure 16.
Relationship between methane adsorption capacity and volume of pores (5–100,000 nm) for the 12 shale samples by the high-pressure mercury injection experiment.
Therefore, the development of micropore (0.4–1.1 nm) volume could increase the methane adsorption capacity. Some scholars have drawn similar conclusions that micropore volume and micropore surface area are the main influencing factors of methane adsorption capacity [13].
5. Conclusions
The effect of nanostructure on methane adsorption of shale with type III kerogen was analyzed using high-pressure mercury injection, low-temperature nitrogen adsorption, low-temperature carbon dioxide adsorption, and methane adsorption. This study draws the following conclusions:
(1) The content of clay minerals in shale samples with type III kerogen is relatively high. Organic matter and clay minerals are deposited simultaneously in these shale samples. When the TOC content >10%, the clay minerals contribute more than 70% of the total inorganic matter.
(2) Micropores are mainly formed in organic matter. With increasing TOC content, the micropore volume increases linearly. Clay minerals and other inorganic matter have weak influences on micropores in shale with type III kerogen.
(3) The N2 adsorption experimental results show that pores with scales of 2–200 nm are mainly affected by clay minerals. With increasing clay mineral content, their surface area tends to increase.
(4) It was found that the methane adsorption capacity of shale samples with type III kerogen is mainly controlled by organic matter. In addition, clay minerals have some influence on methane adsorption capacity. When TOC content is <1.4% or >4.5%, the methane adsorption capacity increases linearly with increasing TOC content. However, when the TOC content is in the range of 1.4–4.5%, clay minerals have an obvious influence on the methane adsorption capacity. At this stage, with increasing clay mineral content, the methane adsorption capacity increases, and with increasing quartz content, the methane adsorption capacity decreases.
Author Contributions
Conceptualization, Y.H., Y.Z., Y.L. and Y.W.; Data curation, Y.H. and Y.L.; Formal analysis, Y.H.; Funding acquisition, Y.Z.; Investigation, Y.H., Y.L., H.Z. and W.Y.; Supervision, Y.Z. and Y.W.; Validation, Y.H. and Y.L.; Writing—original draft, Y.H. All authors have read and agreed to the published version of the manuscript.
Funding
This work was supported by the ’Fundamental Research Funds for the Central Universities’ programme (No. 2017CXNL03).
Acknowledgments
The authors are sincerely thankful for the financial support. And the authors wish to thank Xiaowei Hou fou helping with the improving the grammar and readability of this paper.
Conflicts of Interest
The authors declare no conflict of interest.
References
- Rexer, T.F.T.; Benham, M.J.; Aplin, A.C.; Thomas, K.M. Methane Adsorption on Shale under Simulated Geological Temperature and Pressure Conditions. Energy Fuel 2013, 27, 3099–3109. [Google Scholar] [CrossRef]
- Curtis, J.B. Fractured shale-gas systems. AAPG Bull. 2002, 86, 1921–1938. [Google Scholar]
- Li, Q.; Li, P.; Pang, W.; Bi, Q.; Du, Z.; Li, X.; Lu, D. A Novel Analytical Method to Calculate the Amounts of Free and Adsorbed Gas in Shale Gas Production. Math. Probl. Eng. 2018, 2018, 1–14. [Google Scholar] [CrossRef]
- Chen, G.; Lu, S.; Zhang, J.; Xue, Q.; Han, T.; Xue, H.; Tian, S.; Li, J.; Xu, C.; Pervukhina, M. Keys to linking GCMC simulations and shale gas adsorption experiments. Fuel 2017, 199, 14–21. [Google Scholar] [CrossRef]
- Chen, G.; Zhang, J.; Lu, S.; Pervukhina, M.; Liu, K.; Xue, Q.; Tian, H.; Tian, S.; Li, J.; Clennell, M.B.; et al. Adsorption Behavior of Hydrocarbon on Illite. Energy Fuel 2016, 30, 9114–9121. [Google Scholar] [CrossRef]
- Chalmers, G.R.; Bustin, R.M.; Power, I.M. Characterization of gas shale pore systems by porosimetry, pycnometry, surface area, and field emission scanning electron microscopy/transmission electron microscopy image analyses: Examples from the Barnett, Woodford, Haynesville, Marcellus, and Doig units. AAPG Bull. 2012, 96, 1099–1119. [Google Scholar] [CrossRef]
- Loucks, R.G.; Reed, R.M.; Ruppel, S.C.; Jarvie, D.M. Morphology, Genesis, and Distribution of Nanometer-Scale Pores in Siliceous Mudstones of the Mississippian Barnett Shale. J. Sediment Res. 2009, 79, 848–861. [Google Scholar] [CrossRef]
- Hu, H.; Hao, F.; Lin, J.; Lu, Y.; Ma, Y.; Li, Q. Organic matter-hosted pore system in the Wufeng-Longmaxi (O3w-S1l) shale, Jiaoshiba area, Eastern Sichuan Basin, China. Int. J. Coal Geol. 2017, 173, 40–50. [Google Scholar] [CrossRef]
- Guo, C.; Xu, J.; Wu, K.; Wei, M.; Liu, S. Study on gas flow through nano pores of shale gas reservoirs. Fuel 2015, 2015, 107–117. [Google Scholar] [CrossRef]
- Song, W.; Yao, J.; Ma, J.; Li, A.; Li, Y.; Sun, H.; Zhang, L. Grand canonical Monte Carlo simulations of pore structure influence on methane adsorption in micro-porous carbons with applications to coal and shale systems. Fuel 2018, 215, 196–203. [Google Scholar] [CrossRef]
- Wang, Y.; Zhu, Y.; Chen, S.; Li, W. Characteristics of the Nanoscale Pore Structure in Northwestern Hunan Shale Gas Reservoirs Using Field Emission Scanning Electron Microscopy, High-Pressure Mercury Intrusion, and Gas Adsorption. Energy Fuel 2014, 28, 945–955. [Google Scholar] [CrossRef]
- Li, J.; Yan, X.; Wang, W.; Zhang, Y.; Yin, J.; Lu, S.; Chen, F.; Meng, Y.; Zhang, X.; Chen, X.; et al. Key factors controlling the gas adsorption capacity of shale: A study based on parallel experiments. Appl. Geochem. 2015, 2015, 88–96. [Google Scholar] [CrossRef]
- Wang, Y.; Zhu, Y.; Liu, S.; Zhang, R. Pore characterization and its impact on methane adsorption capacity for organic-rich marine shales. Fuel 2016, 2016, 227–237. [Google Scholar] [CrossRef]
- Ji, W.; Song, Y.; Rui, Z.; Meng, M.; Huang, H. Pore characterization of isolated organic matter from high matured gas shale reservoir. Int. J. Coal Geol. 2017, 174, 31–40. [Google Scholar] [CrossRef]
- Robert, G.; Loucks, R.M.R.S.; Hammes, A.U. Spectrum of pore types and networks in mudrocks and a descriptive classification for matrix-related mudrock pores. AAPG Bull. 2012, 96, 1071–1098. [Google Scholar]
- Zhang, J.; Li, X.; Xie, Z.; Li, J.; Zhang, X.; Sun, K.; Wang, F. Characterization of microscopic pore types and structures in marine shale: Examples from the Upper Permian Dalong formation, Northern Sichuan Basin, South China. J. Nat. Gas Sci. Eng. 2018, 59, 326–342. [Google Scholar] [CrossRef]
- Zhu, H.; Ju, Y.; Qi, Y.; Huang, C.; Zhang, L. Impact of tectonism on pore type and pore structure evolution in organic-rich shale: Implications for gas storage and migration pathways in naturally deformed rocks. Fuel 2018, 228, 272–289. [Google Scholar] [CrossRef]
- Yang, F.; Ning, Z.; Liu, H. Fractal characteristics of shales from a shale gas reservoir in the Sichuan Basin, China. Fuel 2014, 115, 378–384. [Google Scholar] [CrossRef]
- Zhou, S.; Ning, Y.; Wang, H.; Liu, H.; Xue, H. Investigation of methane adsorption mechanism on Longmaxi shale by combining the micropore filling and monolayer coverage theories. Adv. Geo-Energy Res. 2018, 2, 269–281. [Google Scholar] [CrossRef]
- Chen, L.; Jiang, Z.; Liu, K.; Gao, F. Quantitative characterization of micropore structure for organic-rich Lower Silurian shale in the Upper Yangtze Platform, South China: Implications for shale gas adsorption capacity. Adv. Geo-Energy Res. 2017, 1, 112–123. [Google Scholar] [CrossRef]
- Ji, W.; Song, Y.; Jiang, Z.; Chen, L.; Li, Z.; Yang, X.; Meng, M. Estimation of marine shale methane adsorption capacity based on experimental investigations of Lower Silurian Longmaxi formation in the Upper Yangtze Platform, south China. Mar. Petrol. Geol. 2015, 2015, 94–106. [Google Scholar] [CrossRef]
- Xiong, J.; Liu, X.; Liang, L.; Zeng, Q. Methane Adsorption on Carbon Models of the Organic Matter of Organic-Rich Shales. Energy Fuel 2017, 31, 1489–1501. [Google Scholar] [CrossRef]
- Li, P.; Jiang, Z.; Zheng, M.; Bi, H.; Chen, L. Estimation of shale gas adsorption capacity of the Longmaxi Formation in the Upper Yangtze Platform, China. J. Nat. Gas Sci. Eng. 2016, 34, 1034–1043. [Google Scholar] [CrossRef]
- Cao, T.; Song, Z.; Wang, S.; Cao, X.; Li, Y.; Xia, J. Characterizing the pore structure in the Silurian and Permian shales of the Sichuan Basin, China. Mar. Petrol. Geol. 2015, 61, 140–150. [Google Scholar] [CrossRef]
- Liu, Y.C.; Chen, D.X.; Qiu, N.S.; Wang, Y.; Fu, J.; Huyan, Y.; Jia, J.K.; Wu, H. Reservoir characteristics and methane adsorption capacity of the Upper Triassic continental shale in Western Sichuan Depression, China. Aust. J. Earth Sci. 2017, 64, 807–823. [Google Scholar] [CrossRef]
- Zhang, T.; Ellis, G.S.; Ruppel, S.C.; Milliken, K.; Yang, R. Effect of organic-matter type and thermal maturity on methane adsorption in shale-gas systems. Org. Geochem. 2012, 47, 120–131. [Google Scholar] [CrossRef]
- Ross, D.J.K.; Marc Bustin, R. The importance of shale composition and pore structure upon gas storage potential of shale gas reservoirs. Mar. Petrol. Geol. 2009, 26, 916–927. [Google Scholar] [CrossRef]
- Shabani, M.; Moallemi, S.A.; Krooss, B.M.; Amann-Hildenbrand, A.; Zamani-Pozveh, Z.; Ghalavand, H.; Littke, R. Methane sorption and storage characteristics of organic-rich carbonaceous rocks, Lurestan province, southwest Iran. Int. J. Coal Geol. 2018, 2018, 51–64. [Google Scholar] [CrossRef]
- Tan, J.; Weniger, P.; Krooss, B.; Merkel, A.; Horsfield, B.; Zhang, J.; Boreham, C.J.; Graas, G.V.; Tocher, B.A. Shale gas potential of the major marine shale formations in the Upper Yangtze Platform, South China, Part II: Methane sorption capacity. Fuel 2014, 129, 204–218. [Google Scholar] [CrossRef]
- Hu, H.; Hao, F.; Guo, X.; Dai, F.; Lu, Y.; Ma, Y. Investigation of methane sorption of overmature Wufeng-Longmaxi shale in the Jiaoshiba area, Eastern Sichuan Basin, China. Mar. Petrol. Geol. 2018, 91, 251–261. [Google Scholar] [CrossRef]
- Ji, L.; Zhang, T.; Milliken, K.L.; Qu, J.; Zhang, X. Experimental investigation of main controls to methane adsorption in clay-rich rocks. Appl. Geochem. 2012, 27, 2533–2545. [Google Scholar] [CrossRef]
- Gasparik, M.; Ghanizadeh, A.; Bertier, P.; Gensterblum, Y.; Bouw, S.; Krooss, B.M. High-Pressure Methane Sorption Isotherms of Black Shales from The Netherlands. Energy Fuel 2012, 26, 4995–5004. [Google Scholar] [CrossRef]
- Li, J.; Li, X.; Wang, X.; Li, Y.; Wu, K.; Shi, J.; Yang, L.; Feng, D.; Zhang, T.; Yu, P. Water distribution characteristic and effect on methane adsorption capacity in shale clay. Int. J. Coal Geol. 2016, 2016, 135–154. [Google Scholar] [CrossRef]
- Yang, R.; He, S.; Hu, Q.; Hu, D.; Zhang, S.; Yi, J. Pore characterization and methane sorption capacity of over-mature organic-rich Wufeng and Longmaxi shales in the southeast Sichuan Basin, China. Mar. Petrol. Geol. 2016, 77, 247–261. [Google Scholar] [CrossRef]
- Caineng, Z.; Dazhong, D.; Shejiao, W.; Denghua, L.; Keming, C. Geological characteristics and resource potential of shale gas in China. ScienceDirect 2010, 37, 641–653. [Google Scholar]
- Yu, W.; Sepehrnoori, K.; Patzek, T.W. Modeling Gas Adsorption in Marcellus Shale with Langmuir and BET Isotherms. Isotherms SPE J. 2016, 21, 589–600. [Google Scholar] [CrossRef]
- Peischl, J.; Ryerson, T.B.; Aikin, K.C.; de Gouw, J.A.; Gilman, J.B.; Holloway, J.S.; Lerner, B.M.; Nadkarni, R.; Neuman, J.A.; Nowak, J.B.; et al. Quantifying atmospheric methane emissions from the Haynesville, Fayetteville, and northeastern Marcellus shale gas production regions. J. Geophys. Res. Atmos. 2015, 120, 2119–2139. [Google Scholar] [CrossRef]
- Lewan, M.D.; Pawlewicz, M.J. Reevaluation of thermal maturity and stages of petroleum formation of the Mississippian Barnett Shale, Fort Worth Basin, Texas. AAPG Bull. 2017, 101, 1945–1970. [Google Scholar] [CrossRef]
- WANG, H.; WANG, Y.; LI, X.; CHEN, B.; WU, W.; DONG, D.; ZHANG, J.; HAN, J.; MA, J.; DAI, B.; et al. Lower limit of thermal maturity for the carbonization of organic matter in marine shale and its exploration risk. Pet. Explor. Dev. Online 2018, 45, 402–411. [Google Scholar] [CrossRef]
- Xu, L.; Wang, Y.; Liu, L.; Chen, L.; Chen, J. Evolution characteristics and model of nanopore structure and adsorption capacity in organic-rich shale during artificial thermal maturation: A pyrolysis study of the Mesoproterozoic Xiamaling marine shale with type II kerogen from Zhangjiakou, Hebei, China. Energy Explor. Exploit. 2018, 37, 493–518. [Google Scholar] [CrossRef]
- Petersen, H.I.; Hertle, M.; Sulsbrück, H. Upper Jurassic–lowermost Cretaceous marine shale source rocks (Farsund Formation), North Sea: Kerogen composition and quality and the adverse effect of oil-based mud contamination on organic geochemical analyses. Int. J. Coal Geol. 2017, 173, 26–39. [Google Scholar] [CrossRef]
- Zhao, T.; Li, X.; Zhao, H.; Li, M. Molecular simulation of adsorption and thermodynamic properties on type II kerogen: Influence of maturity and moisture content. Fuel 2017, 190, 198–207. [Google Scholar] [CrossRef]
- Gasparik, M.; Bertier, P.; Gensterblum, Y.; Ghanizadeh, A.; Krooss, B.M.; Littke, R. Geological controls on the methane storage capacity in organic-rich shales. Int. J. Coal Geol. 2014, 123, 34–51. [Google Scholar] [CrossRef]
- Guo, H.; Jia, W.; Peng, P.; Lei, Y.; Luo, X.; Cheng, M.; Wang, X.; Zhang, L.; Jiang, C. The composition and its impact on the methane sorption of lacustrine shales from the Upper Triassic Yanchang Formation, Ordos Basin, China. Mar. Petrol. Geol. 2014, 57, 509–520. [Google Scholar] [CrossRef]
- Chalmers, G.R.L.; Bustin, R.M. Lower Cretaceous gas shales in northeastern British Columbia, Part I: Geological controls on methane sorption capacity. Bull. Can. Pet. Geol. 2008, 56, 1–21. [Google Scholar] [CrossRef]
- Vandenbroucke, M.; Largeau, C. Kerogen origin, evolution and structure. Org. Geochem. 2007, 38, 719–833. [Google Scholar] [CrossRef]
- Car, R.; Parrinello, M. Unified approach for molecular dynamics and density-functional theory. Phys. Rev. Lett. 1985, 55, 2471–2474. [Google Scholar] [CrossRef]
- Barrett, E.P.; Joyner, L.G.; Halenda, P.P. The Determination of Pore Volume and Area Distributions in Porous Substances. I. Computations from Nitrogen Isotherms. J. Am. Chem. Soc. 1951, 73, 373–380. [Google Scholar] [CrossRef]
- Brunauer, S.; Emmett, P.H.; Teller, E. Adsorption of Gases in Multimolecular Layers. J. Am. Chem. Soc. 1938, 60, 309–319. [Google Scholar] [CrossRef]
- Tang, X.; Ripepi, N.; Stadie, N.P.; Yu, L.; Hall, M.R. A dual-site Langmuir equation for accurate estimation of high pressure deep shale gas resources. Fuel 2016, 185, 10–17. [Google Scholar] [CrossRef]
- Hou, X.; Liu, S.; Zhu, Y.; Yang, Y. Experimental and theoretical investigation on sorption kinetics and hysteresis of nitrogen, methane, and carbon dioxide in coals. Fuel 2020, 268, 117349. [Google Scholar] [CrossRef]
- Tang, X.; Jiang, Z.; Li, Z.; Gao, Z.; Bai, Y.; Zhao, S.; Feng, J. The effect of the variation in material composition on the heterogeneous pore structure of high-maturity shale of the Silurian Longmaxi formation in the southeastern Sichuan Basin, China. J. Nat. Gas Sci. Eng. 2015, 23, 464–473. [Google Scholar] [CrossRef]
- Kuila, U.; McCarty, D.K.; Derkowski, A.; Fischer, T.B.; Topór, T.; Prasad, M. Nano-scale texture and porosity of organic matter and clay minerals in organic-rich mudrocks. Fuel 2014, 135, 359–373. [Google Scholar] [CrossRef]
- Schmitt, M.; Fernandes, C.P.; Neto, J.A.B.D.; Wolf, F.G.; Santos, V.S.S.D. Characterization of pore systems in seal rocks using Nitrogen Gas Adsorption combined with Mercury Injection Capillary Pressure techniques. Mar. Petrol. Geol. 2013, 39, 138–149. [Google Scholar] [CrossRef]
- Sun, X.; Zhang, T.; Sun, Y.; Milliken, K.L.; Sun, D. Geochemical evidence of organic matter source input and depositional environments in the lower and upper Eagle Ford Formation, south Texas. Org. Geochem. 2016, 98, 66–81. [Google Scholar] [CrossRef]
- Bechtel, A.; Oberauer, K.; Kostić, A.; Gratzer, R.; Milisavljević, V.; Aleksić, N.; Stojanović, K.; Groß, D.; Sachsenhofer, R.F. Depositional environment and hydrocarbon source potential of the Lower Miocene oil shale deposit in the Aleksinac Basin (Serbia). Org. Geochem. 2018, 115, 93–112. [Google Scholar] [CrossRef]
- Gao, G.; Titi, A.; Yang, S.; Tang, Y.; Kong, Y.; He, W. Geochemistry and depositional environment of fresh lacustrine source rock: A case study from the Triassic Baijiantan Formation shales in Junggar Basin, northwest China. Org. Geochem. 2017, 113, 75–89. [Google Scholar] [CrossRef]
- Liu, X.; Xiong, J.; Liang, L. Investigation of pore structure and fractal characteristics of organic-rich Yanchang formation shale in central China by nitrogen adsorption/desorption analysis. J. Nat. Gas Sci. Eng. 2015, 22, 62–72. [Google Scholar] [CrossRef]
- Tian, H.; Pan, L.; Xiao, X.; Wilkins, R.W.T.; Meng, Z.; Huang, B. A preliminary study on the pore characterization of Lower Silurian black shales in the Chuandong Thrust Fold Belt, southwestern China using low pressure N2 adsorption and FE-SEM methods. Mar. Petrol. Geol. 2013, 48, 8–19. [Google Scholar] [CrossRef]
- Chalmers, G.R.L.; Ross, D.J.K.; Bustin, R.M. Geological controls on matrix permeability of Devonian Gas Shales in the Horn River and Liard basins, northeastern British Columbia, Canada. Int. J. Coal Geol. 2012, 103, 120–131. [Google Scholar] [CrossRef]
- Hou, X.; Liu, S.; Zhu, Y.; Yang, Y. Evaluation of gas contents for a multi-seam deep coalbed methane reservoir and their geological controls: In situ direct method versus indirect method. Fuel 2020, 265, 116917. [Google Scholar] [CrossRef]
- Rani, S.; Padmanabhan, E.; Prusty, B.K. Review of gas adsorption in shales for enhanced methane recovery and CO2 storage. J. Petrol. Sci. Eng. 2019, 175, 634–643. [Google Scholar] [CrossRef]
- Ma, Y.; Zhong, N.; Li, D.; Pan, Z.; Cheng, L.; Liu, K. Organic matter/clay mineral intergranular pores in the Lower Cambrian Lujiaping Shale in the north-eastern part of the upper Yangtze area, China: A possible microscopic mechanism for gas preservation. Int. J. Coal Geol. 2015, 137, 38–54. [Google Scholar] [CrossRef]
- Rahman, H.M.; Kennedy, M.; Löhr, S.; Dewhurst, D.N.; Sherwood, N.; Yang, S.; Horsfield, B. The influence of shale depositional fabric on the kinetics of hydrocarbon generation through control of mineral surface contact area on clay catalysis. Geochim. Cosmochim. AC 2018, 220, 429–448. [Google Scholar] [CrossRef]
- Rahman, H.M.; Kennedy, M.; Löhr, S.; Dewhurst, D.N. Clay-organic association as a control on hydrocarbon generation in shale. Org. Geochem. 2017, 105, 42–55. [Google Scholar] [CrossRef]
- Zhu, X.; Cai, J.; Wang, G.; Song, M. Role of organo-clay composites in hydrocarbon generation of shale. Int. J. Coal Geol. 2018, 192, 83–90. [Google Scholar] [CrossRef]


© 2020 by the authors. Licensee MDPI, Basel, Switzerland. This article is an open access article distributed under the terms and conditions of the Creative Commons Attribution (CC BY) license (http://creativecommons.org/licenses/by/4.0/).