1. Introduction
The dynamic development of the world economy means that the demand for energy is increasing from year to year in virtually all sectors of this economy [
1,
2]. Energy is closely related to economy, environment, and social development [
3,
4,
5]. Especially with the fast development of the economy and the resulting rapid growth of energy consumption [
6,
7,
8,
9,
10,
11,
12,
13], the need for energy is increasingly growing, especially for fossil energy such as crude oil, leading to the increasing dependence on foreign oil every year [
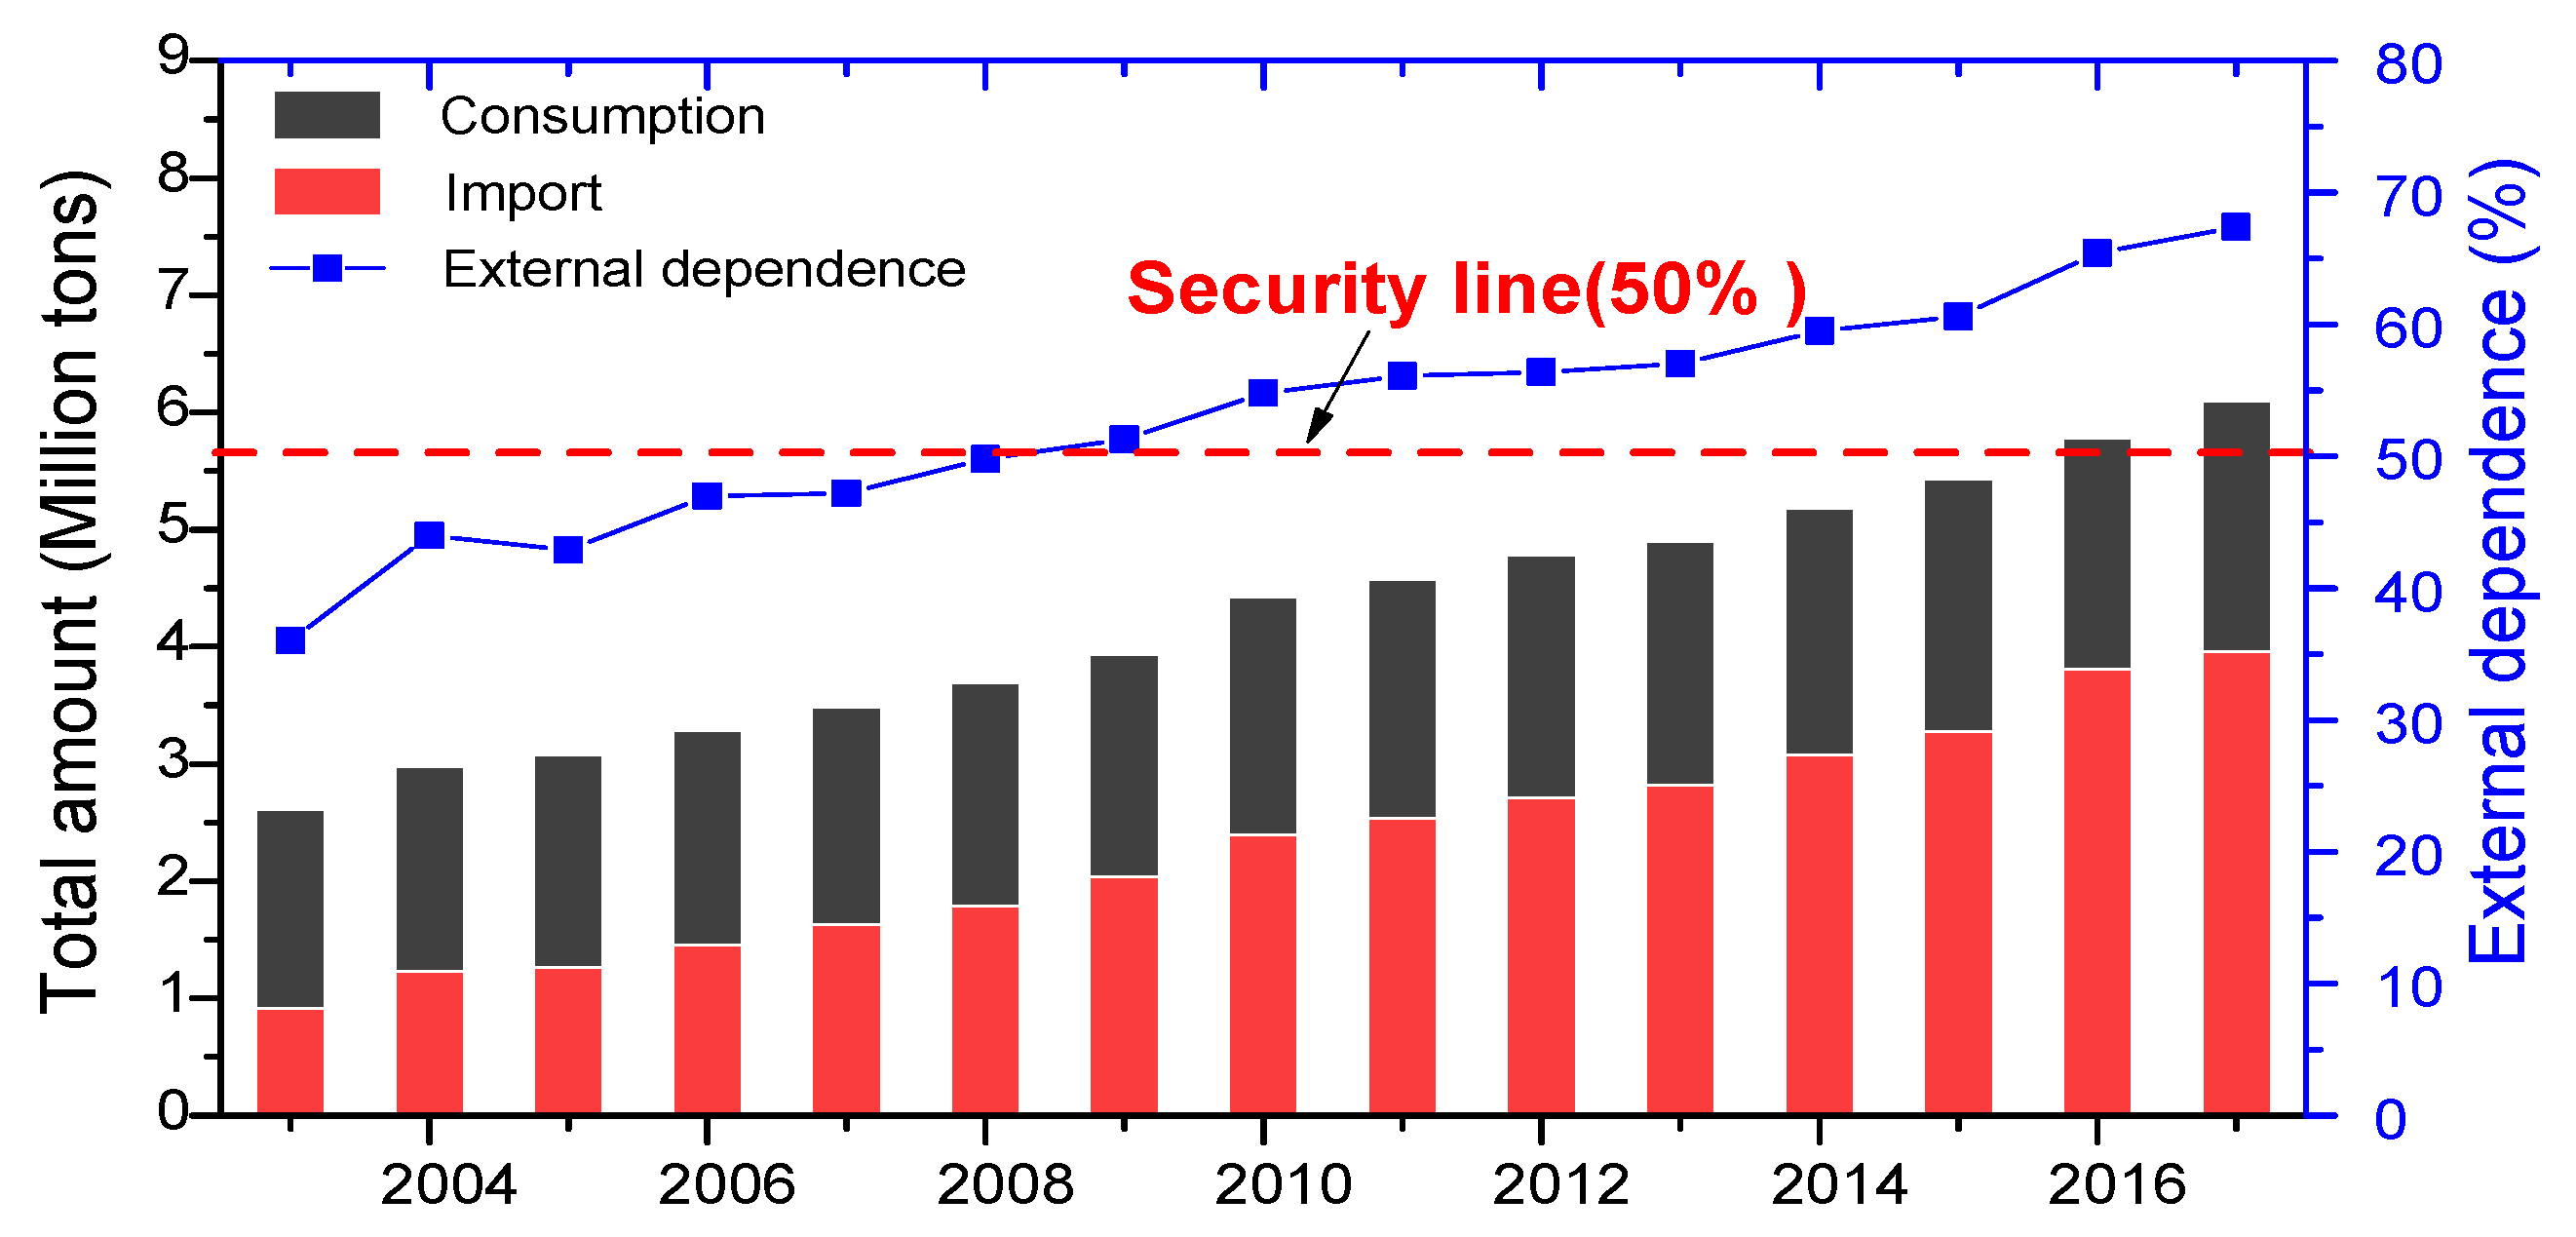
14]. In 2018, China’s oil demand exceeded 600 million tons for the first time, and its dependence on foreign countries was close to 70%. The statistics of China’s total oil consumption and dependence on foreign countries from 2003 to 2017 are shown in
Figure 1. According to international energy security standards, a country’s dependence on foreign oil is “unsafe” in the range of 40%–50%, and more than 50% is “in crisis” [
15]. Since 2008, China’s dependence on foreign oil has exceeded 50%, and currently it is close to 70%. This shows that oil safety in China is already facing severe tests. Ensuring the country’s oil safety is always a major strategic issue. Therefore, it is urgent to establish a large-scale strategic petroleum reserve system.
Rock salt is considered as an ideal medium for crude oil storage due to its excellent characteristics of low porosity, low permeability, self-healing of damage, and strong plastic deformation ability [
16,
17,
18,
19]. Nearly 36 countries have implemented underground oil storage, with 90% of the oil in the United States, 50% in Germany and 30% in France are stored in rock salt caverns [
20]. However, there is no engineering practice of constructing salt cavern for oil storage in China. According to the second and third phases of the national strategic petroleum reserve plan, China’s petroleum reserve will gradually shift from the surface ground to the underground, with more strategic depth and safety than in the first phase. The reserve mode will also shift from the traditional surface ground storage tank to granite chamber with water seal, salt cavern storage and other modes. The construction of salt caverns such as Jintan in Jiangsu, Huai’an, and Yunying in Hubei are all under this plan [
21]. To date, the construction of underground salt cavern oil storage in China is still in the stage of demonstration, and the underground salt cavern oil storage is far behind that of some developed countries. However, with the advancement of the national strategic petroleum reserve plan, the implementation of underground petroleum reserves in rock salt formations will become the key deployment direction of future strategic petroleum reserves. Carrying out the necessary research and engineering work, such as the pilot test and the evaluation of the stability and tightness of the SPR salt caverns, which could provide a theoretical and experimental basis for the construction of China’s first salt cavern oil storage, is urgent.
Salt deposits in China are mostly layered rock salt structures, and their geological occurrence conditions are extremely complex, with many rock salt layers, thin single-layer thickness, and many insolubles and insoluble interlayers [
19,
22,
23,
24]. The interlayers seriously affect the sealing characteristics of surrounding rocks of the SPR salt caverns, which are also the key to determine whether salt caverns can store crude oil safely and reliably [
25]. Once the salt cavern leaks, it will lead to oil leakage, which may bring the risk of serious disasters such as cavity scrapping and ground subsidence, even causing major fires and activating regional faults [
26,
27,
28]. Therefore, the porosity and permeability characteristics of the rock surrounding the caverns are important for evaluating its tightness [
29,
30,
31,
32]. Moreover, the essence of these macroscopic characteristics is the macroscopic embodiment of its microscopic pore structure. The microstructure of rock often has a strong control of its macro mechanics and seepage behavior. An in-depth study of the microscopic pore structure characteristics of reservoir surrounding rock has guiding significance for understanding its macroscopic characteristics and engineering application.
Many research studies have been conducted to analyze the porosity and permeability characteristics of bedded rock salt. Nan Zhang et al. [
33] analyzed the mechanical and permeability properties of mudstone interlayers around the SPR salt cavern in bedded rock salt. Jianwen Chen et al. [
34] investigated the microscopic pore structures of rock salt. They found that the microscopic pore structure of rock salt plays a dominant role in its permeability. Cuevas et al. [
35] used three independent methods to analyze the characteristic of the pore space of rock salt, showing that infraporosity consists of a bundle of non-intersecting pores, whereas microporosity can be considered as a network of pores and throats. Li et al. [
36] proposed a three-dimensional expanded Cosserat medium constitutive model for bedded rock salt and use it in a stability analysis of underground salt caverns. Shi et al. [
37] studied the role of tensile strength development of the mudstone interlayer subject to a brine immersion environment. Liu et al. [
38] studied the physical and mechanical properties as well as the porosity and permeability of bedded rock salt through laboratory tests and show that the bedded rock salt is satisfactory for the tightness and stability of caverns. Yang et al. [
39] discovered that the relationship between the permeability and porosity of mudstones is a key constitutive equation for modeling subsurface fluid flow and is fundamental to the quantification of a range of geological processes. Ji et al. [
40] analyzed the relationship between porosity and permeability, pore structure and distribution characteristics of the salt caverns. All this research provides a solid foundation for the first underground SPR salt cavern construction in China.
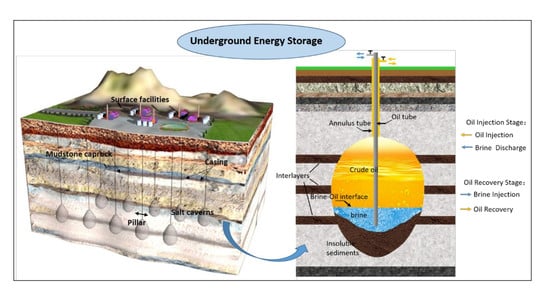
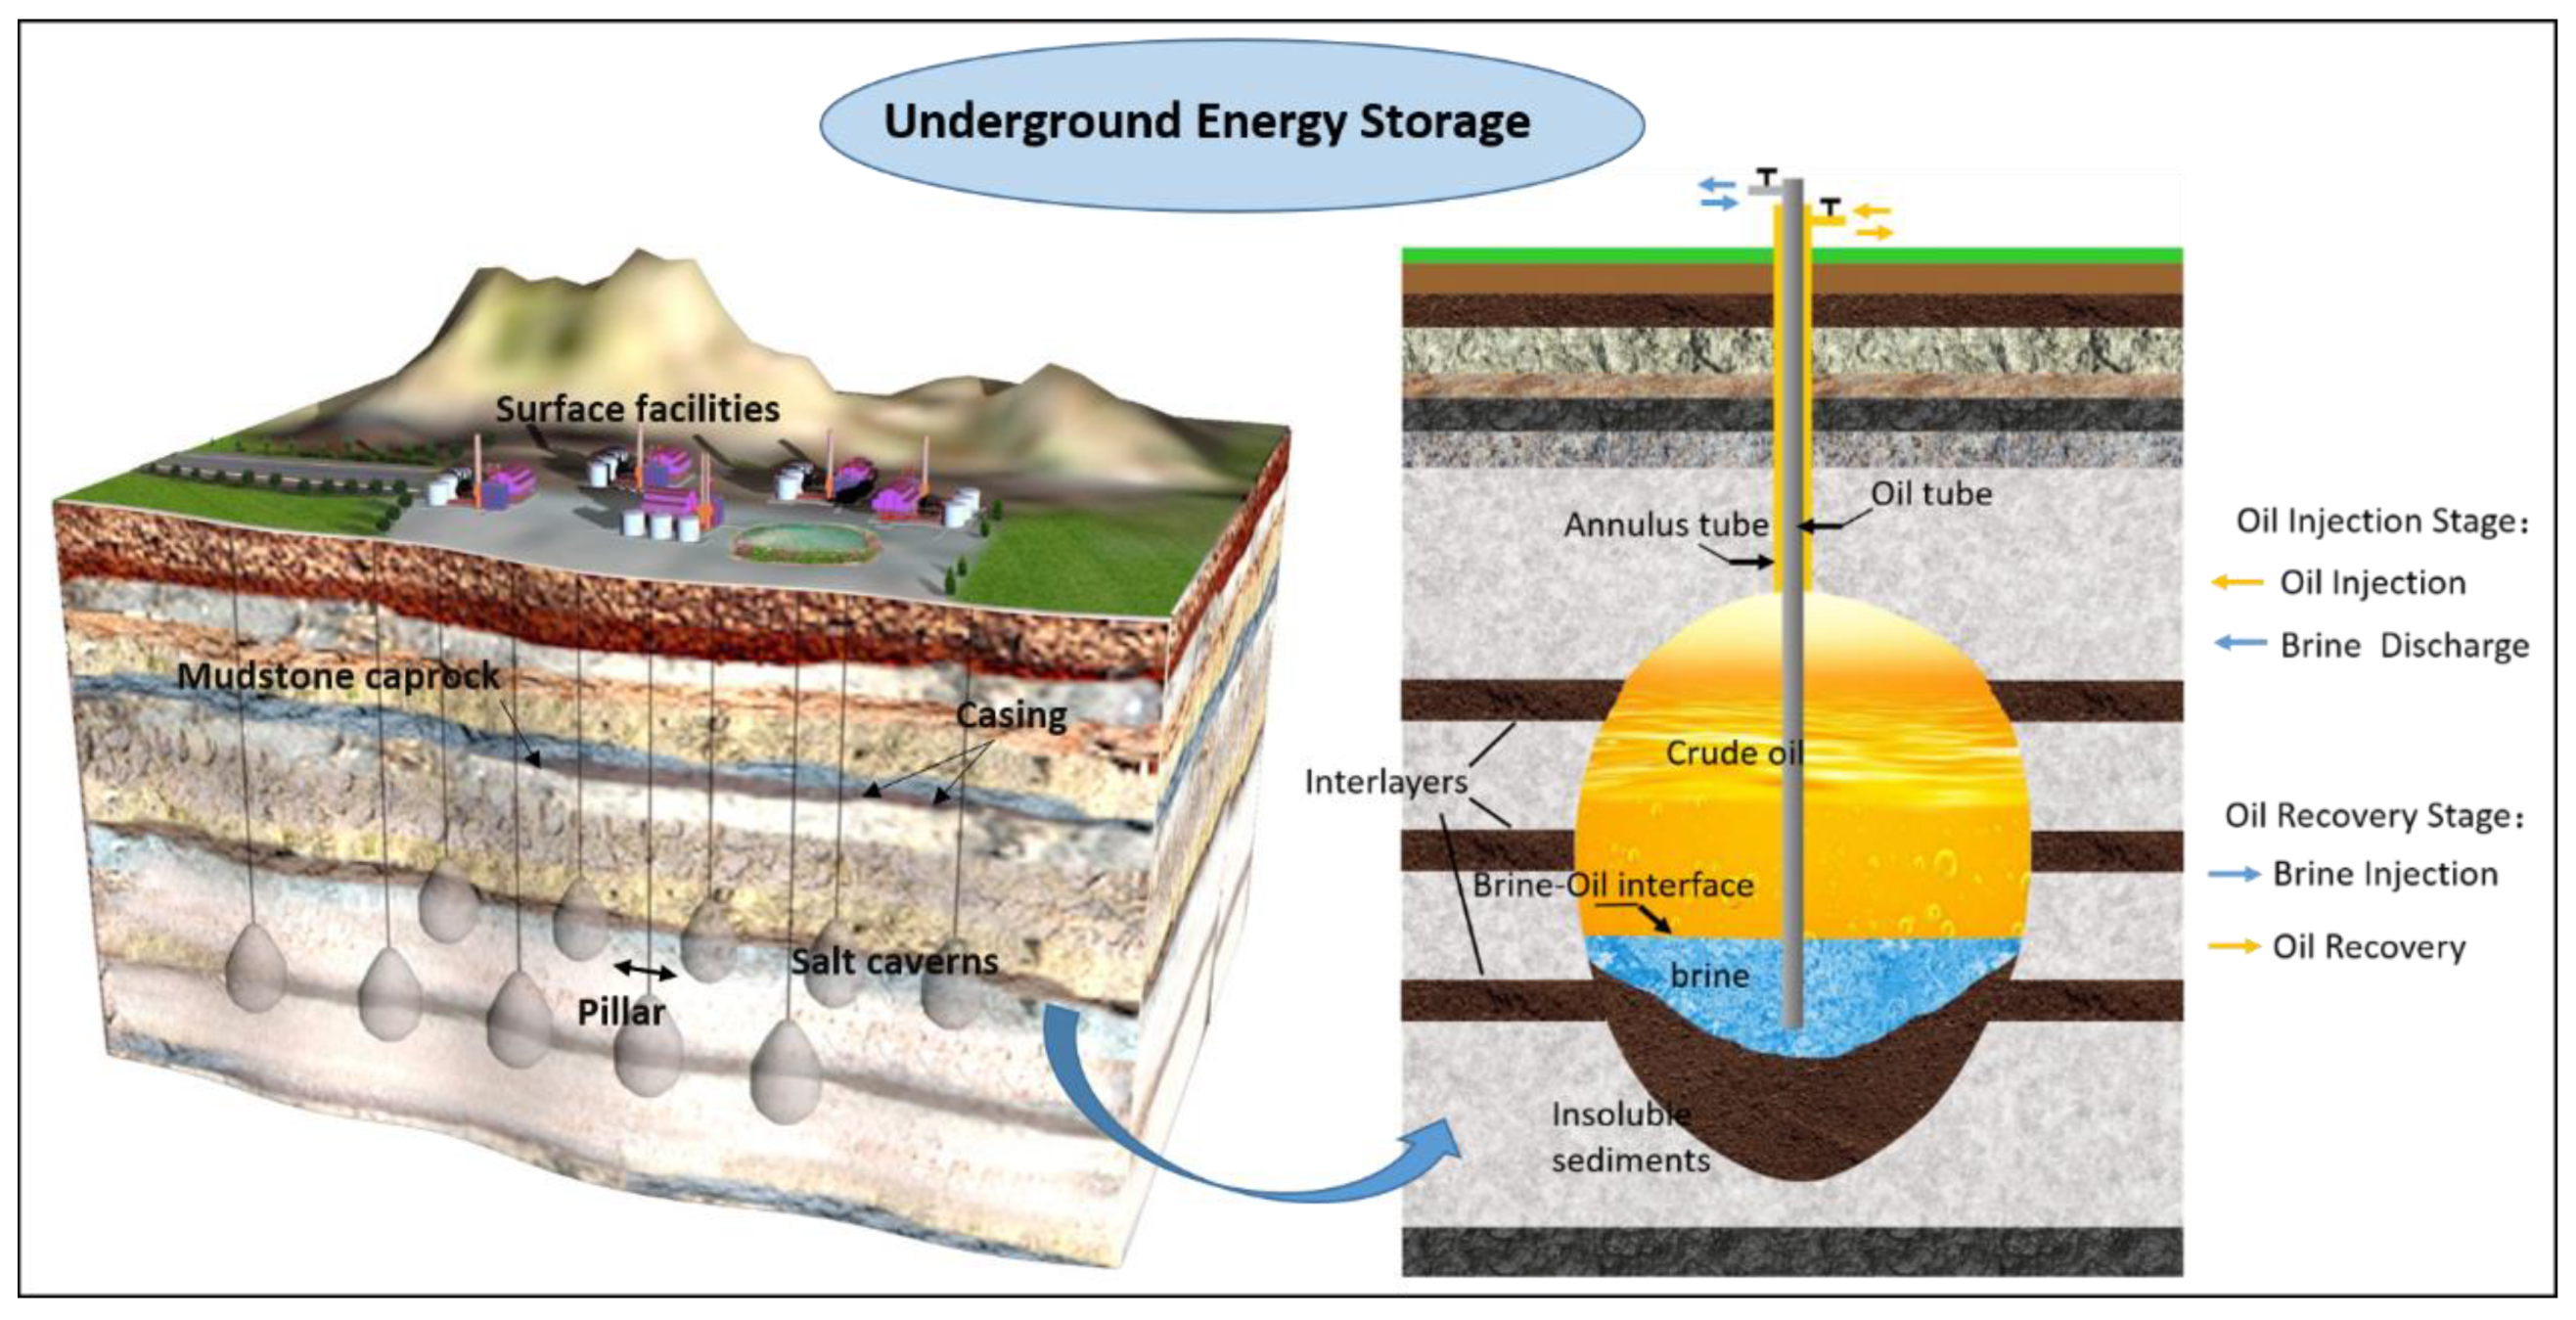
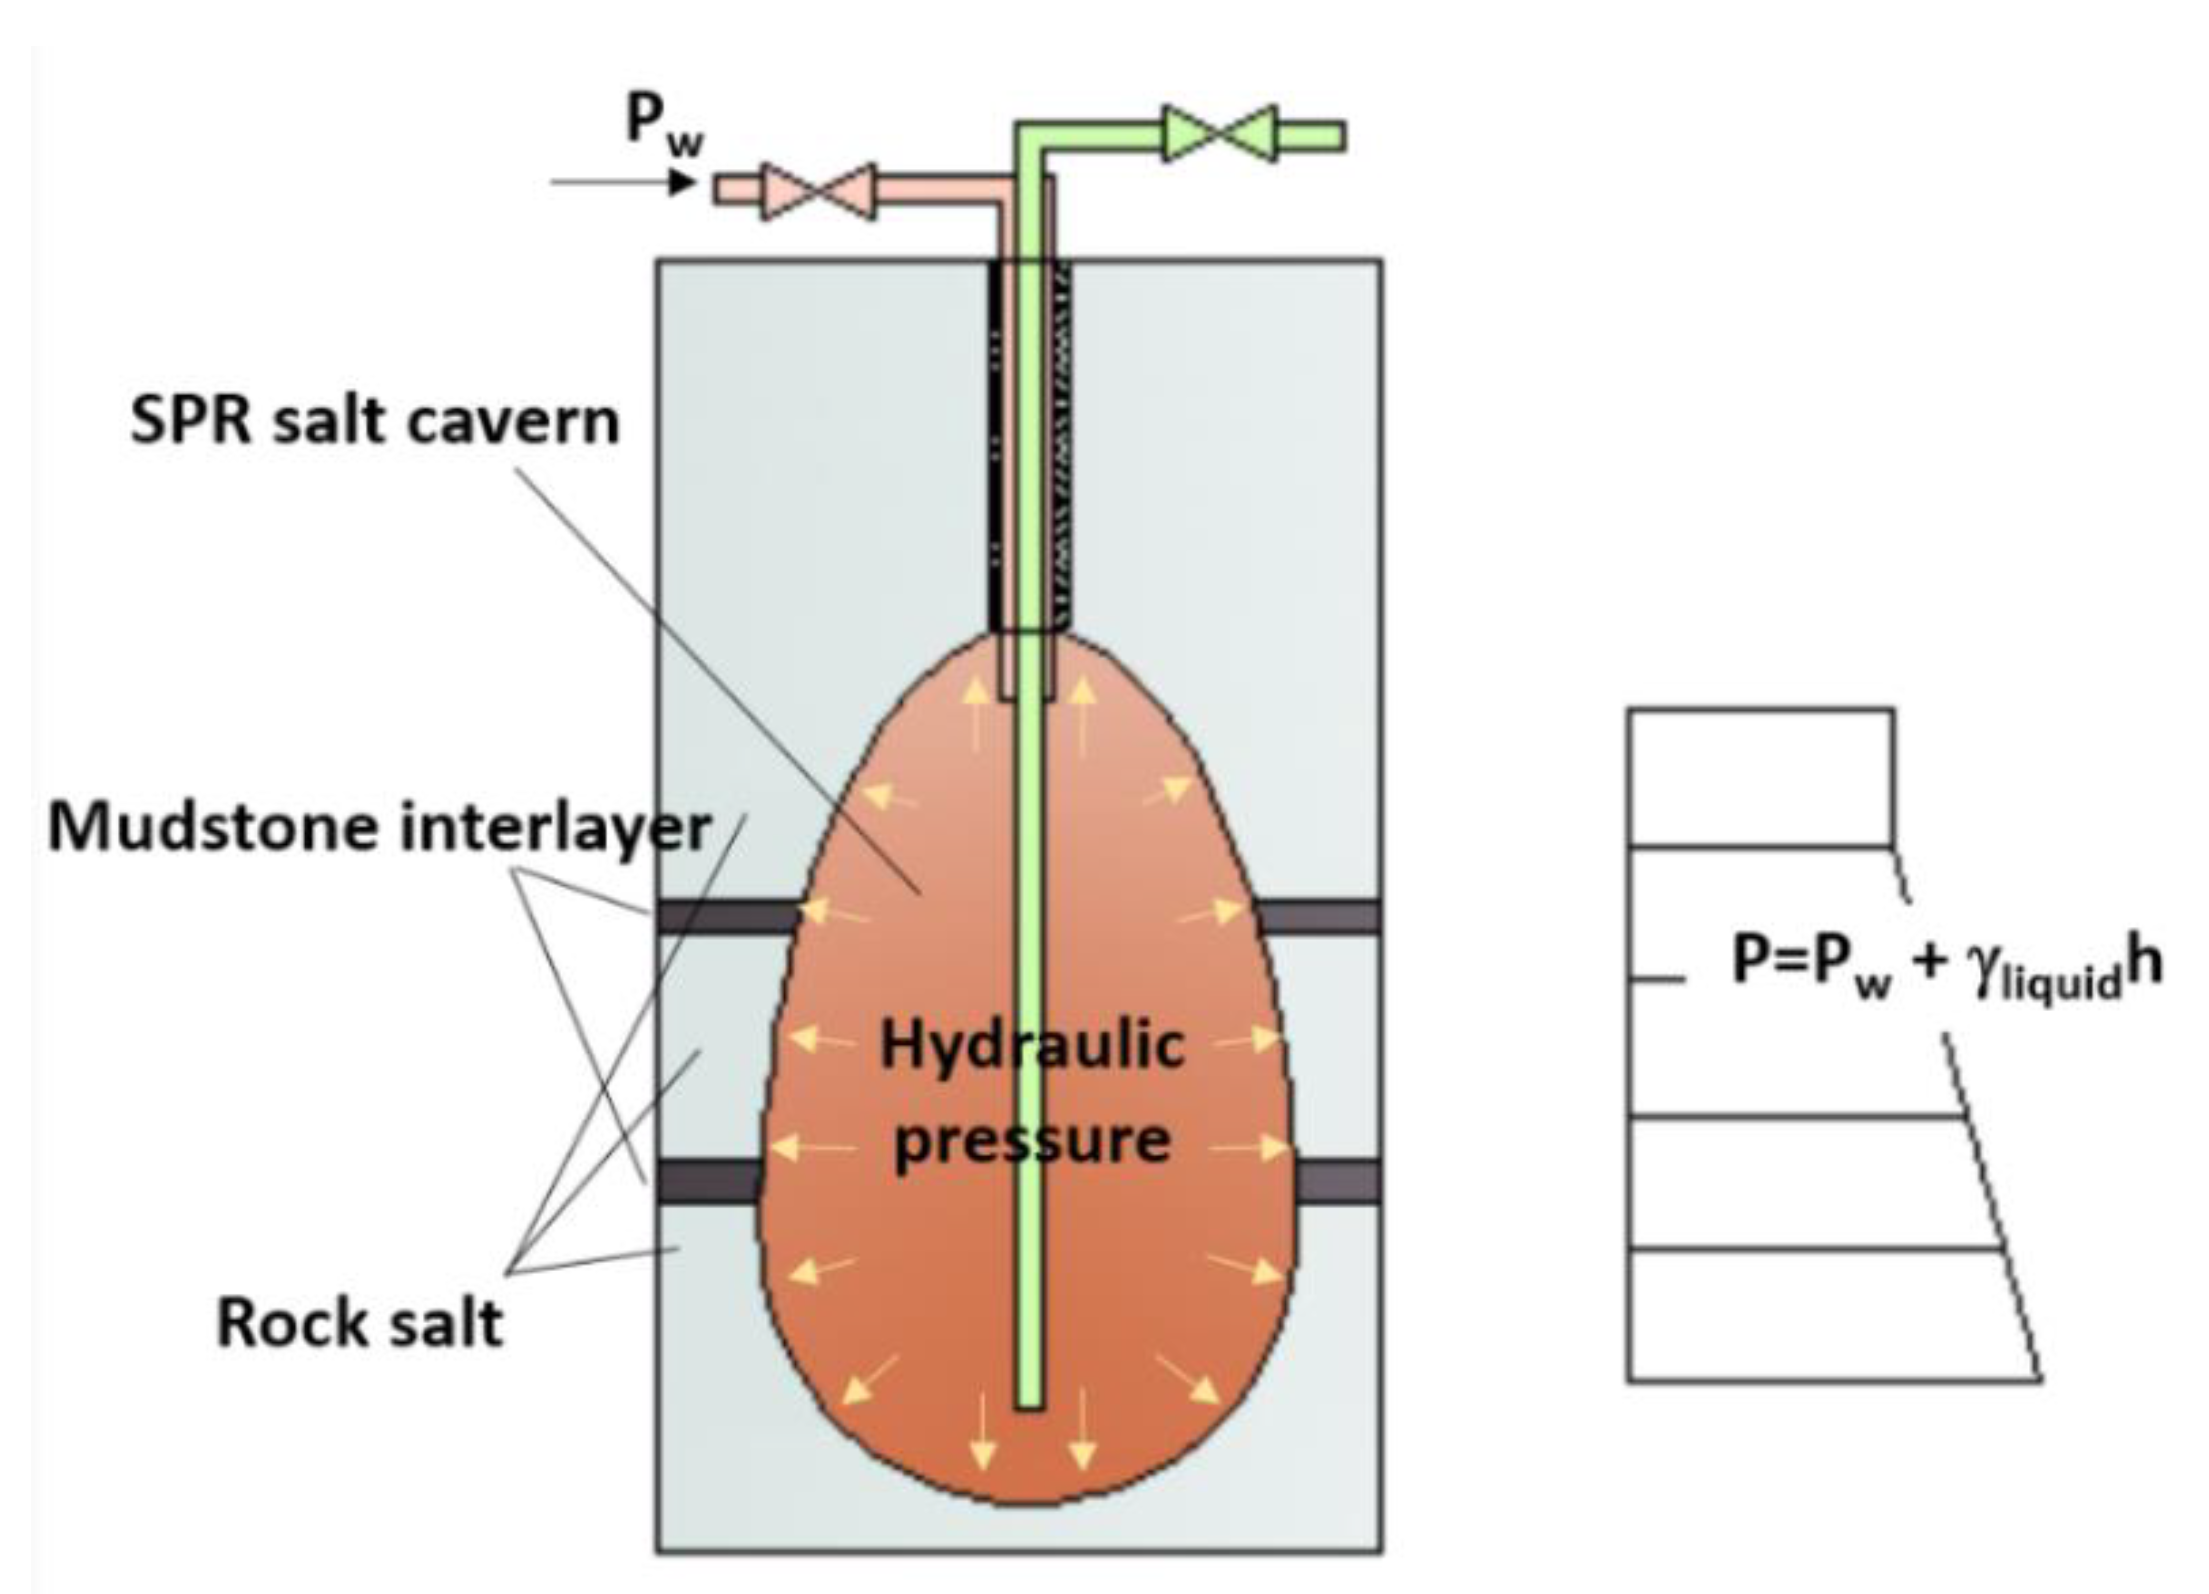
The rocks surrounding oil storage salt caverns are in contact with different storage media under different operation stages [
41]. These contacts are mainly divided into the following three categories: (1) long-term contact between surrounding rock and brine in the cavity before crude oil injection but after completion of cavity formation; (2) the long-term contact between crude oil and surrounding rocks in the long-term storage state after the oil filling of the oil storage cavern has been completed; (3) brine (freshwater) contacts surrounding rock again after crude oil is replaced by brine during the oil extraction stage. Actually, the SPR salt cavern is finished by injecting water and removing the brine. Similarly, oil is removed by displacing it with water injection. As is shown in
Figure 2, during the cavern leaching stage and the oil drainage stage, the surrounding rocks are eroded by high-pressure brine. However, during the storage operation, the surrounding rocks are eroded by high-pressure crude oil. The properties of mudstone interlayers in contact with oil or brine are not clear. What is more, these properties are the most crucial factor to ensure the SPR salt cavern long-term safe and stable operation, due to the essence of the mechanical and permeability characteristics of the surrounding rock being the macroscopic embodiment of its microscopic pore structure. Therefore, it is necessary to measure the physical properties and study the micro-characteristics of the surrounding rock of salt cavern oil storage in different environments. Meanwhile, different storage media will have different effects on the characteristics of the rock surrounding the reserve. At present, very little work has been done on related studies of SPR in bedded rock salt.
In this paper, a microscopic pore structure analysis is presented of SPR salt caverns in bedded rock salt in Jintan, China. The structure of this paper is as follows: in
Section 2 and
Section 3, the experimental scheme and the composition analysis tests of storage media and SEM analysis of SPR cavern surrounding rocks are described. In
Section 4, the pore structure characteristics of cavern surrounding rocks and their specific surface area variation characteristics are described. In
Section 5, the total aperture distribution characteristics of cavern-surrounding rocks are described. In
Section 6 and
Section 7, some discussions and conclusions are presented. This will lay a foundation for further study on the macro-mechanical characteristics and porosity and permeability characteristics of surrounding rock of SPR salt cavern of Jintan, as well as a basic reference for similar engineering practices in other places.
4. Pore Structure Characteristics of Cavern Surrounding Rocks
The gas adsorption method can effectively analyze the pore structure of porous media and reflect the pore distribution of micropores and mesopores [
34]. This method has been widely recognized and applied in the measurement of the pore structure of porous media. In this section, the pore structure characteristics and specific surface area changes in rock surrounding a salt cavern under the four different conditions of natural state, crude oil erosion, brine erosion and washing oil (control) are studied through static nitrogen adsorption tests. The influence of different media storage conditions on the pore structure of the rock is discussed.
4.1. Test Condition
A static nitrogen adsorption test was completed in the testing center of the Wuhan Institute of Geotechnical Mechanics, Chinese Academy of Sciences. Before the test, in order to eliminate the residual bound water and capillary water in the samples, all samples are vacuumed at 300 °C for 3 h. In the experiment, high purity nitrogen was used as the adsorbate, and the nitrogen adsorption capacity at different relative pressures was measured in a liquid nitrogen 77.35 K low-temperature environment. The adsorption isotherm is plotted with the relative pressure as the abscissa and the nitrogen adsorption amount as the ordinate.
According to the erosion of surrounding rock by different media during the construction and operation of the SPR salt cavern, the preparation of rock salt, interlayer and cap rock samples is divided into three different conditions: the natural environment, brine erosion and crude oil erosion. After that, static nitrogen adsorption tests are carried out. For rock salt samples we did not consider the brine erosion condition because of their water solubility. In order to characterize the influence of organic matter residue on surrounding rock pores, the samples saturated with crude oil are divided into two situations as control: crude oil erosion and oil washing (the samples eroded by crude oil are put into organic solvent for 24 h oscillation cleaning), considering that some organic matter in crude oil will remain after high temperature. Basic information about test samples and test conditions is shown in
Table 6.
4.2. Adsorption Isotherm Characteristics
4.2.1. Pore Structure of Rock Salt under Different Conditions
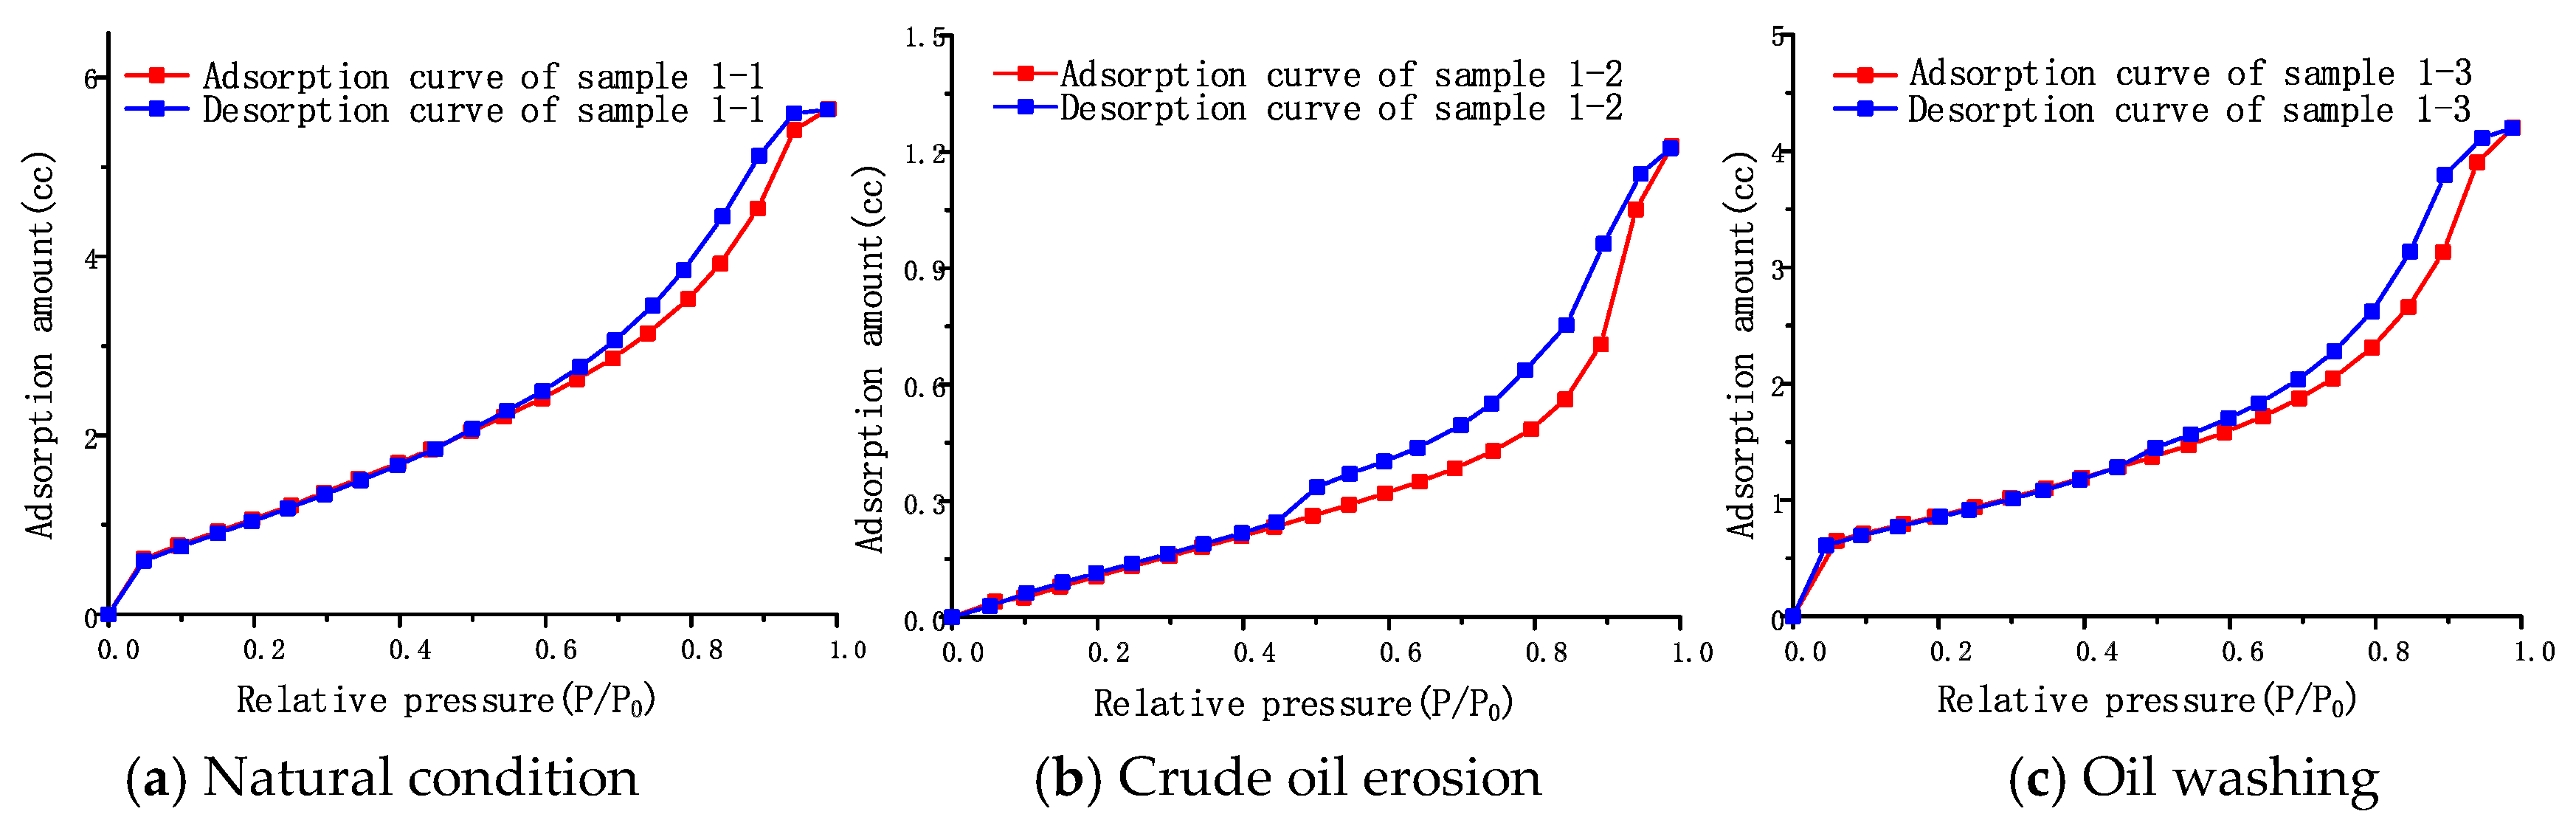
Under natural conditions, the adsorption isotherm of rock salt sample 1-1 is shown in
Figure 6a. The adsorption isotherm has a sudden upward trend when the relative pressure P/P
0 is in the range of 0–0.03. It shows that all samples contain a certain proportion of micropores and micropore filling occurs. When the relative pressure reaches about 0.5, the adsorbate begins to show capillary condensation, and the adsorption isotherm rises rapidly. The adsorption saturation trend appears at a higher relative pressure when the adsorption isotherm begins to flatten, a type IV adsorption isotherm, (defined by IUPAC) [
42]. This indicates that the surface of the rock salt has small pores, medium pores, and large pores, and the large pores do not exceed the measurement range of static nitrogen adsorption, and its pore diameter is less than 500 nm.
The shape of the adsorption loop clearly reflects the pore structure of rock salt samples. Comparing the classification of adsorption loops in adsorption isotherms, it can be seen that the adsorption and desorption curves in sample 1-1 are nearly parallel, belonging to class A adsorption loops [
43]. This indicates that the pore structure of rock salt consists of tubular capillary pores with both ends open.
The adsorption isotherm of the sample under the condition of crude oil erosion is shown in
Figure 6b. The adsorption isotherm morphology of sample 1-2 is slightly different from that of sample 1-1, but still belongs to type IV adsorption isotherm. The adsorption loop is still a Class A loop. This shows that the pore structure of rock salt does not change with crude oil erosion. However, when the relative pressure is low, its adsorption isotherm is different from the one for natural conditions. When the relative pressure
P/
P0 is in the range of 0–0.03, the micropore filling phenomenon observed in sample 1-1 disappears, indicating that the number of micropores number in sample 1-2 decreases under the crude oil erosion. When the relative pressure is close to saturation, the amount of nitrogen adsorption of sample 1-2 is 1.21 cc, which is only 21.4% of the total adsorption amount of 5.65 cc of sample 1-1 under natural conditions.
When the crude oil in the sample is shaken and cleaned by an organic solvent, we find that the adsorption isotherm and adsorption loop morphology of samples 1-3 are basically the same as that of rock salt sample 1-1 under natural conditions, as shown in
Figure 6c. When the relative pressure
P/
P0 is in the range of 0–0.03, the micropore pore filling phenomenon appears again. After washing the oil, the adsorption amount of nitrogen rises to 4.21 cc, which is 74.5% of the total adsorption amount under natural conditions. This shows that, as the residual organic matter in the pores is washed away, the pores of the rock salt gradually return to the structure close to the natural conditions, indicating that the erosion of crude oil does not significantly change the pore size distribution and pore structure morphological characteristics of the rock salt. It is presumed that the disappearance of micropores in sample 1-2 is caused by the filling and covering of micropores in rock salt pores by the residual organic matter in the crude oil.
4.2.2. Pore Structure of Interlayer under Different Conditions
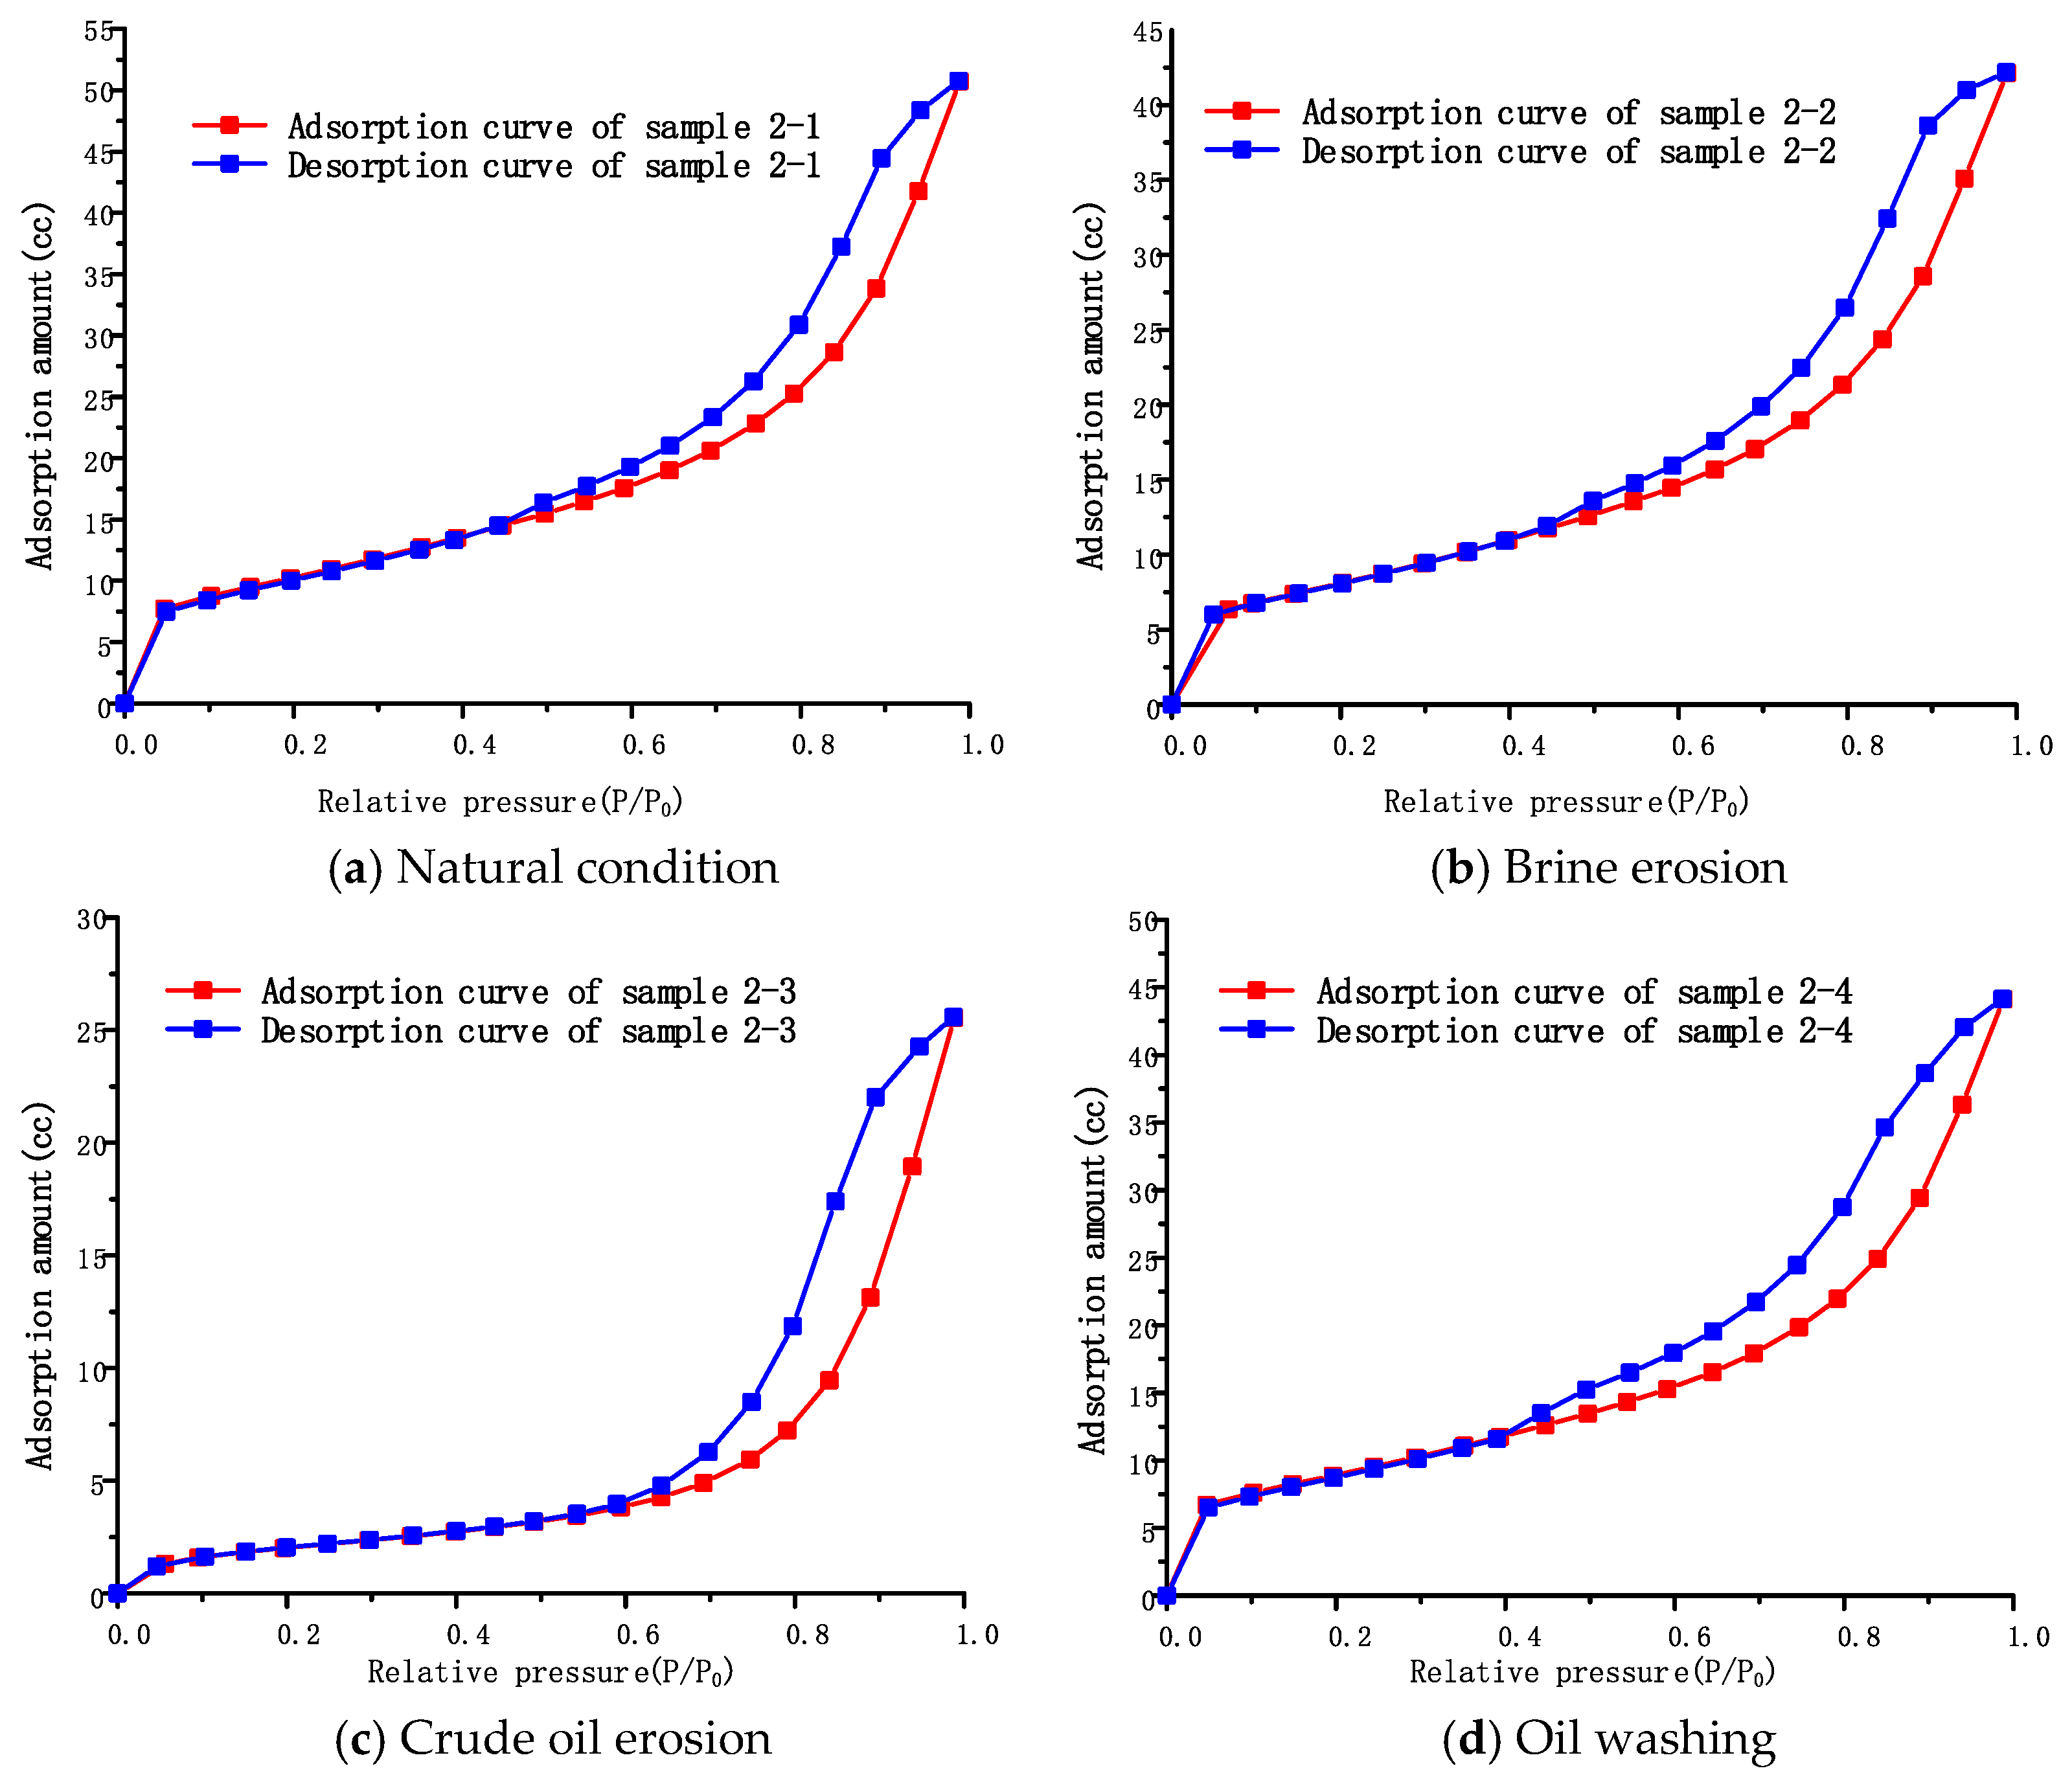
The adsorption isotherms of interlayer samples under different conditions are shown in
Figure 7a–d. The adsorption isotherms are basically similar in shape and all of them are of reverse “
S” type, all belonging to type II adsorption isotherms. When the relative pressure
P/P0 is smaller, in the range of 0–0.03, the adsorption isotherms of the samples under other conditions all rise abruptly, like those of the rock salt samples, except for sample 2-3 under the condition of crude oil erosion. This indicates that the interlayer sample also contains a certain proportion of micropores, and micropore filling occurs. However, under the condition of crude oil erosion, the adsorption isotherm of sample 2-3 has an upward trend, but it is a relatively slow one. It is presumed that although the organic matter in crude oil still covers and fills some micropores in the interlayer, some micropores still remain, resulting in micropore filling, even if it is not obvious. However, as the relative pressure increases gradually, the adsorption capacity also increases, indicating the existence of mesopores. The sharp rise in the adsorption isotherm in the second half shows that, with the increase in multi-layer adsorption layers, capillary condensation begins to occur in the pores, and there is no saturated adsorption trend until the saturated vapor pressure is close. This means that the pore size range of the interlayer samples ranges from small to large until it is out of the range of the measuring instrument. Therefore, when it is necessary to measure the total pore size distribution of the interlayer, the pore size distribution measured by static nitrogen adsorption is incomplete. Thus, the mercury intrusion method should be combined to measure the distribution of macropores so as to obtain the complete chart of the total pore size distribution of the interlayer.
The shape of the adsorption loop still clearly reflects the pore structure of the interlayer samples. Compared with the adsorption loops in adsorption isotherms, interlayer samples under different conditions all belong to Class B adsorption loops, indicating that the pore structure of both brine erosion and crude oil erosion is consistent with that of the interlayer under natural conditions. All of them suggest the presence of slit-like capillary pores with parallel walls. This shows that brine and crude oil erosion have not changed the basic morphological characteristics of the pore structure of the interlayer, but it should be emphasized that this does not mean that there is no influence on the interlayer under the brine and crude oil erosion. The adsorption capacity of samples with the same mass is obviously different under different conditions. The adsorption capacity of sample 2-1 under natural conditions was the largest, reaching 50.72 cc. The adsorption capacity of sample 2-2 under brine erosion condition decreased to 42.12 cc, which was 16.96% lower than under natural conditions, while the adsorption capacity of sample 2-3 under crude oil erosion was the lowest, 25.54 cc, which was 49.65% lower than that under natural conditions. After washing with oil, the adsorption capacity of sample 2-4 rose to 44.11 cc, which was 86.97% of the adsorption capacity of sample 2-1. This means that the adsorption capacity of interlayer samples is different under different conditions. This is closely related to the specific surface area of the samples under various conditions. Since adsorption occurs on the surface of the adsorbent, the specific surface area of the adsorbent is an important factor affecting the adsorption capacity. The larger the specific surface area, the stronger the adsorption capacity. Therefore, it is very important to study the change characteristics of the specific surface area of samples under different conditions to explore the influence of crude oil and brine on pore characteristics.
4.2.3. Pore Structure of Caprock under Different Conditions
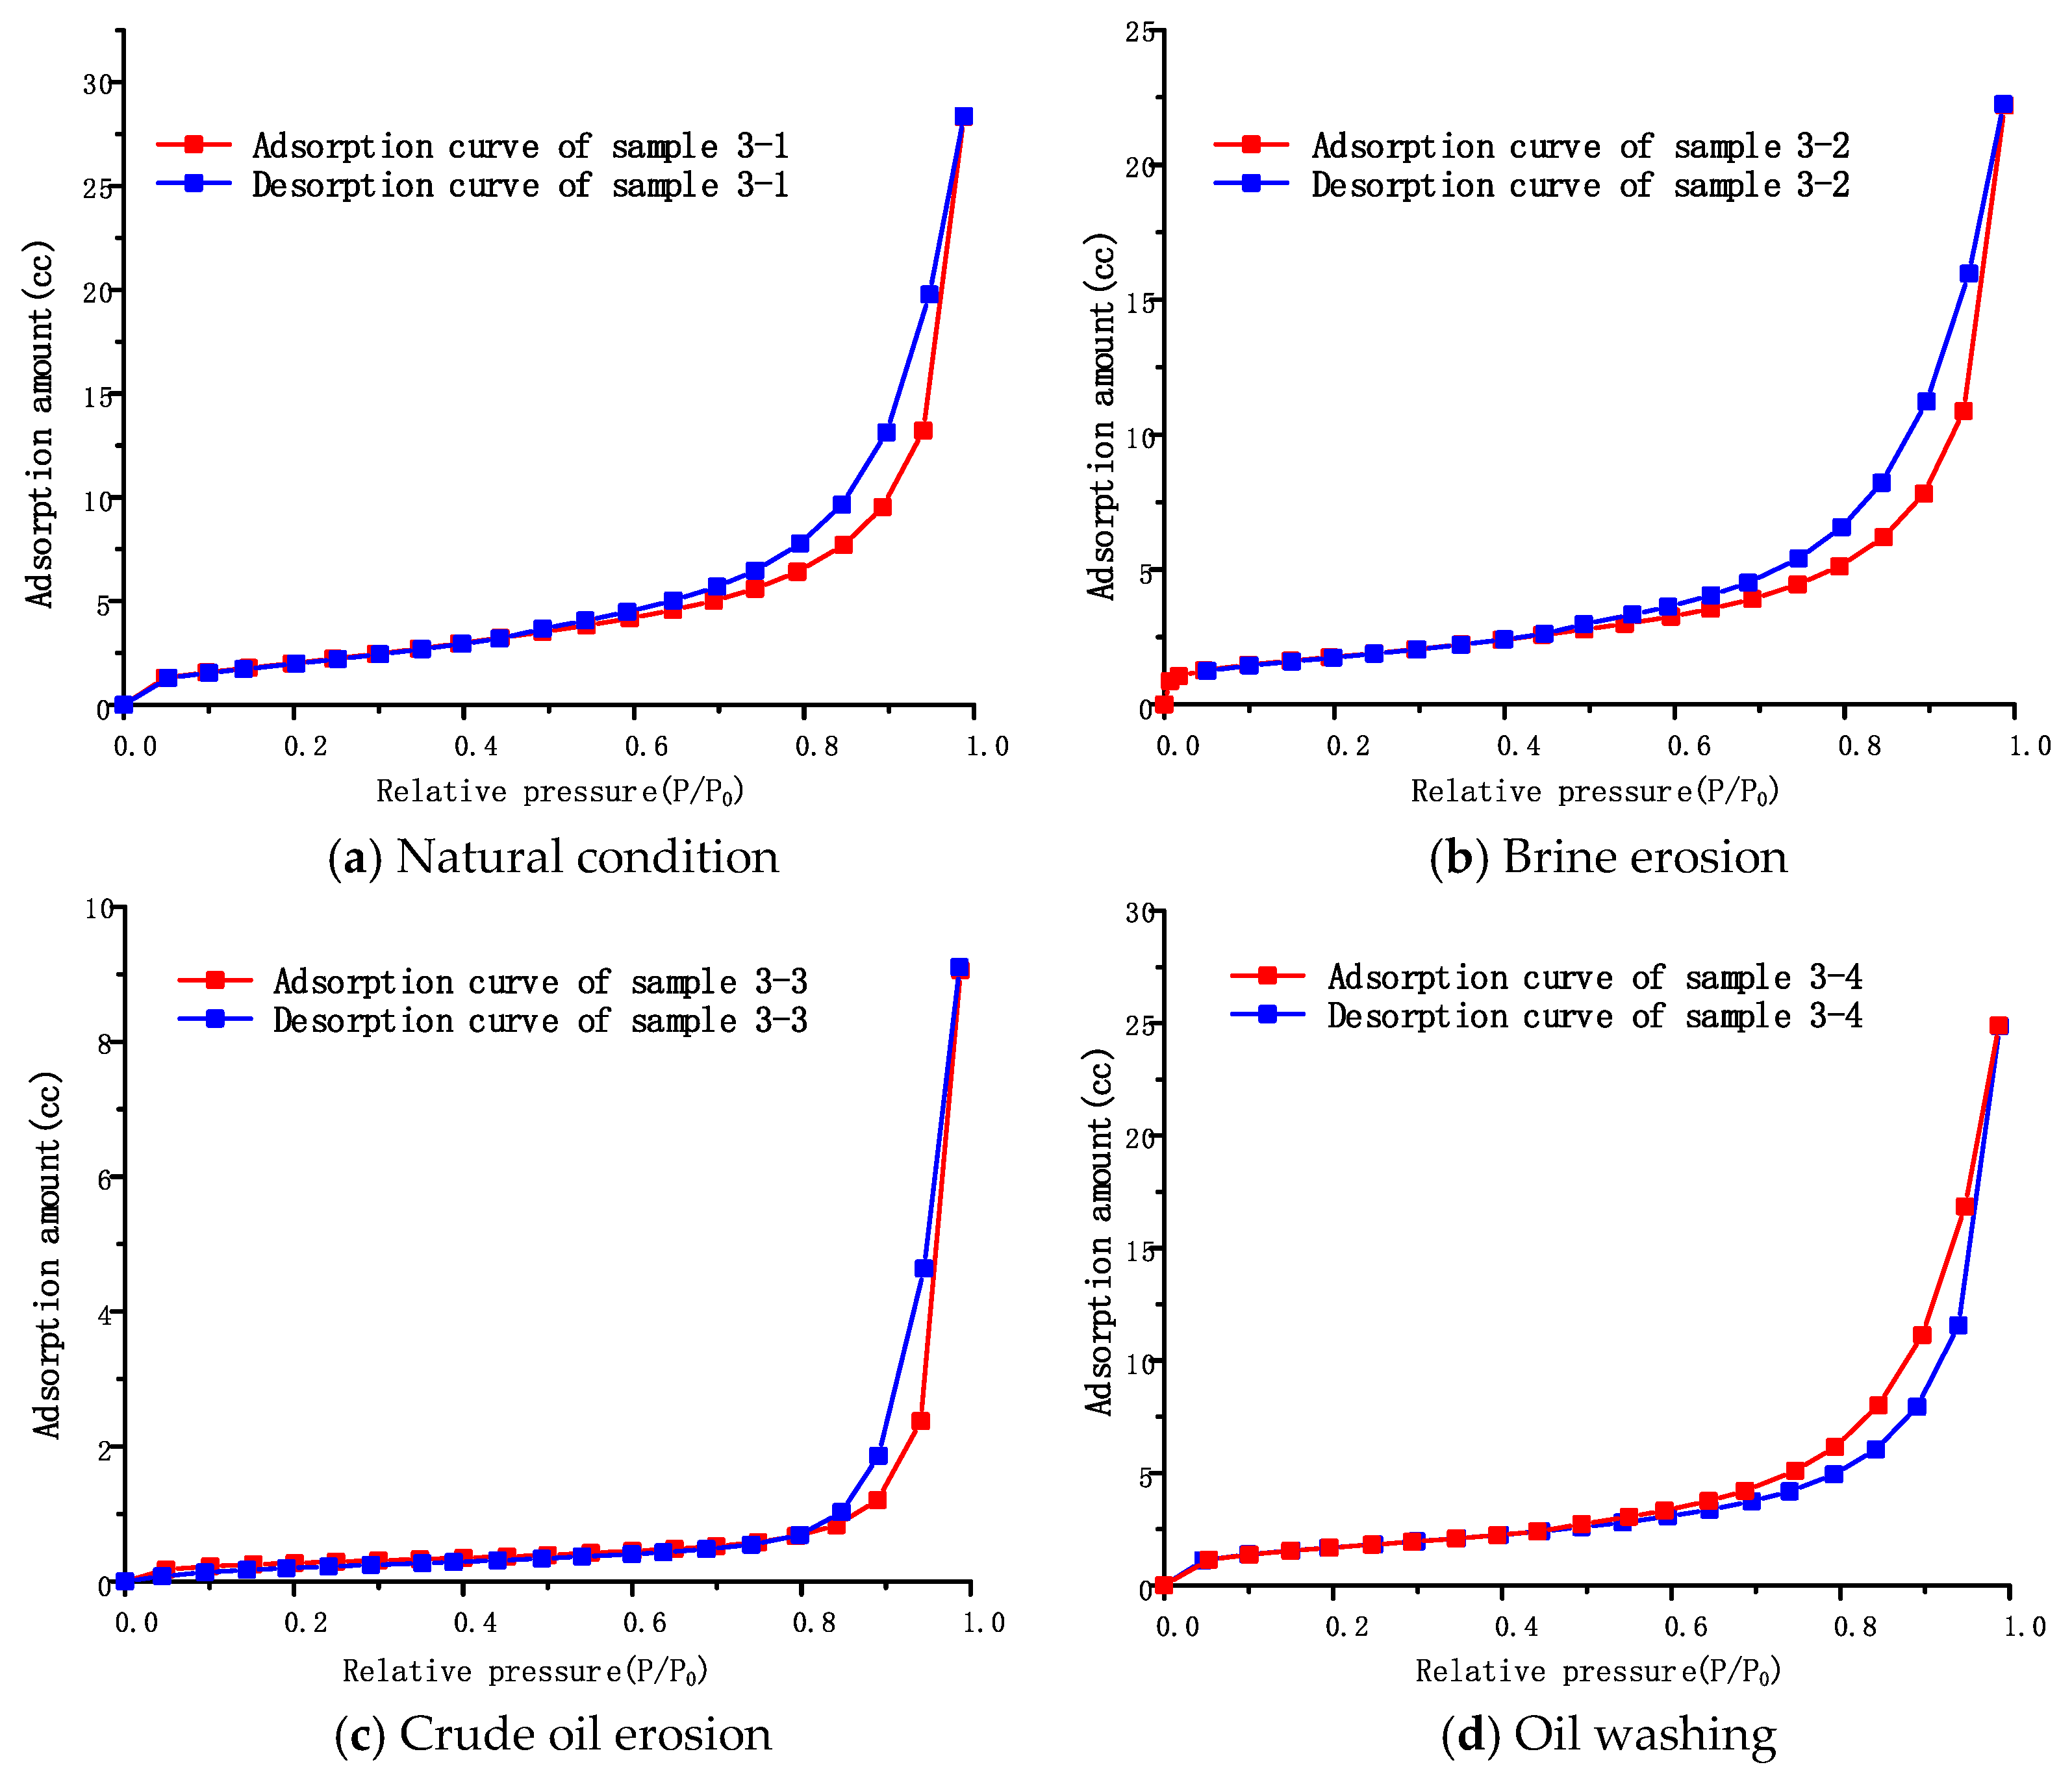
The adsorption isotherms of cover samples under different conditions are shown in
Figure 8a–d. Similar to the adsorption isotherms of interlayer samples, the adsorption isotherms of caprock samples all belong to Class II adsorption isotherms. Micropore filling also occurs when the relative pressure is low, and capillary condensation occurs when the relative pressure is close to saturation. This shows that the pores of the caprock samples also consist of small pores, mesopores and macropores, and the pore size distribution of the macropores still needs further determination by mercury intrusion. The adsorption amounts of the samples under four different conditions are as follows: natural condition sample 3-1 (28.32 cc) > washed oil sample 3-4 (24.86 cc) > brine erosion sample 3-2 (22.20 cc) > crude oil erosion sample 3-3 (3.21 cc). This rule is consistent with interlayer samples under different conditions, and the causes of this phenomenon will be discussed in the next section.
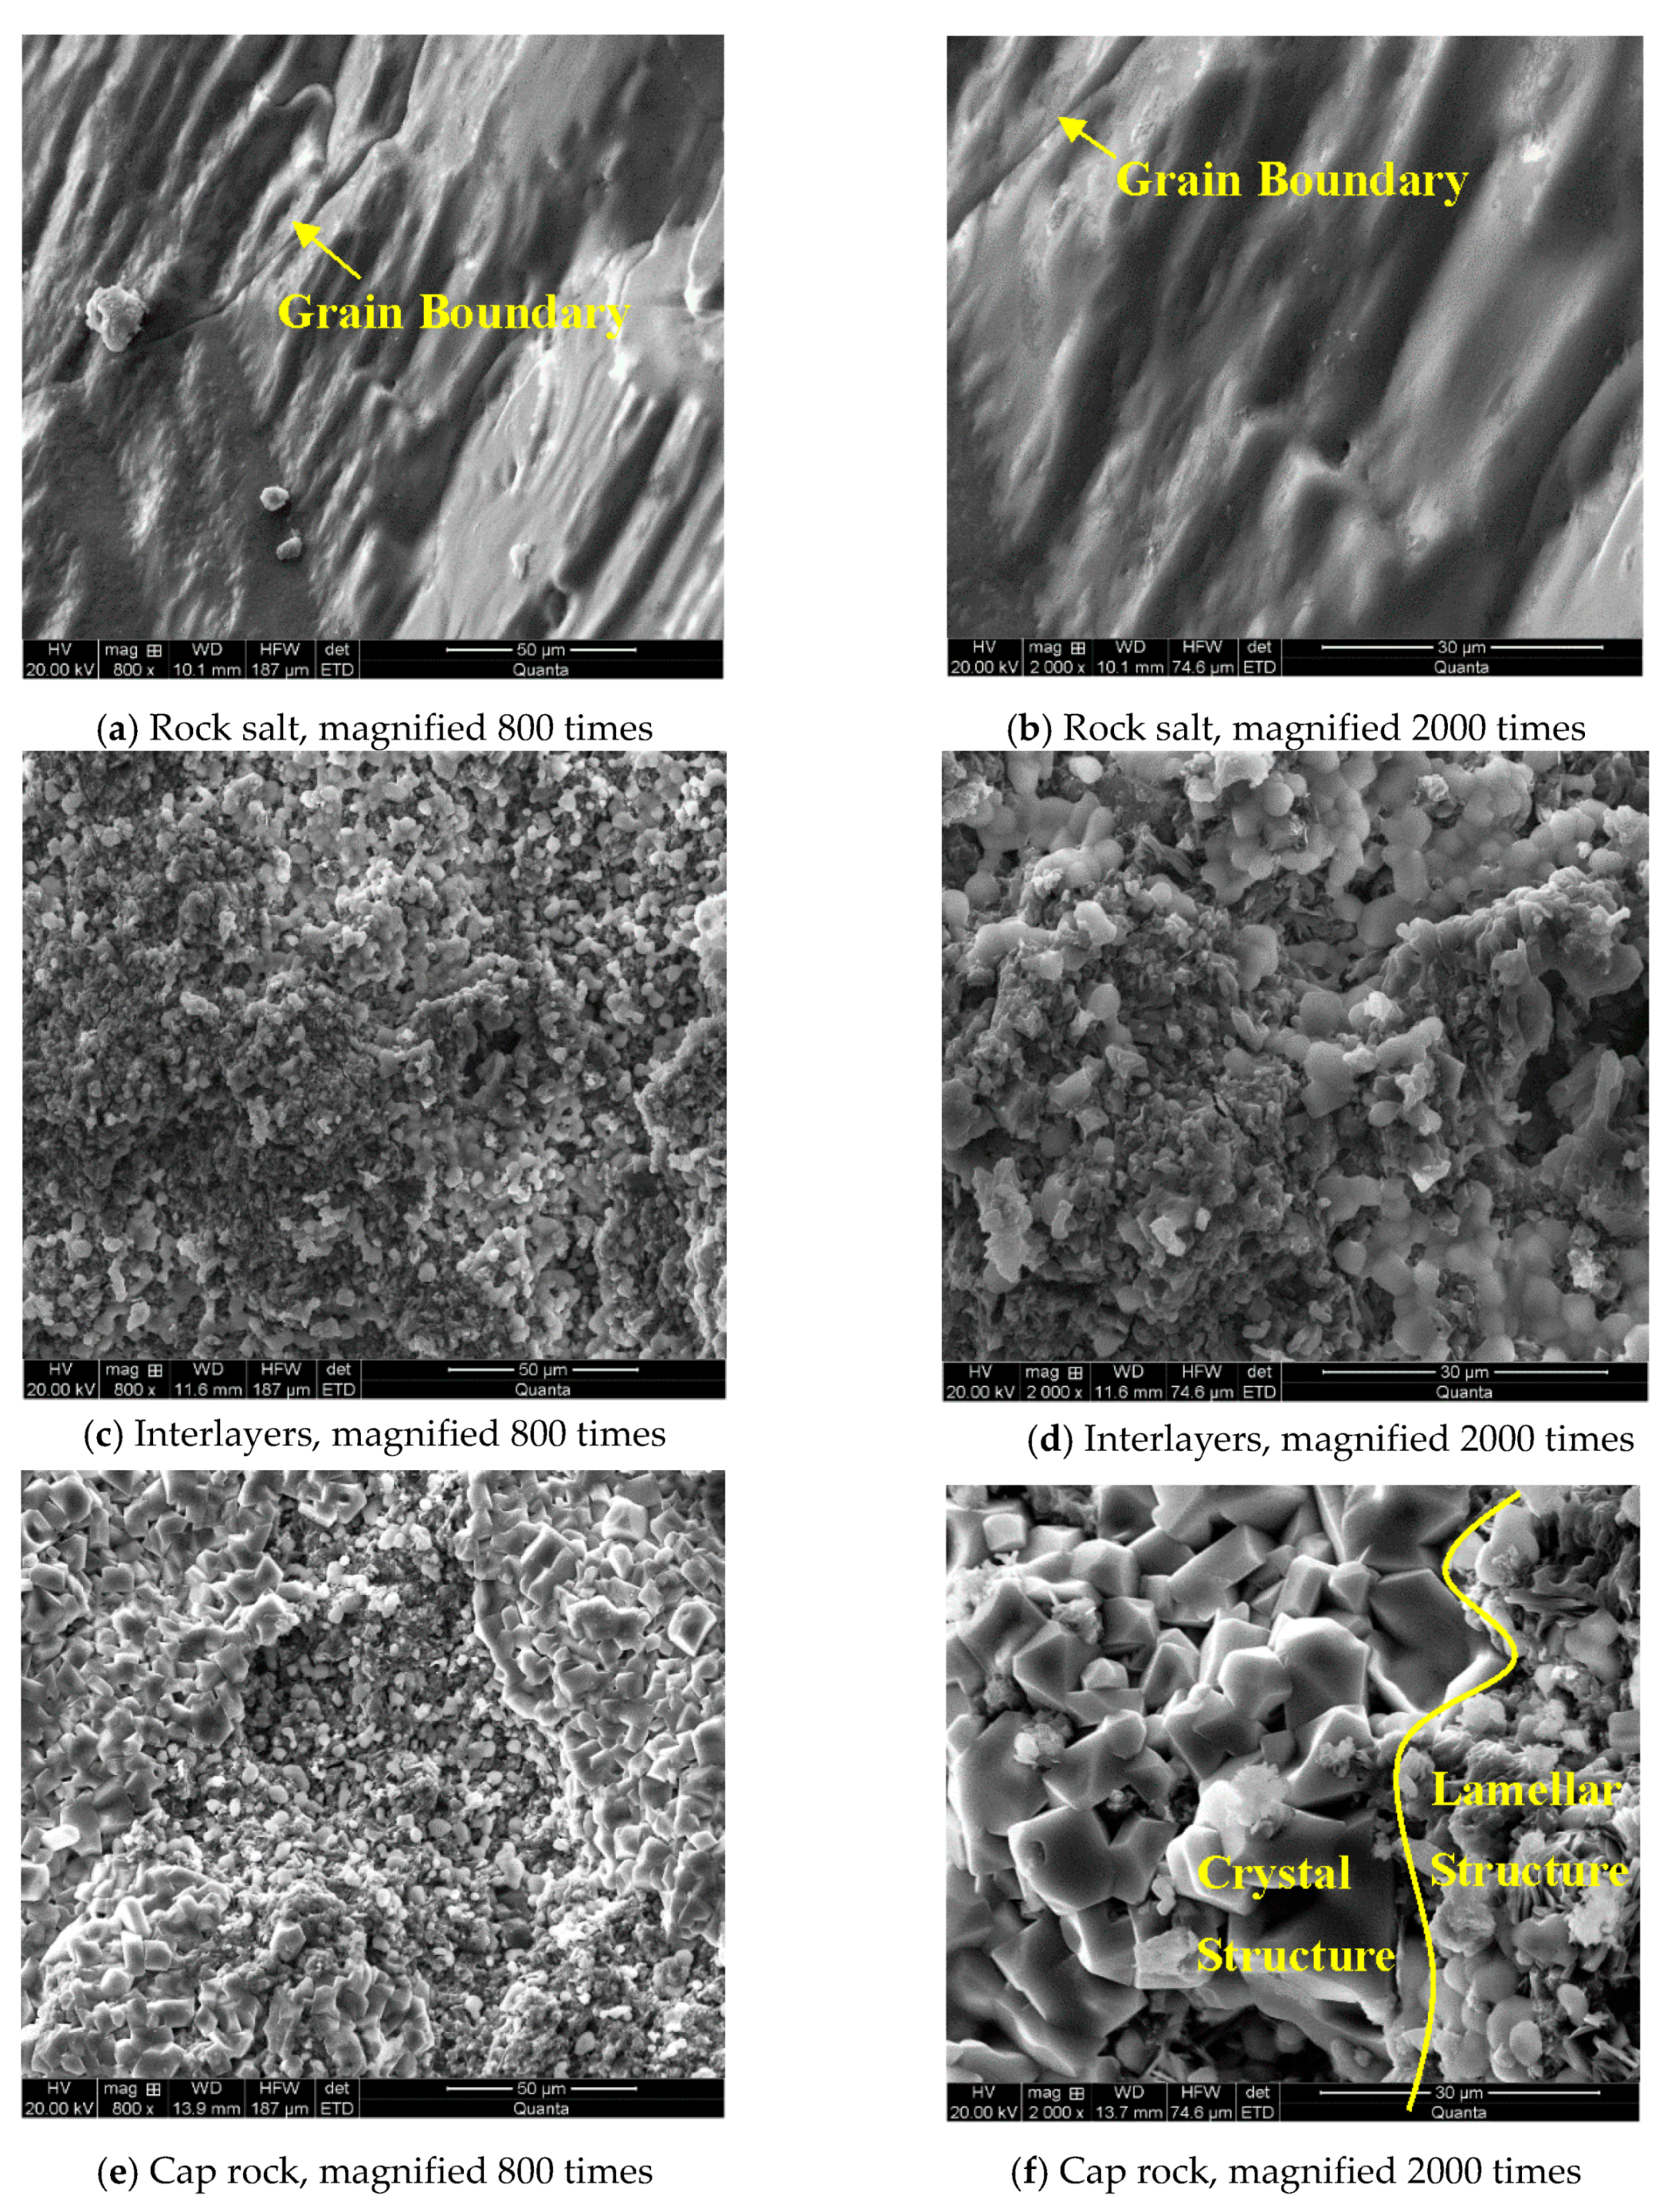
The cap-rock samples under different conditions all present atypical adsorption loops, which do not belong to any of the five types of adsorption loops from A to E, but are the superposition of several typical loops. According to the comparison of adsorption loops, it is found that the cap-rock samples can be considered to be formed by the superposition of class A adsorption loops and class D adsorption loops, which may be due to the pore structure of the cap layer not only having tubular capillary pores with both ends open, but also having tapered capillary pores with all sides open. This means that it not only has tubular structures but also lamellar structures. This kind of adsorption isotherm morphology is often related to the high content of clay in the crystal grains of the material, which is verified by the scanning electron microscope observation results of the cap layer, as shown in
Figure 3f.
4.3. Specific Surface Area Variation Characteristics
The specific surface area refers to the total surface area (m
2/g) of a unit mass substance. Gas adsorption method is considered as one of the most authoritative test methods to measure it [
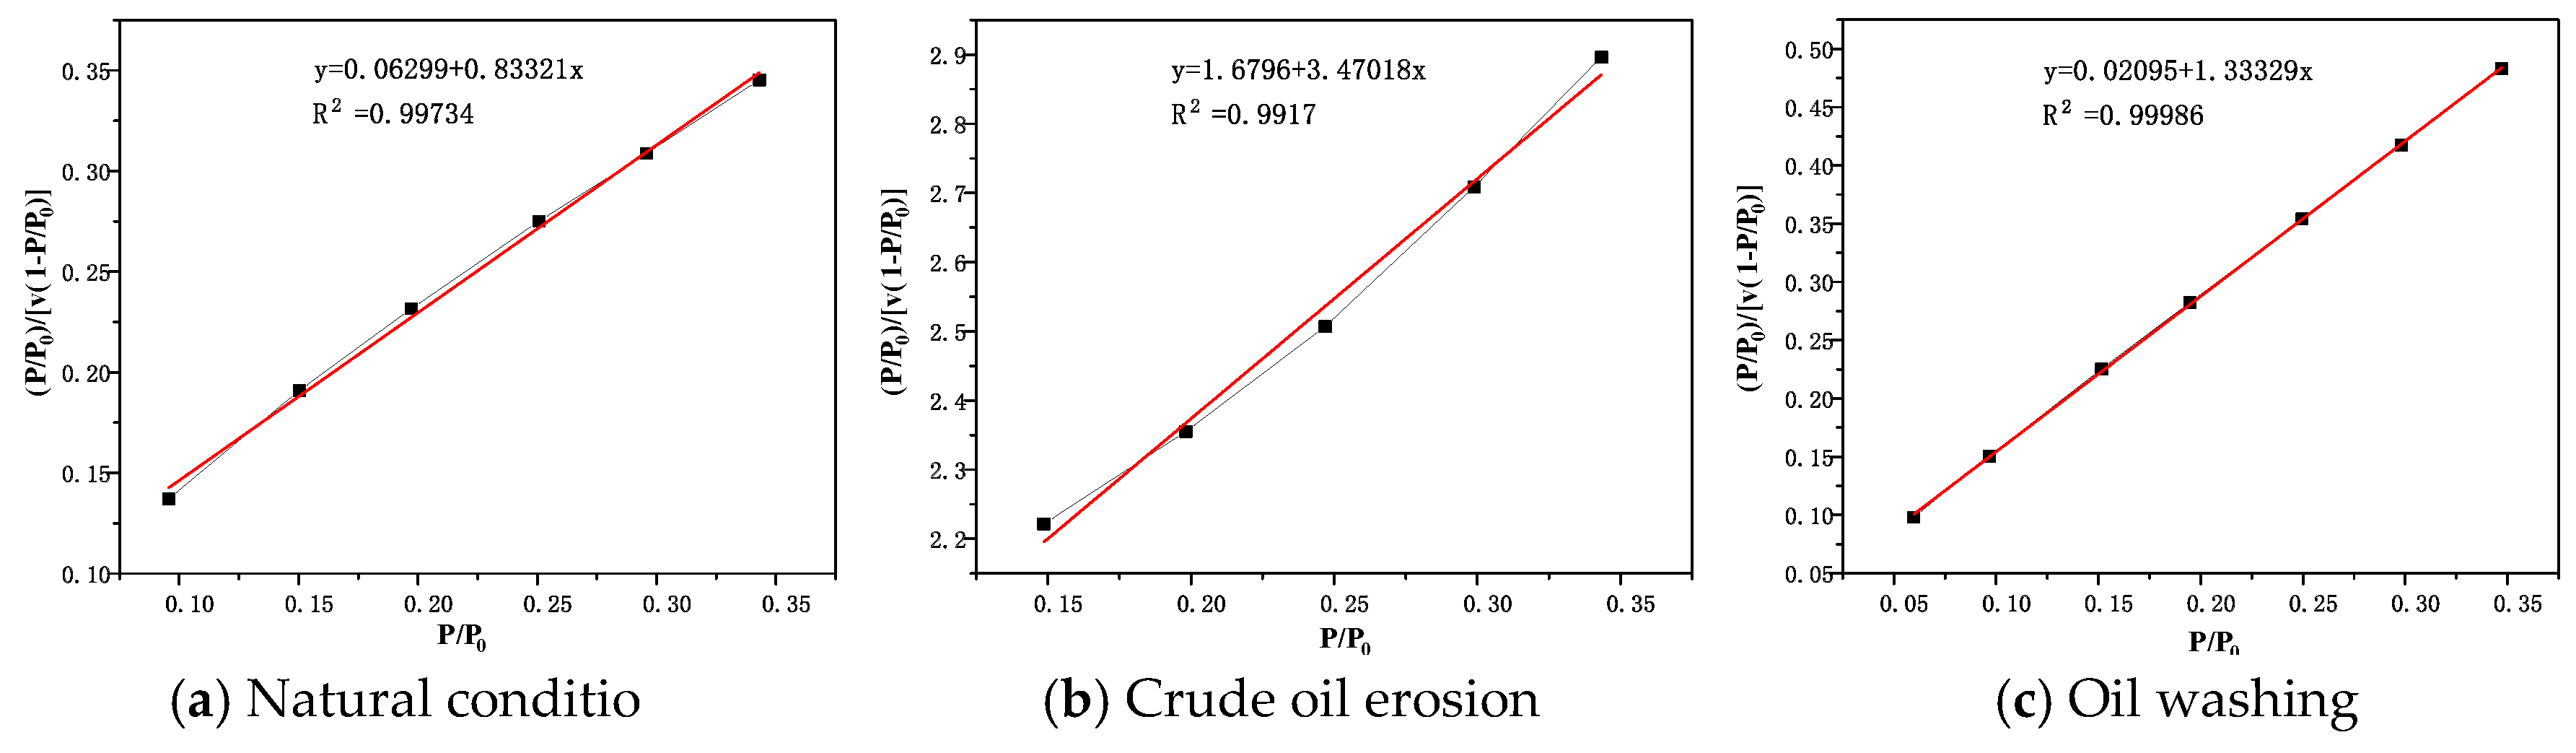
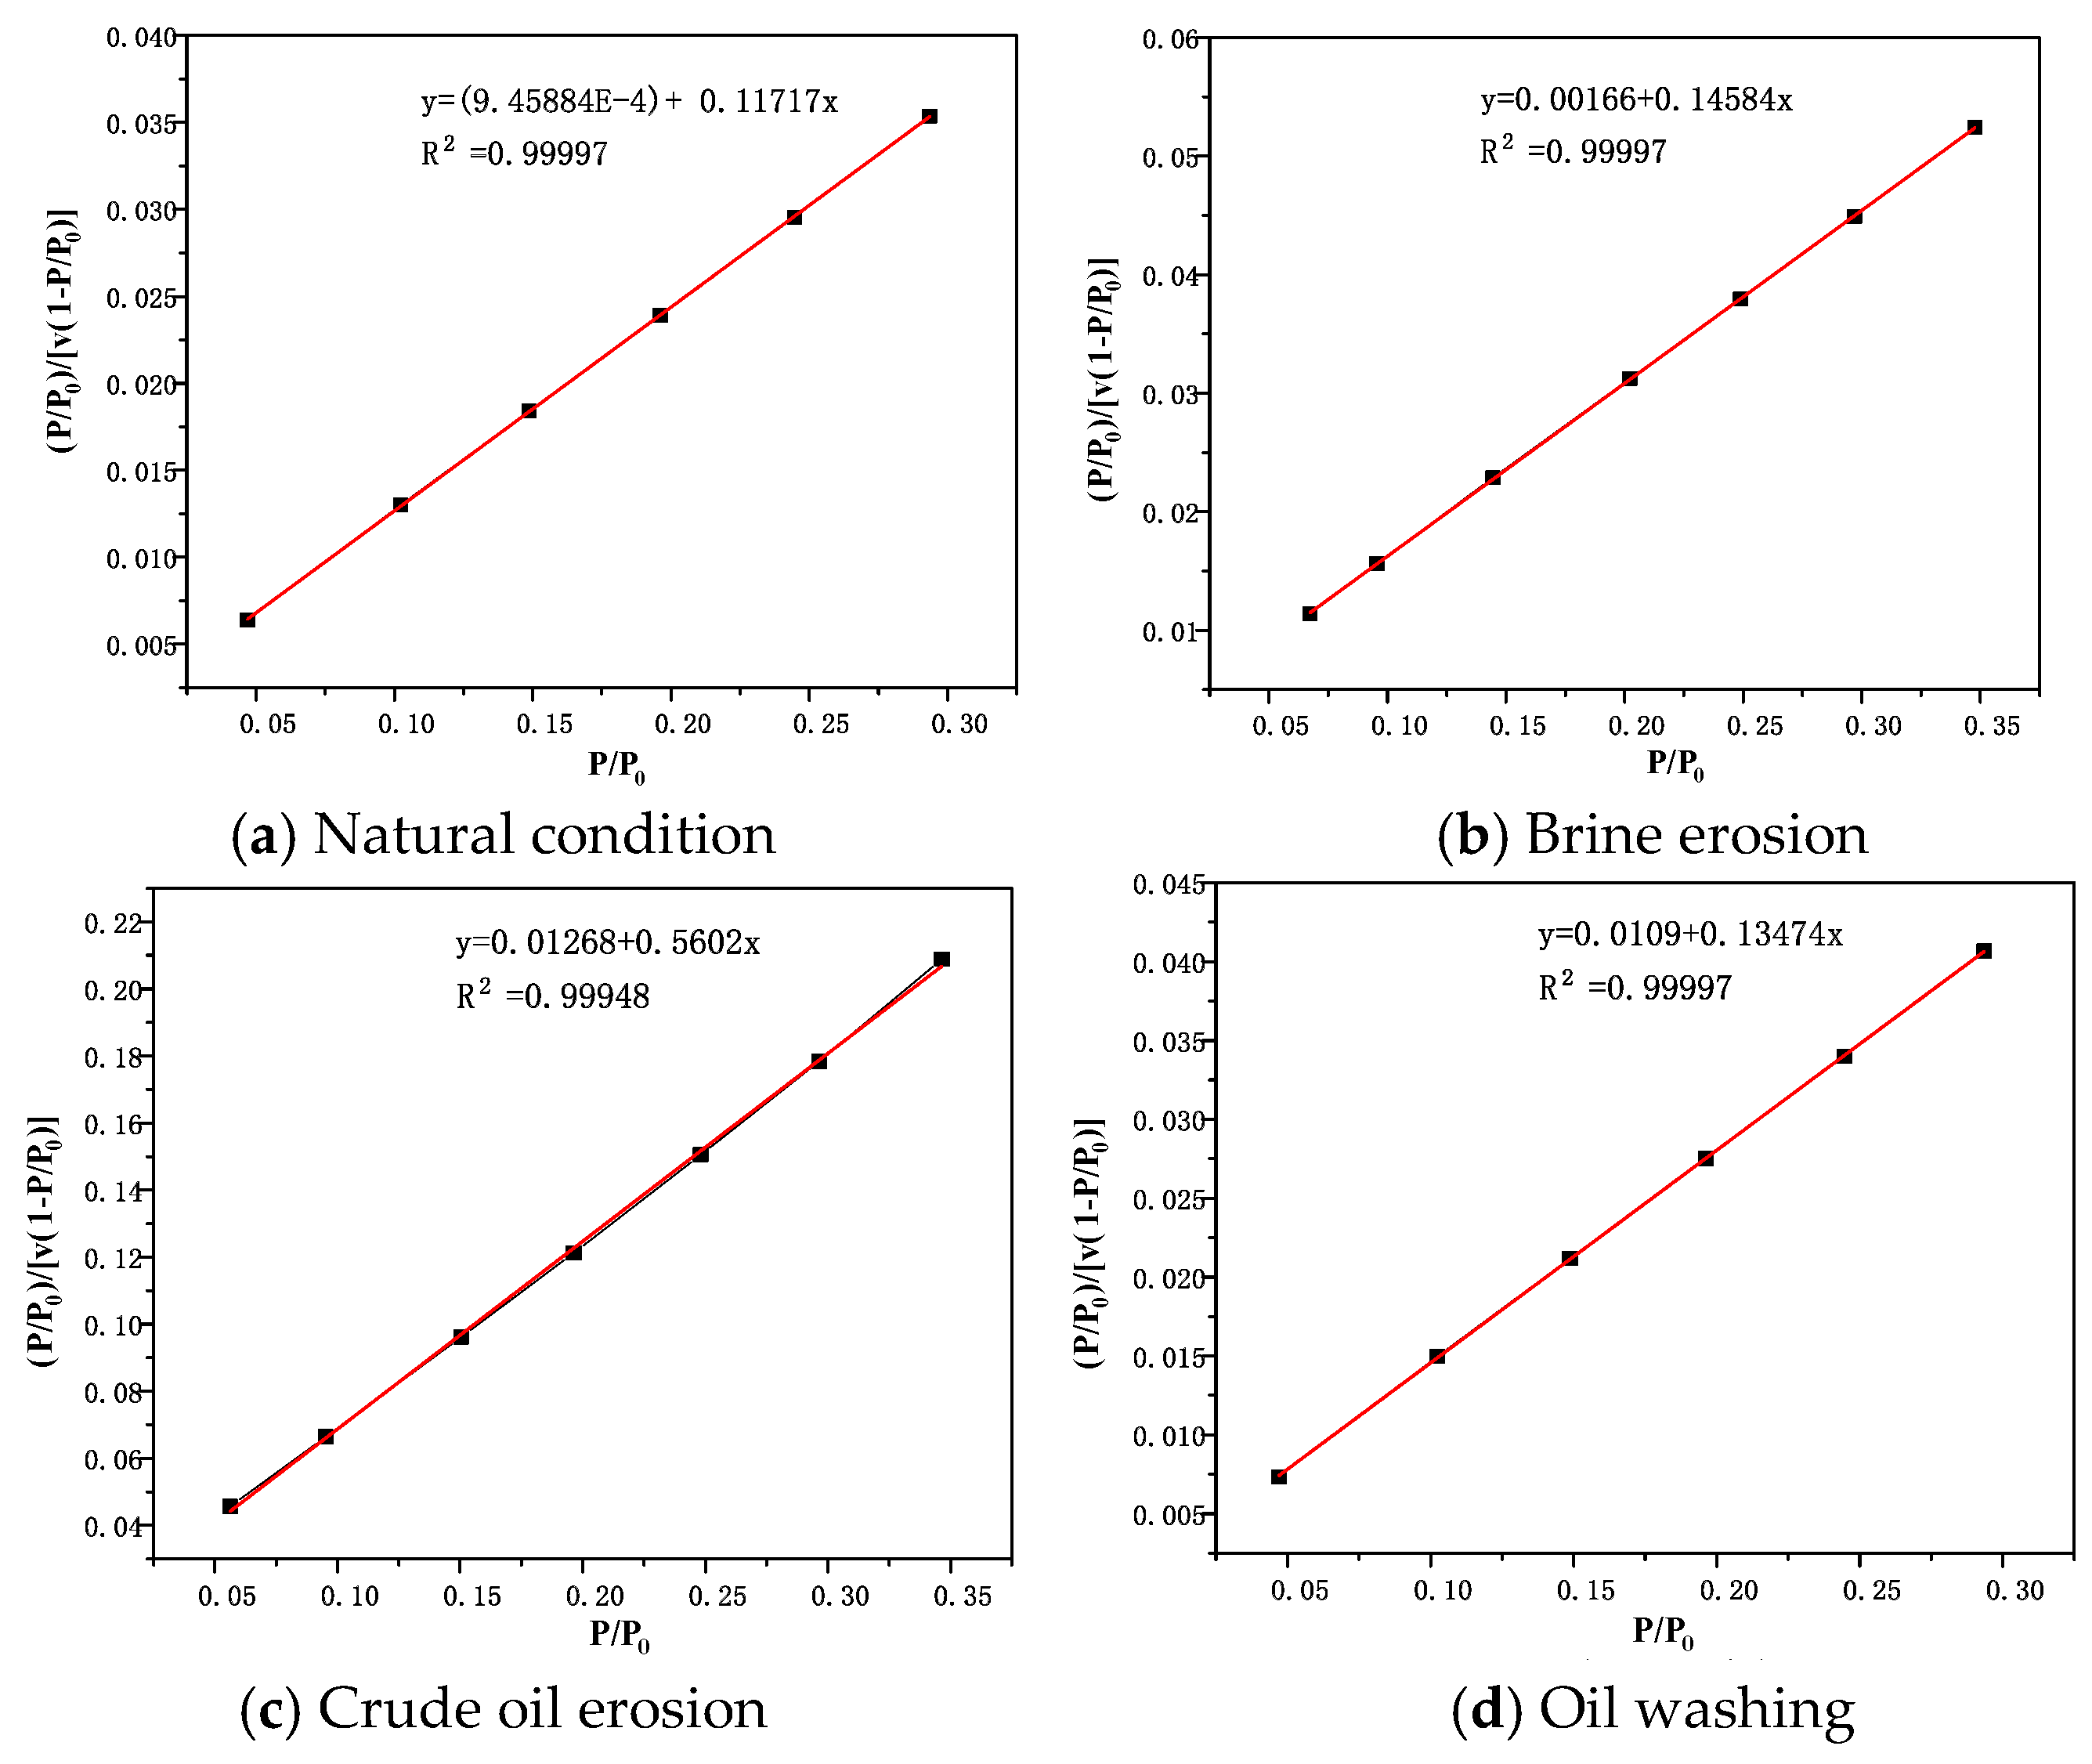
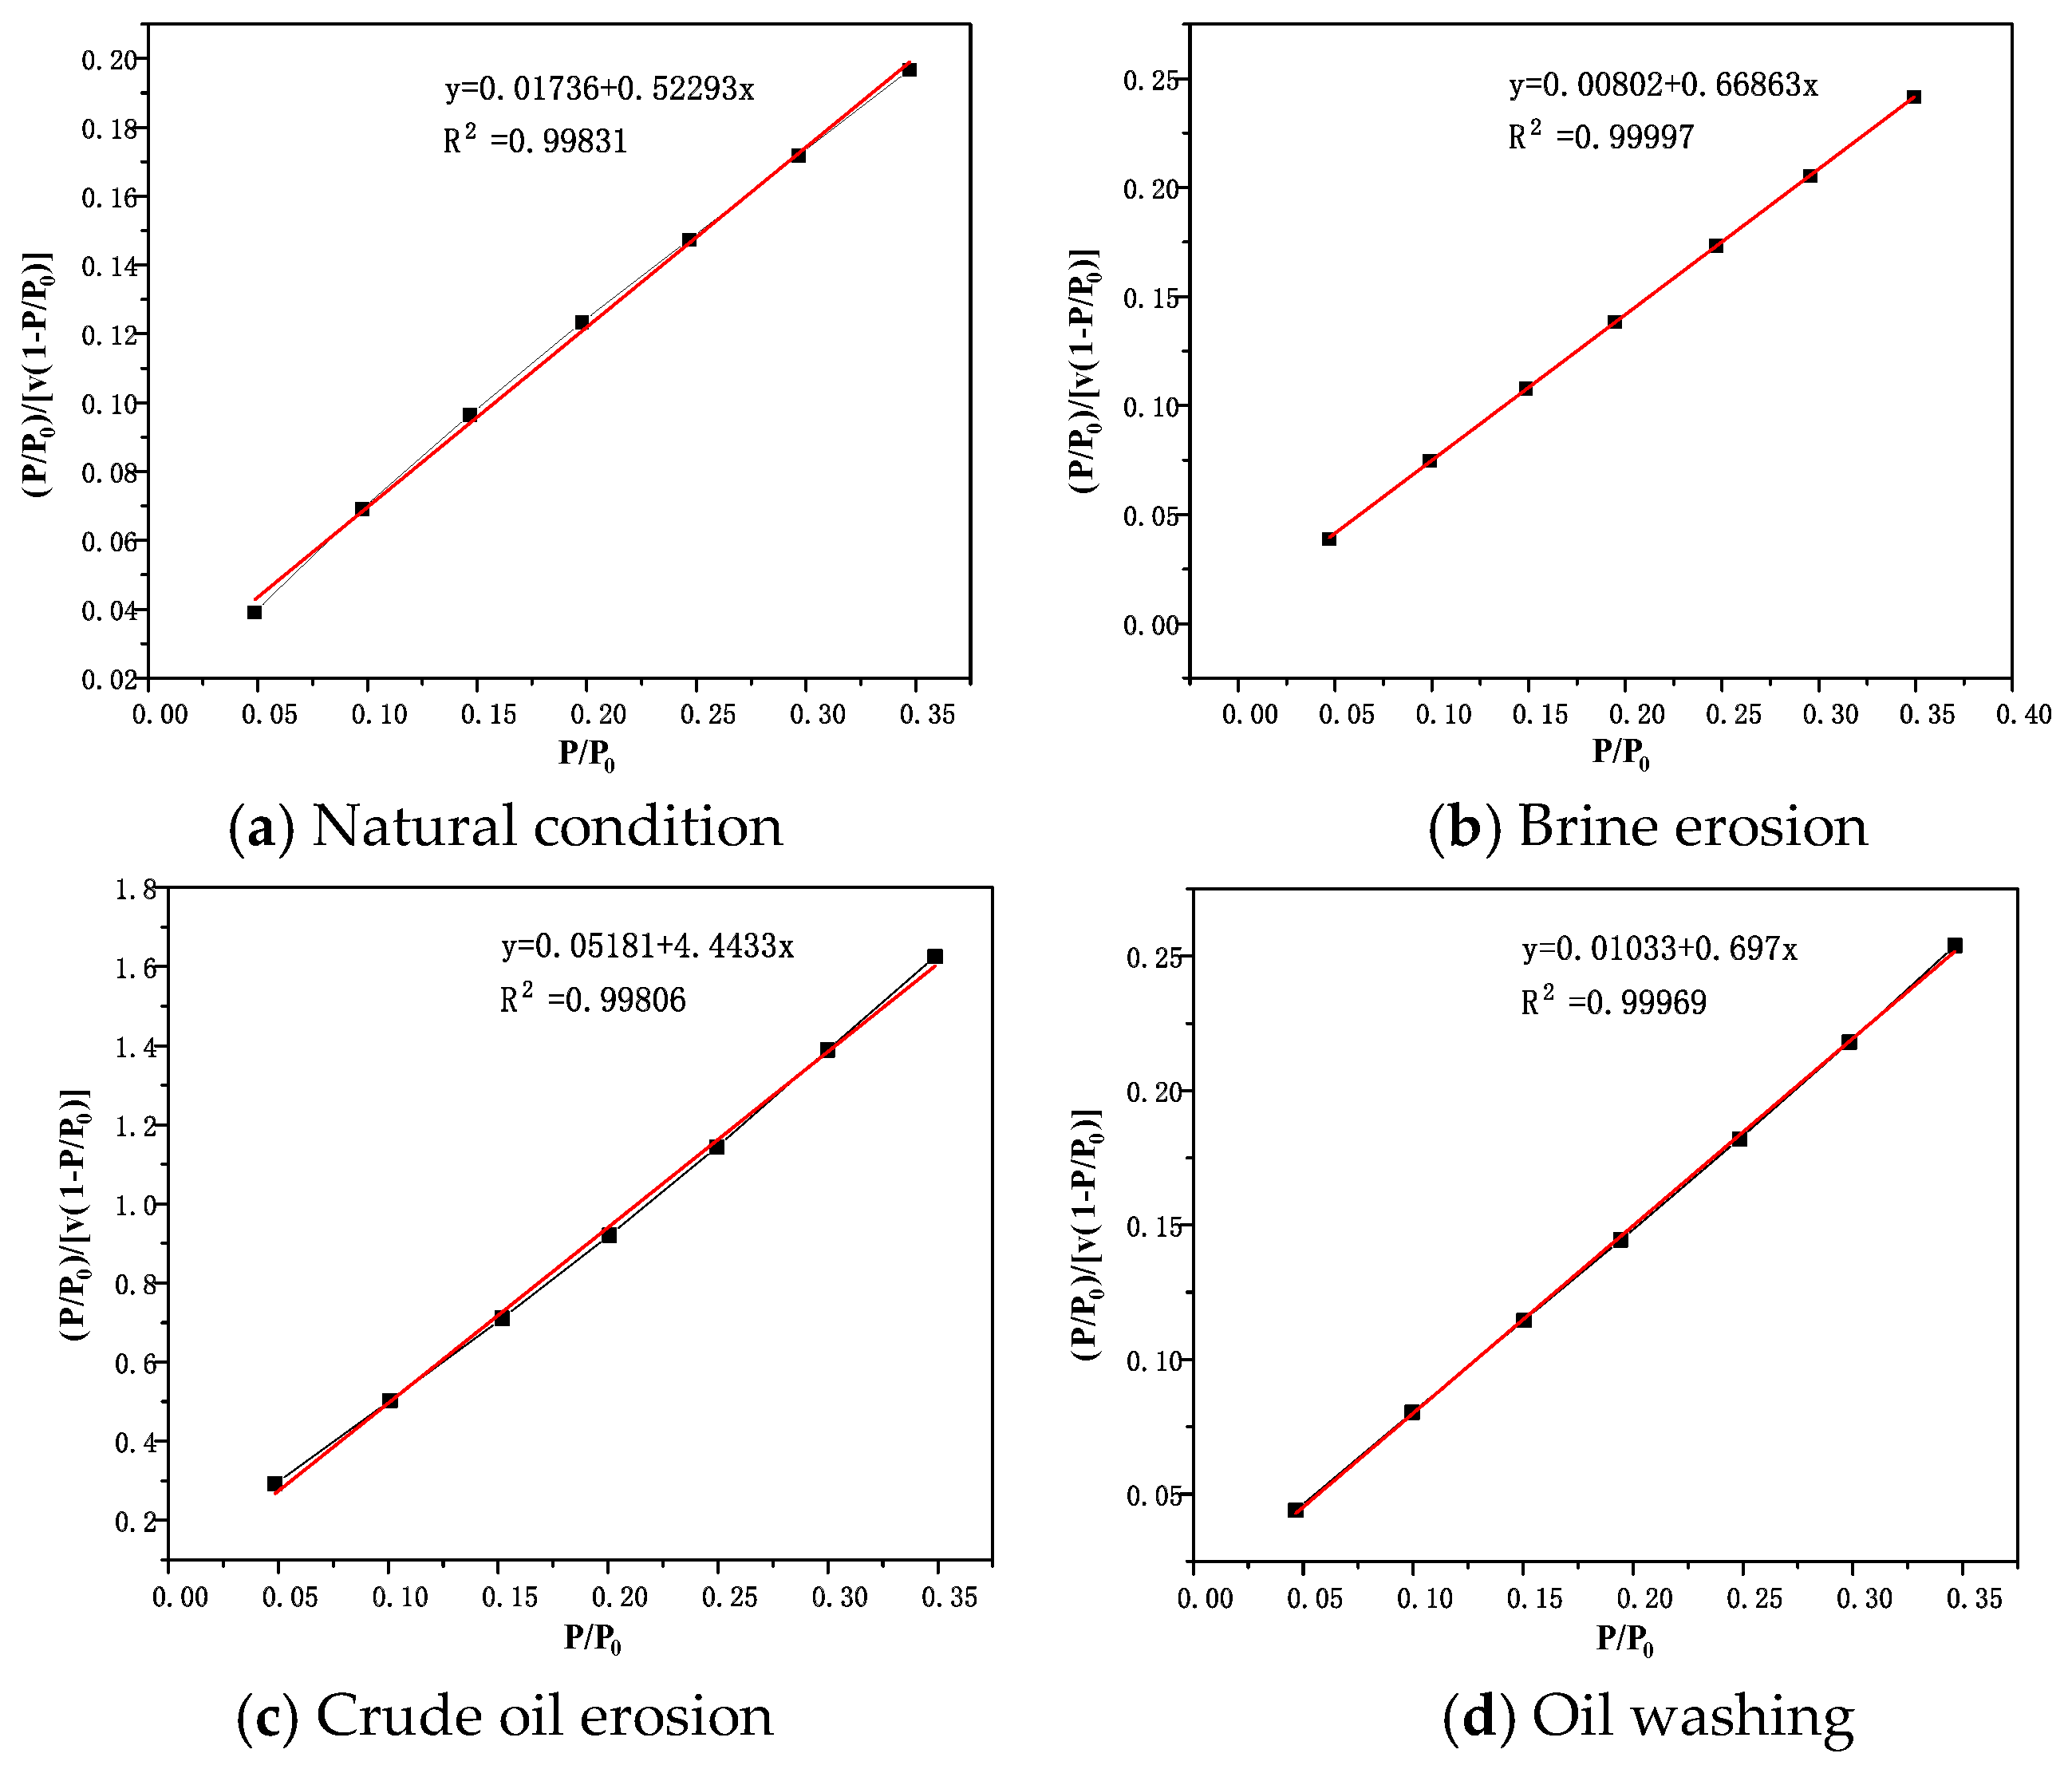
44]. There are many theories to calculate the specific surface by gas adsorption, of which the BET theory is most widely used in the calculation of specific surface. In order to obtain the specific surface area by BET plot, the saturated adsorption amount is determined from the slope and intercept of the straight line portion of the plot.
According to the BET equation, the relative pressure
is replaced by
P/P0
where
is the adsorption amount corresponding to the relative pressure
;
is the saturated adsorption capacity of monolayer;
is a physical quantity related to the difference between the adsorption heat and condensation heat of the first layer, and
is a constant when the adsorbate, adsorbent and adsorption equilibrium temperature are selected.
It can be seen that when
is used to plot
, a straight line can be obtained with slope
, intercept
, and the saturated adsorption amount of the monolayer can be obtained from slope and intercept.
According to the area
occupied by each adsorbed molecule on the adsorbent surface, the surface area of each gram of solid sample can be calculated. For N
2, the area occupied by each nitrogen molecule on the surface of the adsorbent is 16.2 Å
2, so the area
occupied by each milliliter of adsorbed N
2 molecule when laid into a monolayer should be
Therefore, the specific surface area of the sample can be expressed as
It should be noted that the BET equation only holds in the range of relative pressure P/P0 = 0.05~0.35.
BET diagrams of rock salt, interlayer and cap rock under different conditions are shown in
Figure 9,
Figure 10 and
Figure 11. It can be seen that in the range of relative pressure
P/P0 = 0.05~0.35,
and
have a good linear relationship. According to Equations (2)–(5), the calculated saturated adsorption amount
, constant
and specific surface area
of the single molecular layer of surrounding rocks with different properties under different conditions are shown in
Table 7.
According to the BET calculation data in
Table 7, the specific surface area of the rock salt sample is the smallest under natural conditions, at only 4.86 m
2/g. The specific surface area of the caprock sample is slightly larger, 8.07 m
2/g. The specific surface area of the interlayer sample is much larger than that of rock salt and caprock, reaching 36.91 m
2/g. Compared with rock salt and cap rock, the porosity in the interlayer is more developed. Although the specific surface areas of rock salt and cap rock are not very different, the reasons for this result are quite different. According to the types of adsorption isotherms of rock salt and cap-rock, it can be judged that the pores of rock salt and cap rock are composed of micropores, mesopores, and macropores. Due to the adsorption isotherms of rock salt samples tending to be saturated when the relative pressure is high, the pore diameters of macropores are all less than 500 nm (range extremum of the instrument). Moreover, the relatively small pore size has an extremely low specific surface area, which means that the porosity of the rock salt itself is extremely low. On the other hand, the pore size of the caprock sample is relatively larger, and even its macropores are relatively developed. A large number of macropores causes the specific surface area of the cap layer sample to be relatively low.
Under the condition of crude oil erosion, the specific surface area of rock salt, interlayer and caprock samples are greatly reduced compared with those seen under natural conditions. Rock salt sample 1-2 has a specific surface area S = 0.85, much less than 4.86 m2/g; the specific surface area of interlayer sample 2-3 is S = 7.61, much less than 36.91 m2/g; the specific surface area s of interlayer sample 3-3 is S = 0.97, much less than 8.07 m2/g. It is considered that the reason for these results is the three inferences, as follows:
- (1)
The residual organic matter in crude oil covers or fills the pores in the sample, causing a temporary decrease in specific surface area, which can be recovered by washing with oil, and crude oil will not damage the sample;
- (2)
Crude oil erosion causes a large number of pores in the sample to communicate, leading to an increase in the average pore diameter of the sample, and resulting in a permanent decrease in the specific surface area.
- (3)
Both the filling of pores by organic matter in crude oil and the pore connectivity caused by crude oil erosion cause the specific surface area of the sample to decrease, which can be partially recovered by washing oil.
BET data of samples 1-3, 2-4 and 3-4 after oil washing revealed the potential reason for the large reduction of specific surface area. The specific surface area of rock salt sample 1-3 increases to 3.22 m2/g after oil washing, returning to 66.3% of the natural specific surface area; the specific surface area of interlayer sample 2-4 increased to 29.94 m2/g, returning to 81.1% of the natural specific surface area. The specific surface area of the cap layer sample 3-4 increased to 6.16 m2/g and recovered to 76.4% of the natural specific surface area. This shows that the reduction in the specific surface is recoverable to a certain extent, but it cannot be 100% recovered. Therefore, this result verifies the possibility of deduction (3). However, considering that organic solvent cannot dissolve all the residual organic matter in pores, this result cannot exclude deduction (1). It is necessary to further verify the occurrence of damage during crude oil erosion through mechanical tests. Nonetheless, this further indicates that it is highly possible for the hard–volatile organic matter in crude oil to cover and fill rock pores.
However, the specific surface area of interlayer and caprock decreases under the condition of brine erosion. This is due to the water–rock interaction resulting in some pores of interlayer and cap rock samples being connected, and the dissolution of soluble substances (such as rock salt particles) in the interlayer, and cap-rock also causes the appearance of small pores to become large pores, resulting in the reduction in the specific surface area of the samples. This also shows that, compared with oil–rock interaction, water–rock interaction is more likely to cause irreversible damage to the rock skeleton.
5. Total Aperture Distribution Characteristics
The pore size distribution refers to the percentage of pore sizes of all levels in the material in terms of quantity or volume. IUPAC uses the effective average molecular diameter of nitrogen molecules (adsorbates) as a benchmark to propose a classification method for pores, i.e., a universal classification: Ultramicropore r < 0.5 nm; Micropore 0.5 nm < r < 2.0 nm; Mesopore 2.0 nm < r < 50.0 nm; Macroporous r > 50.0 nm.
At present, the gas adsorption method and the mercury intrusion method are used to measure the pore size distribution of rocks. Theoretically, the nitrogen adsorption method has higher measurement accuracy only for micropores and mesopores below 50 nm, while the measurement accuracy for larger pores will be greatly reduced. For the mercury intrusion method, although its measurable minimum pore size can reach 3.75 nm, the high-pressure mercury intrusion method has a higher measurement accuracy for large pores above 50 nm because of the skeleton structure of rock samples will be destroyed with the increase in mercury pressure [
45,
46,
47,
48,
49]. By combining the gas adsorption method and mercury intrusion measurement range we can obtain the continuous distribution of micropores, mesopores and macropores in the rock surrounding the SPR salt cavern. In this study, the gas adsorption method and mercury intrusion method are combined to obtain the total pore size distribution of the rock.
In the data processing process, the gas adsorption data partially overlapped with the mercury injection data, with the upper limit pore diameter of mesopores being 50 nm as the boundary. For the pore diameter distribution in the 0–50 nm micro-mesopore range, we use the gas adsorption data, and for the pore diameter distribution in the larger than 50 nm range, the mercury injection method. The data are connected at the 50 nm boundary to obtain the total pore diameter distribution map of each test sample.
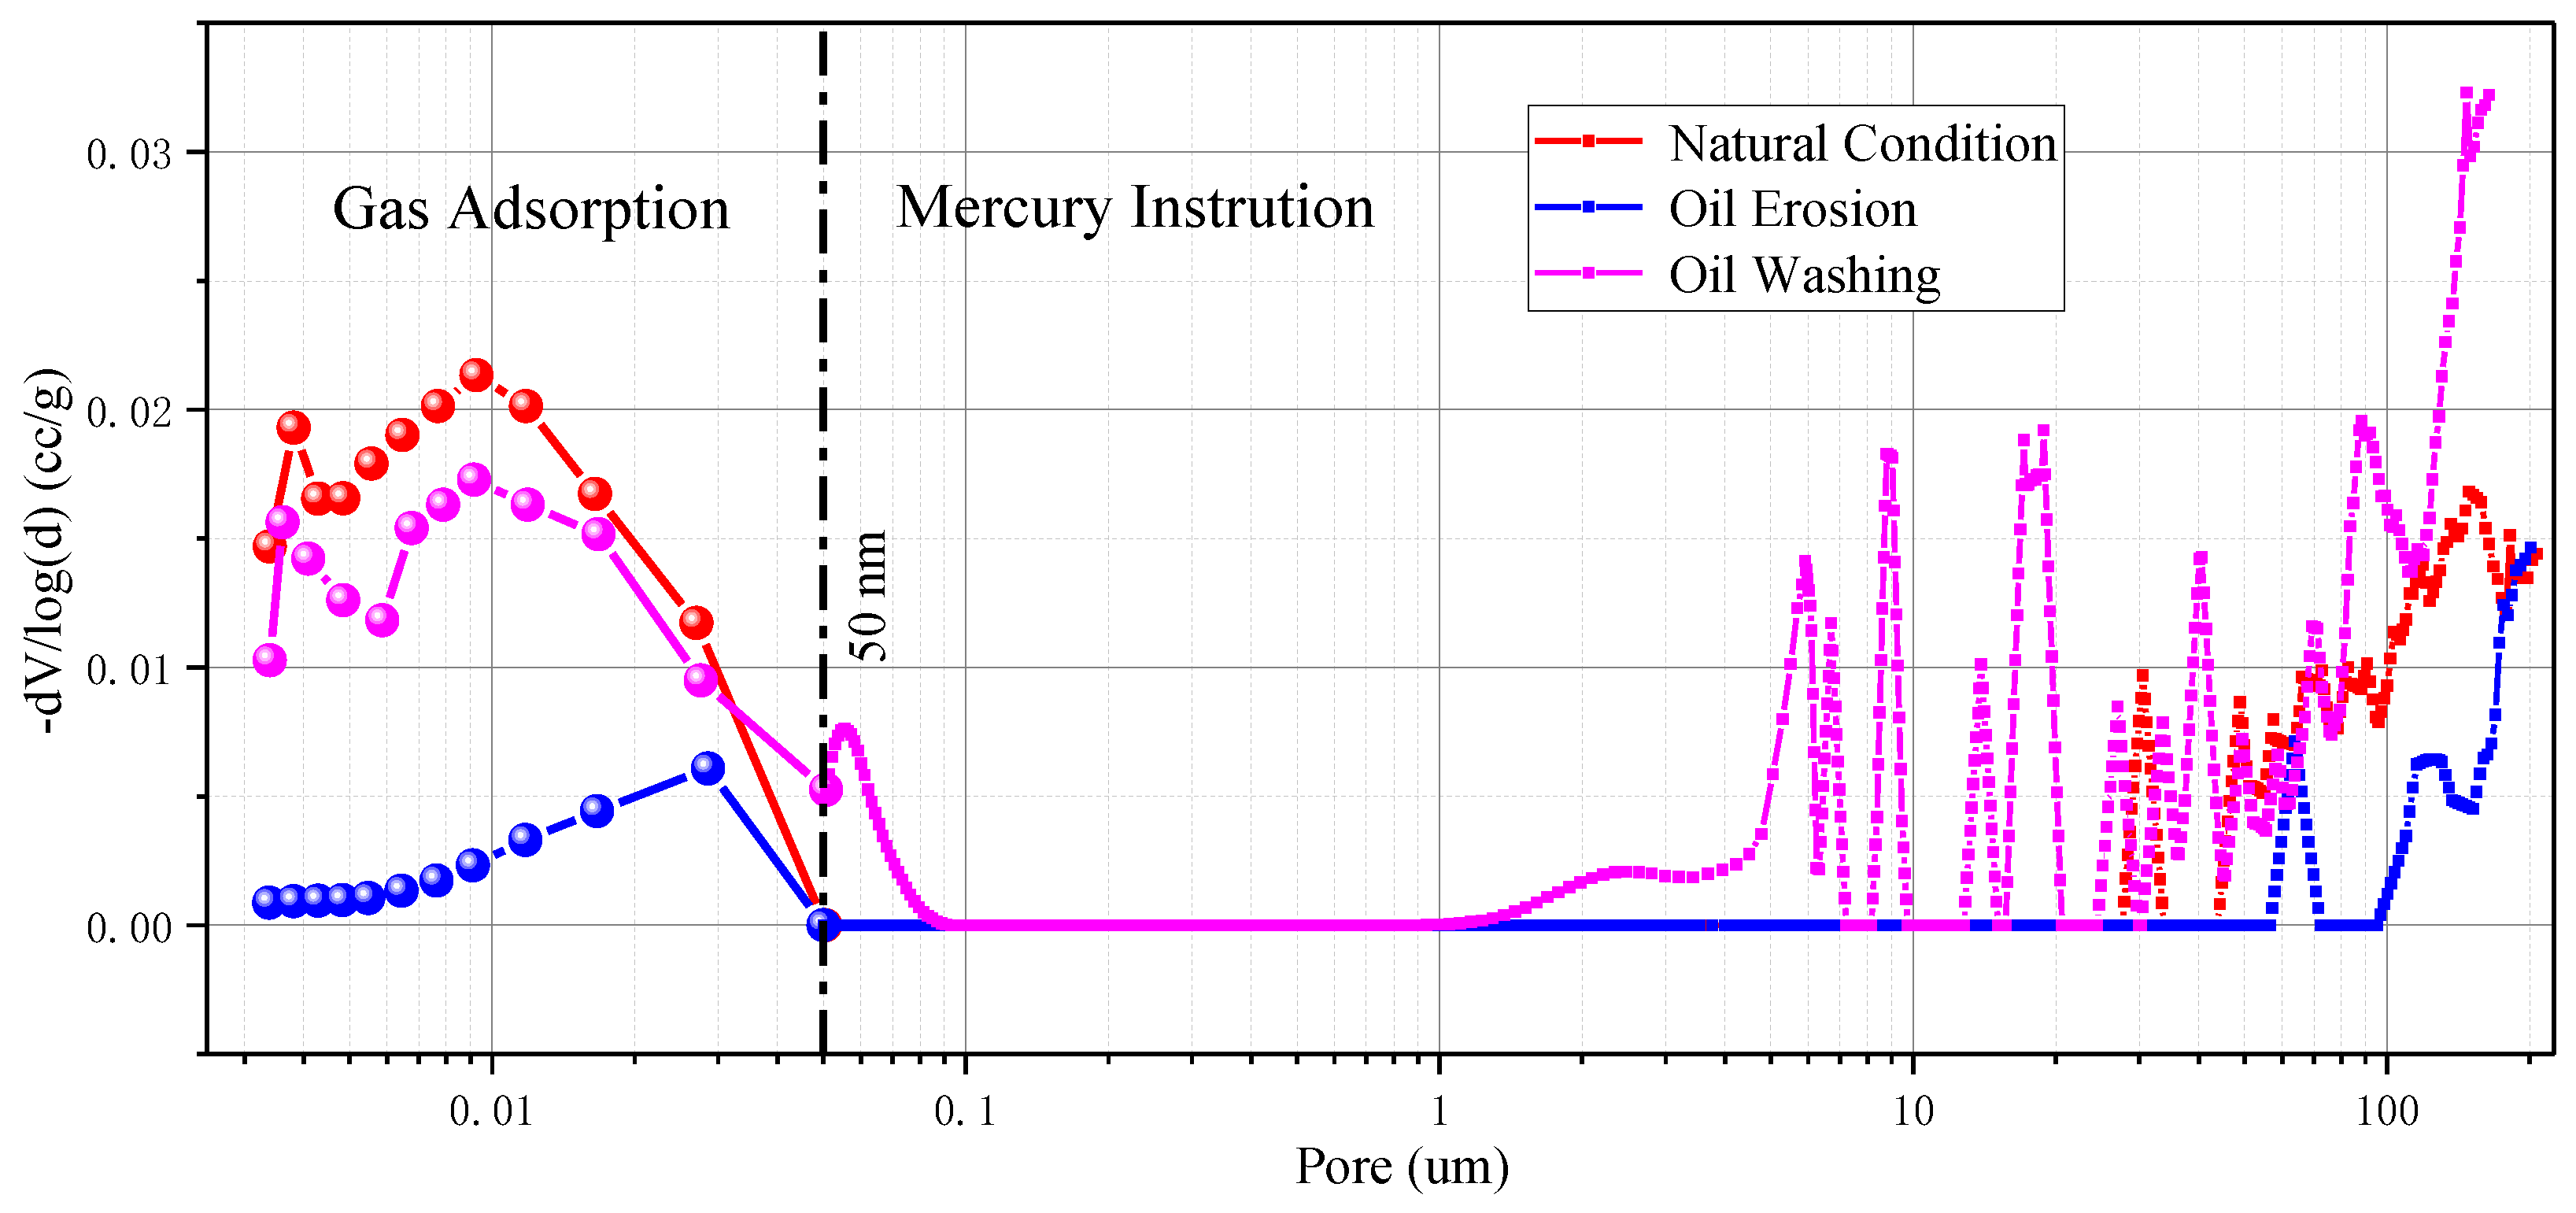
5.1. Total Pore Diameter Distribution of Rock Salt Samples
The total pore size distribution characteristics of rock salt samples under different conditions are shown in
Figure 12. Under natural conditions, the pore diameter of rock salt is mostly in the range of 3.4~50 nm and greater than 29.6 μm. The pore diameter distribution of rock salt in the larger pore range is not uniform. However, according to the scanning results of the electron microscope of the rock salt sample, its pore size is much smaller than 29.6 μm, so it can be considered that the pore size larger than 29.6 μm in the mercury injection results of the rock salt sample is more likely to be caused by the micro-cracks in the crystal grains of the rock salt.
Under the influence of crude oil, the pore volume corresponding to each pore diameter of rock salt is obviously reduced. The pore volume of some large pores is even directly reduced to 0 under the influence of crude oil, which is still caused by the blockage of pores by nonvolatile organic matter in crude oil. However, the pore size distribution of rock salt after washing with oil is obviously different from that under natural conditions. Although the pore size distribution curve after oil washing is close to that of natural conditions in the mesoporous range, the distribution of macropores is quite different. Not only is the pore size range obviously increased, but the pore size distribution has a large fluctuation. This is caused by the 1.01% water content in crude oil. Even though the water content in crude oil is extremely low, rock salt is extremely sensitive to fresh water and dissolves in it. Therefore, a small amount of water intrusion will damage the pore structure of rock salt samples, causing the secondary development of pores near micro-fissures in the rock salt to increase the pore size distribution range of large pores. However, this has little effect on the distribution of micro-mesopores in rock salt.
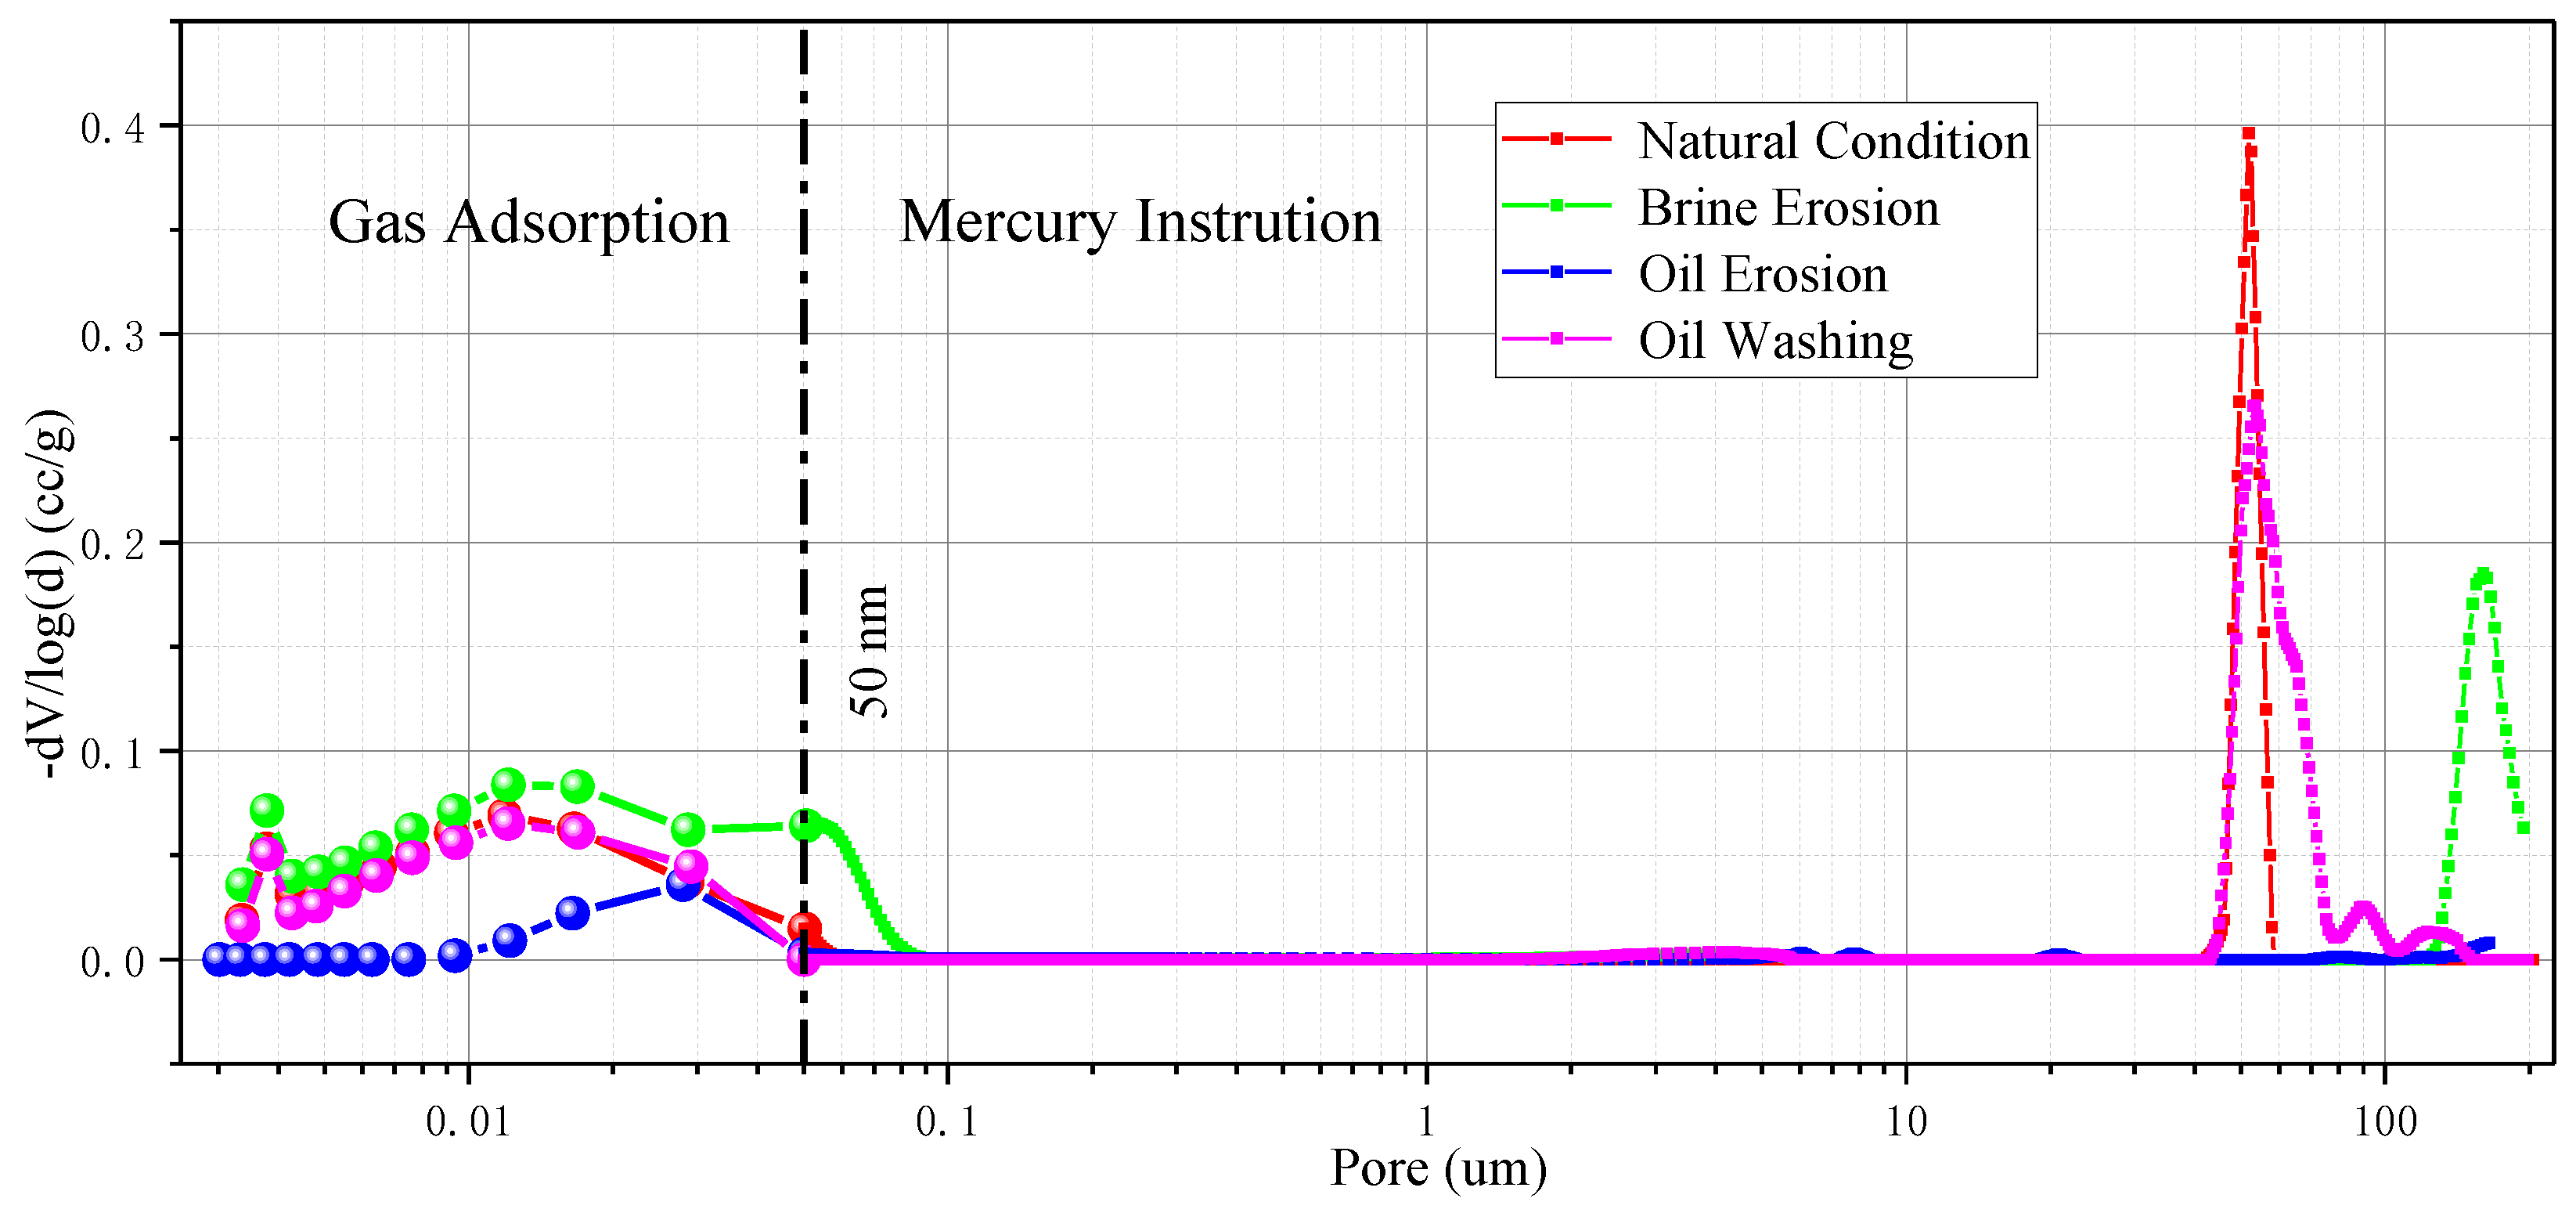
5.2. Total Pore Diameter Distribution of Interlayer Samples
The total pore size distribution characteristics of interlayers samples under different conditions are shown in
Figure 13. The pore size distribution of interlayers samples has two significant peaks under natural conditions, which are respectively distributed between 3.4~62.5 nm and 43.7~60.9 μm. It is considered that the pore size range of 3.4~62.5 nm is closer to the natural pore structure distribution of the interlayer sample, while the pore size of 43.7~60.9 μm can be considered as the micro-crack spacing range in the interlayer sample.
Under the condition of crude oil erosion, like the pore size distribution characteristics of rock salt samples, a large number of pores are blocked, resulting in obvious changes in the pore structure of interlayer samples. The pore volume corresponding to the pore diameter is also significantly reduced due to the blockage of pores. The pore size distribution curve near the mesopores after oil washing is basically the same as that under natural conditions, and the pore sizes corresponding to the two peaks of the curve are completely the same. However, the pore size distribution range of macropores after oil washing is slightly larger than that under natural conditions, which may be caused by slight water–rock interaction or slight structural damage caused by oil–rock interaction due to extremely low water content in crude oil, but we cannot exclude the possibility that the slight difference is caused by heterogeneity of the sample itself.
However, brine erosion obviously changed the pore size distribution of interlayer samples. The distribution curve of both nano-sized pores and micro-sized fissures shows an obvious shift to the right. This means that a large amount of water–rock interaction increases the pore sizes of interlayer samples and changes their pore structure characteristics.
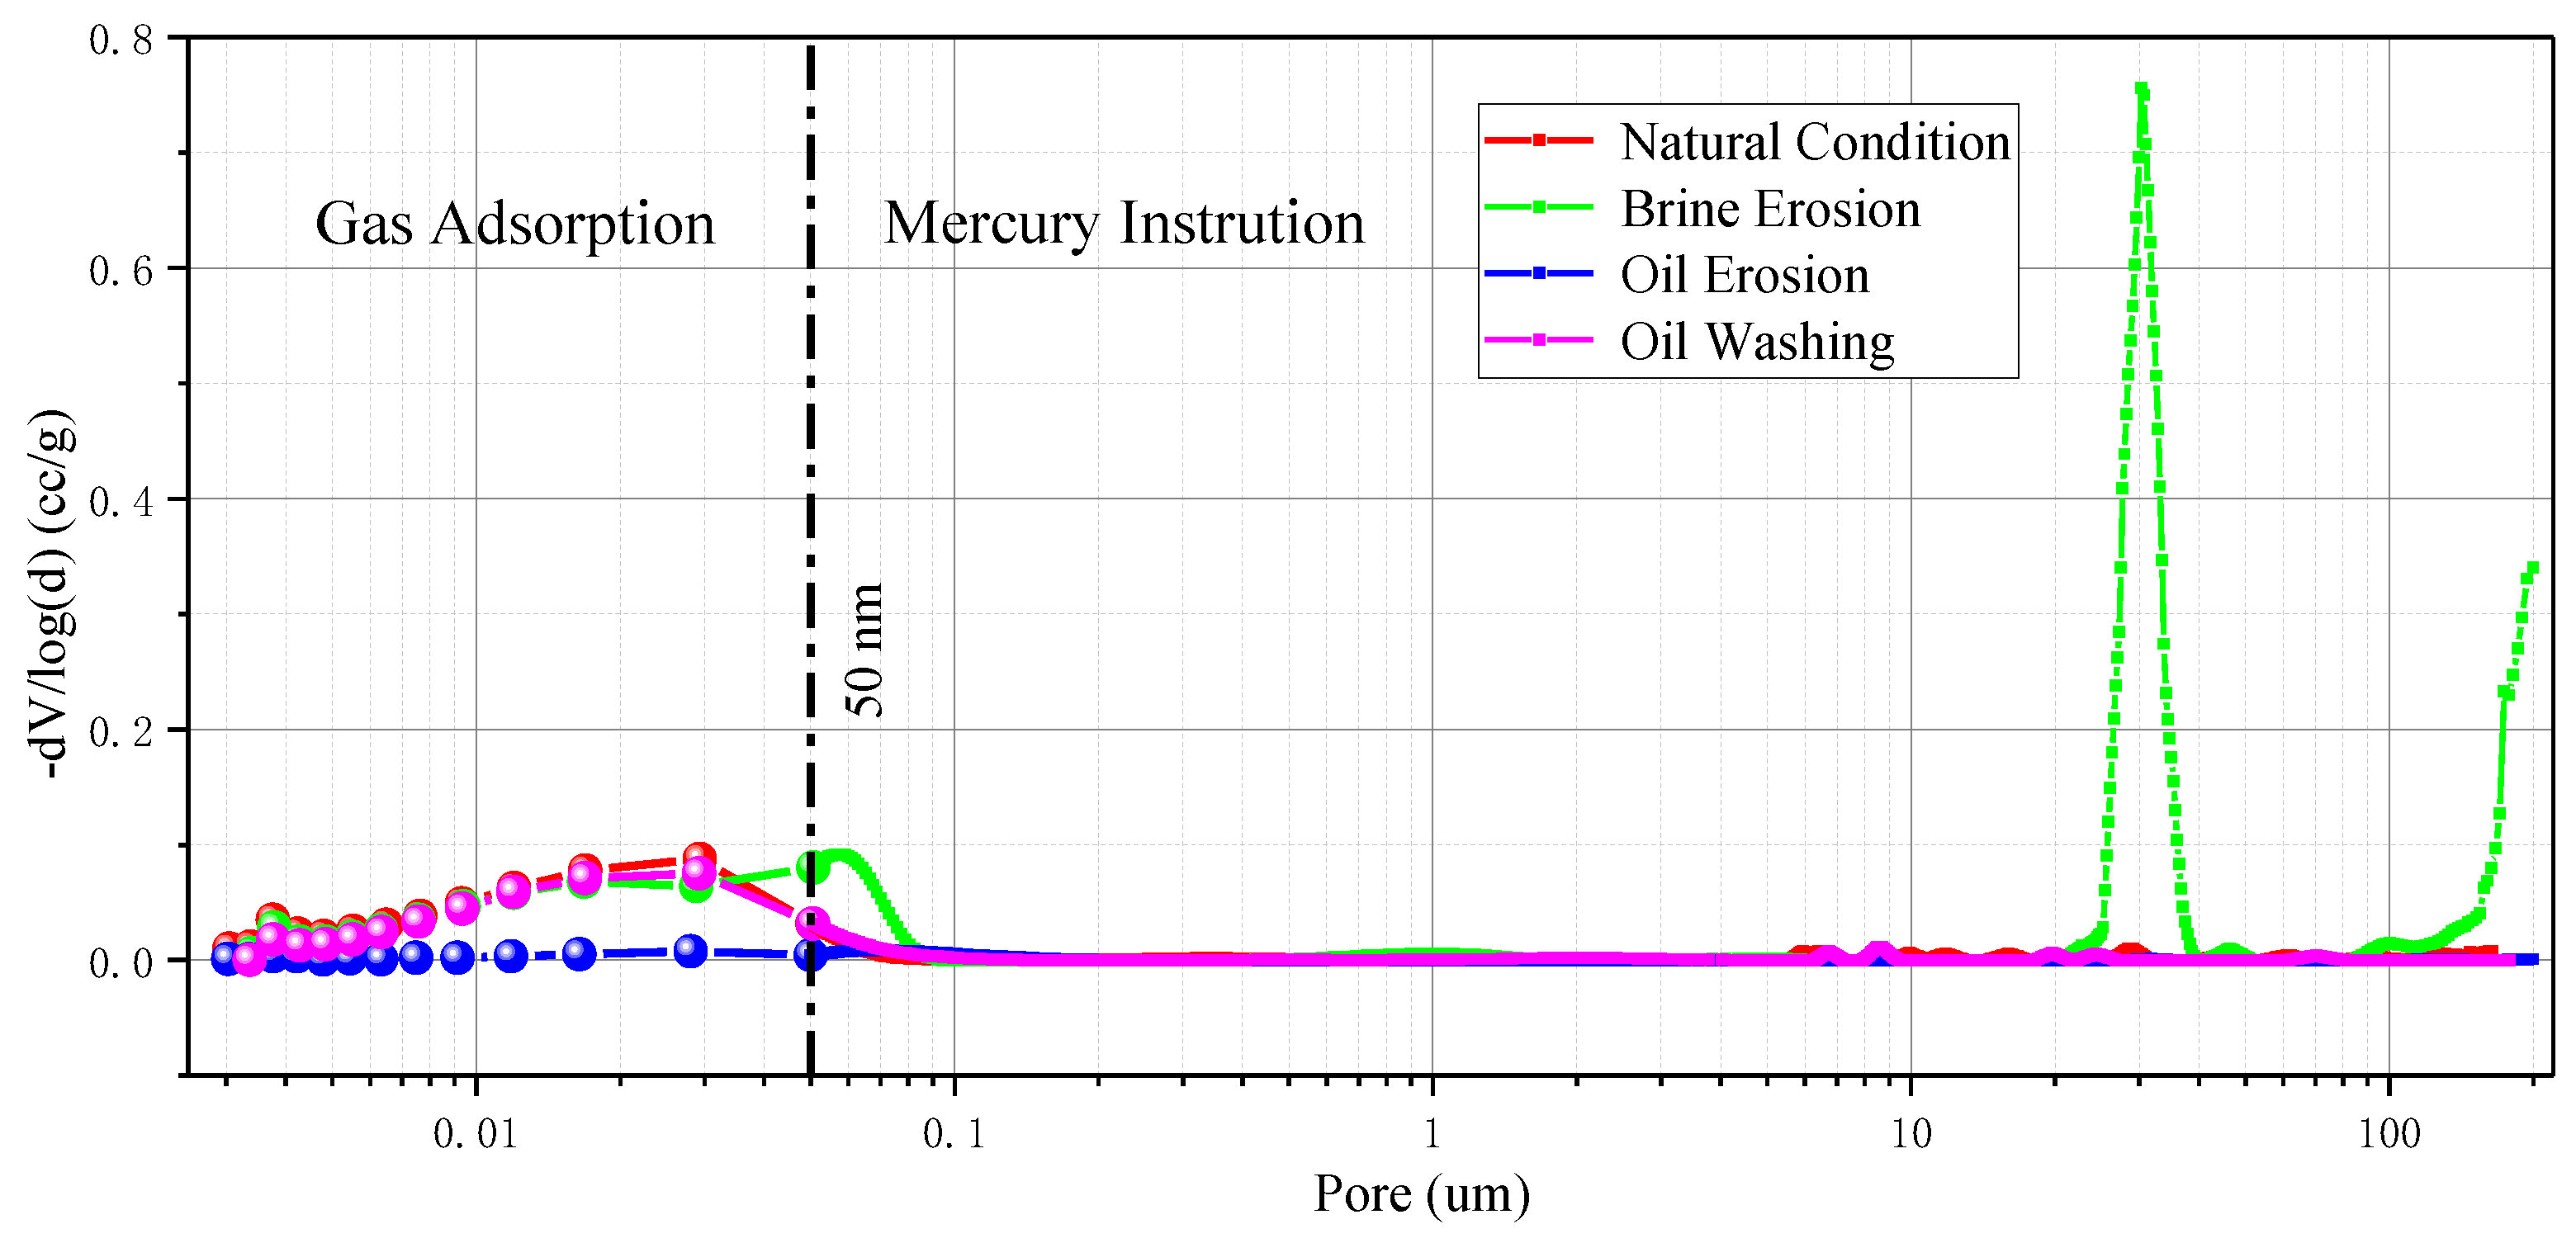
5.3. Total Pore Diameter Distribution of Caprock Samples
The total pore size distribution characteristics of caprock samples under different conditions are shown in
Figure 14. Different from salt rock and interlayer, the total pore size distribution curve of cap rock samples under natural conditions has only one peak, and its pore size is widely distributed in the range of 3.0~75.9 nm. This shows that the pore size distribution of the caprock is relatively uniform and there are few microcracks in the caprock. This is beneficial to the sealing performance of salt cavern storage.
Similar to the pore size distribution characteristics of interlayer samples under crude oil erosion conditions, the blockage of organic matter in crude oil results in the change in the pore size distribution and the decrease in the pore volume of caprock samples under crude oil erosion conditions. However, the pore size distribution curve of the cap layer sample after oil washing basically coincides with the distribution curve under natural conditions but slightly fluctuates between 8 and 100 μm. This shows that crude oil erosion does not significantly change the structural characteristics of nano-scale pores in caprock samples but has a slight promoting effect on micro-scale micro-fractures. The pore size distribution of caprock samples under brine erosion has obviously changed compared with natural conditions. The generation of a large number of water–rock reactions increases the pore size of caprock and changes its pore structure.
Comparing
Figure 12,
Figure 13 and
Figure 14, although the nano-scale pore size distribution range between rock salt and interlayer and caprock samples is not very different, the pore volume corresponding to the same pore size differs significantly, which means that the porosity of rock salt is far lower than that of interlayer and caprock. Significantly, compared with natural conditions, the curves of interlayer and caprock samples after oil-washing show a basically consistent distribution of nano-sized pores and a slightly different distribution of micron-sized pores, and both show that crude oil erosion slightly promotes the development of macro-pores. It can be concluded that this phenomenon is not only caused by the heterogeneity of the sample itself, but also due to oil–rock interaction or slight water–rock interaction.


