Article

Sargassum Inundations in Turks and Caicos: Methane Potential and Proximate, Ultimate, Lipid, Amino Acid, Metal and Metalloid Analyses

by
John James Milledge
*,
Supattra Maneein
,
Elena Arribas López
and
Debbie Bartlett
Faculty of Engineering and Science, University of Greenwich, Central Avenue, Chatham Maritime, Kent ME4 4TB, UK
*
Author to whom correspondence should be addressed.
Energies 2020, 13(6), 1523; https://doi.org/10.3390/en13061523
Submission received: 27 February 2020 / Revised: 11 March 2020 / Accepted: 14 March 2020 / Published: 23 March 2020
(This article belongs to the Special Issue Algal Biotechnology and Biofuels)

Abstract

:
The Caribbean has been experiencing beach inundations of pelagic Sargassum, causing environmental, health and financial issues. This study showed variations in the composition and methane potential (MP) between the species of Sargassum. The MPs for S. natans VIII, S. natans I and S. fluitans (145, 66 and 113 mL CH4 g−1 Volatile Solids) were considerably below theoretical potentials, possibly due to the high levels of indigestible fibre and inhibitors. The mixed mats Sargassum composition was substantially different from the individual species, being higher in ash, calcium, iron, arsenic and phenolics. The mixed mats produced no methane, perhaps due to the high levels of phenolics. There was a strong correlation between MP and phenolic content. Heavy metals and metalloids were at levels that should not cause concern, except for arsenic (21–124 mg kg−1 dry weight). Further work on the speciation of arsenic in Sargassum is required to fully determine the risk to health and agriculture. Both protein and lipid levels were low. The ‘indispensable amino acid’ profile compares favourably with that recommended by the World Health Organisation. Lipids had a high proportion of Polyunsaturated Fatty Acids. The use of Sargassum for biogas production could be challenging, and further work is required.

1. Introduction

The beaches of the Caribbean have been experiencing increasing inundations of large masses of seaweed, primarily pelagic Sargassum (S. natans and S. fluitans) over the past decade [1,2,3,4,5,6]. These inundations have environmental [3,4,7], health [8,9] and financial implications [2,6]. The Caribbean region is highly dependent on tourism which provides over 15% of GDP and 14% of jobs, with a tourist spend of US$ 31.4 billion in 2016 [10]. The Caribbean Council has reported that Sargassum is not only a concern for tourists, with tourists avoiding resorts affected [11], but also potential investors in tourism [12]. Tourism in Solidaridad, Quintana Roo, Mexico, dropped by as much as 35% during recent Sargassum inundations [13]. Sargassum inundations have been described as “an international crisis” and “the greatest single threat” to the Caribbean [6,14,15].
The removal of Sargassum from beaches or the prevention of it reaching the beaches can be very costly. The owners of large hotels in Quintana Roo spend around US$ 54,000 per month to keep the beaches clean for tourists [16], and US$ 3.5 million is the annual cost of removing Sargassum from the 32 miles of public beaches on Galveston Island [17]. The cost of cleaning beaches on the Mexican Gulf of Mexico is ~US$ 5 million, and the estimated cost to remove the Sargassum inundations across the Caribbean is US$ 120 million [14,15]. The Caribbean Sea Commission [18] suggest the need for research on commercial uses of Sargassum to counter the threat of the Sargassum seaweed. Commercial sustainable exploitation of this biomass for food, fuel and pharmaceutical products could fund clean-up and offset the economic impact of Sargassum inundations [2,4,6,19]. The potential uses of Sargassum have been reviewed by Milledge and Harvey [2]; however, current commercial exploitation is limited [2,6].
Seaweed is a potential source of biofuel, but one of the major challenges is the high moisture content, the high energy input of drying make processes that require dry biomass (direct combustion, pyrolysis and gasification) energetically challenging [4,20,21,22,23,24]. Anaerobic digestion (AD) uses wet biomass to produce biogas, a mixture of gas consisting primarily of combustible methane and incombustible carbon dioxide. It is a relatively simple process in engineering terms and the process of choice for biomass with high water content, such as seaweed [25,26]. Most seaweeds are considered as suitable potential substrates for AD [22,27]. Nonetheless, the methane yields from the AD of seaweed vary widely due to variation in species, location and seasonal chemical composition of the biomass [27,28,29].
Although there have been some studies on the AD of Sargassum muticum and other benthic species of Sargassum [30,31,32,33], there has been little work on the methane potential of pelagic Sargassum [2,6,34]. A small-scale pilot study by the Caribbean Council and the Centre for Process Innovation (CPI) was funded by the Foreign and Commonwealth Office (~£33,000) to investigate the Sargassum problem in the Eastern Caribbean States of St Lucia and Grenada [34]. The experimental work was limited to one sample of Sargassum collected from a beach in St Lucia that was around two months old and dried through exposure and was far from ideal. The sample was also repeatedly washed in fresh water, a process which may not be commercially viable and has significant effects on biogas production [33]. The report concluded that more practical work has to be done [34]. A more recent case study using the results of CPI [34] on biogas production from Sargassum on Barbados concluded that further work on AD of Sargassum is necessary to potentially provide an “eco-friendly and economically viable solution to its recurring influx” [6].
A potential problem with the use of Sargassum and other seaweeds is that they bioaccumulate metals and metalloids [35,36,37]. Although there has been some use of Sargassum for fertiliser, the use of Golden-tides for fertiliser, feed and food may be limited by heavy metal accumulation in seaweeds and pollution [4,20,38,39,40,41]. High levels of heavy metals also have implications for AD. Digestate residue from AD rich in metals are problematic for disposal and use as fertiliser [42]. However, there has been little research on levels of metal and metalloids in pelagic Sargassum [43].
Turks and Caicos, as with many other Caribbean islands, is highly dependent on tourism [44]. In 2018, there were over 1.4 million visitors to the islands, and hotel, restaurants and accommodation accounted for ~73% of the GDP [45]. It is one of the most “gravely impacted” nations in the Caribbean from Sargassum inundations [39]. Although Sargassum is removed from the beaches to improve the tourist experience, it does not seem to be exploited at scale and often ends up in landfill [46]. This study examines the ultimate and proximate composition of Sargassum stranded on the beaches together with its heavy metal content and methane potential. It is believed to be the first study to examine Sargassum from Turks and Caicos in this way.

2. Materials and Methods

2.1. Sample Collection and Preparation

2.1.1. Sample Collection

Samples were collected from Shark Bay, South Caicos, Turks and Caicos (21.491N, 71.503W) on 23 June 2019 under Turks and Caicos Scientific Research Permit 19-06-02-21. The seaweed (Sargassum and any associated material) was collected nearshore before stranding on the beach. The samples were then allowed to drain on a 2 mm mesh sieve for 5 min. A sample of mixed material (A) was taken. Samples of the three dominant species of Sargassum (S. natans VIII (B), S. natans I (C) and S. fluitans (D)) were separated using an identification chart (Figure 1) and gross contamination was removed from the strands by rinsing in seawater using a ‘squeezy-bottle’. Samples were transported in local seawater, which was changed regularly, to the airport for shipping. The samples were examined for a phytosanitary certificate (PLS-PC-19002, Export permits TCI 2018 69 and TCI 2018 70) for shipping, drained, and placed in sealed bags and transported chilled by air. Samples arrived at the University of Greenwich laboratories on 26 June 2019 and were processed immediately.

2.1.2. Freeze-Drying

The samples were frozen to −20 °C and then freeze-dried for 72 h in a ScanVac, Coolsafe, Laboscene freeze-drier running at −55 °C. The final moisture content was determined using the method below. After freeze-drying, samples were stored in sealed containers at 4 °C for further experimentation.

2.2. Compositional Analyses

2.2.1. Moisture

The British Standards simplified oven drying method (105 °C for 24 h) was used for the analysis of moisture content [47]. All measurements were repeated in triplicate, and mean value and standard deviation (SD) are reported. After oven-drying, samples were stored in sealed containers at 4 °C for further experimentation.

2.2.2. Ash

The British Standards method for the determination of ash content (550 °C for 2 h) was used to analyse the ash content of oven-dried samples [48]. All measurements were carried out in triplicate, and a mean value is reported. Ash was also examined by X-ray diffraction (XRD) analysis after grinding in a pestle and mortar to a fine powder at <10 μm.

2.2.3. Salt

The salt (sodium chloride) content was determined using ‘Mohr’ silver nitrate and potassium chromate titration of the chloride ion in the ash samples [49,50]. A mean value is reported from two determinations per sample.

2.2.4. Carbon, Hydrogen, Nitrogen Sulphur (CHNS)

The carbon, hydrogen, nitrogen and sulphur content of the oven-dried seaweed biomass was determined by a Flash Dynamic Combustion (Flash EA1112 CHNS Elemental Analyser). The oxygen content was calculated by difference. A mean is reported from a minimum of two determinations per sample.

2.2.5. ‘Heavy Metals’

The determinations of the aluminium, calcium, copper, iron, magnesium, manganese, potassium, sodium and zinc content in the freeze-dried samples were performed by the UKAS laboratory, Premier Analytical Services (Lincoln Road, High Wycombe, Bucks, HP12 3QS, UK. www.paslabs.co.uk) using the UKAS accredited method C-TM-206. Samples were solubilised in hot concentrated nitric acid, which also removes organic matter by oxidation. Elemental concentration in the resulting solution was measured using Inductively Coupled Plasma-Optical Emission Spectrometry (ICP-OES), with Yttrium as the internal standard and caesium chloride as the ionisation buffer.
The determinations of the arsenic, cadmium, lead and mercury content in the freeze-dried samples were performed by the UKAS laboratory, Premier Analytical Services using the UKAS accredited method C-TM-219. Samples were digested in dilute nitric acid in a closed vessel by a microwave oven program with ramped temperature and pressure. ICP-OES measured elemental concentrations in the resulting solutions.
The results were adjusted for the moisture content in the freeze-dried material, and the results are reported on a dry weight (dw) basis for each sample.

2.2.6. Phenolic Content

Polyphenolic extractions and quantifications were performed on samples in triplicates using 60% aqueous acetone as the extracting solvent (solid-solvent ratio of 1:200), incubated in a shaking incubator (New Brunswick Scientific, Innova®, Edison, NJ, USA) (250 rpm, 1 h, 40 °C), then centrifuged (21,000 G, 4 °C, 20 min). The supernatant was collected, and the process was repeated on the pellet four times.
Polyphenolic quantification was conducted according to a modified protocol of the Folin–Ciocalteu (FC) method at room temperature [51]. Briefly, Folin–Ciocalteu reagent (125 µL, 0.2 N) was added to the sample (250 µL, diluted with 375 µL deionised water). 20% Na2CO3 (250 µL) was added after 2 min incubation. The absorbance was measured at 750 nm in a UV-visible spectrophotometer (Jenway 6305, Fisher Scientific, Loughborough, UK) after 30 min of incubation in the dark. Phloroglucinol was the standard used to generate a calibration curve, and results are expressed as mg phloroglucinol equivalent (PG eq).

2.2.7. Amino Acids

The amino acid profiles were determined by an accredited UKAS laboratory, Sciantec Analytical Services UK Ltd. (Stockbridge Technology Centre, Cawood, North Yorkshire, YO8 3SD, UK. www.cawoodscientific.uk.com/sciantec/). The freeze-dried samples were oxidised with hydrogen peroxide/formic acid/phenol solution. Excess oxidation reagent is decomposed with sodium metabisulphite. The oxidised samples were hydrolysed with hydrochloric Acid (6 M). The hydrolysate was adjusted to pH 2.2, and the amino acids were separated and quantified by ion-exchange chromatography using photometric detection. The results were adjusted for the moisture content in the freeze-dried material, and the results are reported on a dry weight (dw) basis for each sample.

2.2.8. Fatty Acids

The fatty acid profiles were determined by an accredited UKAS laboratory, Sciantec Analytical Services UK Ltd. (Stockbridge Technology Centre, Cawood, North Yorkshire, YO8 3SD, UK. www.cawoodscientific.uk.com/sciantec/). Petroleum ether extracts of the freeze-dried samples were methylated and analysed by Gas Chromatography–Mass Spectrometry (GC-MS) and compared to known concentrations of fatty acid methyl ester standards.

2.2.9. Total Lipid

Lipid contents were measured using the method of Matyash et al. [52]. Briefly, deionised water, methanol (MeOH) and methyl tert-butyl ether (MTBE) were added to 0.1 g of freeze-dried sample in a ratio of 1:3:10. This was sonicated (1 min) and incubated (1 h, room temperature). Then, 1.5 mL of deionised water was added (MeOH:MTBE: H2O ratio of 3:10:2.5 (v/v/v)) to induce the phase separation, and centrifuged (10 min, 1000 G). The upper organic phase was collected, and the lower phase was re-extracted, repeating the process above. The upper phase of the second extraction was collected and mixed with the first extraction. Yields were determined gravimetrically. Determinations were performed in triplicate, and the results were adjusted for the moisture content. The mean and standard deviation on a dry weight (dw) basis are reported for each sample.

2.2.10. Fibre

The total dietary fibre content for the freeze-dried samples was measured by the enzyme gravimetric method [53] using the Sigma Total Dietary Fibre Kit (TDF-100a and TDF-C10). Determinations were performed in triplicate, and the results were adjusted for the moisture content. The mean and standard deviation on a dry weight (dw) basis are reported for each sample.

2.2.11. Higher Heating Value

Higher Heating Values (HHV) or Calorific values (CV) were determined using a Parr Model 6100 Bomb Calorimeter [54]. The oven-dried samples were oxidised by combustion in an adiabatic bomb containing oxygen under pressure (3010 kPa) and the HHV was determined by measuring the temperature rise of a known mass of water (2 kg). A minimum of two determinations were carried out for each sample, and a mean is reported. The HHV was also calculated using a modified ‘DuLong equation’ from the elemental analysis [55] and also from the protein, lipid and carbohydrate (including fibre) content using the method of Heaven et al. [56].

2.3. Methane Potential

2.3.1. Theoretical Methane Potential

The theoretical methane potential was calculated from the elemental analysis using the ‘Buswell equation’ [57,58] and also from the protein, lipid and carbohydrate (including and excluding fibre) content using the method of Heaven et al. [56]. The ratio of the MP to the theoretical methane yields, expressed as a percentage, has been termed the biodegradability index (BI) [59,60].

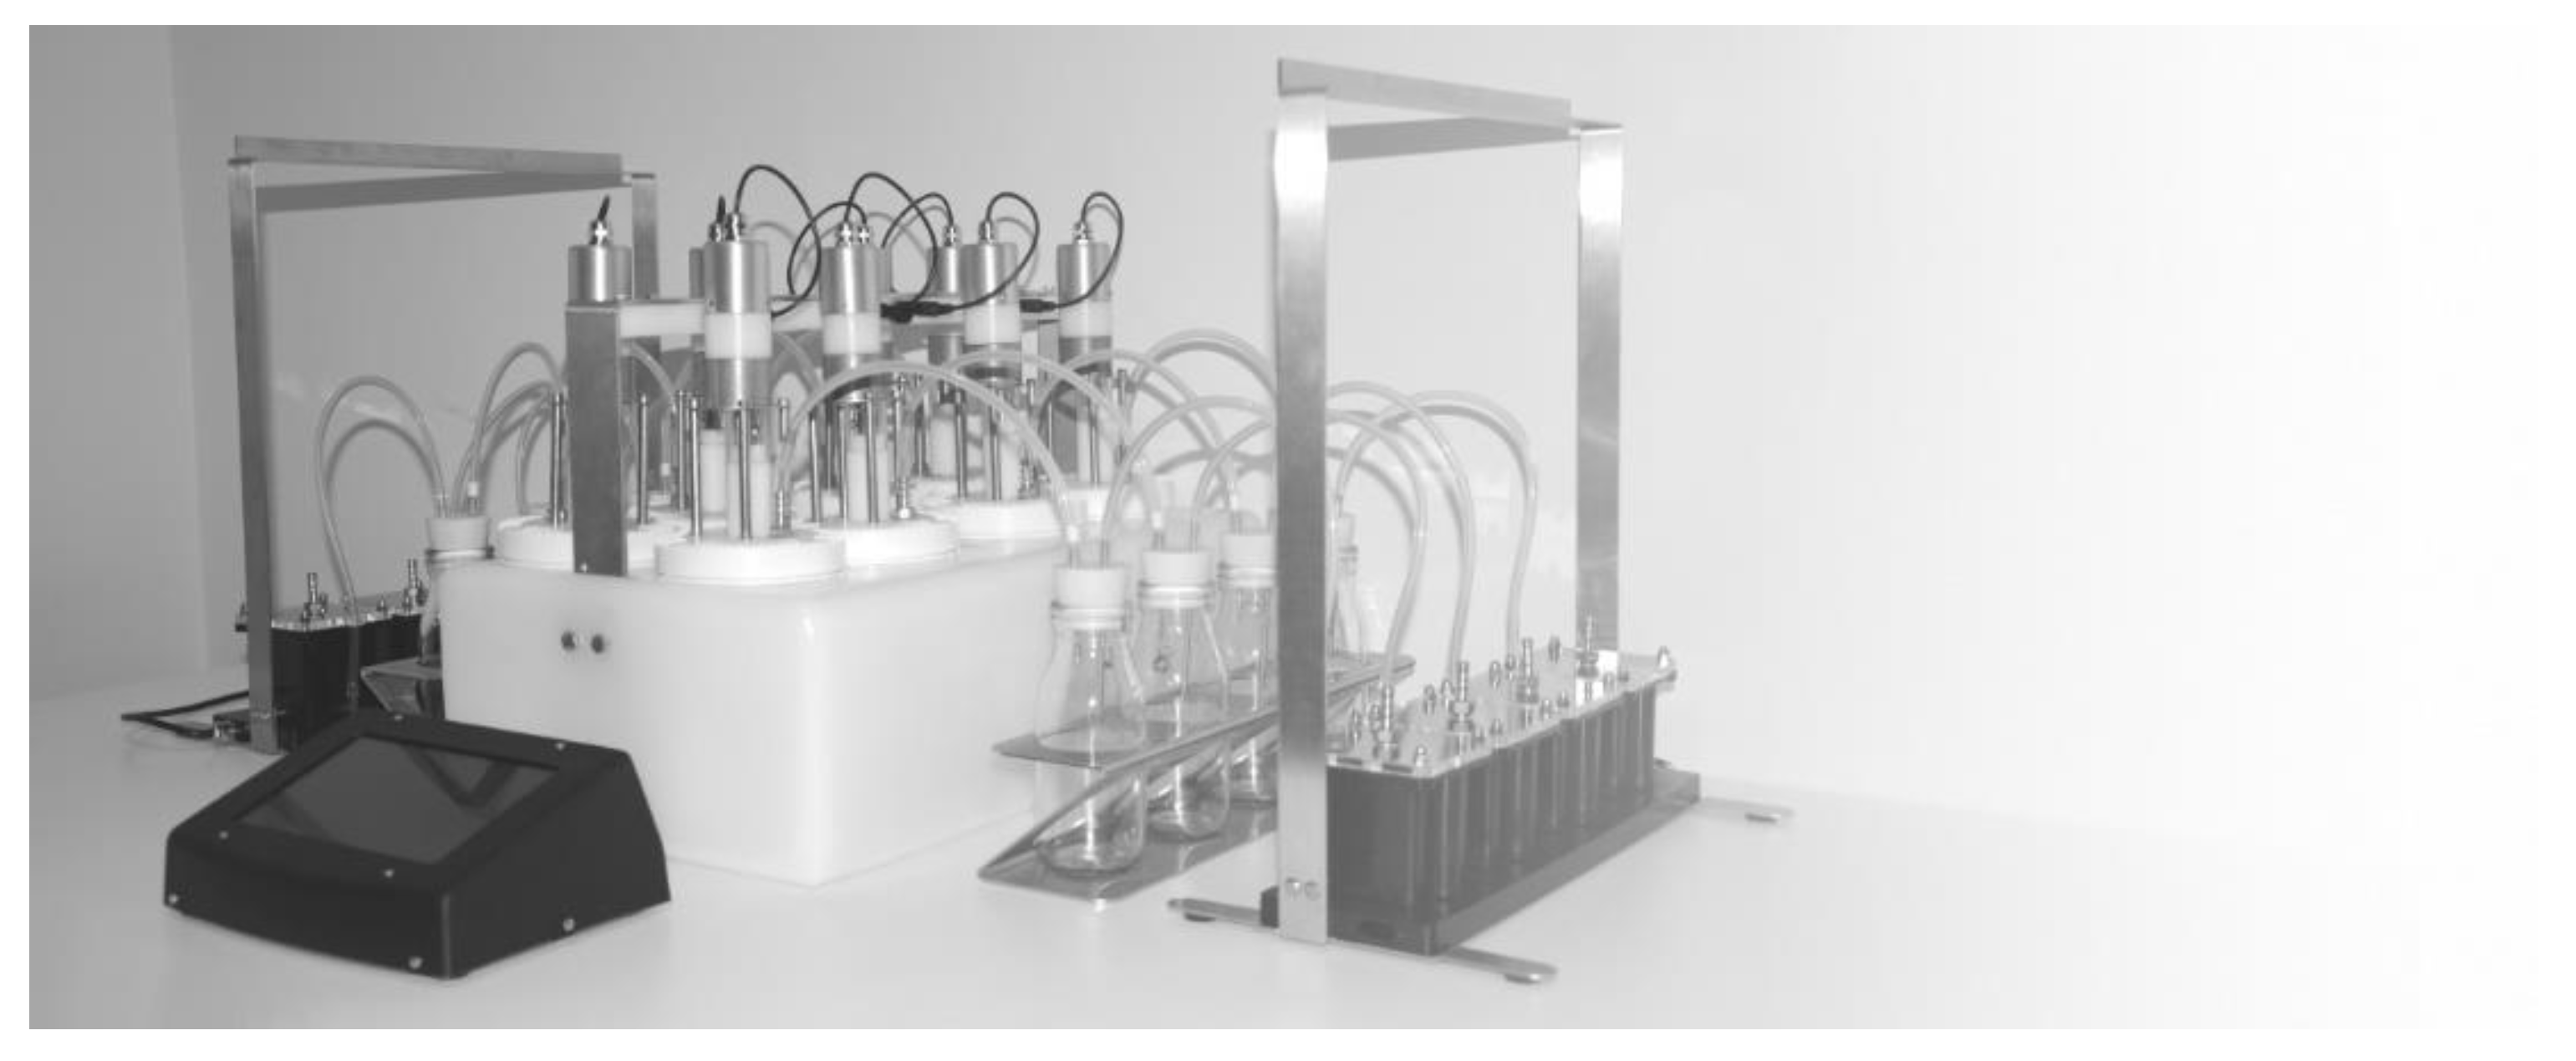
2.3.2. Methane Potential Determination

The methane potential (MP) of the fresh mixed sample and freeze-dried samples were analysed using a biomethane potential test system (CJC Labs Ltd., Oaktree, Nether Wasdale, Seascale, CA20 1ET, UK) shown in Figure 2 and described in Milledge et al. [33].
The inoculum was collected from the internal recirculation granular sludge anaerobic digester of Smurfit Kappa Townsend Hook Paper Makers (Mill Street, Snodland, Kent, UK) treating liquid waste from the paper industry [33]. The following samples were examined for methane potential:
(a)
Fresh Mixed Sample (A)
(b)
Freeze-Dried Mixed Sample (A)
(c)
S. natans VIII (B)
(d)
S. natans I (C)
(e)
S. fluitans (D)
(f)
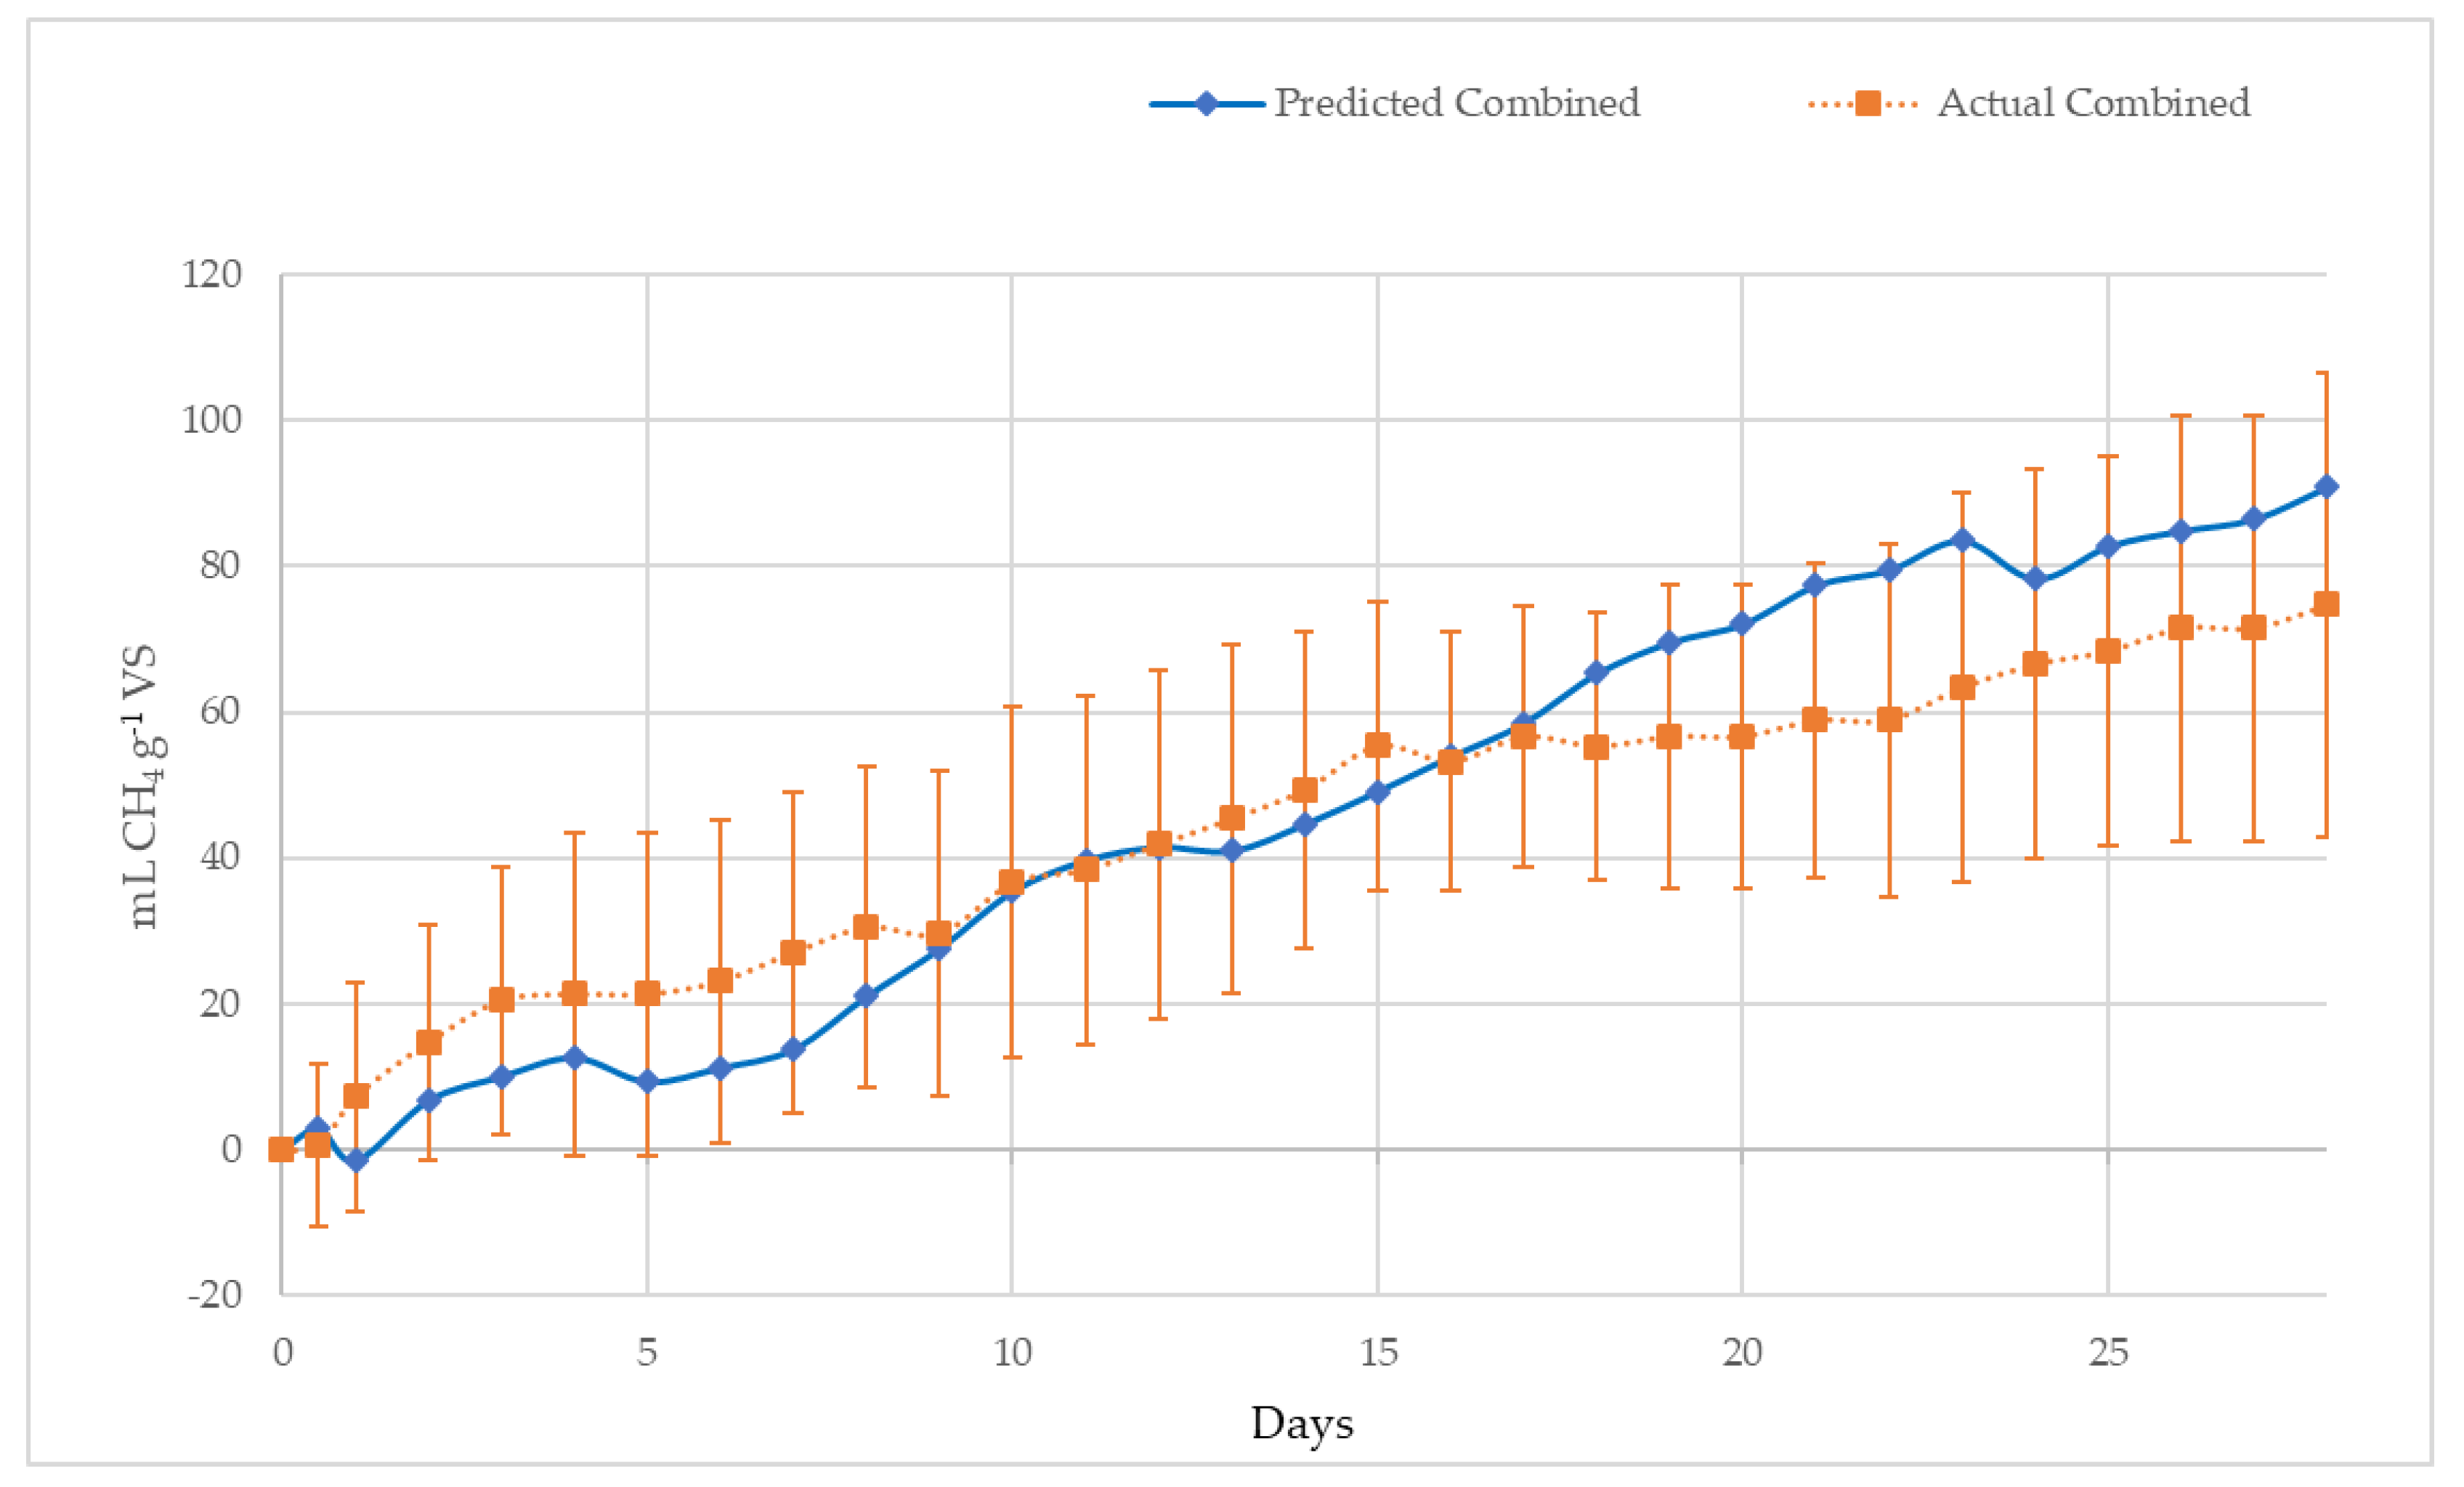
A mixture based on the volatile solids (VS) percentage of 1.0% S. natans VIII (B), 49.3% S. natans I (C) and 49.7% S. fluitans (D), the ratio of the three pelagic Sargassum species found previously in Shark Bay [61]. The ratio was selected to examine the potential synergistic and antagonistic effects of a mixture of species on methane yield. However, the composition of floating Sargassum mats and beach inundations can vary widely [62].
Four experimental replicates using the equivalent of 1 g volatile solids of each variant, at an inoculum-to-substrate VS. ratio of 9:1, were carried out, together with three controls containing no substrate, but containing inoculum. Methane volume, pressure and temperature data were recorded continuously, and gas volumes were normalised (100 kPa, 0 °C, dry gas).

2.4. Statistical Analysis

IBM SPSS Statistics 25 was used for two-way Analysis of Variance (ANOVA) with data tests for Skewness (0.5 to −0.5), Kurtosis (1 to −1) and normality (Kolmogorov–Smirnov (>0.05) and Shapiro–Wilks (>0.05)). A two-way ANOVA was performed to examine the effect species (S. natans VIII (B), S. natans I (C) S. fluitans (D)) and time and their interaction on daily cumulative methane production from the MP test. SPSS was also used for calculation of the Coefficient of Correlation between phenolic content and MP, and for the one-sample t-test to compare the predicted MP to the experimental value.
Excel 2019 (Microsoft Office ProPlus 365 64 bit) was used for one-way ANOVAs, t-tests and all other statistical analyses. One-way ANOVAs and t-tests were conducted to compare the effect of species on MP, water, ash, salt, lipid content, protein content, calorific value and the effect of freeze-drying on MP.

3. Results

3.1. Compositional Analysis

3.1.1. Moisture, Ash, Total Solids and Volatile Solids

The moisture content, ash, total solids and volatile solids content is shown in Table 1. The moisture and ash content of the mixed sample is statistically higher (p < 0.05) than S. natans VIII, S. natans I or S. fluitans.

3.1.2. Salt and XRD analysis

The salt content of the ash is shown in Table 2.together with results expressed on dry weight and wet weight basis. The ash of mixed Sargassum is statistically (p < 0.5) lower in salt than the other samples, while the ash of S. natans I is statistically (p < 0.05) higher in salt. However, when expressed on a wet weight basis, the differences in salt content are small (2.6–2.9%).
The results of the XRD analysis of the ash from the samples are in shown in Table 3. The mixed sample has considerably more CaCO₃ and KCl than any of the three individual species of pelagic Sargassum.

3.1.3. CHNS

The results of the CHNS analyses are shown in Table 4. The mixed sample biomass has a lower C:N ratio and higher C:O ratio than the other pelagic species’ samples.

3.1.4. ‘Heavy Metals’

The results of the ‘heavy metal’ and metalloid analyses are shown in Table 5. The results confirm the XRD analysis that the mixed sample is richer in calcium, potassium and magnesium.

3.1.5. Phenols

The total phenolic content results expressed in mg phloroglucinol equivalent (PG eq) per gram of dry matter and per gram of VS. are shown in Table 6. A one-way ANOVA found that species was a highly significant influence on total phenolic content (p < 0.001), and t-tests revealed that all the samples’ phenolic contents were significantly different from each other (p < 0.05).

3.1.6. Amino Acids

The amino acid (AA) profile of and total %AA in dry samples of Sargassum inundation (‘Mixed Sargassum’) and pelagic species of Sargassum from Turks and Caicos is shown Table 7. The total amino acid content is low for all the samples <4.2%.

3.1.7. Fatty Acids

The fatty acid profile of the various samples is shown in Table 8. The predominant fatty acid in all the samples is palmitic acid which makes up a large proportion of the saturated fatty acids (72–89%). Nonetheless, all the samples contain a considerable proportion of Polyunsaturated Fatty Acids (PUFAs) (>25%), and fish oils typically contain 10–25% PUFAs [63].

3.1.8. Total lipid and Fibre

The lipid and total fibre contents are shown in Table 9. All the samples had a high fibre content (>31%) and low lipid content (<4.6%).

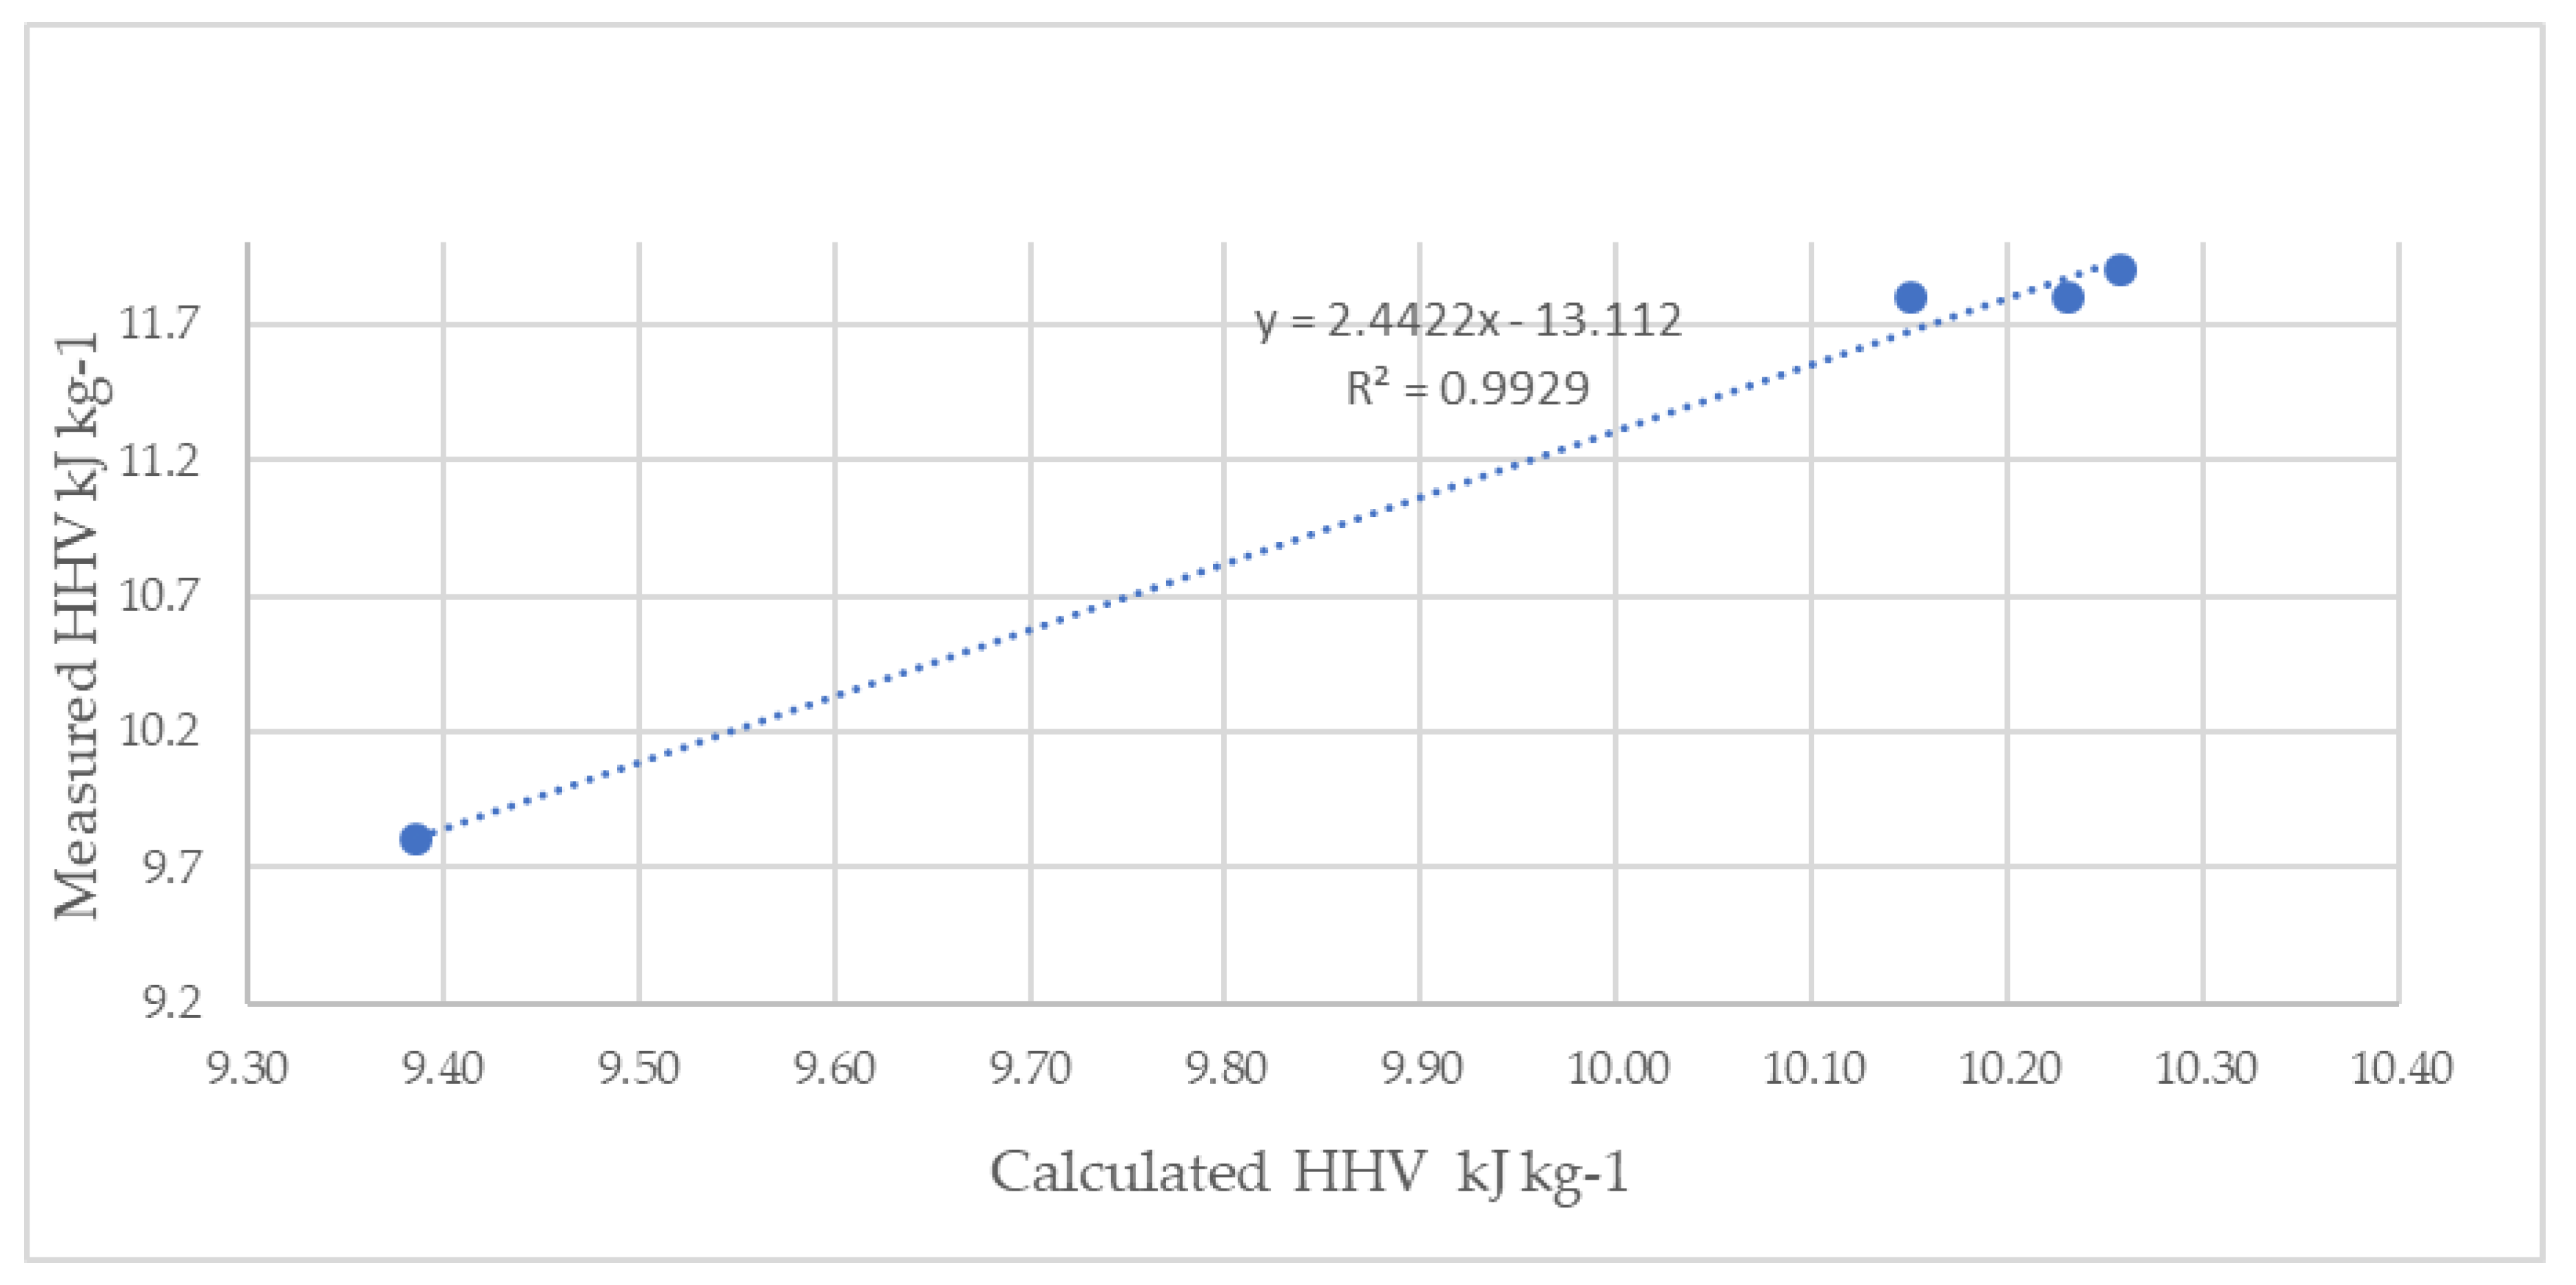
3.1.9. Higher Heating Value

The results of the bomb calorimetric analyses are shown in Table 10, together with calculated values using a modified ‘DuLong equation’ from the elemental analysis [55] and also from the protein, lipid and carbohydrate (including fibre) content using the method of Heaven et al. [56]. Both methods of calculation predict a higher HHV than the measured HHV via bomb calorimetry. There is a poor correlation (Coefficient of Correlation, 0.193) between the figures calculated from the CHNSO and measured HHVs. However, the is a strong correlation between the calculated values based on the protein, lipid and carbohydrate (including fibre) content and measured data (Coefficient of Correlation, 0.996). As can be seen in Figure 3, despite the high degree of correlation, the calculated figure overestimates HHV. The HHV of the mixed sample is statistically (p < 0.05) less than S. natans VIII, S. natans I or S. fluitans.

3.2. Methane Potential

3.2.1. Theoretical Methane Potential of S. Natans VIII, S. Natans I and S. Fluitans

The theoretical MP from the ‘Buswell equation’ based on CHNSO and the method of Heaven et al. [56] based on the lipid, protein and carbohydrate content (both including and excluding fibre) are shown in Table 11 together with actual MP and biodegradability index (BI), the percentage of the actual relative to the theoretical. No correlation was found between the various theoretical MPs and the actual MPs (Coefficients of Correlation between −0.89 and 0.58).

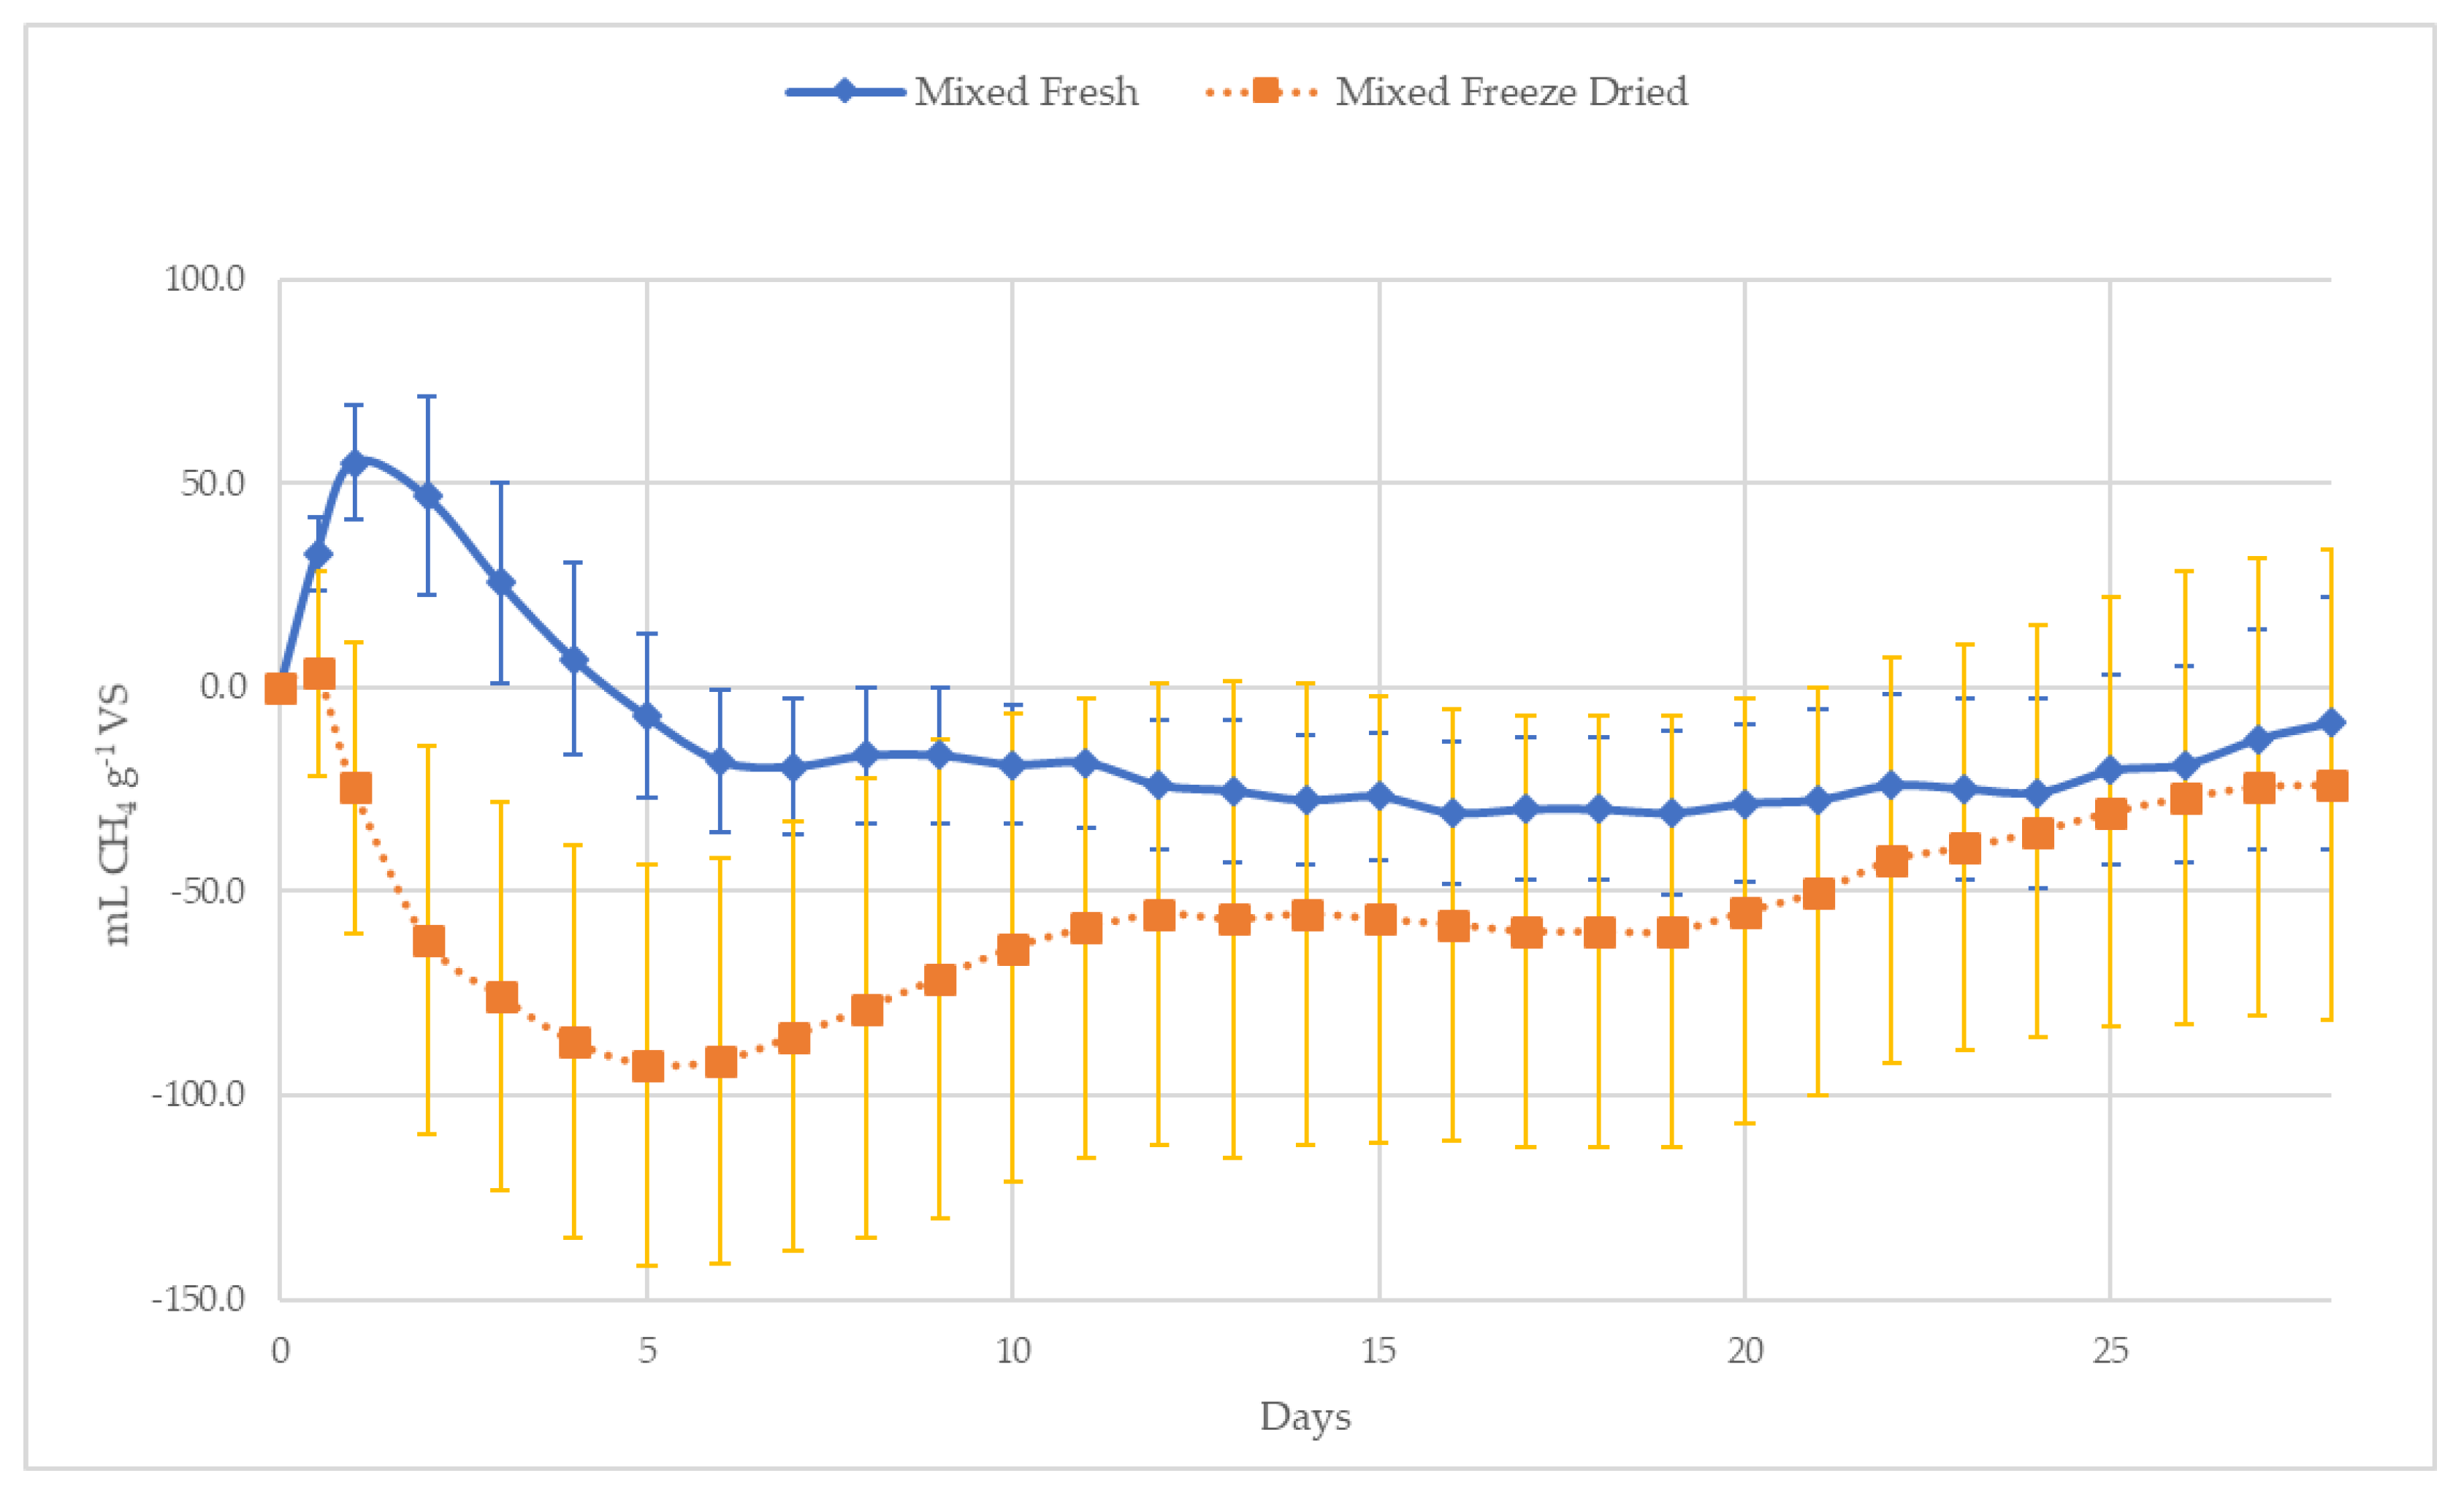
3.2.2. Fresh versus Freeze-Dried

The final methane yield after 28 days for fresh ‘Mixed Sargassum’ sample was not statistically significantly different (p > 0.05) from the freeze-dried ‘Mixed Sargassum’. Figure 4 shows the net mean methane production over the 28 days of the MP test from fresh and freeze-dried ‘Mixed Sargassum’ inundation samples from Turks and Caicos. The MP of both the fresh and freeze-dried samples were not statistically different (p > 0.05) from the blank (containing just inoculum and no additional substrate).

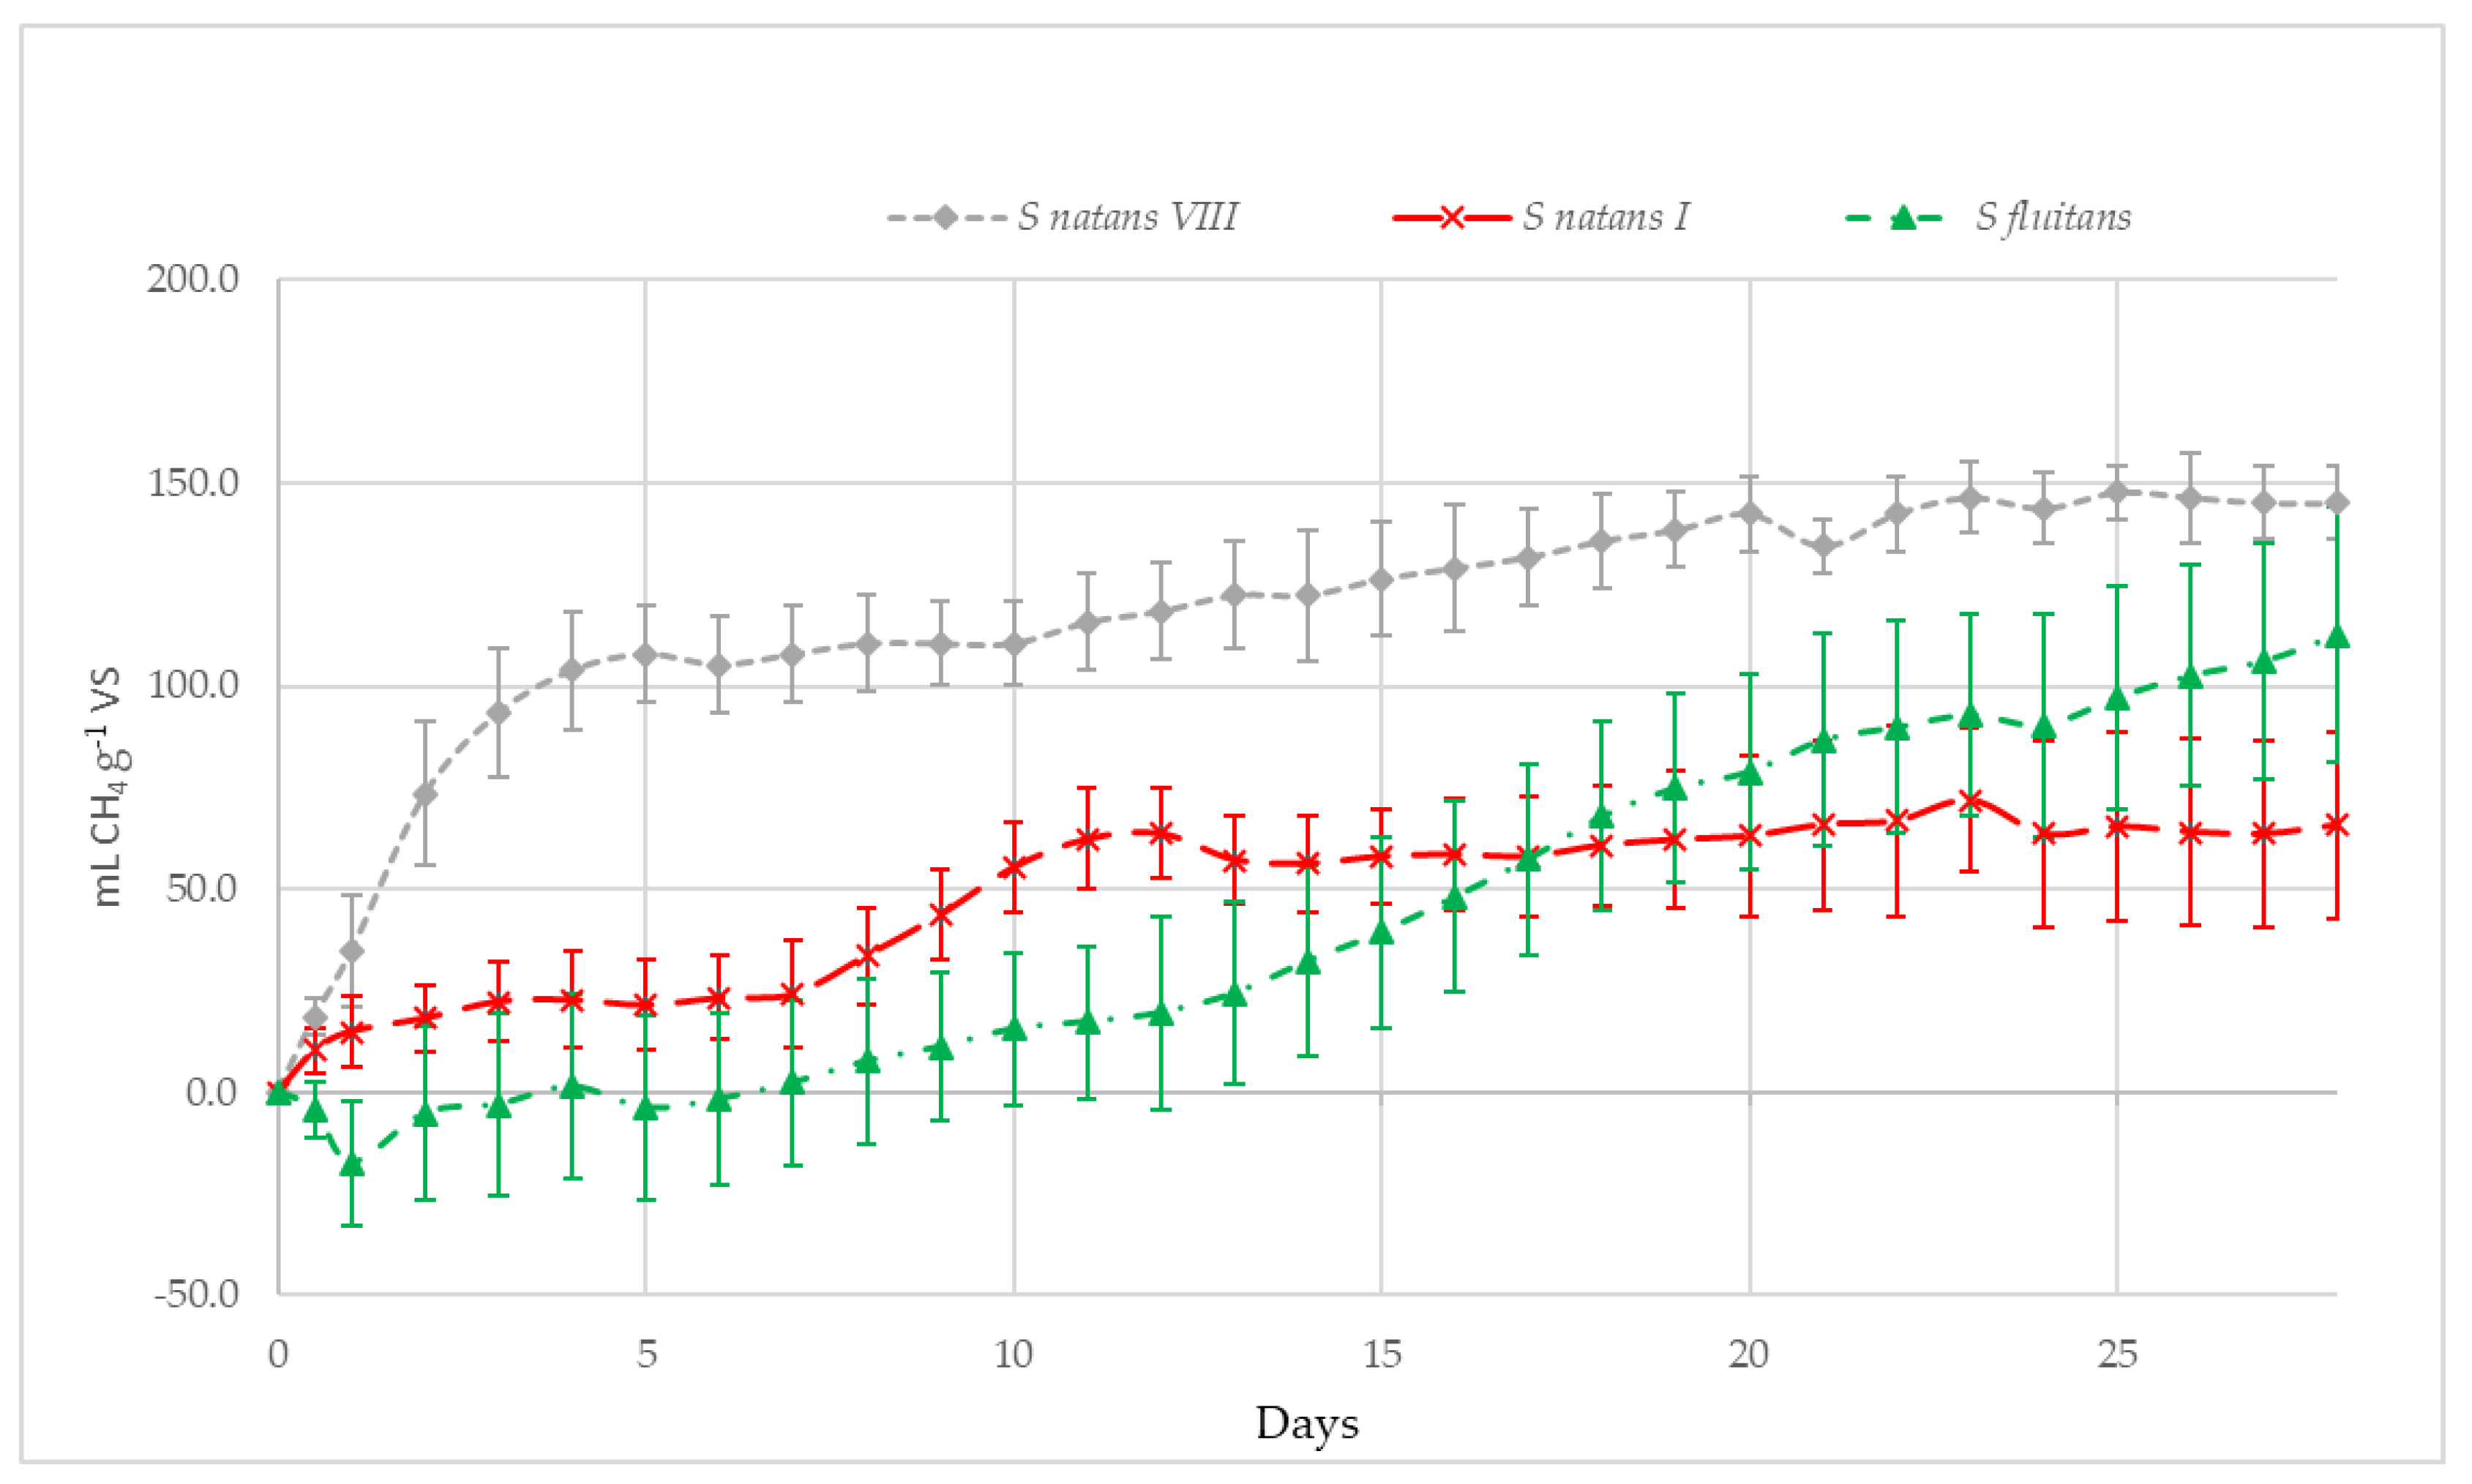
3.2.3. Methane Potential of S. Natans VIII, S. Natans I and S. Fluitans

The plots of methane volume produced per gram of vs. for the three species of pelagic Sargassum are shown in Figure 5. A two-way ANOVA found that species, time and the interaction of species and time all had a highly significant effect (p < 0.01) on the volume of methane produced. The MP of all three pelagic species were all significantly higher than the mixed sample (p < 0.05). A one-way ANOVA found that the effect of the species for the three pelagic species on MP was highly significant (p < 0.01). Both S. natans VIII and S. fluitans had significantly higher MPs than S. natans I (p < 0.01).

3.2.4. Methane Potential of S. Natans VIII, S. Natans I and S. Fluitans

The plot of the predicted methane yield for the combined S. natans VIII, S. natans I and S. fluitans (based on the previous experimental results for each species) and the actual methane yield is shown in Figure 6. There is a high degree of correlation between the predicted and actual results with a Coefficient of Determination R2 of 0.853 between the actual and predicted plots of methane yield versus time. There was no significant statistical difference (p = 0.381) between the predicted MP and the actual based on a one-sample mean t-test, SPSS.

4. Discussion

4.1. Composition of Sargassum

All the Sargassum samples were high in moisture (82–87%) and rich in ash (34–47% dw) and are comparable to other brown seaweeds (80–90% moisture, 15–44% ash dw) [25,64,65,66], and in particular, other members of the Sargassum genus (80–90% moisture and 14–44% ash dw) [6,64,67,68,69]. The ash content of S. fluitans collected from the Caribbean has been reported as 24% (St Lucia) and 19–22% (British Virgin Islands) [34]. However, Oyesiku and Egunyomi [70] found considerably less ash, 9.5%, for pelagic Sargassum (a mixture of S. natans and S. fluitans) collected from beaches of Ondo State, Nigeria. Nevertheless, the ash content of S. natans from Zhanjiang of Guangdong province, China, was found to be considerably higher at 29% [71]. Although the figures found here for the three species of pelagic Sargassum studied (34–36%) are higher than those reported for pelagic Sargassum, they are within the range reported for the genus Sargassum and the difference may be due to season and location. Seaweed composition varies widely not only with species but also season and location [64,72,73,74].

4.1.1. Minerals and Metals

The ash of all the samples was rich in sodium chloride. The salt concentration on a wet weight basis for the four samples varies between 2.6% and 2.9% below the average salinity of surface seawater surrounding the Turks and Caicos 3.6% [75]. The NaCl content of the ash, measured by the ‘Mohr’ titration of chloride ions, range from 32% to 64%, while XRD values range from 19% to 72%. Sezey and Adun [76] estimated the accuracy of the ‘Mohr’ method to be between 70% and 105%. Although rapid and straightforward with a detection limit of 0.1%, it assumes that the chloride ions are all from NaCl and tends to overestimate NaCl when KCl is present as is the case with the mixed inundation sample (A).
The high KCl content of mixed inundation sample (A) found by XRD is reflected in the high potassium content measured by ICP, 69,359 mg kg−1 dw. The reason for the high potassium content in sample A relative to the three pelagic species is not known and requires considerably more research. Oyesiku and Egunyomi [70] found 280 mg kg−1 of potassium in pelagic Sargassum off the coast of Nigeria. Addico and deGraft-Johnson [77] found lower potassium levels for pelagic Sargassum, collected offshore and onshore, from various sites in Ghana of 0.72 to 2.28 mg g−1 on a wet weight basis (~2–15 mg g−1 dw); however, these samples were washed in distilled water which can leach-out minerals [60]. Considerably higher levels have been found in other species of Sargassum from India, 35,000–121,410 mg kg−1 dw [78].
The high ash content of Sargassum could provide minerals and trace elements that are beneficial in both fertiliser and animal feed [19,70,79,80]. Coastal plant growth responds well to the use of Sargassum as a fertiliser as it is a useful source of N, P and K, and the use of Sargassum as a fertiliser could be a natural method of dealing with golden tides [19,81]. However, there have been concerns regarding the use of Sargassum, as seaweeds can bioaccumulate metals at concentrations many times above the levels found in the surrounding seawater [35,36,37]. Table 5 shows the ‘heavy metals’ analyses for S. natans I, S. natans VIII, S, fluitans and the mixed inundation sample (A). Sample A is not only richer in calcium and potassium than the three individual pelagic species but also phosphorus and iron. These high levels may be due to other organic matter from other species of seaweed, seagrass, epiphytes and small herbivores. Shellfish are rich in iron (haemoglobin present for oxygen transport) [82]. The iron content of seaweeds and seagrasses can vary widely, with brown seaweeds reported with an iron level of up to 9300 mg kg−1, with physically small species tending to have higher levels [64,69,83]. However, Sargassum species can also contain very high iron levels (1569 mg kg−1), and the difference may be just natural sample variability.
There has been a range of studies on metalloids in seaweed [69,84,85], but only limited data is available on pelagic Sargassum. However, Rodríguez-Martínez et al. [43] recently completed a study on the concentrations of fourteen different elements (Al, As, Ca, Cl, K, Mg, Mn, P, Rb, S, Si, Sr, Th and U) in pelagic Sargassum collected from various sites along the Mexican Caribbean coast, from August 2018 to April 2019, and showed that there was both seasonal and spatial variability in metalloids. Some elements showed more than a 5-fold difference between their minimal and maximal concentrations [43]. The levels detected in this study generally fall within the results reported by Rodríguez-Martínez et al. [43], but the levels in this study were considerably higher for iron and lower for manganese in all samples. The levels of both phosphorus and potassium in the ‘Mixed Sargassum’ were above the maximum levels found by Rodríguez-Martínez et al. [43]. The levels of cadmium, chromium, copper, lead and manganese in the current study were similar to those found in S. muticum [86]. Chen et al. [84] in a study of 295 brown and red seaweed samples found that elements in seaweeds can be listed in descending order of mean concentration: Al > Mn > As > Cu > Cr > Cd > Pb > Hg, but this study found a slightly different order of As > Al > Mn > Cu > Pb > Cr > Cd > Hg with both arsenic and lead being higher in the relative order. The arsenic levels for the three pelagic species of Sargassum (21–30 mg kg−1) was similar to that previously reported for S. fluitans (20–28 mg kg−1) [34,87]. However, the concentration in the mixed sample (A) was considerably higher (123 mg kg−1). Arsenic levels of 13–172 mg kg−1 have been reported in pelagic Sargassum [43], and levels of up to 231 mg kg−1 have been recorded for members of the Sargassum genus [87].
The World Health Organisation classes arsenic as one of 10 chemicals of major public health concern, and there have been health advisories around the world concerning arsenic in Sargassum, and in particular, S. fusiform [87]. In this study, only total arsenic was measured, but inorganic arsenic is more toxic than organic arsenic. Although many seaweeds accumulate arsenic as less toxic arsenosugars, some species of Sargassum can have up to 80% of their arsenic content as the highly toxic inorganic form [84,87]. In the UK, legislation from 1959 restricted total arsenic in food to 1 mg kg−1, but this limit did not apply for naturally present arsenic in seaweed [88]. Regulated maximum levels of inorganic arsenic in seaweed range from 1 to 3 mg kg−1 [89]. The EU has advised on the levels of inorganic arsenic in the diet and rice products [90], although there is no general agreement on maximum allowable quantities of arsenic in seaweeds [91]. Arsenic may also be a problem in animal feed with seaweed-derived feeds having an arsenic content (40 mg kg−1) 10 times higher than that of grass-based feeds [92]. Arsenic in fertilisers may also accumulate in the soil and arsenic content in seaweed may limit its value as a fertiliser [93]. The levels of total arsenic in seaweed found in this study are above the arsenic soil action limit (20 mg kg−1) for many countries around the world [94]. However, the arsenic content of Sargassum-based compost can be reduced by combining Sargassum with food waste and wood chip in a ratio 4:48:48 (5.9–7.2 mg kg−1) [19]. Dilution of Sargassum with other wastes may also be an option for AD in reducing arsenic, other metalloids and salt content in the digestate. However, this dilution approach for both AD and composting will depend on the nature and quantity of organic waste, which varies greatly been islands of the Caribbean [34,95]. AD has been shown to reduce the amount of arsenic in terrestrial organic solids (Chinese brake fern (Pteris vittata L.)) by two thirds, although by reducing arsenic in the digestate, the arsenic is ‘transferred’ to the wastewater, potentially causing a further waste treatment problem [96]. Despite the uneasiness about arsenic exposure from seaweed, there is a lack of information evaluating seaweed, and arsenic speciation in pelagic Sargassum in particular, as a source of arsenic for fuel, feed and fertiliser [97].
The levels of lead, cadmium and mercury are below the French recommendations for heavy metals in seaweed (lead 5 mg kg−1, cadmium 0.5 mg kg1 and mercury: 0.1mg kg−1). These regulations are considered very conservative relative to fish and shellfish but are widely used in the absence of a recognised international standard [91]. Tejada-Tejada et al. [98] found that cadmium, copper, chromium, nickel, lead and zinc levels in Sargassum did not represent a potential danger to health. The results of this study also indicate that heavy metal content of pelagic Sargassum is not a health concern, but the metalloid, arsenic, may pose a problem, especially if speciation studies find that it is primarily the inorganic form. However, there is a need for further research and constant monitoring.

4.1.2. Phenols

High levels of phenolic compounds in Sargassum may be problematic as they can inhibit AD and can impart not only desirable flavours but also undesirable tastes [74,99]. However, many phenolic compounds have potentially useful bioactivity and Sargassum spp. has been suggested as a sustainable source [100]. There is a significant difference between the phenolic levels in all four samples; however, the mixed sample (2.95%) has nearly five times the level of phenolics than the next highest sample (0.66%) (S. natans I). Phlorotannins, the primary phenolics in brown seaweed, are secondary metabolites that are produced in response to stress, particularly from attack by herbivores [101,102]. The high levels found in this study may be due to the presence of herbivores and other epiphytes. Also, the washing of the separated species may remove phenolics as some are soluble in seawater and phenolics are often excreted into the surrounding ocean [101,103]. Sargassum is potentially the largest natural source of polyphenols in the open ocean contributing 30 to 200 Gg C year−1 to the Gulf of Mexico and Western North Atlantic [104]. There is little data on the level of phenolics in pelagic Sargassum, although S. fluitans was reported to have a less than 0.1% phenolics [34]. However, S. muticum has been found to have a wide variation in phenolic content depending on season and location (0.7–6% dw) [73,105,106].

4.1.3. Sulphur and Carbon

The sulphur content was relatively low (<0.4%) for all samples and considerably below that previously reported for S. natans (1.4%) [71]. However, the sulphur content of S. muticum has been found to vary with season and storage [32,33]. This lower sulphur could reduce the problems of rotting Sargassum producing foul-smelling and toxic hydrogen sulphide [8,18]. The carbon content (27–29%) is similar to that reported for S. natans (28.9%) [71] but lower than that reported for S. fluitans (34.29%); however, the latter sample had a lower ash content (24%), and minerals could have leached-out [19] increasing the relative carbon content.
The N content of samples varied between 1.3% and 1.7%. The C:N ratio varied between 16:1 for the mixed sample A and 22:1 for S. natans I. Lapointe et al. [107] found that the C:N ratio varies greatly with available nutrients, with the average ratio in the deep open ocean being 47 and 27 in shallower neritic waters, but no significant difference between S. fluitans and S. natans. However, Wang et al. [71] found the C:N ratio for S. natans to be 7:1, whilst Morrison and Gray [34] found a ratio of 30:1 for S. fluitans. The C:N ratio of floating ‘Mixed Sargassum’ mats off the coast of Nigeria was estimated to be ~23:1 [70].

4.1.4. Protein and Amino Acids

Most methods of protein analysis tend to overestimate the amount of protein, and the Food and Agriculture Organisation of the United Nations (FAO) recommended that total protein is established by amino acid analysis [108]. Thus, the total amino acid content can be taken as a reasonable indication of total protein.
The amino acid content of the mixed sample (4.16%) is higher than any of the three pelagic Sargassum species (S. natans VIII, 2.99%, S. natans I, 3.81% and S. fluitans, 3.25%), and this may be due to the protein-rich herbivores in the unwashed and unsorted mixed sample. The results are towards the low end of the protein content (3–16%) reported for brown seaweeds [64,109]. The results are also below levels of protein reported for S. natans (18%), S fluitans (12.8%) and pelagic mats of S. natans and S. fluitans (15.4%). However, these protein contents were calculated from the nitrogen content using a nitrogen factor and may have overestimated the protein content. Seaweed organic nitrogen is not only associated with amino acids but with compounds such as DNA, pigments and non-protein nitrogen, and their relative contents are often higher in plants than in animals [108]. Thus, the common factor of 6.25 to convert organic nitrogen to protein results in the protein content of seaweed being overestimated [108,110,111]. Angell et al. [109], in an extensive review of the nitrogen factors, recommended a much lower N factor of 4.56 for brown algae. Milledge et al. [33] suggested an even lower factor of 4.1 for Sargassum. However, using the lower factor 4.1 the protein content based on the levels of organic nitrogen overestimate the protein content by 69% to 130% relative to the protein content based on the amino acid analysis.
Although the total amino acid content is low relative to major terrestrial sources of plant protein, the amino acid profile compares favourably with the ‘indispensable amino acid’ profile recommended by the World Health Organisation (WHO) and does not appear to be lacking in any particular amino acid (Table 12). However, there is a need for considerably more analysis of the seasonal and spatial variations of amino acid in pelagic Sargassum.

4.1.5. Fibre

The fibre content of all the samples is high (31–37%), meaning that a large percentage of the organic energic value is not available to humans and monogastric animals. Although many of the compounds in the indigestible fibre may be broken down in AD and by ruminants, it may be a useful indicator of the recalcitrance of the material to breakdown in AD. The high ash and fibre content of all the samples (65–80%) means that the vast majority of the Sargassum is either unable to be broken down or difficult to be broken down in AD to produce methane.

4.1.6. Lipid and Fatty Acids

The total value of the lipid found in four samples of Sargassum from Turks and Caicos were relatively similar (3.58–4.56%). These figures are in agreement with the typical low lipid content of brown seaweeds 0.3–6% [24,113,114] but above those reported for pelagic Sargassum (S. natans 1% [115]) and floating Sargassum mats (2.5%) [70]. However, Kumari et al. [116] found considerably higher lipid contents (6–20%) in a variety of Sargassum species from the Gujarat coast, India. There may be considerable spatial and species variation in the lipid content of Sargassum, and again, further work is required.
The most prevalent fatty acid in all the samples was palmitic acid (C16:0), and this is also the case for many other species of Sargassum where palmitic acid may play a role in controlling the ‘biofouling’ of the fronds of Sargassum [116,117,118]. Palmitic acid makes up 41% of the fatty acids in S natans [115], and this study found palmitic acid to make up 41% of S. natans VIII, but only 24% of S. natans I. The polyunsaturated fatty acids (PUFAs) content varied from 25% to 33%; however, much higher levels of PUFA have been reported for S. natans (~50%). Turner and Rooker [119] found there was considerable variation in the fatty acid composition between species found within Sargassum mats with PUFAs ranging from 16% to 62% of the total fatty acid composition. Two fatty acids in algae that are attracting much attention are Eicosapentaenoic Acid (C20:5) (EPA) and Docosahexaenoic Acid (22:6) (DHA) for a variety of health benefits [120,121,122]. S. natans VIII has a low content of both DHA and EPA. The mixed sample and the other two species have reasonable levels. Sargassum mats could be a potentially valuable source of a wide variety of PUFAs, particularly DHA and EPA for animal nutrition, although the yields per unit of dry biomass are low [2].

4.1.7. Higher Heating Value

The HHV of all the samples is lower than that typical of brown seaweed (11–18 kJ g−1) [123,124,125] and other species of Sargassum (11–16 kJ g−1) [64] and may be due to the high ash content. The mixed inundation sample (A) was considerably richer in ash, and this may be due to the presence of small shelled creatures’ remains within the biomass that were removed during the sorting of the other samples. The calcium content was considerably higher in sample A, from the results of both the ICP (70,305 mg kg−1) and XRD (79,100 mg kg−1) analyses, than the three individual pelagic species, and several times higher than that typical of seaweeds (5700–28,300 mg kg−1) [64]. This high mineral content of the biomass is the main contributor to the significantly lower HHV value of the mixed inundation sample (A) relative to the three pelagic species (B, C and D). When the HHV is recalculated on VS. rather than dw, the mixed inundation sample (A) has an HHV of 17.7 kJ g−1 VS. higher than S. natans VIII (B) (15.6 kJ g−1 VS.), S. natans I (C) (15.8 kJ g−1 VS.) and S. fluitans (D) (15.5 kJ g−1 VS.). The low HHV of the dry pelagic biomass and the high moisture content may make drying energetically unfavourable.
The calculated HHVs using a modified ‘DuLong equation’ were not in good agreement with the values determined experimentally by bomb calorimetry. The ‘DuLong equation’ has been found to be applicable for refuse and some agricultural wastes [126] and a study of S. muticum [32]. Yet, calculated HHVs from this and other studies did not give such close agreement with measured values [23,124]. The ‘DuLong equation’ may not always be applicable for seaweed biomass, and other methods of calculating HHV from the elemental composition may be more relevant [126]. The calculation of HHV based on the protein, lipid and carbohydrate gave a good correlation with experimental data, although giving a higher result than bomb calorimetry, and this method may be more applicable to algal biomass.

4.2. Methane Potential

4.2.1. Fresh Versus Freeze Dried

This appears to be the first study to have attempted to establish the methane potential of ‘fresh’ pelagic Sargassum. However, the transport of wet samples for analysis from the beaches of the Caribbean to appropriate laboratories can be problematic. Freeze-drying can not only reduce the mass to be transported but can also preserve biological materials with minimum damage from heat. Although freeze-drying has been found to improve the MP of some microalgae [127], there is no significant difference in MP between fresh and freeze-dried Sargassum. This confirms the result of unpublished research at the University of Greenwich, which found that freeze-drying made no significant impact on the MP of S. muticum and similar findings on other AD feedstocks [128,129]. Thus, freeze-drying may be a suitable technique for preserving pelagic Sargassum for methane potential testing.

4.2.2. Methane Potential of S. Natans VIII, S. Natans I, S. Fluitans and ‘Mixed Sargassum’ mats

The MPs from all the substrates were considerably below the theoretical potential. The MPs relative to the theoretical calculated (BI) from the CNHSO using the ‘Buswell equation’ range from 17% to 39%, which may reflect the high content of difficult to digest fibre. Although there is considerable variability between species of seaweed in their BI (19–81%) [28], the figures were similar to those reported for S. muticum (≤27%) [30,31,32]. The experimental yields as a percentage of theoretical methane potential excluding fibre of the individual pelagic Sargassum species (35–70%) are a reasonable conversion rate of the digestible carbohydrate, proteins and fats. Morrison and Gray [34] found that only 45% of the VS. of S. fluitans was digested in AD yielding 61 mL CH4 g−1 VS. compared to 113 mL CH4 g−1 VS. in this study. The lower results achieved by Morrison and Gray [34] may in part be due to the partial degradation of the sample, which had been on the beach for some time. The recalcitrance of some of the organic polymers within the pelagic Sargassum may be a major reason for the low yields. Alginate and other hydrocolloids are difficult to breakdown without pre-treatment prior to AD [130,131,132]. Buffiere et al. [133] found fibrous content of terrestrial wastes to be inversely proportional to BI and MP. However, there is no correlation between the fibre content of VS. of the three species and their MPs (Coefficient of Correlation, −0.158), indicating that other factors are involved such as structure, fibre and carbohydrate composition and AD inhibitors.
The mixed sample (A) had a methane potential that was not significantly different from the blank. However, the MP of a combination of S. natans VIII, S. natans I and S. fluitans in a ratio typically found in the waters of Turks and Caicos was very similar to that predicted from the MPs of the individual species. Thus, there does not appear to be a synergistic or antagonist interaction between the species on MP. Although total fibre of the VS. fraction of the mixed sample (A) was lower (63%) compared to the individual species (S. natans VIII (57%), S. natans I (58%) and S. fluitans (47%)), this does not adequately explain the MP equivalent to zero. It appears that inhibitors to methane production must be either present or present at higher levels than in individual pelagic species. A range of inhibitors that restrict the methane production from seaweed have been suggested, including high C:N ratios, sulphated organic compounds, arsenic and phenolics [60].
The C:N ratio plays an important role in the stability of AD digesters and maximising methane output, with high ratios giving a nutrient-limited environment. At the same time, too low a ratio (high nitrogen) can result in the inhibition of methanogens by high ammonia concentrations [134,135,136]. The optimal C:N ratio for the anaerobic conversion of biomass to methane is often suggested ~30:1 [30,137,138,139,140]. However, the optimum C:N ratio can vary with seaweed species from 14:1 to 30:1 [134,141,142,143]. There was no correlation between C:N and MP (Coefficient of Correlation, 0.233), and as the C:N levels (16:1 to 22:1) fall between the optimum ratio found for seaweed, this may not be a major inhibitory factor in this study.
There was no correlation between sulphur content and MP (Coefficient of Correlation, 0.061), and the ratio of C:S is considerable above ≥40:1 recommended to reduce the problem of AD inhibition by H2S [138]. Iron is often used to precipitate sulphur in AD, and a molar ratio of Fe:S ≥ 1 is generally recommended to reduce the problem of sulphur-rich substrates [144,145]. The molar ratio of iron to sulphur was above one for all the samples except S. natans VIII, which had the highest MP. The sulphur levels found in this study (≤0.4% dw) do not appear to present a potential problem for AD.
There were strong negative correlations with both arsenic and phenolic content with MP, with Coefficients of Correlation of −0.926 and −0.948. Although a high degree of correlation does not confirm causality, these findings are in agreement with the published literature. Arsenic can be highly inhibitory, depending on its form, with trivalent forms having 50% inhibitory concentrations of 0.7 and 1.1 mg L−1; nonetheless, there have been few studies on the effect of arsenic on AD [146,147] and especially seaweed. However, the highest concentration of total arsenic in the reactors for this study was 0.6 mg L−1 below the 50% inhibitory concentration of the trivalent form of arsenic, and thus, the levels of arsenic, although potentially concerning, may not be inhibitory for methane production.
Phenolics have been implicated as the inhibitor of AD in some seaweed studies [25,130,148,149,150,151,152]. The phenolic may impede the hydrolysis of complex molecules in the early stages of AD, but this process will depend not only on the phenolic but also the substrate [130,153,154]. Although the information is still somewhat limited, especially on Sargassum, phenolics appear to be a significant factor in the low methane yield from Sargassum and in particular, the mixed mats where the phenolic level was highest.

5. Conclusions

This study has shown that there can be variations in the composition between the major species of pelagic Sargassum (S. natans VIII, S. natans I and S. fluitans). The composition of the ‘Mixed Sargassum’ mats can be substantially different from the individual species. However, there is a need to examine considerably more samples from various locations and seasons. The levels of heavy metals and metalloids examined in this study were generally at levels that should not cause concern for the use of the digestate from AD as a fertiliser, except for arsenic, but further work on the speciation of arsenic in Sargassum is required to fully determine the risk to health and agriculture. The levels of both protein and lipid were low, but the amino acid profile compared favourably with the ‘indispensable amino acid’ profile recommended by WHO, and lipids had a high proportion of PUFAs that may have health benefits. Nevertheless, the low HHV, lipid and protein content together with the high fibre and arsenic content may limit the use of Sargassum for feed applications.
There are differences in methane production between the three species of pelagic Sargassum (S. natans VIII, S. natans I and S. fluitans). However, the methane yields were low relative to their theoretical potential for all three pelagic species. The mixed mats of Sargassum produced virtually no net methane, perhaps due to the high levels of phenolic. Thus, exploitation of Sargassum, and especially unsorted mixed mats, for biogas would appear to be very challenging. Sargassum may need to be pre-treated prior to AD or co-digested with other waste biomass to increase yield.

Author Contributions

Conceptualidation, J.J.M., D.B.; Methodology, J.J.M.; Sample collection, D.B.; Experimental analysis, J.J.M., S.M., E.A.L.; Data Analysis, J.J.M.; Resources, D.B.; Writing—original draft preparation, J.J.M., S.M.; Writing—review and editing, J.J.M., S.M.; Visualisation, J.J.M.; Supervision, J.J.M.; Project administration, D.B.; Funding acquisition, D.B., J.J.M. All authors have read and agreed to the published version of the manuscript.

Funding

This research was funded by Darwin Plus Round 7 “Sustainable solutions for Sargassum inundations in Turks and Caicos”, the University of Greenwich and the Doctoral Training Alliance.

Acknowledgments

The authors wish to thank and acknowledge the technical support of Darren Pink and Andrew Hurt, the assistance in sample collection, as part of their MSc projects, of Kirsty Lee and Sylvia W.M. Myers, and Smurfit Kappa Townsend Hook Paper Makers for provision of the inoculum. Also, the authors thank all their partners in the Darwin Project, especially the Turks and Caicos Department of Environment and Coastal Resources and School for Field Studies, South Caicos, for their help and support for the field team during their stay on Turks and Caicos.

Conflicts of Interest

The authors declare no conflict of interest. The funders had no role in the design of the study; in the collection, analyses and interpretation of data; in the writing of the manuscript; or in the decision to publish the results.

References

  1. Smetacek, V.; Zingone, A. Green and golden seaweed tides on the rise. Nature 2013, 504, 84–88. [Google Scholar] [CrossRef] [Green Version]
  2. Milledge, J.J.; Harvey, P. Golden tides: Problem or golden opportunity? The valorisation of sargassum from beach inundations. J. Mar. Sci. Eng. 2016, 4, 60. [Google Scholar] [CrossRef]
  3. Van Tussenbroek, B.I.; Hernandez Arana, H.A.; Rodriguez-Martinez, R.E.; Espinoza-Avalos, J.; Canizales-Flores, H.M.; Gonzalez-Godoy, C.E.; Barba-Santos, M.G.; Vega-Zepeda, A.; Collado-Vides, L. Severe impacts of brown tides caused by Sargassum spp. on near-shore caribbean seagrass communities. Mar. Pollut. Bull. 2017, 122, 272–281. [Google Scholar] [CrossRef] [PubMed]
  4. Burrowes, R.; Wabnitz, C.; Eyzaguirre, J. The Great Sargassum Disaster of 2018. Available online: https://essa.com/the-great-sargassum-disaster-of-2018/ (accessed on 25 March 2019).
  5. Langin, K. Seaweed masses assault caribbean islands. Science 2018, 360, 1157–1158. [Google Scholar] [CrossRef] [PubMed]
  6. Thompson, T.M.; Young, B.R.; Baroutian, S. Pelagic sargassum for energy and fertiliser production in the caribbean: A case study on barbados. Renew. Sustain. Energy Rev. 2020, 118, 109564. [Google Scholar] [CrossRef]
  7. Maurer, A.S.; De Neef, E.; Stapleton, S. Sargassum accumulation may spell trouble for nesting sea turtles. Front. Ecol. Environ. 2015, 13, 394–395. [Google Scholar] [CrossRef] [Green Version]
  8. Resiere, D.; Valentino, R.; Nevière, R.; Banydeen, R.; Gueye, P.; Florentin, J.; Cabié, A.; Lebrun, T.; Mégarbane, B.; Guerrier, G.; et al. Sargassum seaweed on Caribbean islands: An international public health concern. Lancet 2018, 392, 2691. [Google Scholar] [CrossRef] [Green Version]
  9. Willoughby, S. Sargassum and the Fishing Industry. In Proceedings of the Sargassum Symposium, UWI, Cave Hill, London, UK, 17 August 2015. [Google Scholar]
  10. World Travel & Tourism Council. Caribbean Resiliencea and Recovery: Minimising the Impact of the 2017 Hurricane Season on the Caribbean’s Tourism Sector; WTTC: London, UK, 2017. [Google Scholar]
  11. Anon. Caribbean-Bound Tourists Cancel Holidays Due to Foul-Smelling Seaweed. The Guardian. 10 August 2015. Available online: https://www.leonetwork.org/en/posts/show/7BE7F4EC-F482-4925-BD7D-1252030F54F3 (accessed on 4 March 2016).
  12. Jessop, D. Sargassum a Continuing Challenge for Tourism. In The Caribbean Council Research & Analysis; The Caribbean Council: London, UK, 2019; Volume 22. [Google Scholar]
  13. Tourism Down 30–35% Due to Sargassum: Playa Del Carmen Mayor-Elect. Mexico News Daily. 4 August 2018. Available online: http://sargassummonitoring.com/author/denji/page/2/ (accessed on 11 December 2019).
  14. Beckles, H. Greetings from the vice-chancellor. In Proceedings of the Sargassum Symposium, UWI, Cave Hill, London, UK, 17 August 2015. [Google Scholar]
  15. Khan, A. Region Needs US$120 m to Fight Seaweed. Trinidad Daily Express. 18 August 2015. Available online: https://mexiconewsdaily.com/news/sargassum-a-potential-disaster-for-beaches/ (accessed on 3 March 2016).
  16. Sargassum a Potential Natural Disaster for Caribbean beaches: Researchers. Mexico News Daily. 3 August 2018. Available online: https://www.google.com.hk/url?sa=t&rct=j&q=&esrc=s&source=web&cd=12&ved=2ahUKEwiO4_K6up7oAhWaZt4KHe7fDhQQFjALegQIAhAB&url=https%3A%2F%2Fwww.soundingsonline.com%2Ffeatures%2Fsargassum-blooms-grow-monstrous-and-researchers-say-more-will-come&usg=AOvVaw3nYzoFw6ZtI2oRYwtPOU5s (accessed on 11 December 2019).
  17. De Schaun, K. The Summer of seaweed. In Proceedings of the Sustainability Webinar Series, Online, 21 July 2015. [Google Scholar]
  18. Caribbean Sea Commission. In Proceedings of the Challenges, Dialogue and Cooperation towards the Sustainability of the Caribbean Sea, Port of Spain, Spain, 23–24 November 2015.
  19. Sembera, J.A.; Meier, E.J.; Waliczek, T.M. Composting as an alternative management strategy for sargassum drifts on coastlines. HortTechnology 2018, 28, 80–84. [Google Scholar] [CrossRef]
  20. Laffoley, D.D.A.; Roe, H.S.J.; Angel, M.V.; Ardron, J.; Bates, N.R.; Boyd, L.L.; Brooke, S.; Buck, K.N.; Carlson, C.A.; Causey, B.; et al. The Protection And Management of The Sargasso Sea: The Golden Floating Rainforest of The Atlantic Ocean: Summary Science And Supporting Evidence Case; Sargasso Sea Alliance: Bermuda, UK, 2011. [Google Scholar]
  21. Murphy, F.; Devlin, G.; Deverell, R.; McDonnell, K. Biofuel production in ireland—An approach to 2020 targets with a focus on algal biomass. Energies 2013, 6, 6391–6412. [Google Scholar] [CrossRef]
  22. Milledge, J.J.; Nielsen, B.V.; Maneein, S.; Harvey, P.J. A brief review of anaerobic digestion of algae for bioenergy. Energies 2019, 12, 1166. [Google Scholar] [CrossRef] [Green Version]
  23. Milledge, J.J.; Staple, A.; Harvey, P. Slow pyrolysis as a method for the destruction of japanese wireweed, sargassum muticum. Environ. Nat. Resour. Res. 2015, 5, 28–36. [Google Scholar] [CrossRef] [Green Version]
  24. Milledge, J.J.; Smith, B.; Dyer, P.; Harvey, P. Macroalgae-derived biofuel: A review of methods of energy extraction from seaweed biomass. Energies 2014, 7, 7194–7222. [Google Scholar] [CrossRef]
  25. Barbot, Y.; Al-Ghaili, H.; Benz, R. A review on the valorization of macroalgal wastes for biomethane production. Mar. Drugs 2016, 14, 120. [Google Scholar] [CrossRef] [PubMed] [Green Version]
  26. Aresta, M.; Dibenedetto, A.; Barberio, G. Utilization of macro-algae for enhanced CO2 fixation and biofuels production: Development of a computing software for an LCA study. Fuel Process. Technol. 2005, 86, 1679–1693. [Google Scholar] [CrossRef]
  27. Sutherland, A.; Varela, J. Comparison of various microbial inocula for the efficient anaerobic digestion of Laminaria hyperborea. BMC Biotechnol. 2014, 14, 7. [Google Scholar] [CrossRef]
  28. Allen, E.; Wall, D.M.; Herrmann, C.; Xia, A.; Murphy, J.D. What is the gross energy yield of third generation gaseous biofuel sourced from seaweed? Energy 2015, 81, 352–360. [Google Scholar] [CrossRef]
  29. Huesemann, M.; Roesjadi, G.; Benemann, J.; Metting, F.B. Biofuels from microalgae and seaweeds. In Biomass to Biofuels; Blackwell Publishing Ltd.: Oxford, UK, 2010; pp. 165–184. [Google Scholar] [CrossRef]
  30. Jard, G.; Marfaing, H.; Carrere, H.; Delgenes, J.P.; Steyer, J.P.; Dumas, C. French Brittany macroalgae screening: Composition and methane potential for potential alternative sources of energy and products. Bioresour. Technol. 2013, 144, 492–498. [Google Scholar] [CrossRef]
  31. Soto, M.; Vazquez, M.A.; de Vega, A.; Vilarino, J.M.; Fernandez, G.; de Vicente, M.E. Methane potential and anaerobic treatment feasibility of Sargassum muticum. Bioresour. Technol. 2015, 189, 53–61. [Google Scholar] [CrossRef]
  32. Milledge, J.J.; Harvey, P.J. Ensilage and anaerobic digestion of Sargassum muticum. J. Appl. Phycol. 2016, 28, 3021–3030. [Google Scholar] [CrossRef]
  33. Milledge, J.; Nielsen, B.; Sadek, M.; Harvey, P. Effect of freshwater washing pretreatment on Sargassum muticum as a feedstock for biogas production. Energies 2018, 11, 1771. [Google Scholar] [CrossRef] [Green Version]
  34. Morrison, M.; Gray, D. Anaerobic Digestion Economic Feasibility Study: Generating Energy From Waste, Sewage and Sargassum Seaweed in the OECS; The Caribbean Council: London, UK, 2017. [Google Scholar]
  35. Carro, L.; Barriada, J.L.; Herrero, R.; de Vicente, M.E.S. Interaction of heavy metals with Ca-pretreated Sargassum muticum algal biomass: Characterization as a cation exchange process. Chem. Eng. J. 2015, 264, 181–187. [Google Scholar] [CrossRef]
  36. Besada, V.; Andrade, J.M.; Schultze, F.; González, J.J. Heavy metals in edible seaweeds commercialised for human consumption. J. Mar. Syst. 2009, 75, 305–313. [Google Scholar] [CrossRef]
  37. Khaled, A.; Hessein, A.; Abdel-Halim, A.M.; Morsy, F.M. Distribution of heavy metals in seaweeds collected along marsa-matrouh beaches, egyptian mediterranean sea. Egypt. J. Aquat. Res. 2014, 40, 363–371. [Google Scholar] [CrossRef] [Green Version]
  38. Carpenter, E.J.; Smith, K.L. Plastics on sargasso sea-surface. Science 1972, 175, 1240. [Google Scholar] [CrossRef]
  39. UNEP. Sargassum White Paper—Sargassum Outbreak in the Caribbean: Challenges, Opportunities and Regional Situation; Scientific and Technical Advisory Committee (STAC) to the Protocol Concerning Specially Protected Areas and Wildlife (SPAW) in the Wider Caribbean Region: Panama City, FL, USA, 2018. [Google Scholar]
  40. Davis, T.A.; Volesky, B.; Vieira, R. Sargassum seaweed as biosorbent for heavy metals. Water Res. 2000, 34, 4270–4278. [Google Scholar] [CrossRef] [Green Version]
  41. Schmuck, A.M.; Lavers, J.L.; Stuckenbrock, S.; Sharp, P.B.; Bond, A.L. Geophysical features influence the accumulation of beach debris on caribbean islands. Mar. Pollut. Bull. 2017, 121, 45–51. [Google Scholar] [CrossRef]
  42. Nkoa, R. Agricultural benefits and environmental risks of soil fertilization with anaerobic digestates: A review. Agron. Sustain. Dev. 2014, 34, 473–492. [Google Scholar] [CrossRef] [Green Version]
  43. Rodríguez-Martínez, R.E.; Roy, P.D.; Torrescano-Valle, N.; Cabanillas-Terán, N.; Carrillo-Domínguez, S.; Collado-Vides, L.; García-Sánchez, M.; van Tussenbroek, B.I. Element concentrations in pelagic Sargassum along the Mexican Caribbean coast in 2018-2019. PeerJ 2020, 8, e8667. [Google Scholar] [CrossRef] [Green Version]
  44. Cameron, C.M.; Gatewood, J.B. Beyond Sun, Sand and Sea: The Emergent Tourism Programme in the Turks and Caicos Islands. J. Herit. Tour. 2008, 3, 55–73. [Google Scholar] [CrossRef]
  45. Statistics Department|turks and Caicos Islands Government. Turks and Caicos Islands Percentage Contribution of Gross Domestic Product by Economic Activity in Constant Prices: 2012–2018; Department, S., Ed.; Turks and Caicos Islands Government: Turks and Caicos Islands, UK, 2019.
  46. Anon. Turks and Caicos. Available online: https://lovinturksandcaicos.com/turks-and-caicos-government-news/the-tcig-has-an-important-message-about-the-seaweed-collecting-on-our-shores (accessed on 29 January 2018).
  47. Solid Biofuels. Determination of Moisture Content. Oven dry Method. Total Moisture. Simplified Method. In BS EN 14774-2:2009; BSI: London, UK, 2009.
  48. Solid Biofuels -Determination of Ash Content. In BS EN 14775:2009; BSI: London, UK, 2009.
  49. Pearson, D. Laboratory Techniques in Food Analysis; Butterworth: London, UK, 1973. [Google Scholar]
  50. Skoog, D.A. Fundamentals of Analytical Chemistry, 8th ed.; Thomson/Brooks/Cole: London, UK, 2004. [Google Scholar]
  51. Matanjun, P.; Mohamed, S.; Mustapha, N.M.; Muhammad, K.; Ming, C.H. Antioxidant activities and phenolics content of eight species of seaweeds from north Borneo. J. Appl. Phycol. 2008, 20, 367. [Google Scholar] [CrossRef]
  52. Matyash, V.; Liebisch, G.; Kurzchalia, T.V.; Shevchenko, A.; Schwudke, D. Lipid extraction by methyl-tert-butyl ether for high-throughput lipidomics. J. Lipid Res. 2008, 49, 1137–1146. [Google Scholar] [CrossRef] [PubMed] [Green Version]
  53. AOAC. Method 960.52. In Official Methods of Analysis of AOAC International. Association; AOAC, Ed.; AOAC International: Gaithersburg, MD, USA, 1997. [Google Scholar]
  54. Determination of the Gross Heat of Combustion (Calorific Value). In BS EN ISO 1716:2010; BSI: London, UK, 2010.
  55. Online Combustion Handbook. Method from Combustion File 24; International Flame Research Foundation: Ijmuiden, The Netherlands, 2004.
  56. Heaven, S.; Milledge, J.; Zhang, Y. Comments on Anaerobic digestion of microalgae as a necessary step to make microalgal biodiesel sustainable. Biotechnol. Adv. 2011, 29, 164–167. [Google Scholar] [CrossRef] [PubMed] [Green Version]
  57. Symons, G.E.; Buswell, A.M. The methane fermentation of carbohydrates. J. Am. Chem. Soc. 1933, 55, 2028–2036. [Google Scholar] [CrossRef]
  58. Buswell, A.M.; Mueller, H.F. Mechanism of methane fermentation. Ind. Eng. Chem. 1952, 44, 550–552. [Google Scholar] [CrossRef]
  59. Tabassum, M.R.; Xia, A.; Murphy, J.D. Comparison of pre-treatments to reduce salinity and enhance biomethane yields of Laminaria digitata harvested in different seasons. Energy 2017, 140, 546–551. [Google Scholar] [CrossRef]
  60. Maneein, S.; Milledge, J.J.; Nielsen, B.V.; Harvey, P.J. A review of seaweed pre-treatment methods for enhanced biofuel production by anaerobic digestion or fermentation. Fermentation 2018, 4, 100. [Google Scholar] [CrossRef] [Green Version]
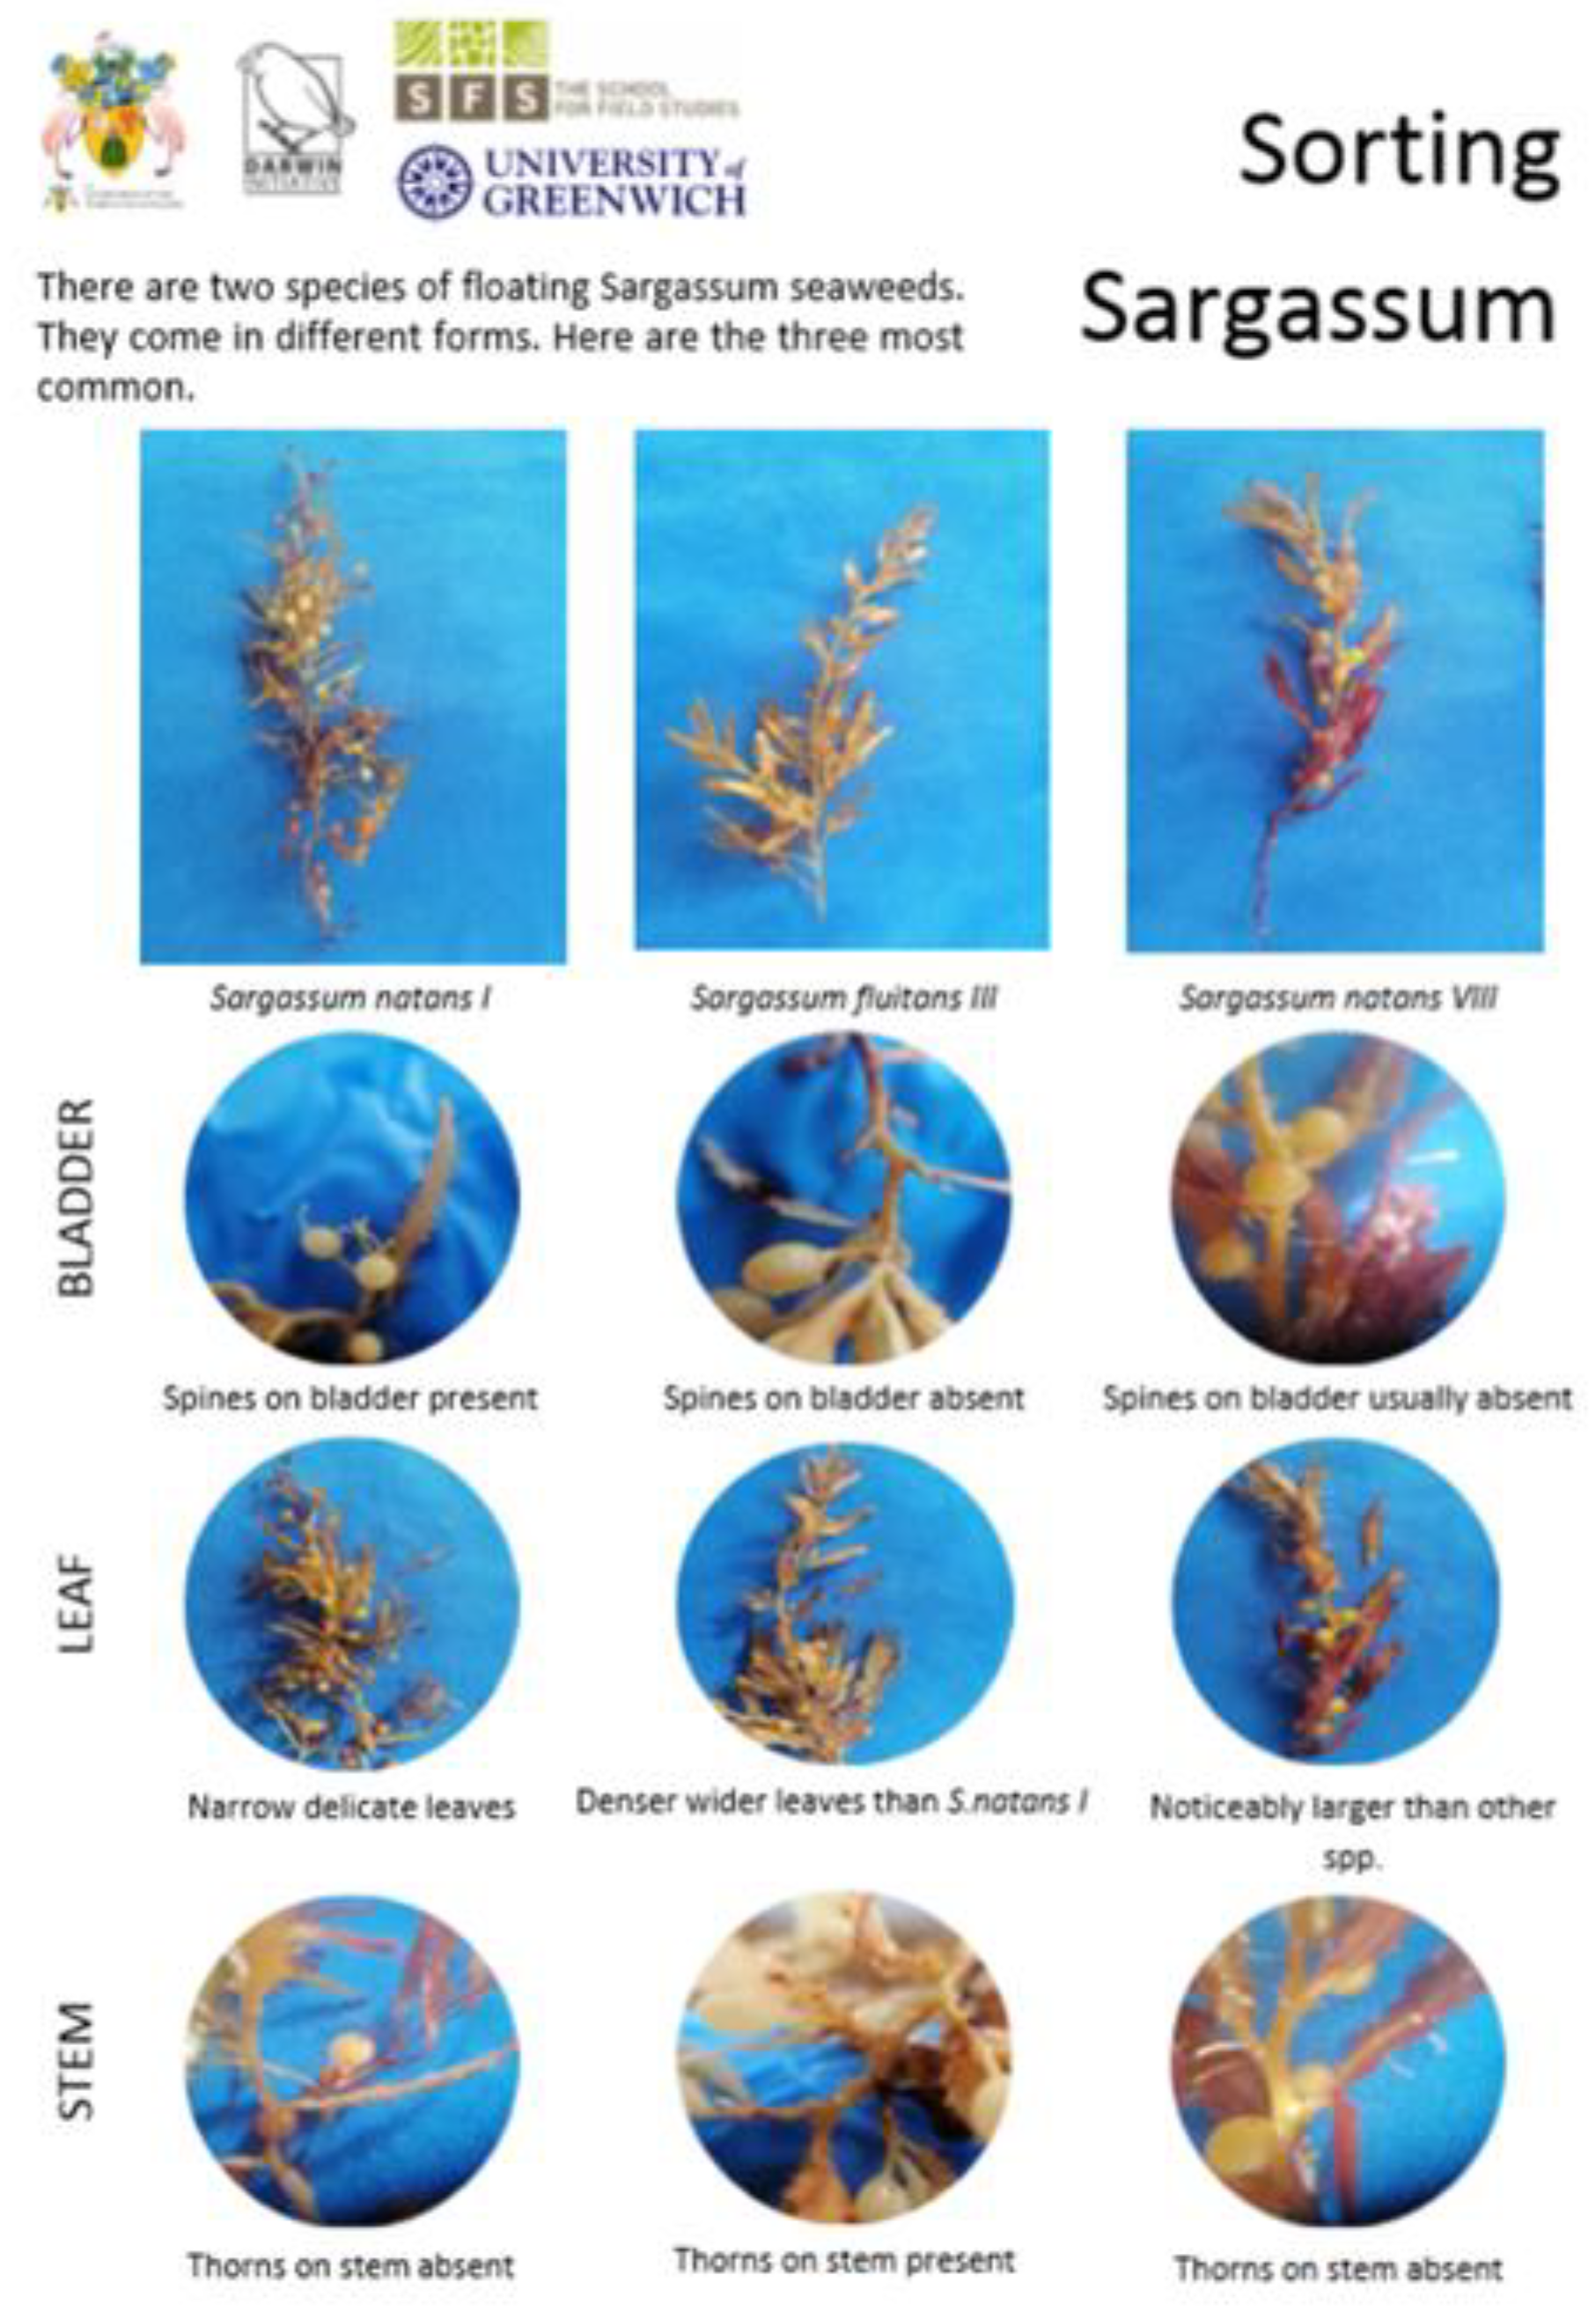
  61. Myers, S. Distribution and Composition of Sargassum Spp. Washed Ashore in the Turks and Caicos Islands MSc; University of Greenwich: London, UK, 2019. [Google Scholar]
  62. Schell, J.M.; Goodwin, D.S.; Siuda, A.N.S. Recent sargassum inundation events in the caribbean shipboard observations reveal dominance of a previously rare form. Oceanography 2015, 28, 8–10. [Google Scholar] [CrossRef] [Green Version]
  63. Sahena, F.; Zaidul, I.S.M.; Jinap, S.; Saari, N.; Jahurul, H.A.; Abbas, K.A.; Norulaini, N.A. Pufas in fish: Extraction, fractionation, importance in health. Compr. Rev. Food Sci. Food Saf. 2009, 8, 59–74. [Google Scholar] [CrossRef]
  64. Tiwari, B.; Troy, D. (Eds.) Seaweed Sustainability: Food and Non-Food Applications, 1st ed.; Academic Press: Amsterdam, The Netherlands, 2015. [Google Scholar]
  65. Pereira, L. A review of the nutrient composition of selected edible seaweeds. In Seaweed; Pomin, V.H., Ed.; Nova Science Publishers: Hauppauge, NY, USA, 2011. [Google Scholar]
  66. Kraan, S. Mass-cultivation of carbohydrate rich macroalgae, a possible solution for sustainable biofuel production. Mitig. Adapt. Strateg. Glob. Chang. 2013, 18, 27–46. [Google Scholar] [CrossRef]
  67. Critchley, A.T.; Devisscher, P.R.M.; Nienhuis, P.H. Canopy characteristics of the brown alga Sargassum-muticum (fucales, phaeophyta) in lake grevelingen, southwest Netherlands. Hydrobiologia 1990, 204, 211–217. [Google Scholar] [CrossRef]
  68. Milledge, J.J.; Nielsen, B.V.; Bailey, D. High-value products from macroalgae: The potential uses of the invasive brown seaweed, Sargassum muticum. Rev. Environ. Sci. Biotechnol. 2015, 15, 67–88. [Google Scholar] [CrossRef]
  69. Beacham, T.A.; Cole, I.S.; DeDross, L.S.; Raikova, S.; Chuck, C.J.; Macdonald, J.; Herrera, L.; Ali, T.; Airs, R.L.; Landels, A.; et al. Analysis of seaweeds from south west england as a biorefinery feedstock. Appl. Sci. 2019, 9, 4456. [Google Scholar] [CrossRef] [Green Version]
  70. Oyesiku, O.O.; Egunyomi, A. Identification and chemical studies of pelagic masses of Sargassum natans (Linnaeus) Gaillon and S. fluitans (Borgessen) Borgesen (brown algae), found offshore in Ondo State, Nigeria. Afr. J. Biotechnol. 2014, 13, 1188–1193. [Google Scholar] [CrossRef] [Green Version]
  71. Wang, S.; Wang, Q.; Jiang, X.M.; Han, X.X.; Ji, H.S. Compositional analysis of bio-oil derived from pyrolysis of seaweed. Energy Conv. Manag. 2013, 68, 273–280. [Google Scholar] [CrossRef]
  72. Shekhar, S.H.S.; Lyons, G.; McRoberts, C.; McCall, D.; Carmichael, E.; Andrews, F.; McCormack, R. Brown seaweed species from strangford lough: Compositional analyses of seaweed species and biostimulant formulations by rapid instrumental methods. J. Appl. Phycol. 2012, 24, 1141–1157. [Google Scholar] [CrossRef]
  73. Gorham, J.; Lewey, S.A. Seasonal changes in the chemical composition of Sargassum muticum. Mar. Biol. 1984, 80, 103–107. [Google Scholar] [CrossRef]
  74. Tabassum, M.R.; Xia, A.; Murphy, J.D. Seasonal variation of chemical composition and biomethane production from the brown seaweed Ascophyllum nodosum. Bioresour. Technol. 2016, 216, 219–226. [Google Scholar] [CrossRef]
  75. Jury, M.R. Turks and Caicos Islands Climate and Its Impacts. Earth Interact. 2013, 17, 1–20. [Google Scholar] [CrossRef]
  76. Sezey, M.; Adun, P. Validation of mohr’s titration method to determine salt in olive and olive brine. JOTCSA 2019, 6, 329–334. [Google Scholar] [CrossRef]
  77. Addico, G.N.D.; deGraft-Johnson, K. Preliminary investigation into the chemical composition of the invasive brown seaweed sargassum along the west coast of ghana. Afr. J. Biotechnol. 2016, 15, 2184–2191. [Google Scholar] [CrossRef] [Green Version]
  78. Sivakumar, S.R.; Arunkumar, K. Sodium, potassium and sulphate composition in some seaweeds occurring along the coast of gulf of mannar, India. Asian J. Plant Sci. 2009, 8, 500–504. [Google Scholar] [CrossRef]
  79. McHugh, D.J. A Guide to the Seaweed Industry; FAO: Rome, Italy, 2003. [Google Scholar]
  80. Philippsen, A. Energy Input, Carbon Intensity, and Cost for Ethanol Produced from Brown Seaweed; University of Victoria: Victoria, BC, Canada, 2013. [Google Scholar]
  81. Williams, A.; Feagin, R. Sargassum as a natural solution to enhance dune plant growth. Environ. Manag. 2010, 46, 738–747. [Google Scholar] [CrossRef] [PubMed]
  82. Venugopal, V.; Gopakumar, K. Shellfish: Nutritive value, health benefits, and consumer safety. Compr. Rev. Food Sci. Food Saf. 2017, 16, 1219–1242. [Google Scholar] [CrossRef] [Green Version]
  83. Immaculate, J.K.; Lilly, T.T.; Jamila, P. Macro and micro nutrients of seagrass species from gulf of mannar, India. MOJ Food Process Technol. 2018, 6, 391–398. [Google Scholar] [CrossRef]
  84. Chen, Q.; Pan, X.-D.; Huang, B.-F.; Han, J.-L. Distribution of metals and metalloids in dried seaweeds and health risk to population in southeastern China. Sci. Rep. 2018, 8, 3578. [Google Scholar] [CrossRef] [Green Version]
  85. Cherry, P.; O’Hara, C.; Magee, P.J.; McSorley, E.M.; Allsopp, P.J. Risks and benefits of consuming edible seaweeds. Nutr. Rev. 2019, 77, 307–329. [Google Scholar] [CrossRef] [Green Version]
  86. Azzazy, M.F.; Ayyad, M.S.; Nofal, A.M.; Abdelsalam, I.Z.; Abousekken, M.S.; Tammam, O.A.S. Ecological and phytochemical studies on brown algae sargassum muticum from marsa alam at red sea coast, egypt. Alex. Sci. Exch. J. 2019, 40, 743–753. [Google Scholar] [CrossRef] [Green Version]
  87. Yokoi, K.; Konomi, A. Toxicity of so-called edible hijiki seaweed (Sargassum fusiforme) containing inorganic arsenic. Regul. Toxicol. Pharmacol. 2012, 63, 291–297. [Google Scholar] [CrossRef]
  88. Rose, M.; Lewis, J.; Langford, N.; Baxter, M.; Origgi, S.; Barber, M.; MacBain, H.; Thomas, K. Arsenic in seaweed—Forms, concentration and dietary exposure. Food Chem. Toxicol. 2007, 45, 1263–1267. [Google Scholar] [CrossRef]
  89. Nachman, K.E.; Ginsberg, G.L.; Miller, M.D.; Murray, C.J.; Nigra, A.E.; Pendergrast, C.B. Mitigating dietary arsenic exposure: Current status in the United States and recommendations for an improved path forward. Sci.Total Environ. 2017, 581–582, 221–236. [Google Scholar] [CrossRef]
  90. Commission, E. Amending Regulation (EC) No 1881/2006 as Regards Maximum Levels of Inorganic Arsenic in foodstuffs; EU, Ed.; Official Journal of the European Union: Brussels, Belgium, 2015. [Google Scholar]
  91. Roleda, M.Y.; Marfaing, H.; Desnica, N.; Jónsdóttir, R.; Skjermo, J.; Rebours, C.; Nitschke, U. Variations in polyphenol and heavy metal contents of wild-harvested and cultivated seaweed bulk biomass: Health risk assessment and implication for food applications. Food Control 2019, 95, 121–134. [Google Scholar] [CrossRef]
  92. Adamse, P.; Van der Fels-Klerx, H.J.I.; de Jong, J. Cadmium, lead, mercury and arsenic in animal feed and feed materials—Trend analysis of monitoring results. Food Addit. Contam. Part A 2017, 34, 1298–1311. [Google Scholar] [CrossRef] [PubMed]
  93. Nicholson, F.A.; Smith, S.R.; Alloway, B.J.; Carlton-Smith, C.; Chambers, B.J. An inventory of heavy metals inputs to agricultural soils in England and Wales. Sci. Total Environ. 2003, 311, 205–219. [Google Scholar] [CrossRef]
  94. Tarvainen, T.; Albanese, S.; Birke, M.; Poňavič, M.; Reimann, C. Arsenic in agricultural and grazing land soils of Europe. Appl. Geochem. 2013, 28, 2–10. [Google Scholar] [CrossRef]
  95. Centre for Process Innovation (CPI). The SeaGas Project. Available online: http://seagas.co.uk/ (accessed on 7 July 2016).
  96. Da Silva, E.B.; Mussoline, W.A.; Wilkie, A.C.; Ma, L.Q. Anaerobic digestion to reduce biomass and remove arsenic from as-hyperaccumulator Pteris vittata. Environ. Pollut. 2019, 250, 23–28. [Google Scholar] [CrossRef] [PubMed]
  97. Taylor, V.F.; Li, Z.; Sayarath, V.; Palys, T.J.; Morse, K.R.; Scholz-Bright, R.A.; Karagas, M.R. Distinct arsenic metabolites following seaweed consumption in humans. Sci. Rep. 2017, 7, 3920. [Google Scholar] [CrossRef] [PubMed]
  98. Tejada-Tejada, P.; Rodriguez-Rodriguez, Y.; Rodriguez, L.E.; Perdomo, O.P.; Boluda, C.J. Quantification of heavy metals in Sargassum natans and Sargassum fluitans arrived to the coasts of dominican republic during 2019. In Proceedings of the Caribbean Science and Innovation Meeting 2019, Pointe-à-Pitre (Guadeloupe), France, 21 October 2019. [Google Scholar]
  99. Dai, J.; Mumper, R.J. Plant phenolics: Extraction, analysis and their antioxidant and anticancer properties. Molecules 2010, 15, 7313–7352. [Google Scholar] [CrossRef]
  100. Tanniou, A.; Esteban, S.L.; Vandanjon, L.; Ibanez, E.; Mendiola, J.A.; Cerantola, S.; Kervarec, N.; La Barre, S.; Marchal, L.; Stiger-Pouvreau, V. Green improved processes to extract bioactive phenolic compounds from brown macroalgae using Sargassum muticum as model. Talanta 2013, 104, 44–52. [Google Scholar] [CrossRef]
  101. Swanson, A.K.; Druehl, L.D. Induction, exudation and the UV protective role of kelp phlorotannins. Aquat. Bot. 2002, 73, 241–253. [Google Scholar] [CrossRef]
  102. Le Lann, K.; Jegou, C.; Stiger-Pouvreau, V. Effect of different conditioning treatments on total phenolic content and antioxidant activities in two Sargassacean species: Comparison of the frondose Sargassum muticum (Yendo) fensholt and the cylindrical bifurcaria bifurcata R. Ross. Phycol. Res. 2008, 56, 238–245. [Google Scholar] [CrossRef]
  103. Koivikko, R.; Loponen, J.; Honkanen, T.; Jormalainen, V. Contents of soluble, cell-wall-bound and exuded phlorotannins in the brown alga Fucus vesiculosus, with implications on their ecological functions. J. Chem. Ecol. 2005, 31, 195–212. [Google Scholar] [CrossRef] [PubMed] [Green Version]
  104. Powers, L.C.; Hertkorn, N.; McDonald, N.; Schmitt-Kopplin, P.; Del Vecchio, R.; Blough, N.V.; Gonsior, M. Sargassum sp. act as a large regional source of marine dissolved organic carbon and polyphenols. Glob. Biogeochem. Cycles 2019, 33, 1423–1439. [Google Scholar] [CrossRef] [Green Version]
  105. Connan, S.; Delisle, F.; Deslandes, E.; Gall, E.A. Intra-thallus phlorotannin content and antioxidant activity in Phaeophyceae of temperate waters. Bot. Mar. 2006, 49, 39–46. [Google Scholar] [CrossRef]
  106. Tanniou, A.; Vandanjon, L.; Incera, M.; Leon, E.S.; Husa, V.; Le Grand, J.; Nicolas, J.L.; Poupart, N.; Kervarec, N.; Engelen, A.; et al. Assessment of the spatial variability of phenolic contents and associated bioactivities in the invasive alga Sargassum muticum sampled along its European range from Norway to Portugal. J. Appl. Phycol. 2014, 26, 1215–1230. [Google Scholar] [CrossRef] [Green Version]
  107. Lapointe, B.E.; West, L.E.; Sutton, T.T.; Hu, C. Ryther revisited: Nutrient excretions by fishes enhance productivity of pelagic Sargassum in the western North Atlantic Ocean. J. Exp. Mar. Biol. Ecol. 2014, 458, 46–56. [Google Scholar] [CrossRef]
  108. Mæhre, H.K.; Dalheim, L.; Edvinsen, G.K.; Elvevoll, E.O.; Jensen, I.-J. Protein determination—Method matters. Foods 2018, 7, 5. [Google Scholar] [CrossRef] [Green Version]
  109. Angell, A.R.; Mata, L.; Nys, R.; Paul, N.A. The protein content of seaweeds: A universal nitrogen-to-protein conversion factor of five. J. Appl. Phycol. 2015, 28, 511–524. [Google Scholar] [CrossRef]
  110. González López, C.V.; Garcia, M.D.C.; Fernandez, F.G.A.; Bustos, C.S.; Chisti, Y.; Sevilla, J.M.F. Protein measurements of microalgal and cyanobacterial biomass. Bioresour. Technol. 2010, 101, 7587–7591. [Google Scholar] [CrossRef]
  111. Safi, C.; Charton, M.; Pignolet, O.; Pontalier, P.-Y.; Vaca-Garcia, C. Evaluation of the protein quality of Porphyridium cruentum. J. Appl. Phycol. 2013, 25, 497–501. [Google Scholar] [CrossRef] [Green Version]
  112. WHO/FAO/UNU. Protein and Amino Acid Requirements in Human Nutrition—Report of a Joint WHO/FAO/UNU Expert Consultation; WHO: Geneva, Switzerland, 2007. [Google Scholar]
  113. Streefland, M. Algae and Aquatic Biomass for a Sustainable Production of 2nd Generation Biofuels—Deliverable 1.5—Report on Biofuel Production Processes from Micro, Macroalgae and Other Aquatic Biomass; AquaFUELs: Brussels, Belgium, 2010. [Google Scholar]
  114. Lenstra, W.J.; Hal, J.W.v.; Reith, J.H. Economic aspects of open ocean seaweed cultivation. In Proceedings of the Alg’n Chem 2011, Montpellier, France, 7–10 November 2011. [Google Scholar]
  115. Van Ginneken, V.J.T.; Helsper, J.; de Visser, W.; van Keulen, H.; Brandenburg, W.A. Polyunsaturated fatty acids in various macroalgal species from north Atlantic and tropical seas. Lipids Health Dis. 2011, 10, 8. [Google Scholar] [CrossRef] [Green Version]
  116. Kumari, P.; Bijo, A.J.; Mantri, V.A.; Reddy, C.R.K.; Jha, B. Fatty acid profiling of tropical marine macroalgae: An analysis from chemotaxonomic and nutritional perspectives. Phytochemistry 2013, 86, 44–56. [Google Scholar] [CrossRef] [PubMed]
  117. Bazes, A.; Silkina, A.; Douzenel, P.; Fay, F.; Kervarec, N.; Morin, D.; Berge, J.-P.; Bourgougnon, N. Investigation of the antifouling constituents from the brown alga Sargassum muticum (Yendo) Fensholt. J. Appl. Phycol. 2009, 21, 395–403. [Google Scholar] [CrossRef] [Green Version]
  118. Plouguerne, E.; Ioannou, E.; Georgantea, P.; Vagias, C.; Roussis, V.; Hellio, C.; Kraffe, E.; Stiger-Pouvreau, V. Anti-microfouling activity of lipidic metabolites from the invasive brown alga sargassum muticum (yendo) fensholt. Mar. Biotechnol. 2010, 12, 52–61. [Google Scholar] [CrossRef] [PubMed]
  119. Turner, J.P.; Rooker, J.R. Fatty acid composition of flora and fauna associated with sargassum mats in the gulf of Mexico. Mar. Biol. 2006, 149, 1025–1036. [Google Scholar] [CrossRef]
  120. Milledge, J.J. Commercial application of microalgae other than as biofuels: A brief review. Rev. Environ. Sci. Biotechnol. 2011, 10, 31–41. [Google Scholar] [CrossRef]
  121. Øverland, M.; Mydland, L.T.; Skrede, A. Marine macroalgae as sources of protein and bioactive compounds in feed for monogastric animals. J. Sci. Food Agric. 2019, 99, 13–24. [Google Scholar] [CrossRef] [Green Version]
  122. Wells, M.L.; Potin, P.; Craigie, J.S.; Raven, J.A.; Merchant, S.S.; Helliwell, K.E.; Smith, A.G.; Camire, M.E.; Brawley, S.H. Algae as nutritional and functional food sources: Revisiting our understanding. J. Appl. Phycol. 2017, 29, 949–982. [Google Scholar] [CrossRef]
  123. Anastasakis, K.; Ross, A.B. Hydrothermal liquefaction of the brown macro-alga Laminaria Saccharina: Effect of reaction conditions on product distribution and composition. Bioresour. Technol. 2011, 102, 4876–4883. [Google Scholar] [CrossRef]
  124. Ross, A.B.; Jones, J.M.; Kubacki, M.L.; Bridgeman, T. Classification of macroalgae as fuel and its thermochemical behaviour. Bioresour. Technol. 2008, 99, 6494–6504. [Google Scholar] [CrossRef]
  125. Zhou, D.; Zhang, L.; Zhang, S.; Fu, H.; Chen, J. Hydrothermal liquefaction of macroalgae Enteromorpha prolifera to bio-oil. Energy Fuels 2010, 24, 4054–4061. [Google Scholar] [CrossRef]
  126. Vargas-Moreno, J.M.; Callejón-Ferre, A.J.; Pérez-Alonso, J.; Velázquez-Martí, B. A review of the mathematical models for predicting the heating value of biomass materials. Renew. Sustain. Energy Rev. 2012, 16, 3065–3083. [Google Scholar] [CrossRef]
  127. Barreiro-Vescovo, S.; de Godos, I.; Tomás-Pejó, E.; Ballesteros, M.; González-Fernández, C. Effect of microalgae storage conditions on methane yields. Environ. Sci. Pollut. Res. 2018, 25, 14263–14270. [Google Scholar] [CrossRef] [PubMed]
  128. Purcell, P.J.; O’Brien, M.; Boland, T.M.; O’Kiely, P. In vitro rumen methane output of perennial ryegrass samples prepared by freeze drying or thermal drying (40 °C). Anim. Feed Sci. Technol. 2011, 166–167, 175–182. [Google Scholar] [CrossRef]
  129. Adams, J.M.M.; Schmidt, A.; Gallagher, J.A. The impact of sample preparation of the macroalgae Laminaria digitata on the production of the biofuels bioethanol and biomethane. J. Appl. Phycol. 2015, 27, 985–991. [Google Scholar] [CrossRef] [Green Version]
  130. Milledge, J.J.; Nielsen, B.V.; Harvey, P.J. The inhibition of anaerobic digestion by model phenolic compounds representative of those from Sargassum muticum. J. Appl. Phycol. 2018, 31, 779–786. [Google Scholar] [CrossRef]
  131. Østgaard, K.; Indergaard, M.; Markussen, S.; Knutsen, S.H.; Jensen, A. Carbohydrate degradation and methane production during fermentation ofLaminaria saccharina (Laminariales, Phaeophyceae). J. Appl. Phycol. 1993, 5, 333–342. [Google Scholar] [CrossRef]
  132. Adams, J.M.M.; Ross, A.B.; Anastasakis, K.; Hodgson, E.M.; Gallagher, J.A.; Jones, J.M.; Donnison, I.S. Seasonal variation in the chemical composition of the bioenergy feedstock Laminaria digitata for thermochemical conversion. Bioresour. Technol. 2011, 102, 226–234. [Google Scholar] [CrossRef]
  133. Buffiere, P.; Loisel, D.; Bernet, N.; Delgenes, J.-P. Towards new indicators for the prediction of solid waste anaerobic digestion properties. Water Sci. Technol. 2006, 53, 233–241. [Google Scholar] [CrossRef] [Green Version]
  134. McKennedy, J.; Sherlock, O. Anaerobic digestion of marine macroalgae: A review. Renew. Sustain. Energy Rev. 2015, 52, 1781–1790. [Google Scholar] [CrossRef]
  135. Mao, C.; Feng, Y.; Wang, X.; Ren, G. Review on research achievements of biogas from anaerobic digestion. Renew. Sustain. Energy Rev. 2015, 45, 540–555. [Google Scholar] [CrossRef]
  136. Milledge, J.J.; Harvey, P.J. Anaerobic digestion and gasification of seaweed. In Grand Challenges in Marine Biotechnology; Rampelotto, P.H., Trincone, A., Eds.; Spinger: Cham, Switzerland, 2018. [Google Scholar] [CrossRef]
  137. Persson, S.P.E.; Bartlett, H.D.; Branding, A.E.; Regan, R.W. Agricultural Anaerobic Digesters; Pennsylvania State University: State College, PA, USA, 1979. [Google Scholar]
  138. Peu, P.; Picard, S.; Diara, A.; Girault, R.; Béline, F.; Bridoux, G.; Dabert, P. Prediction of hydrogen sulphide production during anaerobic digestion of organic substrates. Bioresour. Technol. 2012, 121, 419–424. [Google Scholar] [CrossRef] [PubMed]
  139. Puyuelo, B.; Ponsá, S.; Gea, T.; Sánchez, A. Determining C/N ratios for typical organic wastes using biodegradable fractions. Chemosphere 2011, 85, 653–659. [Google Scholar] [CrossRef] [PubMed] [Green Version]
  140. Wang, X.; Lu, X.; Li, F.; Yang, G. Effects of Temperature and Carbon-Nitrogen (C/N) Ratio on the Performance of Anaerobic Co-Digestion of Dairy Manure, Chicken Manure and Rice Straw: Focusing on Ammonia Inhibition. PLoS ONE 2014, 9, e97265. [Google Scholar] [CrossRef] [PubMed] [Green Version]
  141. D’Este, M.; Angelidaki, I.; Alvarado-Morales, M. Algal Biomass for Bioenergy and Bioproducts Production in Biorefinery Concepts; Department of Environmental Engineering, Technical University of Denmark (DTU): Lyngby, Denmark, 2017. [Google Scholar]
  142. Chynoweth, D.P.; Ghosh, S.; Klass, D.L. Anaerobic digestion of kelp. In Biomass Conversion Processes for Energy and Fuels; Sofer, S.S., Zaborsky, O.R., Eds.; Springer USA: Boston, MA, USA, 1981; pp. 315–338. [Google Scholar] [CrossRef]
  143. Chynoweth, D.P. Review of Biomethane from Marine Biomass; Department of Agricultural and Biological Engineering, University of Florida: Gainesville, FL, USA, 2002. [Google Scholar]
  144. Ometto, F.; Steinhovden, K.B.; Kuci, H.; Lunnbäck, J.; Berg, A.; Karlsson, A.; Handå, A.; Wollan, H.; Ejlertsson, J. Seasonal variation of elements composition and biomethane in brown macroalgae. Biomass Bioenergy 2018, 109, 31–38. [Google Scholar] [CrossRef]
  145. Shakeri Yekta, S.; Svensson, B.H.; Björn, A.; Skyllberg, U. Thermodynamic modeling of iron and trace metal solubility and speciation under sulfidic and ferruginous conditions in full scale continuous stirred tank biogas reactors. Appl. Geochem. 2014, 47, 61–73. [Google Scholar] [CrossRef]
  146. Sierra-Alvarez, R.; Cortinas, I.; Yenal, U.; Field, J.A. Methanogenic inhibition by arsenic compounds. Appl. Environ. Microbiol. 2004, 70, 5688–5691. [Google Scholar] [CrossRef] [Green Version]
  147. Rodriguez-Freire, L.; Moore, S.E.; Sierra-Alvarez, R.; Field, J.A. Adaptation of a Methanogenic Consortium to Arsenite Inhibition. Water Air Soil Pollut. 2015, 226, 414. [Google Scholar] [CrossRef] [Green Version]
  148. Molina-Alcaide, E.; Carro, M.D.; Roleda, M.Y.; Weisbjerg, M.R.; Lind, V.; Novoa-Garrido, M. In vitro ruminal fermentation and methane production of different seaweed species. Anim. Feed Sci. Technol. 2017, 228, 1–12. [Google Scholar] [CrossRef] [Green Version]
  149. Tabassum, M.R.; Xia, A.; Murphy, J.D. The effect of seasonal variation on biomethane production from seaweed and on application as a gaseous transport biofuel. Bioresour. Technol. 2016, 209, 213–219. [Google Scholar] [CrossRef] [PubMed]
  150. Hierholtzer, A.; Chatellard, L.; Kierans, M.; Akunna, J.C.; Collier, P.J. The impact and mode of action of phenolic compounds extracted from brown seaweed on mixed anaerobic microbial cultures. J. Appl. Microbiol. 2013, 114, 964–973. [Google Scholar] [CrossRef]
  151. Pérez, M.J.; Falqué, E.; Domínguez, H. Antimicrobial action of compounds from marine seaweed. Mar. Drugs 2016, 14, 52. [Google Scholar] [CrossRef] [PubMed] [Green Version]
  152. Ward, A.J.; Lewis, D.M.; Green, B. Anaerobic digestion of algae biomass: A review. Algal Res. Biomass Biofuels Bioprod. 2014, 5, 204–214. [Google Scholar] [CrossRef]
  153. Wang, Y.; Xu, Z.; Bach, S.J.; McAllister, T.A. Effects of phlorotannins from Ascophyllum nodosum (brown seaweed) on in vitro ruminal digestion of mixed forage or barley grain. Anim. Feed Sci. Technol. 2008, 145, 375–395. [Google Scholar] [CrossRef]
  154. Monlau, F.; Sambusiti, C.; Barakat, A.; Quéméneur, M.; Trably, E.; Steyer, J.P.; Carrère, H. Do furanic and phenolic compounds of lignocellulosic and algae biomass hydrolyzate inhibit anaerobic mixed cultures? A comprehensive review. Biotechnol. Adv. 2014, 32, 934–951. [Google Scholar] [CrossRef] [PubMed]
Figure 1. Sample Identification sheet used to identify and separate the three dominant species of Sargassum (S. natans VIII (B), S. natans I (C) and S. fluitans (D)).
Energies 13 01523 g001
Figure 2. CJC biomethane potential system (courtesy CJC labs).
Energies 13 01523 g002
Figure 3. Calculated HHV based on the protein, lipid and carbohydrate (including fibre) content [56] and average measured data.
Energies 13 01523 g003
Figure 4. Net mean methane production from fresh and freeze-dried ‘Mixed Sargassum’ inundation samples from Turks and Caicos (n = 4, error bars are standard deviation).
Energies 13 01523 g004
Figure 5. Net mean methane production from the three pelagic Sargassum species samples from Turks and Caicos (n = 4, error bars are standard deviation).
Energies 13 01523 g005
Figure 6. The plot of the predicted yield of methane for the combined S. natans VIII, S. natans I and S. fluitans (based on the previous experimental results for each species) and the actual methane yield.
Energies 13 01523 g006
Table 1. The moisture, ash Total Solids (TS) and Volatile Solids (VS) of Sargassum inundation (“Mixed Sargassum”) and pelagic species of Sargassum from Turks and Caicos. Differences in colour within a column indicate statistically significant differences between samples (p < 0.05) (n = 3). ar = as received; dw = dry weight and ww = wet weight.
Moisture % arAsh % dwTS %VS %
AveAve
Mixed ‘Sargassum’81.98 ± 0.8946.94 ± 1.3118.009.56
S. natans VIII86.45 ± 0.1034.26 ± 0.5913.508.91
S. natans I87.41 ± 0.2335.71 ± 1.2712.608.10
S. fluitans86.32 ± 0.0233.63 ± 4.1413.709.08
Table 2. The salt (NaCl) content of Sargassum inundation (‘Mixed Sargassum’) and pelagic species of Sargassum from Turks and Caicos. Differences in colour within a column indicate statistically significant differences between samples (p < 0.05) (n = 3).
Salt % ashSalt % dwSalt % ww
Ave
Mixed ‘Sargassum’32.30 ± 5.0915.22.7
S. natans VIII56.87 ± 1.5519.52.6
S. natans I64.60 ± 2.8023.12.9
S. fluitans57.00 ± 0.0019.22.6
Table 3. Results of the X-ray diffraction (XRD) analysis of Sargassum inundation (‘Mixed Sargassum’) and pelagic species of Sargassum from Turks and Caicos (n = 1).
CaCO₃KClNaClMgOK3Na (SO4)2CaSO4Na2SO4
% in Ash
Mixed ‘Sargassum’42.0723.9319.034.883.764.981.36
S. natans VIII17.999.4357.027.041.385.671.27
S natans I11.680.2671.588.260.283.393.15
S fluitans11.680.2671.598.268.267.690.24
Table 4. The mean results of the CHNS analysis of Sargassum inundation (‘Mixed Sargassum’) and pelagic species of Sargassum from Turks and Caicos (n = 2).
AshCHNSOElemental Ratios
% Dry Weight C:NC:O
Mixed ‘Sargassum’46.9427.413.131.710.2120.6216.081.33
S. natans VIII34.2629.233.681.680.4030.7617.400.95
S. natans I35.7128.343.631.280.0531.0022.140.91
S. fluitans33.6329.233.781.570.0031.79%18.620.92
Table 5. The results of the heavy metal analysis of Sargassum inundation (‘Mixed Sargassum’) and pelagic species of Sargassum from Turks and Caicos (n = 1) (ND = not detected)
Mixed ‘Sargassum’S. Natans VIIIS. Natans IS. Fluitans
Aluminiummg kg−1 dw37.516.2121.4828.09
Arsenicmg kg−1 dw123.6920.9429.7626.25
Cadmiummg kg−1 dw0.130.090.120.12
Calciummg kg−1 dw70,305.7726,019.6928,879.2633,196.4
Chromiummg kg−1 dw<0.30.36ND0.43
Coppermg kg−1 dw2.511.252.712.91
Ironmg kg−1 dw3811.3781.58998.56262.02
Leadmg kg−1 dw0.260.480.280.37
Magnesiummg kg−1 dw12,053.1915,092.5916,546.7116,320.64
Manganesemg kg−1 dw30.15<3<3<3
Mercurymg kg−1 dw0.01ND0.010.01
Phosphorusmg kg−1 dw500.65138.3222.15214.28
Potassiummg kg−1 dw69,359.397442.5712,509.167771.73
Zincmg kg−1 dw5.8126.4930.8835.64
Table 6. The total phenolic content results expressed in mg phloroglucinol equivalent (PG eq) per gram of dry matter (n ≥ 3) and per gram of VS. differences in colour within a column indicate statistically significant differences between samples (p < 0.05).
Phenols (PG eq)
mg g−1 dwmg g−1 VS.
AveAve
Mixed ‘Sargassum’29.5 ± 0.555.5
S. natans VIII2.5 ± 0.23.8
S. natans I6.6 ± 0.410.3
S. fluitans3.7 ± 0.25.6
Table 7. Percentage of amino acids (AAs) in dry samples of Sargassum inundation (‘Mixed Sargassum’) and pelagic species of Sargassum from Turks and Caicos (n = 1).
Mixed ‘Sargassum’S. Natans VIIIS. Natans IS. Fluitans
Amino acid% dw
Alanine0.340.130.260.19
Arginine0.180.140.190.17
Aspartic acid0.470.340.480.42
Cystine0.090.110.090.09
Glutamic0.850.350.580.46
Glycine0.320.190.300.24
Histidine0.060.050.070.07
Iso-Leucine0.160.130.180.14
Leucine0.270.180.280.23
Lysine0.240.280.230.21
Methionine0.100.140.100.09
Phenylalanine0.180.140.190.17
Proline0.180.060.140.11
Serine0.220.190.220.20
Threonine0.190.180.210.19
Tryptophan0.040.050.040.04
Tyrosine0.010.000.010.00
Valine0.240.350.240.23
Total Amino acids4.162.993.813.25
Table 8. The fatty acid profile expressed as the percentage of Total Fatty Acids (TFA) of Sargassum inundation (‘Mixed Sargassum’) and pelagic species of Sargassum from Turks and Caicos (n = 1).
% of TFA
Mixed SargassumS. Natans VIIIS. Natans IS. Fluitans
C08:0 Caprylic<0.05<0.05<0.05<0.05
C10:0 Capric Acid<0.05<0.05<0.05<0.05
C11:0 Undecylic Acid<0.05<0.05<0.05<0.05
C12:0 Lauric Acid0.14<0.050.130.19
C13:0 Tridecylic Acid<0.05<0.05<0.05<0.05
C14:0 Myristic Acid2.012.001.562.13
C14:1 Myristoleic Acid0.43<0.050.15<0.05
C15:0 Pentadecanoic Acid0.460.250.320.36
C15:1 Pentadecenoic Acid0.39<0.05<0.050.37
C16:0 Palmitic Acid26.6840.7123.6124.12
C16:1 Palmitoleic Acid4.038.283.544.13
C17:0 Heptadecanoic Acid1.170.130.880.76
C17:1 Heptadecenoic Acid<0.050.190.63<0.05
C18:0 Stearic Acid4.730.854.184.32
C18:1 Oleic Acid12.7110.7113.3115.23
C18:2 Linoleic Acid5.327.906.926.02
C18:3 Linolenic Acid4.43.525.93.48
C18:4 Stearidonic Acid0.070.691.340.87
C20:0 Arachidic Acid0.470.390.550.62
C20:1 Gadoleic Acid0.180.76<0.05<0.05
C20:4 Arachidonic Acid7.7912.959.1410.24
C20:5 Eicosapentaenoic Acid3.75<0.052.771.49
C22:0 Behenic Acid0.631.280.830.75
C22:1 Erucic Acid1.59<0.051.562.11
C22:4 Adrenic Acid1.17<0.050.770.78
C22:5 Docosapentaenoic acid0.36<0.050.270.3
C22:6 Docosahexaenoic Acid6.44<0.055.665.91
C24:0 Lignoceric Acid0.42<0.050.350.44
Monounsaturated Fatty Acids19.3319.9419.1921.84
Polyunsaturated Fatty Acids29.325.0632.7729.09
Saturated Fatty Acids36.7145.6132.4133.69
Unidentified Fatty Acids14.669.3915.6315.38
Table 9. Lipid (n = 3), total fibre (n = 3), total amino acid (n = 1) and digestible carbohydrate expressed as a percentage of dry weight.
Lipid%Total % AAsTotal % FibreCarbohydrate%
Mixed ‘Sargassum’3.88 ± 1.094.1933.31 ± 0.9011.68
S. natans VIII3.58 ± 0.592.9937.41 ± 0.4321.76
S natans I4.51 ± 0.903.8137.00 ± 0.4218.97
S fluitans4.56 ± 0.903.2531.15 ± 0.3527.40
Table 10. The mean Higher Heating Values (HHVs) and standard deviation (n = 3) from the bomb calorimetry of Sargassum inundation (‘Mixed Sargassum’) and pelagic species of Sargassum from Turks and Caicos, together with calculated HHVs from CHNSO or protein, lipid and carbohydrate content (Heaven et al. [56]). Differences in colour within a column indicate statistically significant differences between samples (p < 0.05).
HHV (kJ kg−1)
MeasuredCalculated
Heaven et al. [56]CHNSO
Mixed ‘Sargassum’9.39 ± 0.279.810.7
S. natans VIII10.23 ± 0.0811.810.9
S. natans I10.15 ±0.0111.810.5
S. fluitans10.26 ±0.1111.910.8
Table 11. The theoretical MP from the ‘Buswell equation’ based on CHNSO and the method of Heaven et al. [56] based on the lipid, protein and carbohydrate content (both including and excluding fibre) together with actual MP and biodegradability index (BI).
Methane Potential mL CH4 g−1 VS
ActualTheoreticalBiodegradability Index
CHNSHeavenHeaven ex FibreCHNSHeavenHeaven ex Fibre
Mixed ‘Sargassum’−24.0496461195−5%−5%−12%
S. natans VIII145.139544920737%32%70%
S. natans I65.839246018717%14%35%
S. fluitans112.739246422129%24%51%
Table 12. ‘Indispensable amino acids’ as a percentage of total amino acids. Recommendation of the World Health Organisation (WHO) [112] for adults based on 0.66 g protein kg−1 day−1.
Percentage of Total Amino Acids
WHOMixedS. Natans VIIIS. Natans IS. Fluitans
RecommendationSargassum
Histidine 1.501.551.571.752.02
Isoleucine3.003.894.314.664.38
Leucine5.906.485.887.297.07
Lysine4.505.709.416.126.40
Methionine 1.602.334.712.622.69
Cystine0.602.073.532.332.69
Methionine + cysteine2.204.408.244.965.39
Phenylalanine + tyrosine3.004.664.715.256.40
Threonine2.304.665.885.545.72
Tryptophan0.401.041.571.171.35
Valine 3.905.7011.766.417.17

