Article

Charging and Discharge Currents in Low-Density Polyethylene and its Nanocomposite

by
Anh T. Hoang
1,2,*,
Yuriy V. Serdyuk
1,* and
Stanislaw M. Gubanski
1,*
1
Department of Electrical Engineering, Chalmers University of Technology, SE-41296 Gothenburg, Sweden
2
Currently with NKT HV Cables, SE-37123 Karlskrona, Sweden
*
Authors to whom correspondence should be addressed.
Energies 2020, 13(6), 1518; https://doi.org/10.3390/en13061518
Submission received: 29 February 2020 / Revised: 17 March 2020 / Accepted: 18 March 2020 / Published: 23 March 2020

Abstract

:
Charging and discharge currents measured in low-density polyethylene (LDPE) and LDPE/Al2O3 nanocomposite are analyzed. The experiments were conducted at temperatures of 40–80 °C utilizing a consecutive charging–discharging procedure, with the charging step at electric fields varying between 20 and 60 kV/mm. A quasi-steady state of the charging currents was earlier observed for the nanofilled specimens and it was attributed to the enhanced trapping process at polymer–nanofiller interfaces. An anomalous behavior of the discharge currents was found at elevated temperatures for both the studied materials and its occurrence at lower temperatures in the nanofilled LDPE was due to the presence of deeply trapped charges at polymer–nanofiller interfaces. The field dependence of the quasi-steady charging currents is examined by testing for different conduction mechanisms. It is shown that the space-charge-limited process is dominant and the average trap site separation is estimated at less than 2 nm for the pristine LDPE and it is at about 5–7 nm for the LDPE/Al2O3 nanocomposite. Also, location of the trapping sites in the band gap structure of the nanofilled material is altered, which substantially weakens electrical transport as compared to the unfilled counterpart.

Graphical Abstract

1. Introduction

Extruded high voltage direct current (HVDC) cables have become increasingly popular for interconnecting electric power grids and integrating renewable energy resources (e.g., offshore wind farms and concentrating solar power plants) into electric power systems. As compared to mass impregnated HVDC cables, the extruded ones offer various technological advantages, including higher transmission capability, compactness at the same power rating, lower weight, and lower environmental impact [1]. Today, extruded HVDC cables can operate at voltage levels up to 640 kV with the transmission capacity up to 3 GW [2]. The technology is based on the use of cross-linked polyethylene (XLPE) featured by its extremely low electrical conductivity. As a result, the risk of thermal runaway during cable operation is considerably reduced and this allows for noticeable increase of the operating electric field in cable insulation [2]. The ultra-low dc conductivity of XLPE can be achieved, for example, by further purifying the material or by doping nanometric filler particles into the polymer matrix. The implementation of the former approach may no longer be cost-effective and, therefore, the latter one evokes much interest.
Various polymer based nanocomposites provide interesting from practical point of view properties, like extremely low dc conductivity, considerably improved dielectric strength, partial discharge resistance, and stress endurance [3,4,5,6,7,8]. Various hypotheses have been proposed for explaining these observations. As regards electrical transport in polyethylene (PE), Lewis [9] pointed out that the presence of nanofillers in the amorphous phase of PE strongly hinders tunneling of electrons and holes. Consequently, charge carriers in nanofilled PE are less mobile than those in the unfilled material. This has in fact been underlined in experimental studies [4,5]. Takada et al. [10] interpreted the formation of induced dipoles at polymer–particle interfaces as deep trapping centers, which capture mobile charge carriers efficiently and form thin layers of homocharges in the vicinity of electrodes. As a result, electric field strength is mitigated at the dielectric–electrode interfaces, thus preventing injection of charges into material bulk. These proposed hypotheses are consistent with the results of experiments and simulations reported in recent publications [11,12].
Even though a large number of works has been conducted, there is still a lack of full understanding of the electrical conduction mechanism in PE nanocomposites and this topic is the primary focus of this study, where charging and discharge currents through nanofilled low-density polyethylene (LDPE) and its unfilled counterpart were measured at various temperatures and electric field strengths. The behavior of the recorded current transients was further examined and explained.

2. Materials and Methods

This investigation was conducted utilizing samples of LDPE loaded with Al2O3 nanofillers at 3 wt%, which showed in our previous study [11] most significant drop in their dc conductivity. The added Al2O3 nanofiller particles were of high purity and spherical in shape. For preparing the nanocomposite, nanoparticles were dispersed in heptane and the suspension was then added into previously grinded from pellets LDPE powder. The obtained mixture was dried in an oven to evaporate the solvent. Thereafter, the dry mixture was extruded at 150 °C and later on pressed at 130 °C for 20 min by applying 200 kN to form flat samples (65 × 65 mm2) of average thickness of 80 µm. Such a procedure resulted in an even distribution of the nanofiller particles in the polymer matrix. Unfilled pristine LDPE was also studied as a reference material, for which the same press molding program was used for sample preparation. In both cases, the degradation of LDPE was avoided by adding antioxidant Irganox 1076 at 0.02 wt%.
Charging and discharge currents were measured using a three-electrode system as described in [11]. During the charging stage, a dc voltage was applied to the sample from a power supply (Glassman, model FJ60R2). During the discharging stage, the power supply was cut-off and the sample was short-circuited. A current through the insulation bulk was measured every 2 s using Keithley 6517B electrometer. The electrode system was placed in an oven (Memmert, model UN55) for controlling temperature. Thermal stability of the samples was reached by keeping them in the oven for at least 2 h prior to each measurement.
For most of insulating polymers, the time dependence of charging and discharge currents obey power law:
i ( t ) = K t n ,
where K is a constant, t denotes time [s], and n is a power factor. Charging currents slowly decay and their steady state revealing the pure conduction process is in practice hardly achievable. Several authors discussed this metrological issue, particularly debating how long the charging duration should last for, but a consensus on a versatile test procedure is unlikely to be achieved [13]. In this context, the performed preliminary measurements showed that for unfilled LDPE a steady state of the charging currents was not reachable even after 48 h. For the LDPE/Al2O3 nanocomposite, on the other hand, the charging currents reached a quasi-steady state after a period of about 3 h. In addition, the discharging phase that was introduced between two consecutive charging periods when the applied electric field strength was raised had a positive impact. Without this discharging period, an early saturation of charging currents was achieved at higher electric fields. The effect could be attributed to accumulation of space charges in the insulation bulk during the earlier charging periods and it hindered further charge injection from electrodes. Thus, the introduction of the discharging phase prevented the appearance of memory effect and yielded similar shapes of charging current decay curves at different applied field strengths.
Based on these observations, the measurements were carried out at temperatures 40 °C, 60 °C, and 80 °C by using the charging–discharging procedure, with the charging time of 3 h and the discharging phase of at least 6 h. The applied electric field was varied between 20 and 60 kV/mm with an increment of 2.5 kV/mm. For the nanofilled material, only results obtained at 25–60 kV/mm are considered because of a high ratio of noise-to-signal magnitude at lower fields. It is worth mentioning that it is not uncommon that charging currents measured on different samples of the same material can be different and unavoidable uncertainties may arise due to slight variations in morphology, electrode–material interface, thickness inhomogeneity, etc. [14,15]. In this study, repeated measurements were conducted at each condition and typical and reproducible results were considered for further analyses.

3. Results

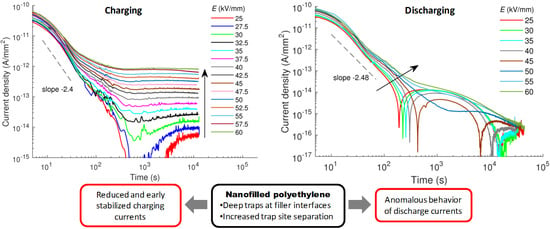
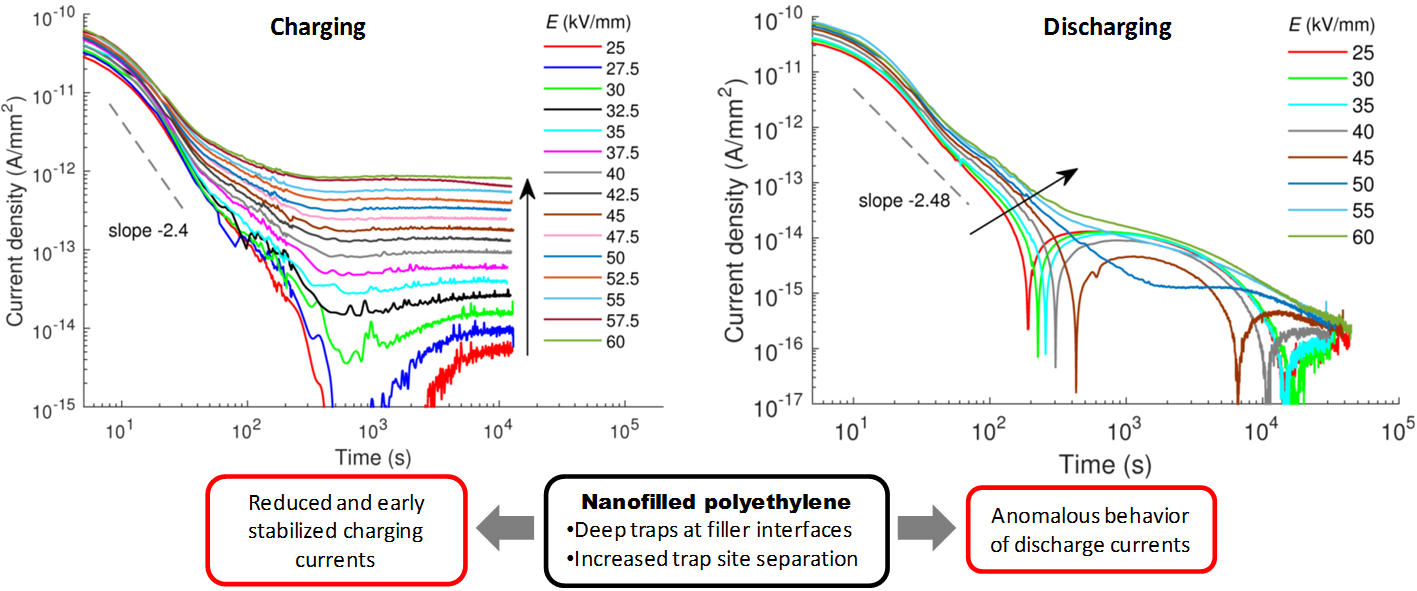
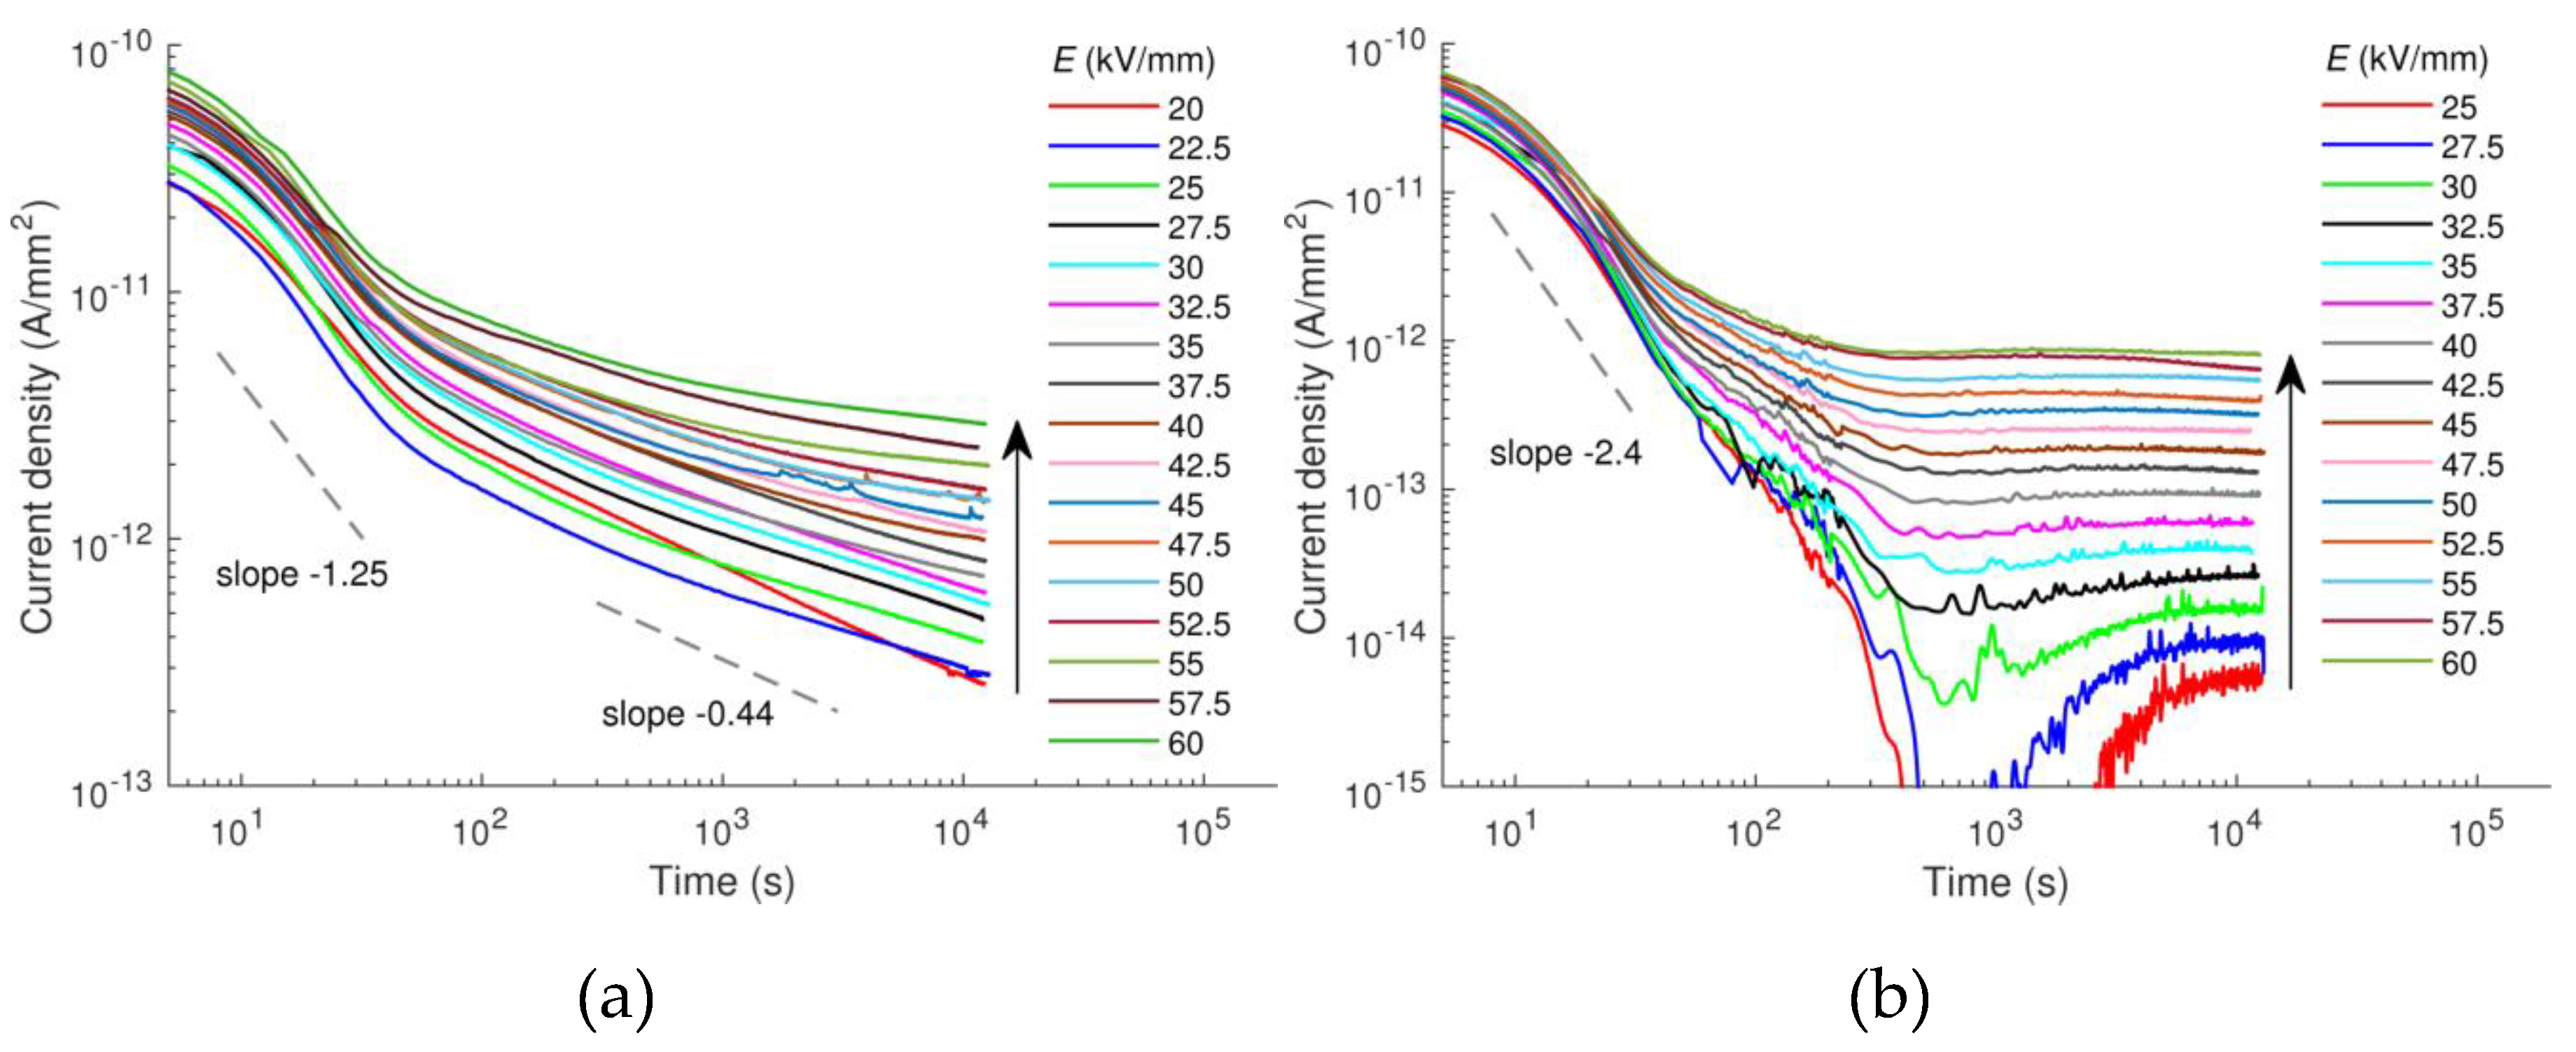
3.1. Charging Currents

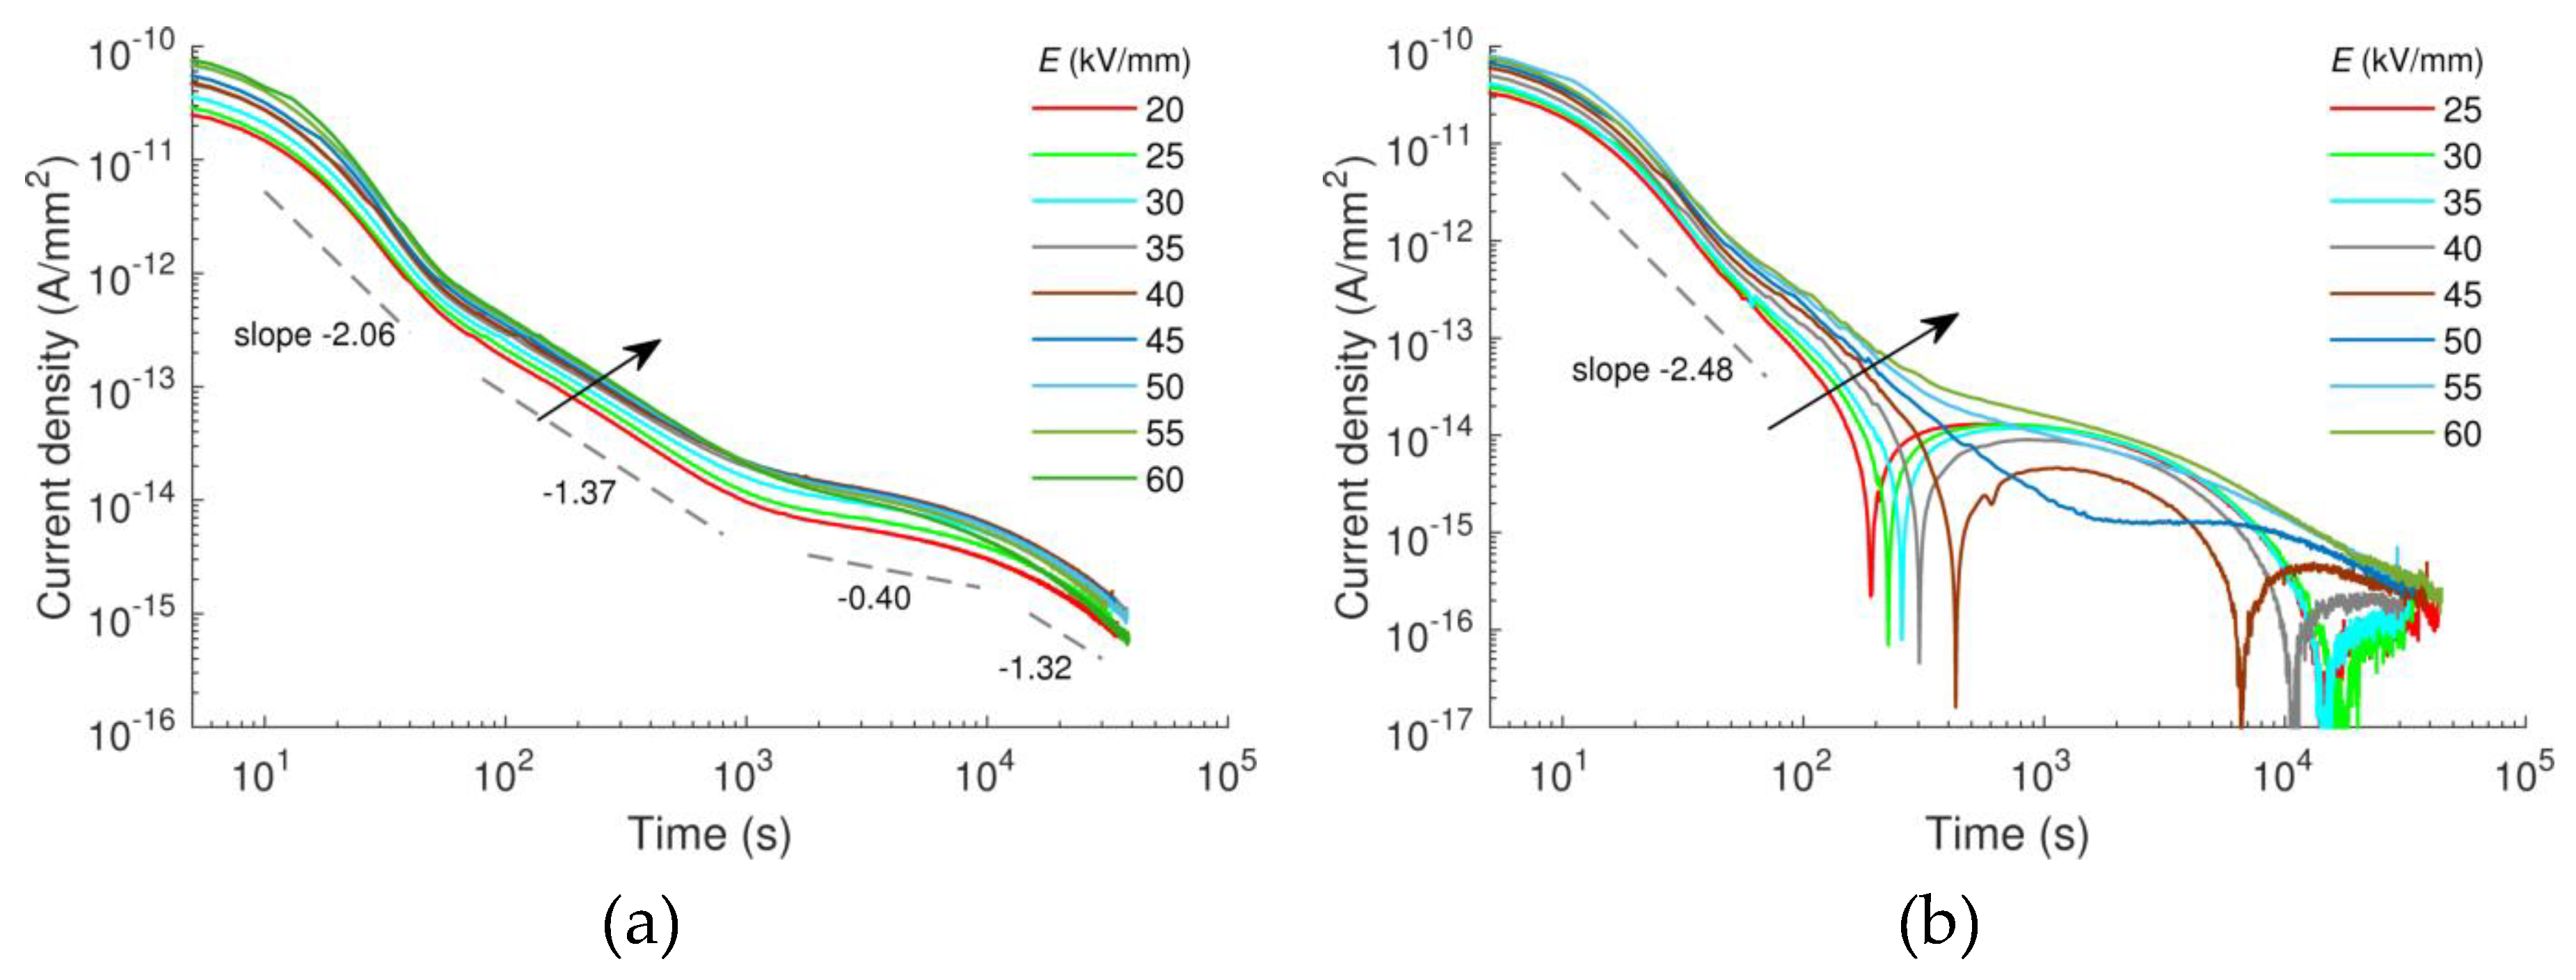
3.1.1. Transient Behavior

The time dependencies of the measured charging currents are shown in Figure 1. As seen, the shapes of the current curves for the reference LDPE were similar (Figure 1a), whereas the current magnitude increased with the applied electric field. Two characteristic regions with fast and slow decay rates could be identified. Within the initial ~50 s of the measurement, the currents decayed quickly and the slope of the curves varied from −1.25 to −1 and was attributed to the relaxation of the polarization processes in LDPE [13]. Later on the currents decayed much slower (the slope changed from −0.44 to −0.21 with the increasing electric field) indicating a gradually increasing dominance of the electrical conduction processes [13]. The steady state of the measured currents had not been achieved, which is commonly observed for LDPE, even during an extended measuring period of 17 days [15]. The knee point at ~50 s manifests the transition from a polarization-dominated phase to a conduction mode. Likewise, the two regimes were also observed in the charging currents attained on the LDPE/Al2O3 nanocomposite. As shown in Figure 1b, the initial stage (polarization dominated) at 80 °C was featured by higher slopes (from −1.7 to −2.4) than those observed for the pure material, whereas the steady state of the currents was well established especially at the fields exceeding 35 kV/mm. It is noteworthy that the currents showed polarity change at 80 °C and electric fields below 30 kV/mm.
The transient behavior of the charging currents is apparently dissimilar for the nanofilled and unfilled LDPE, particularly in terms of reaching the quasi-steady state for the former. The observation is clarified by an accumulation of homocharges in the vicinity of electrodes that stabilize charge injection and, hence, the charge transport in the entire insulation volume [12]. In addition, the polarity change of the charging currents or the dip in current curves at the low applied electric fields (below 30 kV/mm), shown in Figure 1b, can be associated with the depletion of mobile charge carriers that remain after the trapping and are not sufficient to maintain a positive current flow. At higher electric field strength, the charge supply is expected to dominate over the charge annihilation so that the polarity change is no longer detected.

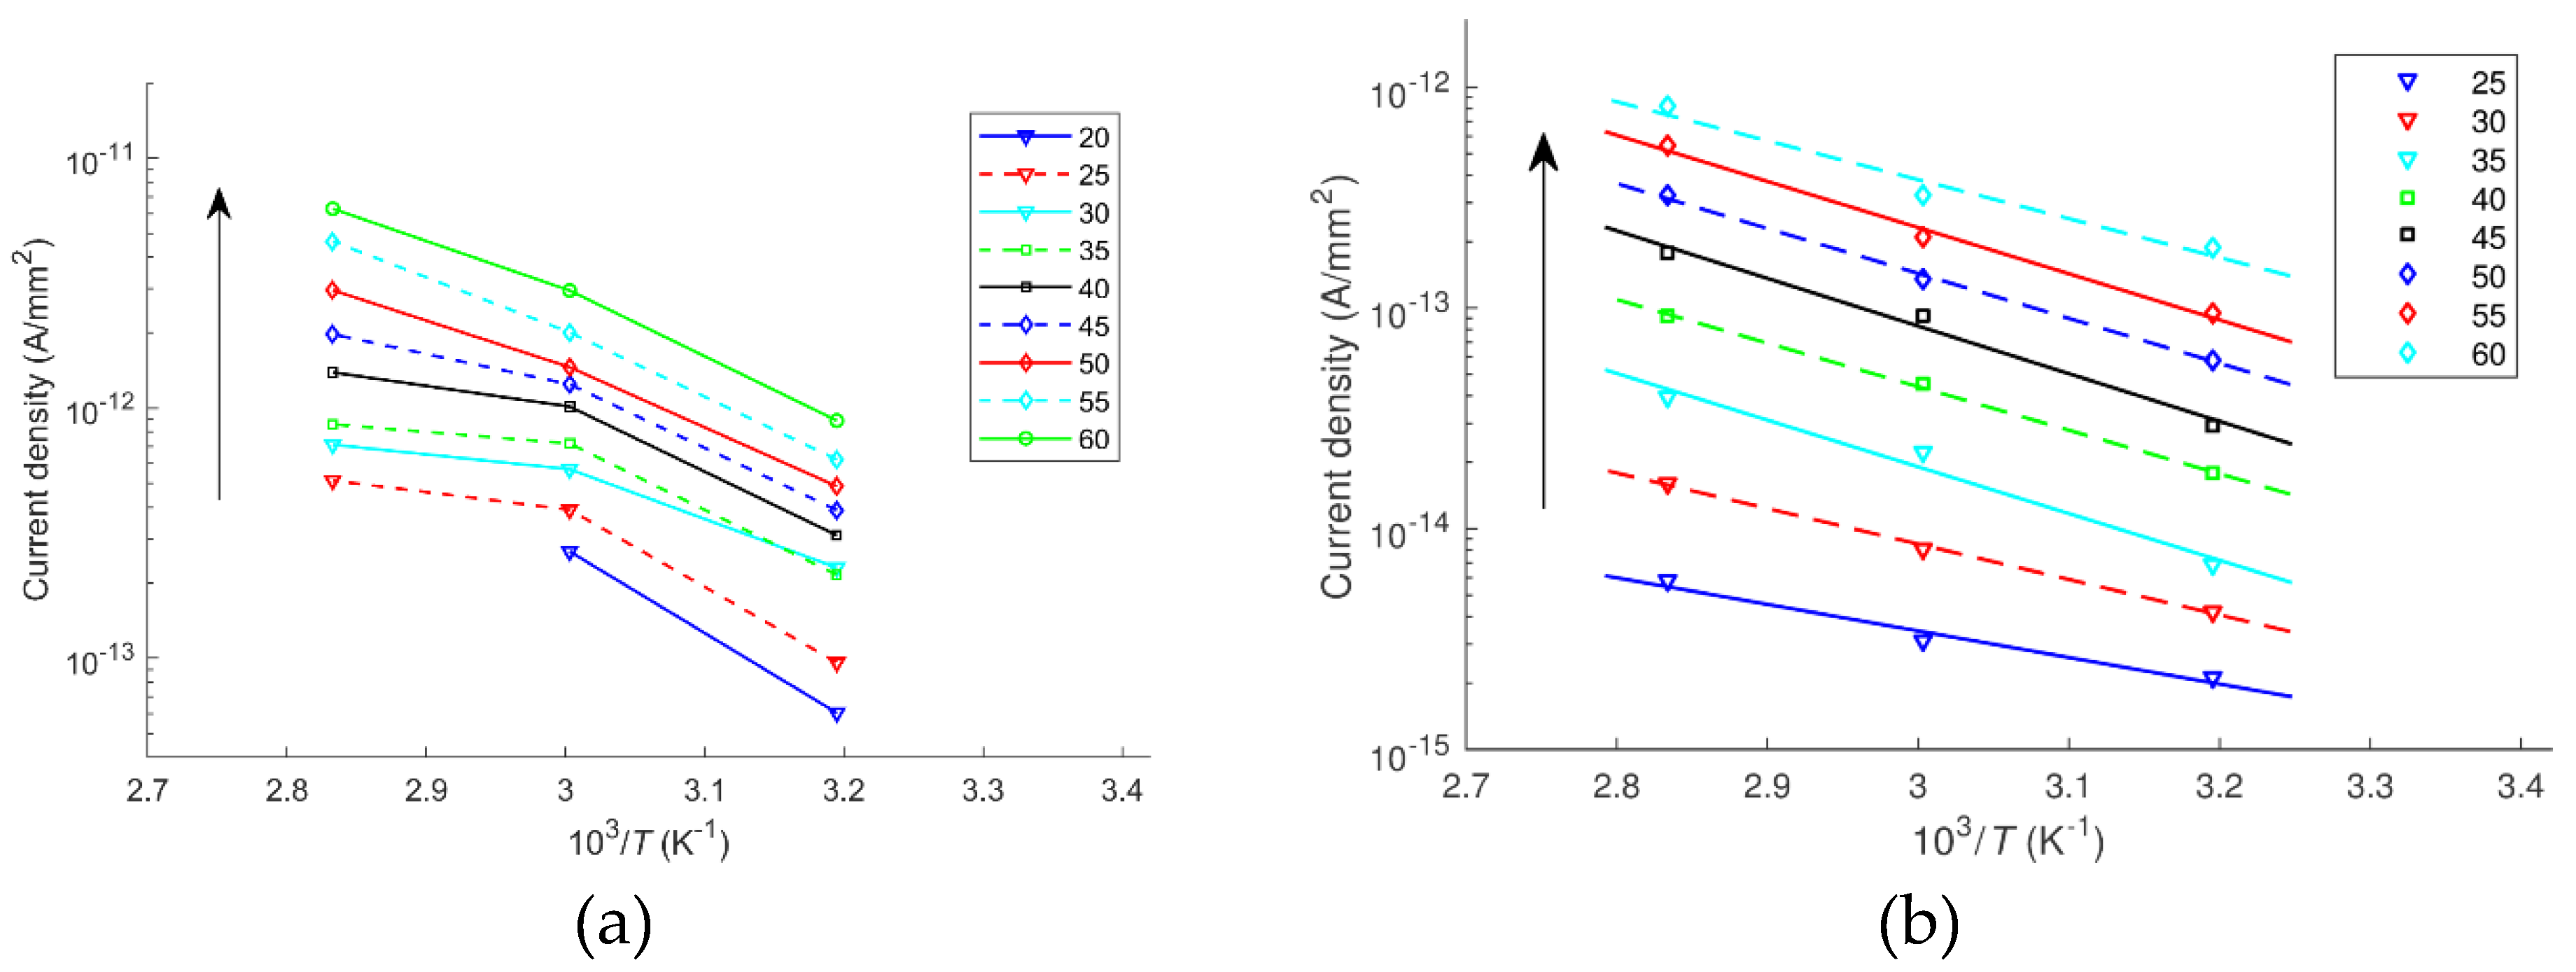
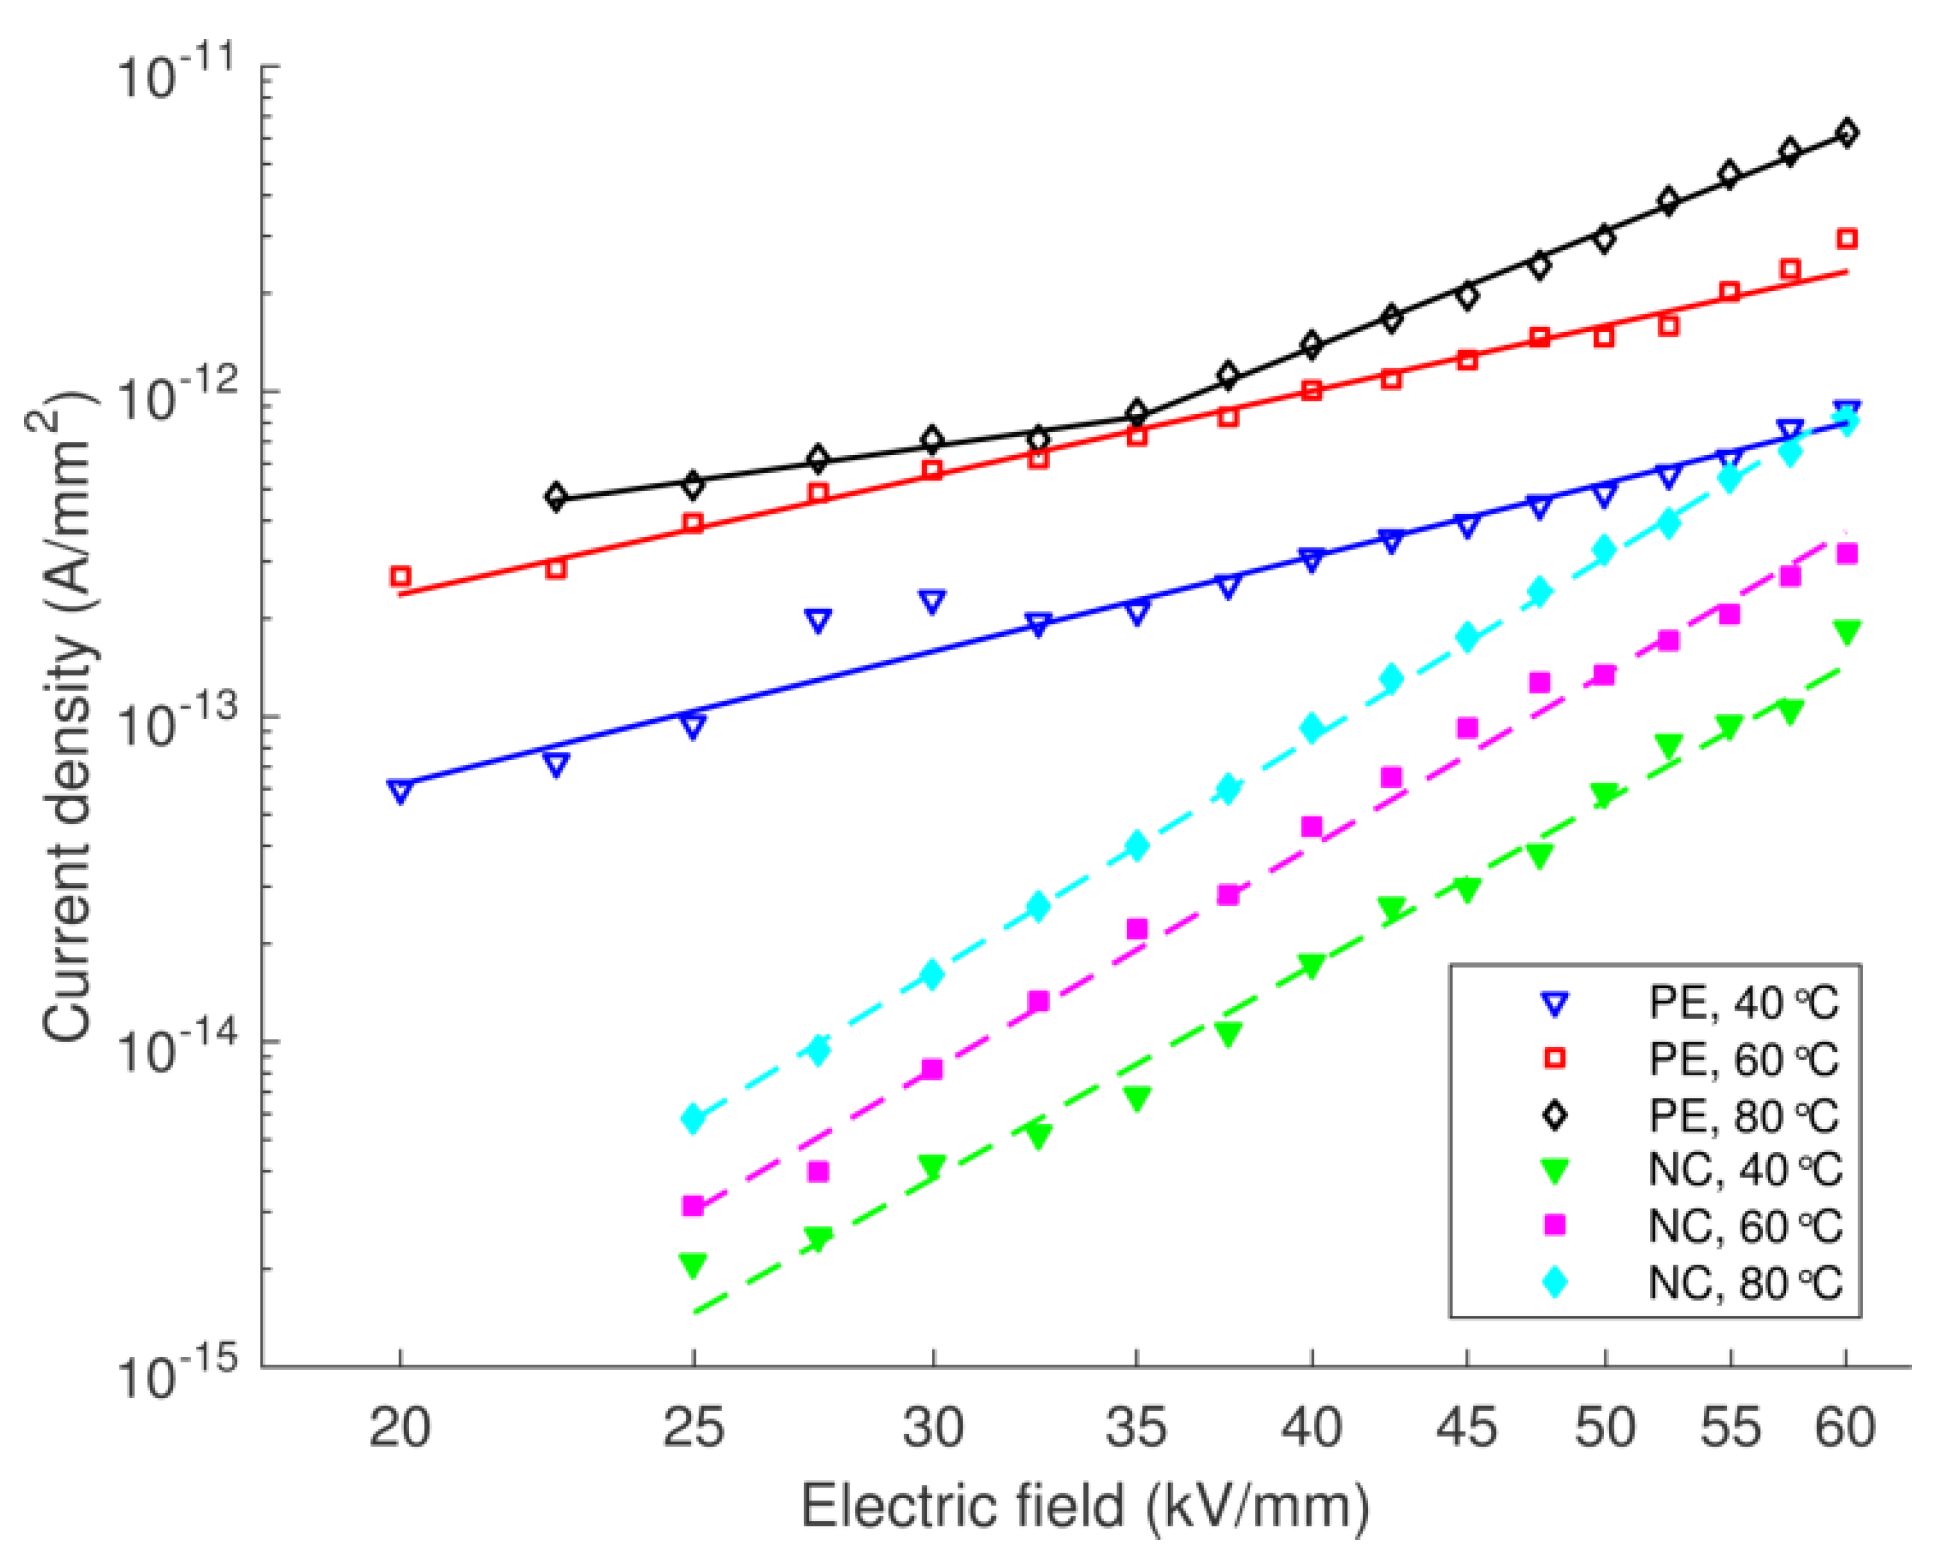
3.1.2. Isochronal Charging Currents

The temperature- and field-dependencies of the isochronal currents recorded at 3 h after voltage application are presented below.

Temperature Dependencies

Electrical transport in insulating materials is strongly temperature dependent and is often fitted by means of Arrhenius expression:
J ( T ) = J 0 exp ( E a k T ) ,
where J(T) indicates measured current density [Am−2], J0 is a constant [Am−2], k = 8.617 × 10⁻⁵ eVK−1 is the Boltzmann constant, T is the absolute temperature [K], and Ea is the activation energy [eV]. Respective dependencies are here shown in Figure 2 for the currents measured at different applied fields. The estimated values of Ea vary between 0.38–0.45 eV for the nanocomposite and are close to the value of 0.43 eV earlier indicated in [11] for the currents recorded at 4 × 10⁴ s. For the unfilled LDPE, the currents still decayed after 3 h of the measurements and the steady state was not achieved. One may anyhow expect that Arrhenius plots can also in this case be analogous for the experimental results attained at 3 h and at longer test durations. At temperatures below 60 °C, the dependencies were stronger and the corresponding activation energies varied in the range of 0.50–0.67 eV. Above 60 °C, the currents were less temperature-dependent and the activation energies were lower than 0.3 eV at the field strengths below 50 kV/mm and 0.36–0.44 eV above 50 kV/mm. This behavior can be attributed to a change of conduction mechanism in LDPE at temperatures above 60 °C as indicated below in Section 4.1.1.
The presented results indicate that the nanocomposite is more beneficial than the unfilled LDPE in applications below 60 °C thanks to its weak temperature dependence. It should also be emphasized that the obtained activation energies indicate the temperature dependence of the whole transport process rather than being correlated with the energy of traps in the studied materials.

Field Dependencies

The field dependencies of the quasi-steady current densities are presented in Figure 3 for both the studied materials. As shown, the currents in the nanocomposite were much lower than in the pure material and the most significant reduction in the current density is observed at the lowest field strength (by a factor of 50–120) whereas the differences become less pronounced at stronger applied electric fields.

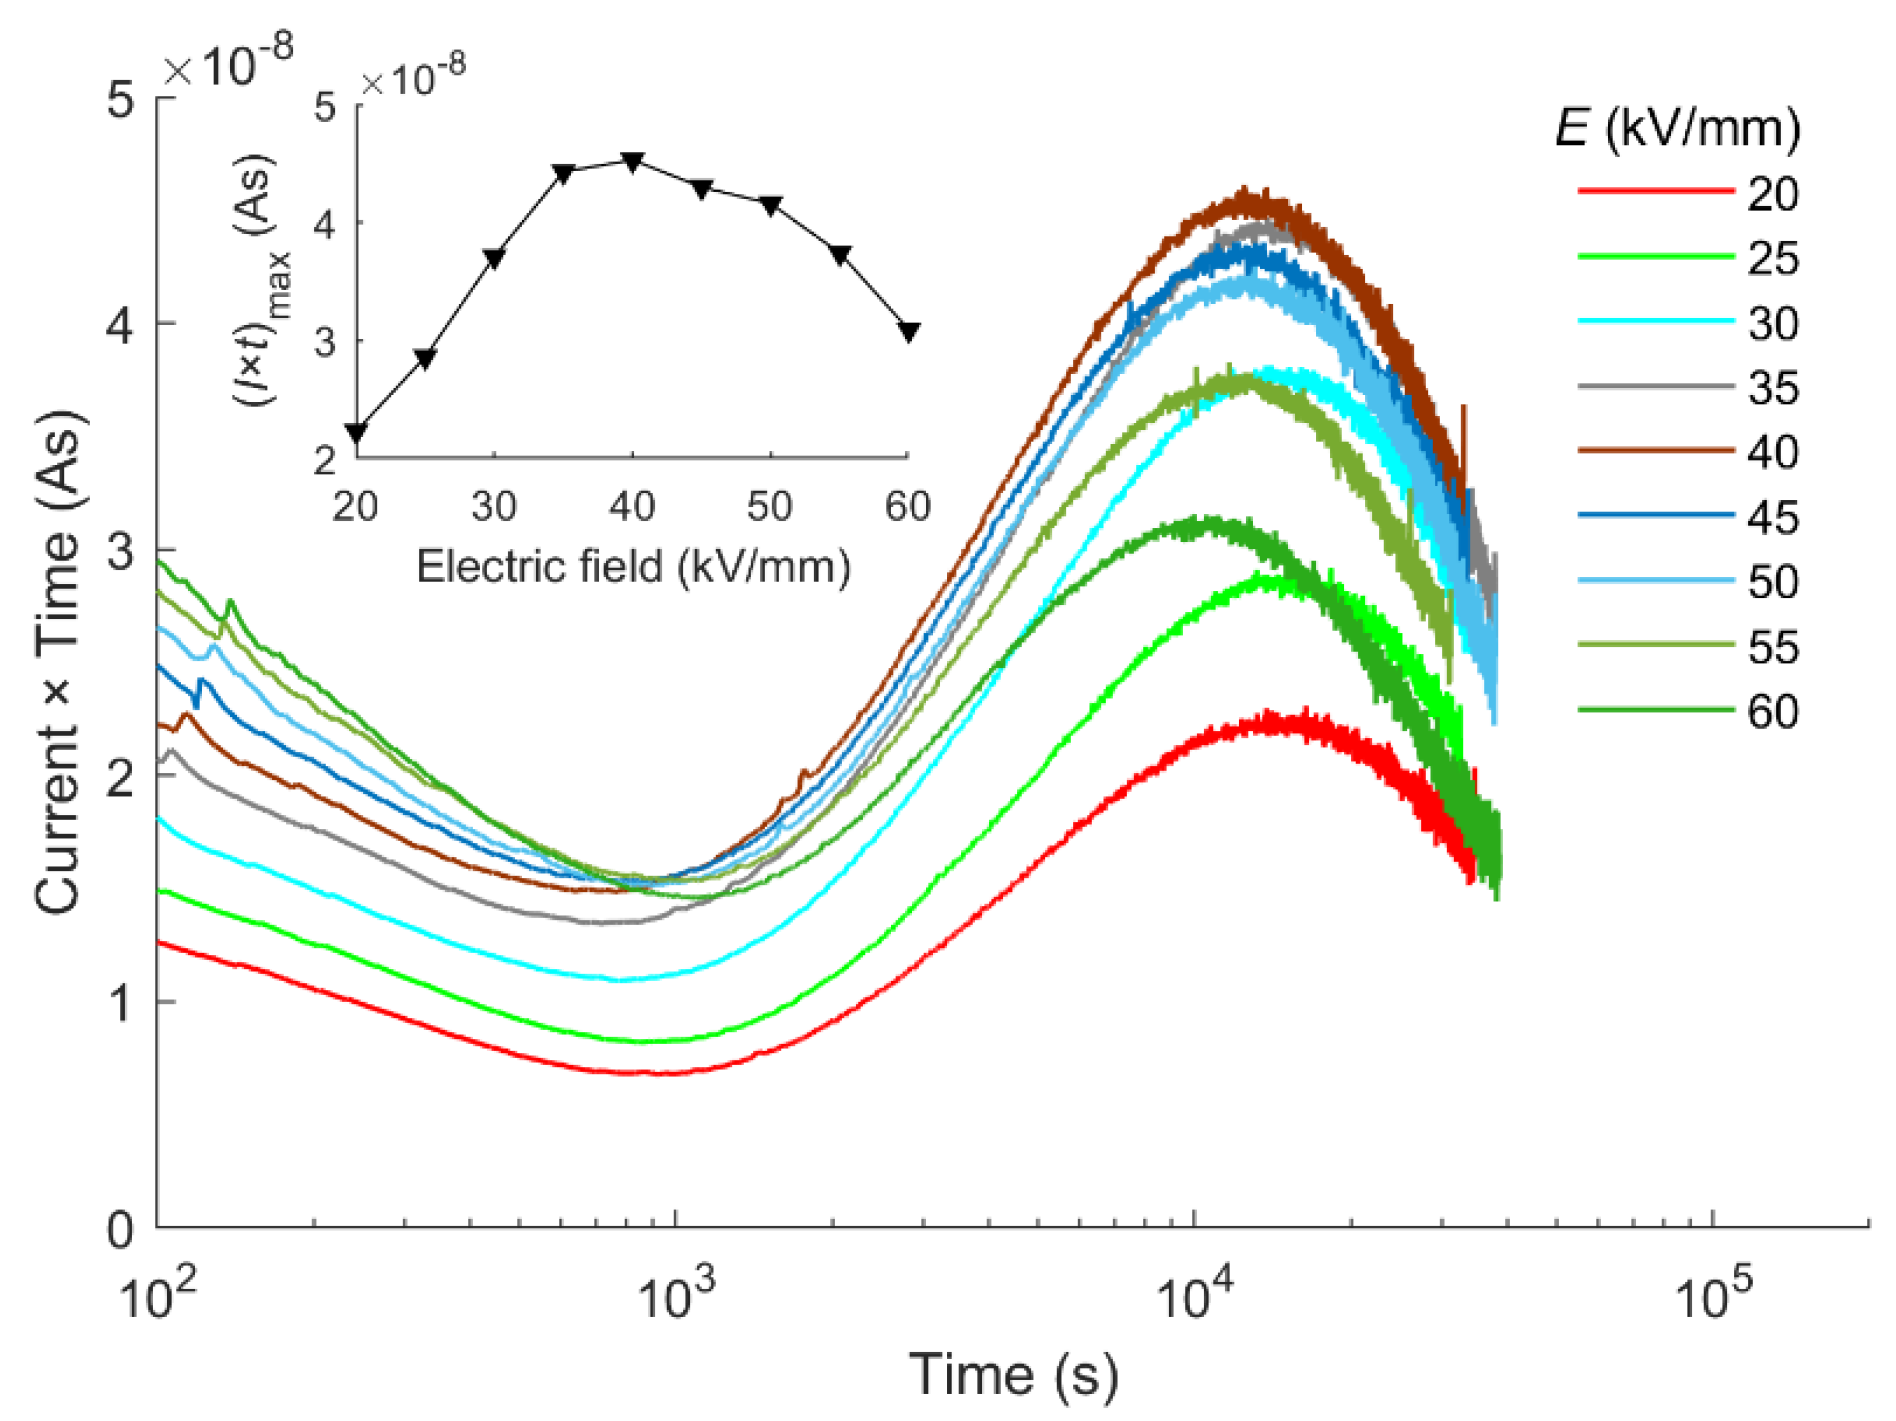
3.2. Discharge Currents

The time dependencies of the measured discharge current densities are shown for both the materials in Figure 4. These were lower than the charging counterparts, e.g., the differences for pure LDPE at 104 s are around two orders of magnitude. Shapes of the curves were similar (Figure 4a) and their level increased slightly with the applied field. Three knee points corresponding to the change in the slope of the curves are observed at ~50 s, ~103 s and ~104 s. During the initial stage (t < 50 s), the currents decayed quickly (with a slope of around −2), which is associated with depolarization relaxation, similarly as for the charging currents. Later on, the currents decayed slower, especially for the time interval between 103 s and 104 s, the behavior that can be attributed to de-trapping of charges accumulated in the bulk and their drift to the electrodes.
According to the theory of isothermal relaxation currents developed by Simmons and Tam [16], the de-trapping parameters can be revealed by plotting the product of relaxation current and time versus log(t). Examples of such characteristics are depicted in Figure 5, where the time instant tp = 1.5 × 10⁴ s corresponding to I × t peaks is considered as the average de-trapping time. The time tp should not however be understood as the transit time ttr of charge carriers passing through material bulk (ttr is in order of 102 s at 60 °C according to the reported in [11] charge mobility, i.e., ttr is much smaller than tp). The values of peak time tp are listed in Table 1, showing an increase by one order of magnitude or even more when the test temperature went down from 80 °C to 60 °C. Similar increase in tp should also be expected at test temperature of 40 °C, which explains why I × t peaks could not be observed within the used measurement time window. The corresponding levels of trap depth Et can be determined by means of time tp as
E t = k T ln ( υ t p ) ,
where ν is the attempt-to-escape frequency [s−1] that is considered to be ν = kT/h [17] with h being the Planck constant. The calculated trap depth is ~1.10 eV for LDPE and slightly higher than that obtained from surface potential decay on the same material (Et ≈ 1.0 eV) [11]. Similar trap depths were also listed in [18] for PE, revealed by thermally stimulated current (TSC) measurements. The average de-trapping time values found for the studied LDPE nanocomposite were longer than for the unfilled polymer, so that the trap distribution is shifted towards higher energy level.
It is particularly noteworthy that the discharge currents depicted in Figure 4b were subjected to polarity reversal when the applied electric field was below 50 kV/mm. Presentation of the data in a logarithmic scale results in a mirrored shape of the negative currents. The reversals took place at 200–400 s and then after the second reversals at 7 × 10³ – 2 × 10⁴ s currents became negative again. Similar polarity reversals have also been reported earlier for PE and ethylene–vinyl acetate copolymer and are referred to as anomalous discharge currents (ADC) [19,20]. In the present investigation, the ADC effect was detected in both the studied materials under the conditions provided in Table 2. It was visible at a lower temperature in the nanocomposite (60 °C) than in the pure LDPE (80 °C). As temperature increased from 60 °C to 80 °C, the ADC peaks in nanofilled LDPE increased by an order of magnitude and their occurrence was earlier. For pure LDPE, the ADC peaks were higher and started earlier than for the nanocomposite exposed to the same temperature (80 °C).

4. Analysis and Discussion

4.1. Isochronal Charging Currents

4.1.1. Possible Conduction Mechanisms

The field dependencies of the isochronal charging currents (Figure 3) can be represented by the power law function JEm. The calculated slopes m of the dependencies are given in Table 3. In case of pure LDPE at temperatures of 40 °C and 60 °C, the slopes are close to 2, indicating that space-charge-limited current (SCLC) is dominating the conduction process. At temperature of 80 °C the dependence exhibits a knee point (and respectively change in the slope) at the electric field strength of about 35 kV/mm. This can either be related to a change in the conduction mechanism or be caused by variation in the dynamics of polymer chains at 80 °C, i.e., well above the temperature of α relaxation in PE (60 °C). At 80 °C and the field strength below 35 kV/mm, the slope m is close to 1, indicating an ohmic behavior of the conduction, whereas at stronger fields, the slope m is larger than 2 and the conduction follows the SCLC mechanism with exponential distribution of traps (hereafter referred to as trap-distributed SCLC), as proposed by Mark and Helfrich [21]. Ohmic conduction behavior has usually been detected for PE at low electric fields, e.g., below 10 kV/mm [19,22]. However, in this work the ohmic behavior has extended to a rather high field strength (22.5–35 kV/mm) and its origin requires further investigations.
For the LDPE/Al2O3 nanocomposite, the slopes m are around 5–6 and the trap-distributed SCLC conduction still seems to be dominating. However, despite the similarity in the conduction type, presence of nanoparticles contributes to modification in the electronic structure of the material. In particular, since m = TC /T + 1, the increase of m means that the characteristic temperature TC is higher for the nanocomposite than for the pure LDPE, i.e., the trap distribution in the former is shifted towards higher temperature (energy). The result is also in line with the outcome of the theory of isothermal relaxation currents [16] presented earlier in Section 3.2.
Among various hypotheses considered for explaining electrical conduction in solid dielectrics, classical Schottky and Poole–Frenkel mechanisms are most frequently used. According to the former, charge carriers are injected at electrode–insulation interfaces after overcoming a potential barrier. An applied electric field lowers the potential barrier for charge injection, thus enhancing the resulting injected current density. Schottky mechanism dominates if the bulk processes are negligible and the charge injection is equal at both electrodes. Poole–Frenkel model is related to charge generation in the material bulk. Similar to Schottky mechanism, the presence of an applied electric field facilitates the charge generation by lowering the barrier of potential wells. According to these mechanisms, either current density or electrical conductivity is expressed by exponential functions of the square root of applied field strength. Based on such dependencies, the relative permittivity of considered materials can be derived and compared with its real values in order to confirm or disapprove the dominance of the mechanisms.
Schottky and Poole–Frenkel dependencies for the studied LDPE and its nanocomposite are plotted in Figure 6a,b, respectively. Note that the values of the relative permittivity εr used to get the best fit, as represented in Table 3, are different from the value of 2.3 commonly reported for PE (except for the case of the electric field above 35 kV/mm and temperature of 80 °C). These results suggest that neither Schottky injection nor Poole–Frenkel mechanism is capable of explaining the behavior of the quasi-steady state conduction currents in the studied materials. Similar analysis presented in [22] indicated the dominating role of Schottky injection in LDPE at room temperature, but not at elevated ones.

4.1.2. Alternative Conduction Mechanisms

In many practical cases, the above-described models do not provide satisfactory explanations of experimental data and different alternative models have been proposed, like for example those of Taylor and Lewis [23], Ieda et al. [24] or Adamec and Calderwood [25]. Generally, the proposed modifications of classical theories and newly developed models result in a better agreement with measured current–voltage relationships.
Nath et al. [26] developed a theory accounting for the reduction of the trap depth caused by the field induced in material bulk. According to this theory, the steady state current density J and the applied electric field E can be expressed by using parametric equations
J = μ θ 0 ε p 2 L [ ( y d 1 ) ( exp y d ) + 1 ] ,
E = ( y d 2 2 y d + 2 ) ( exp y d ) 2 p [ ( y d 1 ) ( exp y d ) + 1 ] ,
with the parameters yd and p defined as
y d = p E d , p = q λ 2 k T .
Here, µ is the charge mobility [m2V−1s−1], ε is the material permittivity [Fm−1], L is sample thickness [m], q = 1.6 × 10⁻¹⁹ C is the elementary charge, λ is the trap site separation [m], and Ed is the electric field at the rear electrode [V/m]. The de-trapping parameter θ0 is defined as
θ 0 = N C N T exp ( E t k T ) ,
where NC is the effective density of states [m−3], NT is the total trap density [m−3], and Et is the trap depth [eV]. The total trap density NT is correlated to the average trap site separation λ as:
N T λ 3 .
By fitting J(E) characteristics using the developed expressions, the authors estimated the trap site separation and the trap concentration in linear low-density polyethylene (LLDPE) [26].
A comparison between the measured in this work current densities and the theoretical values of Nath et al. model is shown in Figure 7, whereas the derived average trap site separation λ and the product of µθ0 are provided in Table 4. For the LDPE/Al2O3 nanocomposite, the recorded quasi-steady state currents are in good agreement with the theory, giving the average trap site separation of 5–7 nm. For the pure LDPE, the fitting of the not-yet steady state currents can be justified by considering a similar decay behavior of measured charging currents and, thus, similar current–voltage dependencies should be recorded at 3 h and at steady state (in case the latter exists). The trap site separation in pure LDPE varied between 1.4 and 1.8 nm that is comparable to the value reported previously by Boudou and Guastavino [22] who also used the Nath et al. model (Table 5).
The addition of nanoparticles into LDPE resulted in an increase of the average trap site separation by a factor of 3.5–4. It can be argued that introducing nanoparticles of 40 nm in diameter into the amorphous phase of LDPE physically separates the existing traps from each other. Furthermore, by using Equation (8) one finds the trap densities ~1026 m−3 and ~1024 m−3 respectively for the pure LDPE and its nanocomposite. Thus, the reduced trap density NT in the nanocomposite indicates a suppression in formation of traps by the presence of nanoparticles in LDPE matrix.
On the other hand, the values of µθ0 were 200–400 times smaller for the nanocomposite than for the pure LDPE, which can be explained by reduction of both the charge mobility µ and the de-trapping parameter θ0. The decreased apparent charge mobility in nanofilled LDPE has been detected earlier [11] and by using the reported data, magnitude of the de-trapping parameter θ0 is evaluated as ~2 × 10⁻² and ~2 × 10⁻⁴ respectively for the unfilled and nanofilled LDPE. By noting the definition of θ0 in Equation (7), the lower value in the nanocomposite should be attributed to the reduction in the ratio NC/NT, i.e., a decreased proportion of charge carriers contributing to the conduction and/or to an increase of the trap depth Et.

4.2. Anomalous Discharge Currents

Kitani et al. [27] studied the anomalous behavior of discharge currents and pointed out that ADC should be associated with the presence of bipolar charge injection during sample charging and the drift of charge carriers accumulated in the bulk towards electrodes under the influence of their own electric field during its discharging. The authors employed a simplified numerical model of charge transport that considered only mobile charge carriers (electrons and holes) and assumed a linear distribution of space charges as the initial condition for the discharging stage. In the current work, a further step is taken by considering the existence of traps and their interaction with free charge carriers in order to elucidate the behavior of the measured discharge currents in the studied materials.

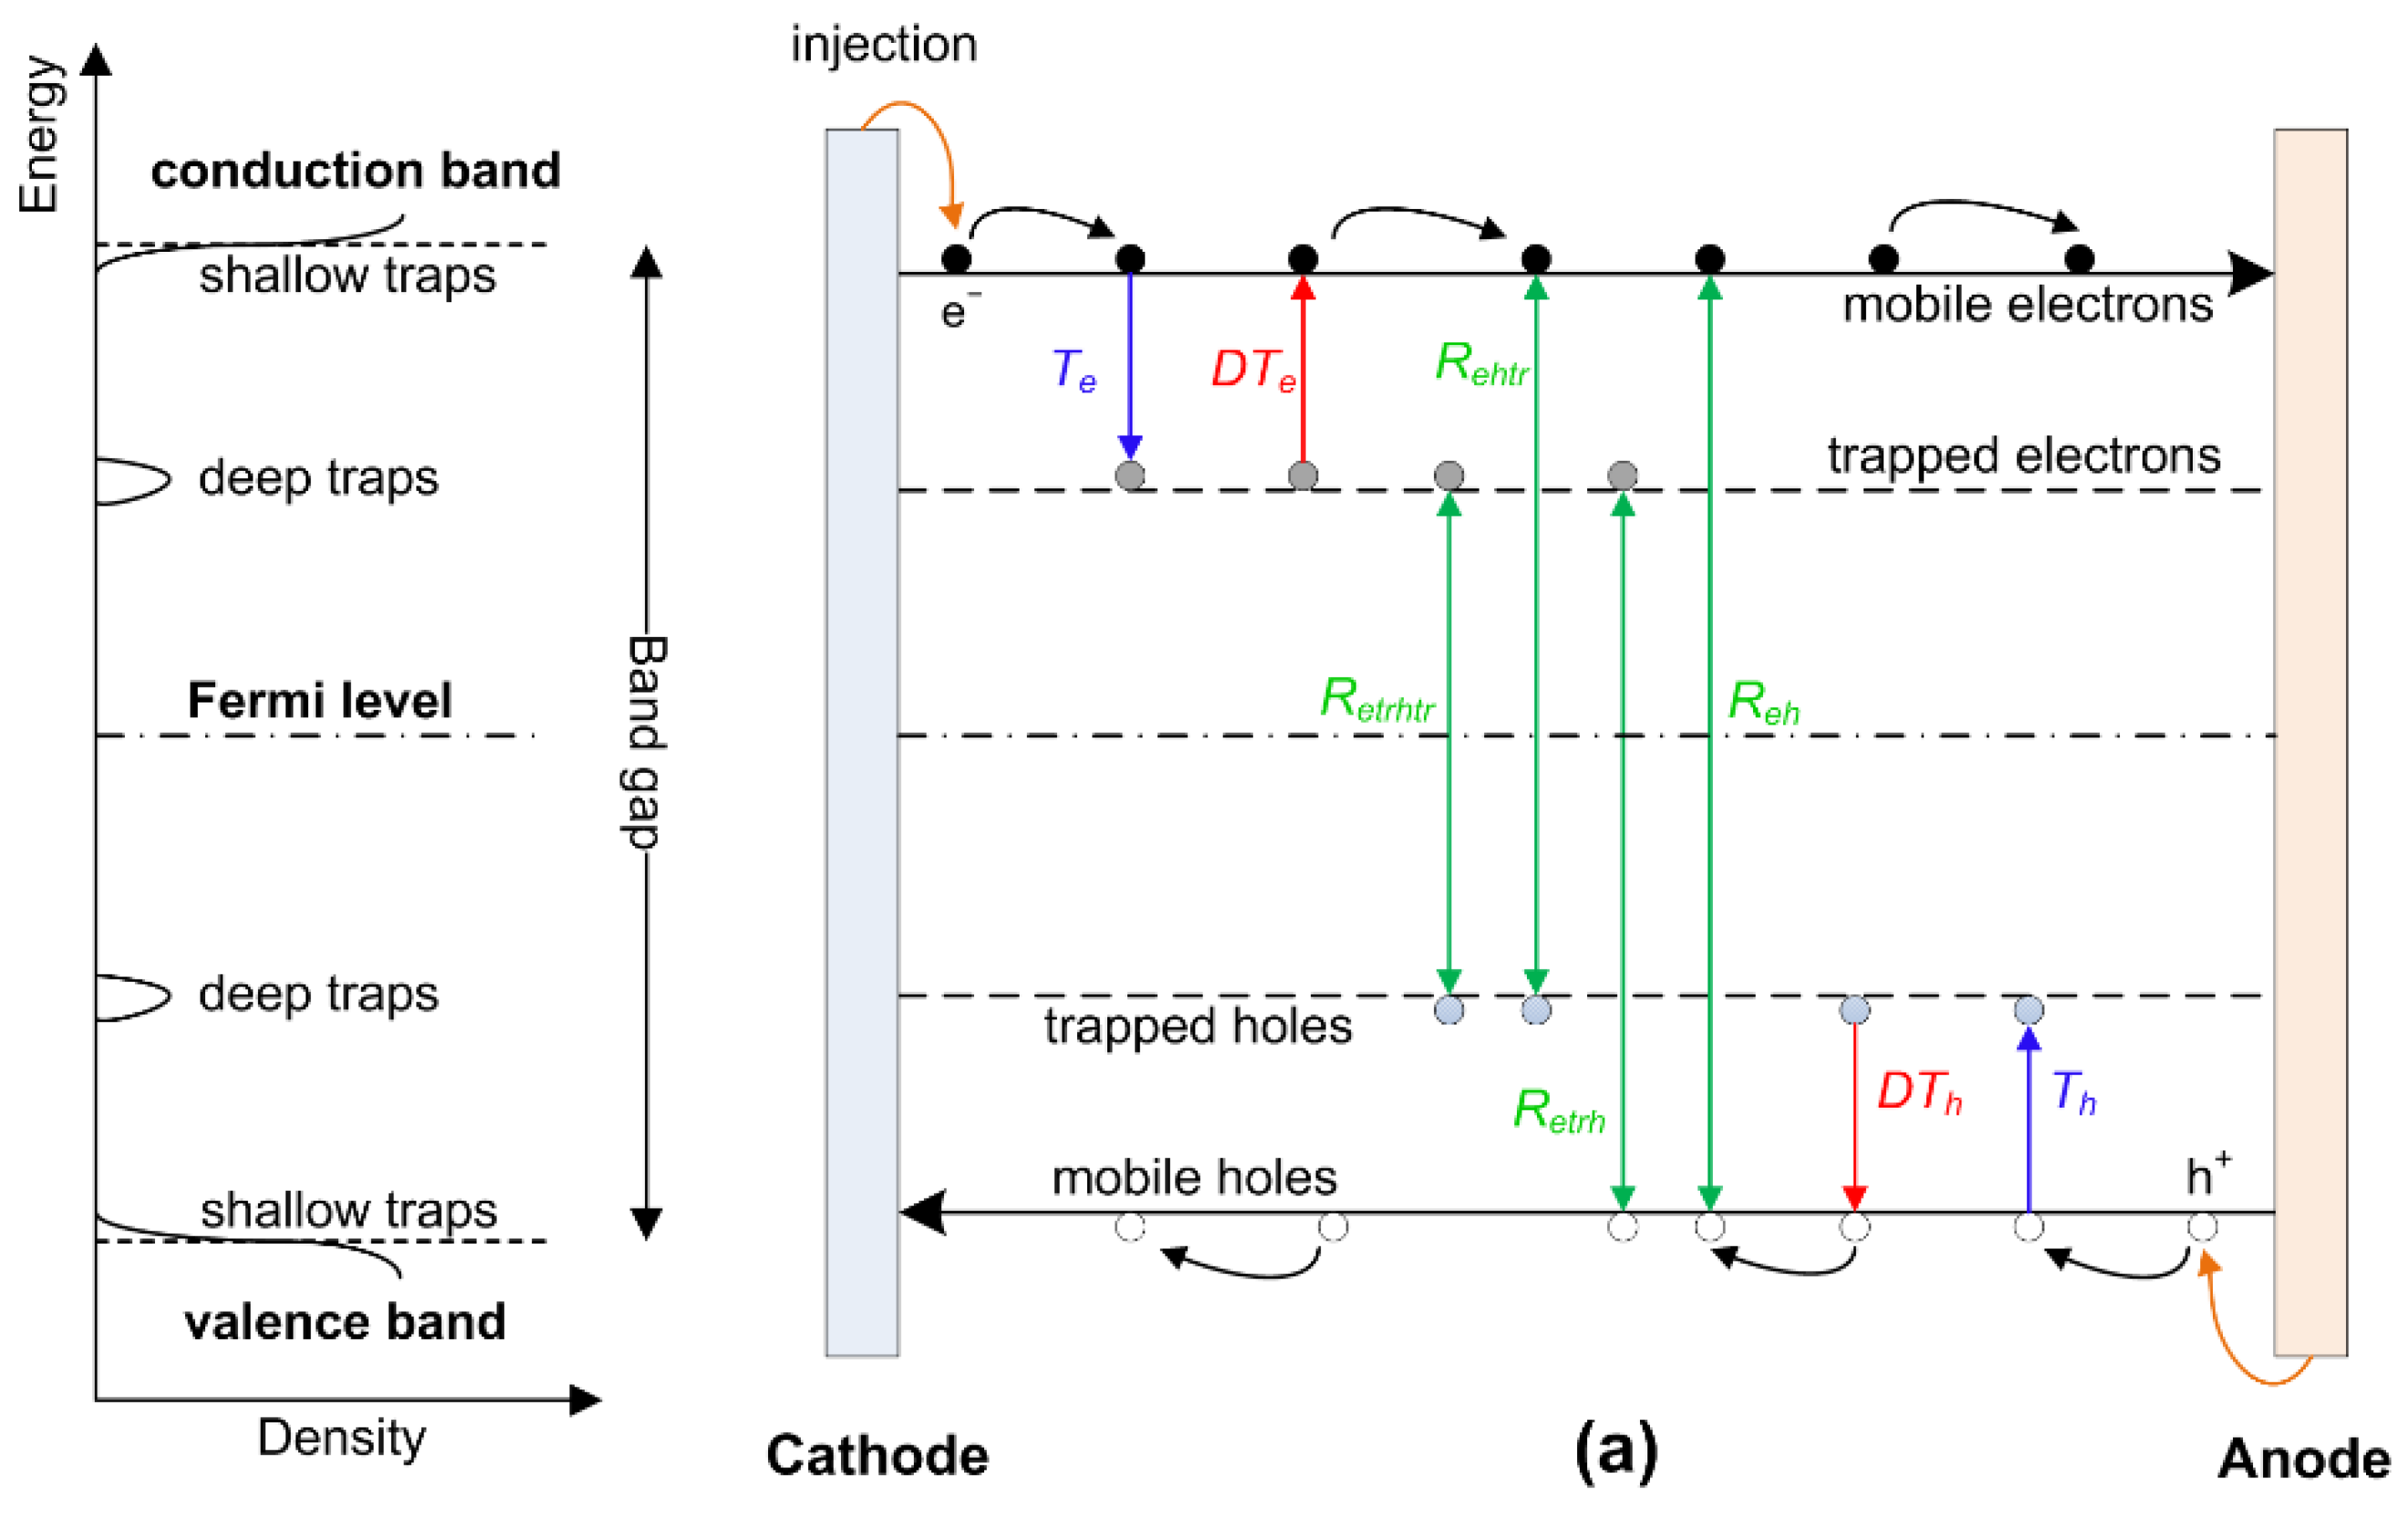
4.2.1. Numerical Model

For pure LDPE, we use the model of charge generation and transport [28] that includes two trap levels: a shallow trap center that controls the hopping transport of mobile charges through extended states and a deep trap center that captures for a certain time mobile carriers. Charges are assumed to be injected during charging stage by Schottky mechanism, while no charge injection happens during discharging. Charge trapping, de-trapping, and recombination are considered as the source and sink of charges in the bulk. A schematic illustration of the model is shown in Figure 8a and its detailed description can be found elsewhere [12]. For the LDPE/Al2O3 nanocomposite, a deeper trapping center ascribing the feature of polymer–filler interfaces is introduced. The interaction of charge carriers, e.g., charge trapping and de-trapping, between the two deep trap levels is not considered (Figure 8b).
The computer simulations were implemented for the charging–discharging stages at the applied electric field of 30 kV/mm. The charging phase was 3 h long, similar as in the experiments. The space charge and electric field distributions obtained at the end of the charging are the initial condition for the discharging. Parameters of the model are adopted from literature [12,28] and for simplicity they are assumed to be symmetric, i.e., equal for electrons and holes, see Table 6. As the temperature raises from 60 °C to 80 °C, the effective charge mobility and the trapping coefficient increase, while all the other parameters are unchanged. The change is attributed to the thermally activated behavior of the hopping transport and the increased probability of charge capturing into deep traps as more charge carriers are available at higher temperatures. The second level of deep traps at 1.5 eV in the nanofilled LDPE is associated with the localized states formed at polymer–filler interfaces.

4.2.2. Simulated Results

Discharge currents as the outcomes of the numerical model are shown in Figure 9a. Note that the introduction of the deep trap level (1.5 eV) in the model for the nanocomposite leads to a reduction of the simulated conduction current by a factor of 5–6 and the results are not displayed here in order to avoid any distraction from the topic to be discussed. As seen from the figure, the ADC is not observed for the pure LDPE at 60 °C while it is visible at the 80 °C with the reverse peak of 1.4 × 10⁻¹⁴ A/mm2 at time of 170 s. For the LDPE nanocomposite, the ADC peak at 60 °C is rather low (5 × 10⁻¹⁶ A/mm2) and it is detected at longer time (4 × 10³ s) after short-circuiting. The simulated results are in good agreement with the experimental data.
The occurrence of ADC has been explained by Kitani et al. as follows [27]. Under short-circuit conditions the externally applied electric field no longer exists and electric field within material bulk is induced by accumulated space charges. Since the integral of the electric field over sample thickness is zero, the electric field crosses over the zero level at two locations, so-called zero-field points. Regions of positive and negative fields are formed, where the positive field region is noted between two zero-field points (see Figure 10 or reference [27] and figures therein). The drift of charge carriers in the positive and negative field regions gives rise to currents of respective signs, the sum of them is nothing else but the discharge current measured in the external circuit. Examples of the simulated positive and negative current components are shown in Figure 9b, where their magnitudes are compared. The contribution of these components to the discharge current changes over time. Immediately after short-circuiting the negative component is dominating due to the large electric field (Figure 10) and the high charge density in the vicinity of the electrodes. As a result, the discharge current is negative and has a relatively large magnitude. The magnitude of the negative component decays quickly, thus the discharge current value approaches zero. At a certain time instant, the positive current component starts to dominate over the negative one (Figure 9b).
It is observed in this study that the ADC effect is facilitated by two conditions: either by the increase of test temperature (see results for pure LDPE at 60 °C versus 80 °C shown in Figure 9a) or by the presence of nanofillers in the studied material (see results at 60 °C for pure LDPE versus nanofilled LDPE). For pure LDPE at 60 °C, magnitude of the negative current component is higher than the positive one within the entire time domain, which contributes to a conventional behavior of discharge current (Figure 9b). In the former condition, the higher temperature enhances electrical conduction in the studied LDPE by intensifying charge generation that leads to an excessive amount of accumulated charges at the end of the charging stage, especially in the vicinity of the electrodes. Thus, mobile charges, after being released from traps, are readily accessible in the discharging phase and their mobility increases at higher temperatures. Such a strong conduction process results in a quick depletion of immobile charges in the bulk, particularly in the vicinity of the electrodes and, thus, the negative current component dies out much faster than the positive counterpart. Consequently, the imbalance between these current components favors the positive one just shortly after the discharging phase starts. In the latter case mentioned above, the introduced deep traps at polymer–nanofiller interfaces capture space charges for infinitely long time in the insulation bulk, especially at the electrodes. As a matter of fact, the retention time in traps with the energy level of 1.5 eV is in order of 7 × 10⁹ s, i.e., over 200 years, which means that the charge de-trapping is negligible. The charge transport is therefore greatly suppressed and the magnitude of both the positive and negative current components is remarkably reduced in the nanocomposite as compared to pure LDPE, as depicted in Figure 9b. The impact on the negative current component is more pronounced as it originates from the material layers in the vicinity of the electrodes, thus the positive alternative is eventually dominant. This process takes place at a considerably slow pace, which explains the observation of the ADC peak time for the nanocomposite in the range of few thousand seconds.
The appearance of the ADC is associated with the change in the direction of movement of zero-field points that can be explained by a theoretical study. Owing to the chosen symmetry of model parameters for electrons and holes, the charge transport process and electric field distribution are symmetrical about the middle point of the sample. Thus, the discharge current can be calculated as twice the current arising in a half of the sample domain (from an electrode to the middle point). The bipolar charge transport model can be considered analogous to the unipolar (also called one-carrier) charge transport model developed by Lindmayer [29], according to which the discharge current is proportional to the velocity of the zero-field point movement. The ADC therefore appears if the velocity of the zero-field point changes its sign, i.e., the point changes the direction of its move. This is illustrated in Figure 10, where the variation of the electric field distribution in the material bulk during the discharging phase is displayed. The figure inset shows the movement of the left zero-field point (z1). One may notice that prior to the ADC has been reached (t = 70 s), the zero-field point moves inwards, i.e., towards the middle position, while upon occurrence of the ADC (t > 70 s), the zero-field point moves instead outwards. Such an outward movement in fact corresponds to an expansion of the positive field region that is apparently related to the increased contribution of the positive current component to the discharge current. In case of ADC absence (e.g., in pure LDPE at 60 °C), only the inward movement of the zero-field points is found (not shown in the figure).

4.3. Impact of Nanofillers on Electrical Conduction

Both results of isochronal charging currents and isothermal discharge currents indicate the contribution of nanofillers in shifting the trap energy distribution in the nanofilled material towards higher energy level by 0.04–0.05 eV. The change affects not only the deep trap level, but also shallow traps. Indeed, by recalling the temperature dependence of charge mobility
μ ( T ) = μ 0 exp ( E μ t k T ) ,
where Eµt is the depth of shallow traps [eV], one can correlate the energy increment ∆Eµt of 0.04–0.05 eV to a decrease of charge mobility by a factor of 4–6. The latter has been reported for the studied polymer composite [11] as well as for other nanofilled dielectrics considered in various works [4,5]. Nanofillers seem to displace the morphological defects away from each other, making the hopping transport of mobile charges more difficult. These conditions lead to the creation at polymer–filler interfaces of a new shallow trapping center featured by a higher average trap energy as compared to that in the pure LDPE.
Another modification in the electrical conduction of the nanocomposite is related to the formation of an additional deep trap level. The energy of such deep traps may vary between 1.0 to 5.0 eV depending on applied electric field, filler dielectric constant, etc. [10]. Results of TSC measurements suggested that such localized states can be around 1.6–2.0 eV away from extended states [7,30,31]. The numerical model proposed in this work considering the second trapping center at the energy depth of 1.5 eV gives a satisfactory explanation for the observation of ADC at a lower temperature (60 °C) for the nanocomposite as compared to the pure LDPE.

5. Conclusions

Studies of electrical conduction mechanisms in pure LDPE and its nanocomposite filled with Al2O3 at 3 wt% were performed by measuring charging and discharge currents and analyzing their behavior in transient and at quasi-steady state conditions. Within the initial ~50 s of the measurements, the charging/discharge currents are characterized by a strong decay due to the fast polarization/depolarization processes. Thereafter, the currents are controlled by the electrical transport and featured by a slower decay. Application of the isothermal relaxation current theory revealed an average trap depth of 1.10 eV in the pure LDPE, while the corresponding trap level in the LDPE nanocomposite was at 1.14 eV. This shift of trap energy level caused an enhanced trapping of charge carriers in the nanofilled LDPE and contributed to earlier emergence of the steady state conduction mode. The addition of nanoparticles also remarkably suppressed the level of charging currents in the material and this effect was especially strong at the field strength of 25–30 kV/mm. At the same time, the temperature dependence of the isochronal currents was less pronounced for the nanocomposite than the unfilled LDPE below 60 °C whereas it appeared to be stronger above 60 °C.
The conduction process in both the materials appeared to be dominated by the space-charge-limited current (SCLC) mechanism and the presence of nanofillers hindered the electrical conduction in the nanocomposite by increasing the average trap site separation from 1.4–1.8 nm to 5–7 nm, strongly impacting this way the trap density. The nanofilled structure also created deeper traps and reduced the proportion of free charge carriers in the material.
Anomalous discharge current (ADC) behavior was detected at elevated temperatures in both the studied materials and its strength was higher in the pure LDPE but it occurred in the nanofilled LDPE at lower temperatures. The effect in pure LDPE was attributed to the enhanced electrical conduction with temperature. The ADC behavior in the nanofilled LDPE was, on the other hand, elucidated by the suppression of electrical conduction due to the formation of deep traps at the polymer–nanofiller interfaces. In either case, ADC is associated with the change in direction of the zero-field point move.

Author Contributions

Conceptualization, A.T.H.; experiment plan and implementation, A.T.H.; data analysis and systematization, A.T.H.; numerical simulation, Y.V.S. and A.T.H.; writing—original draft preparation, A.T.H.; writing—review and editing, Y.V.S. and S.M.G.; supervision, Y.V.S and S.M.G.; project leader and coordination, S.M.G.; funding acquisition, Y.V.S and S.M.G. All authors have read and agreed to the published version of the manuscript.

Funding

This work has been performed with the financial support from the Swedish Foundation for Strategic Research and Chalmers Area of Advance in Energy.

Acknowledgments

The authors thank Dongming Liu and Ulf Gedde, Department of Fibre and Polymer Technology, Royal Institute of Technology, Stockholm, Sweden for providing material samples.

Conflicts of Interest

The authors declare no conflict of interest.

References

  1. Hanley, T.L.; Burford, R.P.; Fleming, R.J.; Barber, K.W. A general review of polymeric insulation for use in HVDC cables. IEEE Electr. Insul. Mag. 2003, 19, 13–24. [Google Scholar] [CrossRef]
  2. Bergelin, P.; Jeroense, M.; Quist, T.; Rapp, H. 640 kV Extruded HVDC Cable System; NKT HV Cables: Lyckeby, Sweden, 2017. [Google Scholar]
  3. Tanaka, T. Dielectric nanocomposites with insulating properties. IEEE Trans. Dielectr. Electr. Insul. 2005, 12, 914–928. [Google Scholar] [CrossRef]
  4. Roy, M.; Nelson, J.K.; MacCrone, R.K.; Schadler, L.S. Candidate mechanisms controlling the electrical characteristics of silica/XLPE nanodielectrics. J. Mater. Sci. 2007, 42, 3789–3799. [Google Scholar] [CrossRef]
  5. Murakami, Y.; Nemoto, M.; Okuzumi, S.; Masuda, S.; Nagao, M.; Hozumi, N.; Sekiguchi, Y. DC conduction and electrical breakdown of MgO/LDPE nanocomposite. IEEE Trans. Dielectr. Electr. Insul. 2008, 15, 33–39. [Google Scholar] [CrossRef]
  6. Ishimoto, K.; Kanegae, E.; Ohki, Y.; Tanaka, T.; Sekiguchi, Y.; Murata, Y.; Reddy, C.C. Superiority of dielectric properties of LDPE/MgO nanocomposites over microcomposites. IEEE Trans. Dielectr. Electr. Insul. 2009, 16, 1735–1742. [Google Scholar] [CrossRef]
  7. Wang, W.; Min, D.; Li, S. Understanding the conduction and breakdown properties of polyethylene nanodielectrics: Effect of deep traps. IEEE Trans. Dielectr. Electr. Insul. 2016, 23, 564–572. [Google Scholar] [CrossRef]
  8. Li, S.; Min, D.; Wang, W.; Chen, G. Linking traps to dielectric breakdown through charge dynamics for polymer nanocomposites. IEEE Trans. Dielectr. Electr. Insul. 2016, 23, 2777–2785. [Google Scholar] [CrossRef]
  9. Lewis, T.J. Charge transport in polyethylene nano dielectrics. IEEE Trans. Dielectr. Electr. Insul. 2014, 21, 497–502. [Google Scholar] [CrossRef]
  10. Takada, T.; Hayase, Y.; Tanaka, Y.; Okamoto, T. Space charge trapping in electrical potential well caused by permanent and induced dipoles for LDPE/MgO nanocomposite. IEEE Trans. Dielectr. Electr. Insul. 2008, 15, 152–160. [Google Scholar] [CrossRef]
  11. Hoang, A.T.; Pallon, L.; Liu, D.; Serdyuk, Y.V.; Gubanski, S.M.; Gedde, U.W. Charge transport in LDPE nanocomposites. Part I—Experimental approach. Polymers 2016, 8, 87. [Google Scholar] [CrossRef] [Green Version]
  12. Hoang, A.T.; Serdyuk, Y.V.; Gubanski, S.M. Charge transport in LDPE nanocomposites. Part II—Computational approach. Polymers 2016, 8, 103. [Google Scholar] [CrossRef] [PubMed]
  13. Adamec, V.; Calderwood, J.H. On the determination of electrical conductivity in polyethylene. J. Phys. D Appl. Phys. 1981, 14, 1487–1494. [Google Scholar] [CrossRef]
  14. Adamec, V.; Calderwood, J.H. Electrical conduction and polarisation phenomena in polymeric dielectrics at low fields. J. Phys. D Appl. Phys. 1978, 11, 781–800. [Google Scholar] [CrossRef]
  15. Viertel, J.; Petersson, L.; Friberg, A.; Dominguez, G.; Tornkvist, C. Electrode influence on DC conductivity measurements of low density polyethylene. In Proceedings of the IEEE International Conference on Solid Dielectrics, Bologna, Italy, 30 June–4 July 2013; pp. 1048–1051. [Google Scholar]
  16. Simmons, J.G.; Tam, M.C. Theory of isothermal currents and the direct determination of trap parameters in semiconductors and isulators containing arbitrary trap distributions. Phys. Rev. B 1973, 7, 3706–3713. [Google Scholar] [CrossRef]
  17. Baudoin, F.; Roy, S.L.; Teyssedre, G.; Laurent, C. Bipolar charge transport model with trapping and recombination: An analysis of the current versus applied electric field characteristic in steady state conditions. J. Phys. D Appl. Phys. 2008, 41, 025306. [Google Scholar] [CrossRef]
  18. Mizutani, T.; Suzuoki, Y.; Ieda, M. Thermally stimulated currents in polyethylene and ethylene-vinyl-acetate copolymers. J. Appl. Phys. 1977, 48, 2408–2413. [Google Scholar] [CrossRef]
  19. Pelissou, S.; St-Onge, H.; Wertheimer, M.R. Electrical conduction of polyethylene below and above its melting point. IEEE Trans. Electr. Insul. 1988, 23, 325–333. [Google Scholar] [CrossRef]
  20. Kitani, I.; Arii, K. Anomalous discharge current in polyethylene (PE), ethylene-vinyl-acetate copolymer (EVA) and PE-EVA laminated films. Jpn. J. Appl. Phys. 1985, 24, 285–288. [Google Scholar] [CrossRef]
  21. Mark, P.; Helfrich, W. Space-charge-limited currents in organic crystals. J. Appl. Phys. 1962, 33, 205–215. [Google Scholar] [CrossRef]
  22. Boudou, L.; Guastavino, J. Influence of temperature on low-density polyethylene films through conduction measurement. J. Phys. D Appl. Phys. 2002, 35, 1555–1561. [Google Scholar] [CrossRef]
  23. Taylor, D.M.; Lewis, T.J. Electrical conduction in polyethylene terephthalate and polyethylene films. J. Phys. D Appl. Phys. 1971, 4, 1346–1357. [Google Scholar] [CrossRef]
  24. Ieda, M.; Sawa, G.; Kato, S. A consideration of Poole–Frenkel effect on electric conduction in insulators. J. Appl. Phys. 1971, 42, 3737–3740. [Google Scholar] [CrossRef]
  25. Adamec, V.; Calderwood, J.H. Electrical conduction in dielectrics at high fields. J. Phys. D Appl. Phys. 1975, 8, 551–560. [Google Scholar] [CrossRef]
  26. Nath, R.; Kaura, T.; Perlman, M.M. Steady-state conduction in linear low-density polyethylene with Poole-lowered trap depth. IEEE Trans. Electr. Insul. 1990, 25, 419–425. [Google Scholar] [CrossRef]
  27. Kitani, I.; Tsuji, Y.; Arii, K. Analysis of anomalous discharge current in low-density polyethylene. Jpn. J. Appl. Phys. 1984, 23, 855–860. [Google Scholar] [CrossRef]
  28. Le Roy, S.; Teyssedre, G.; Laurent, C.; Montanari, G.C.; Palmieri, F. Description of charge transport in polyethylene using a fluid model with a constant mobility: Fitting model and experiments. J. Phys. D Appl. Phys. 2006, 39, 1427–1436. [Google Scholar] [CrossRef]
  29. Lindmayer, J. Current transients in insulators. J. Appl. Phys. 1965, 36, 196–201. [Google Scholar] [CrossRef]
  30. Hoang, A.T.; Nguyen, Q.D.; Wirges, W.; Gerhard, R.; Serdyuk, Y.V.; Gubanski, S.M. Open-circuit thermally stimulated currents in LDPE/Al2O3 nanocomposite. In Proceedings of the IEEE Conference on Electrical Insulation and Dielectric Phenomena (CEIDP), Toronto, ON, Canada, 16–19 October 2016; pp. 611–614. [Google Scholar]
  31. Ishimoto, K.; Tanaka, T.; Ohki, Y.; Sekiguchi, Y.; Murata, Y. Thermally stimulated current in low-density polyethylene/MgO nanocomposite. On the mechanism of its superior dielectric properties. Electr. Eng. Jpn. 2011, 176, 1–7. [Google Scholar] [CrossRef]
Figure 1. Time dependencies of charging current densities measured at various electric fields (in kV/mm) indicated in the legend; (a) low-density polyethylene (LDPE), 60 °C and (b) LDPE/Al2O3 3 wt% nanocomposite, 80 °C. Arrows show the variation with the increasing field strength.
Energies 13 01518 g001
Figure 2. Temperature dependencies of the isochronal current densities recorded at 3 h (1.08 × 10⁴ s) for (a) LDPE and (b) LDPE/Al2O3 3 wt% nanocomposite at different applied electric fields (in kV/mm) - markers are the measured points, whereas lines represent the fitting. Arrows show the variation with the increasing field strength.
Energies 13 01518 g002
Figure 3. Characteristics of isochronal current densities versus applied electric field for LDPE and LDPE/Al2O3 3 wt% nanocomposite (denoted respectively as PE and NC) at various temperatures. Markers are the measured points, whereas lines represent the fittings.
Energies 13 01518 g003
Figure 4. Time dependencies of discharge current densities measured after charging at the indicated electric field levels (in kV/mm); (a) LDPE, 60 °C and (b) LDPE/Al2O3 3 wt% nanocomposite, 80 °C. Arrows show the variation of the currents with the increasing field strength.
Energies 13 01518 g004
Figure 5. Plots of I × t vs. log(t) for discharge currents measured in pure LDPE at 60 °C. The inset shows the field dependence of the peak values I × t.
Energies 13 01518 g005
Figure 6. (a) Schottky plots (field-dependent currents) and (b) Poole–Frenkel plots (field-dependent conductivities) for reference LDPE and LDPE/Al2O3 3 wt% nanocomposite at various temperatures. Markers are measured results and lines are introduced for fitting.
Energies 13 01518 g006
Figure 7. Plots of J vs. E for pure LDPE and LDPE/Al2O3 3 wt% nanocomposite according to the Nath et al. model [26]. Markers are measured results and lines show the fitting.
Energies 13 01518 g007
Figure 8. Schematic representation of charge generation and transport of the model used in present study; (a) pure LDPE and (b) nanofilled LDPE. Symbols Te,h denote trapping, DTe,h — de-trapping, and Reh,ehtr,etrh,etrhtr — recombination processes.
Energies 13 01518 g008aEnergies 13 01518 g008b
Figure 9. (a) Simulated discharge currents in studied materials at different temperatures. The inset displays the magnification of the plot including discharge currents at 60 °C. (b) Magnitude of simulated positive and negative current components in studied materials at 60 °C. Arrows indicate the reduction in magnitude of the current components due to the suppression of electrical conduction in the nanocomposite.
Energies 13 01518 g009
Figure 10. Temporal distributions of simulated electric field in pure LDPE during discharging stage at 80 °C: z1 and z2 are the zero-field points. The inset and its arrows show the temporal displacement of the left zero field point (z1).
Energies 13 01518 g010
Table 1. Peak time tp of the plots of I × t vs. log(t) for discharge currents and corresponding trap energy calculated by Equation (3).
MaterialTest temperature, °CPeak time tp, sTrap energy, eV
LDPE40
60(1–1.5) × 1041.10
80(5–6) × 1021.09
LDPE/Al2O3 3 wt% nanocomposite40
60(2–3) × 1041.14
80(2–3) × 1031.14
Table 2. Test conditions for anomalous discharge current (ADC) appearance and ADC parameters – current peak and time peak. Lack of data filled in the table means no ADC observed.
MaterialTest temperature,
°C
Electric field for ADC
appearance, kV/mm
ADC peak,
A/mm2
ADC time
peak, s
LDPE40
60
8020–60(2.1–5.6) × 10−14170–230
LDPE/Al2O3 3 wt%
nanocomposite
40
6025–35(2.5–6.0) × 10−164350–5830
8025–47.5(0.1–1.3) × 10−14580–1370
Table 3. Fitting parameters in different conduction models. Note that the obtained values of the relative permittivity εr below 1 do not have physical significance.
Conduction ModelCalculated
Parameters
LDPELDPE/Al2O3 3 wt%
40 °C60 °C80 °C40 °C60 °C80 °C
JEmm2.332.081.34/3.725.235.495.75
Schottkyεr3.523.606.05/1.300.730.590.47
Poole–Frenkelεr11.313.191.7/2.431.120.880.69
Table 4. Fitting parameters obtained by using the Nath et al. model [26].
MaterialLDPELDPE/Al2O3 3 wt%
Temperature, °C406080406080
λ, nm1.411.511.765.176.306.99
µθ0, m2V−1s−13.14 × 10−161.01 × 10−151.42 × 10−151.64 × 10−182.31 × 10−184.07 × 10⁻¹⁸
Table 5. Trap site separation λ in LDPE.
Material λ, nmReference
LLDPE2.8Nath et al. [26]
LDPE2–3Boudou and Guatavino [22]
Table 6. Parameters of the charge transport model used in the present study.
ParameterUnitTemperature, °C
6080
Schottky injection barrier, φeV1.16
Effective mobility, µm2V−1s−15 × 10−141.5 × 10⁻¹³
Trapping coefficient, ttrs−10.10.2
Deep trap density, Ntrm−36.25 × 10²⁰
De-trapping barrier height, φtreV1.0
Recombination coefficients,
reh, rehtr, retrhm3s−18 × 10−22
retrhtr 0

