2. Voltage Fluctuations
In the case of arc furnaces, we can talk about stochastic changes in both the amplitude and frequency of fluctuations, and the range of these changes is influenced by many factors. In the case of voltage fluctuations caused by arc furnaces, there is no periodicity of fluctuations, so it is used to determine the frequency of changes per unit of time, e.g., several changes per second. With the frequency of changes ranging from a few to a dozen or so per second, identifying and assessing voltage fluctuations caused by arc devices becomes an extremely complex issue.
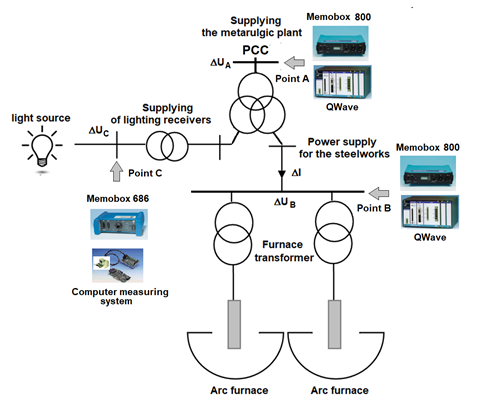
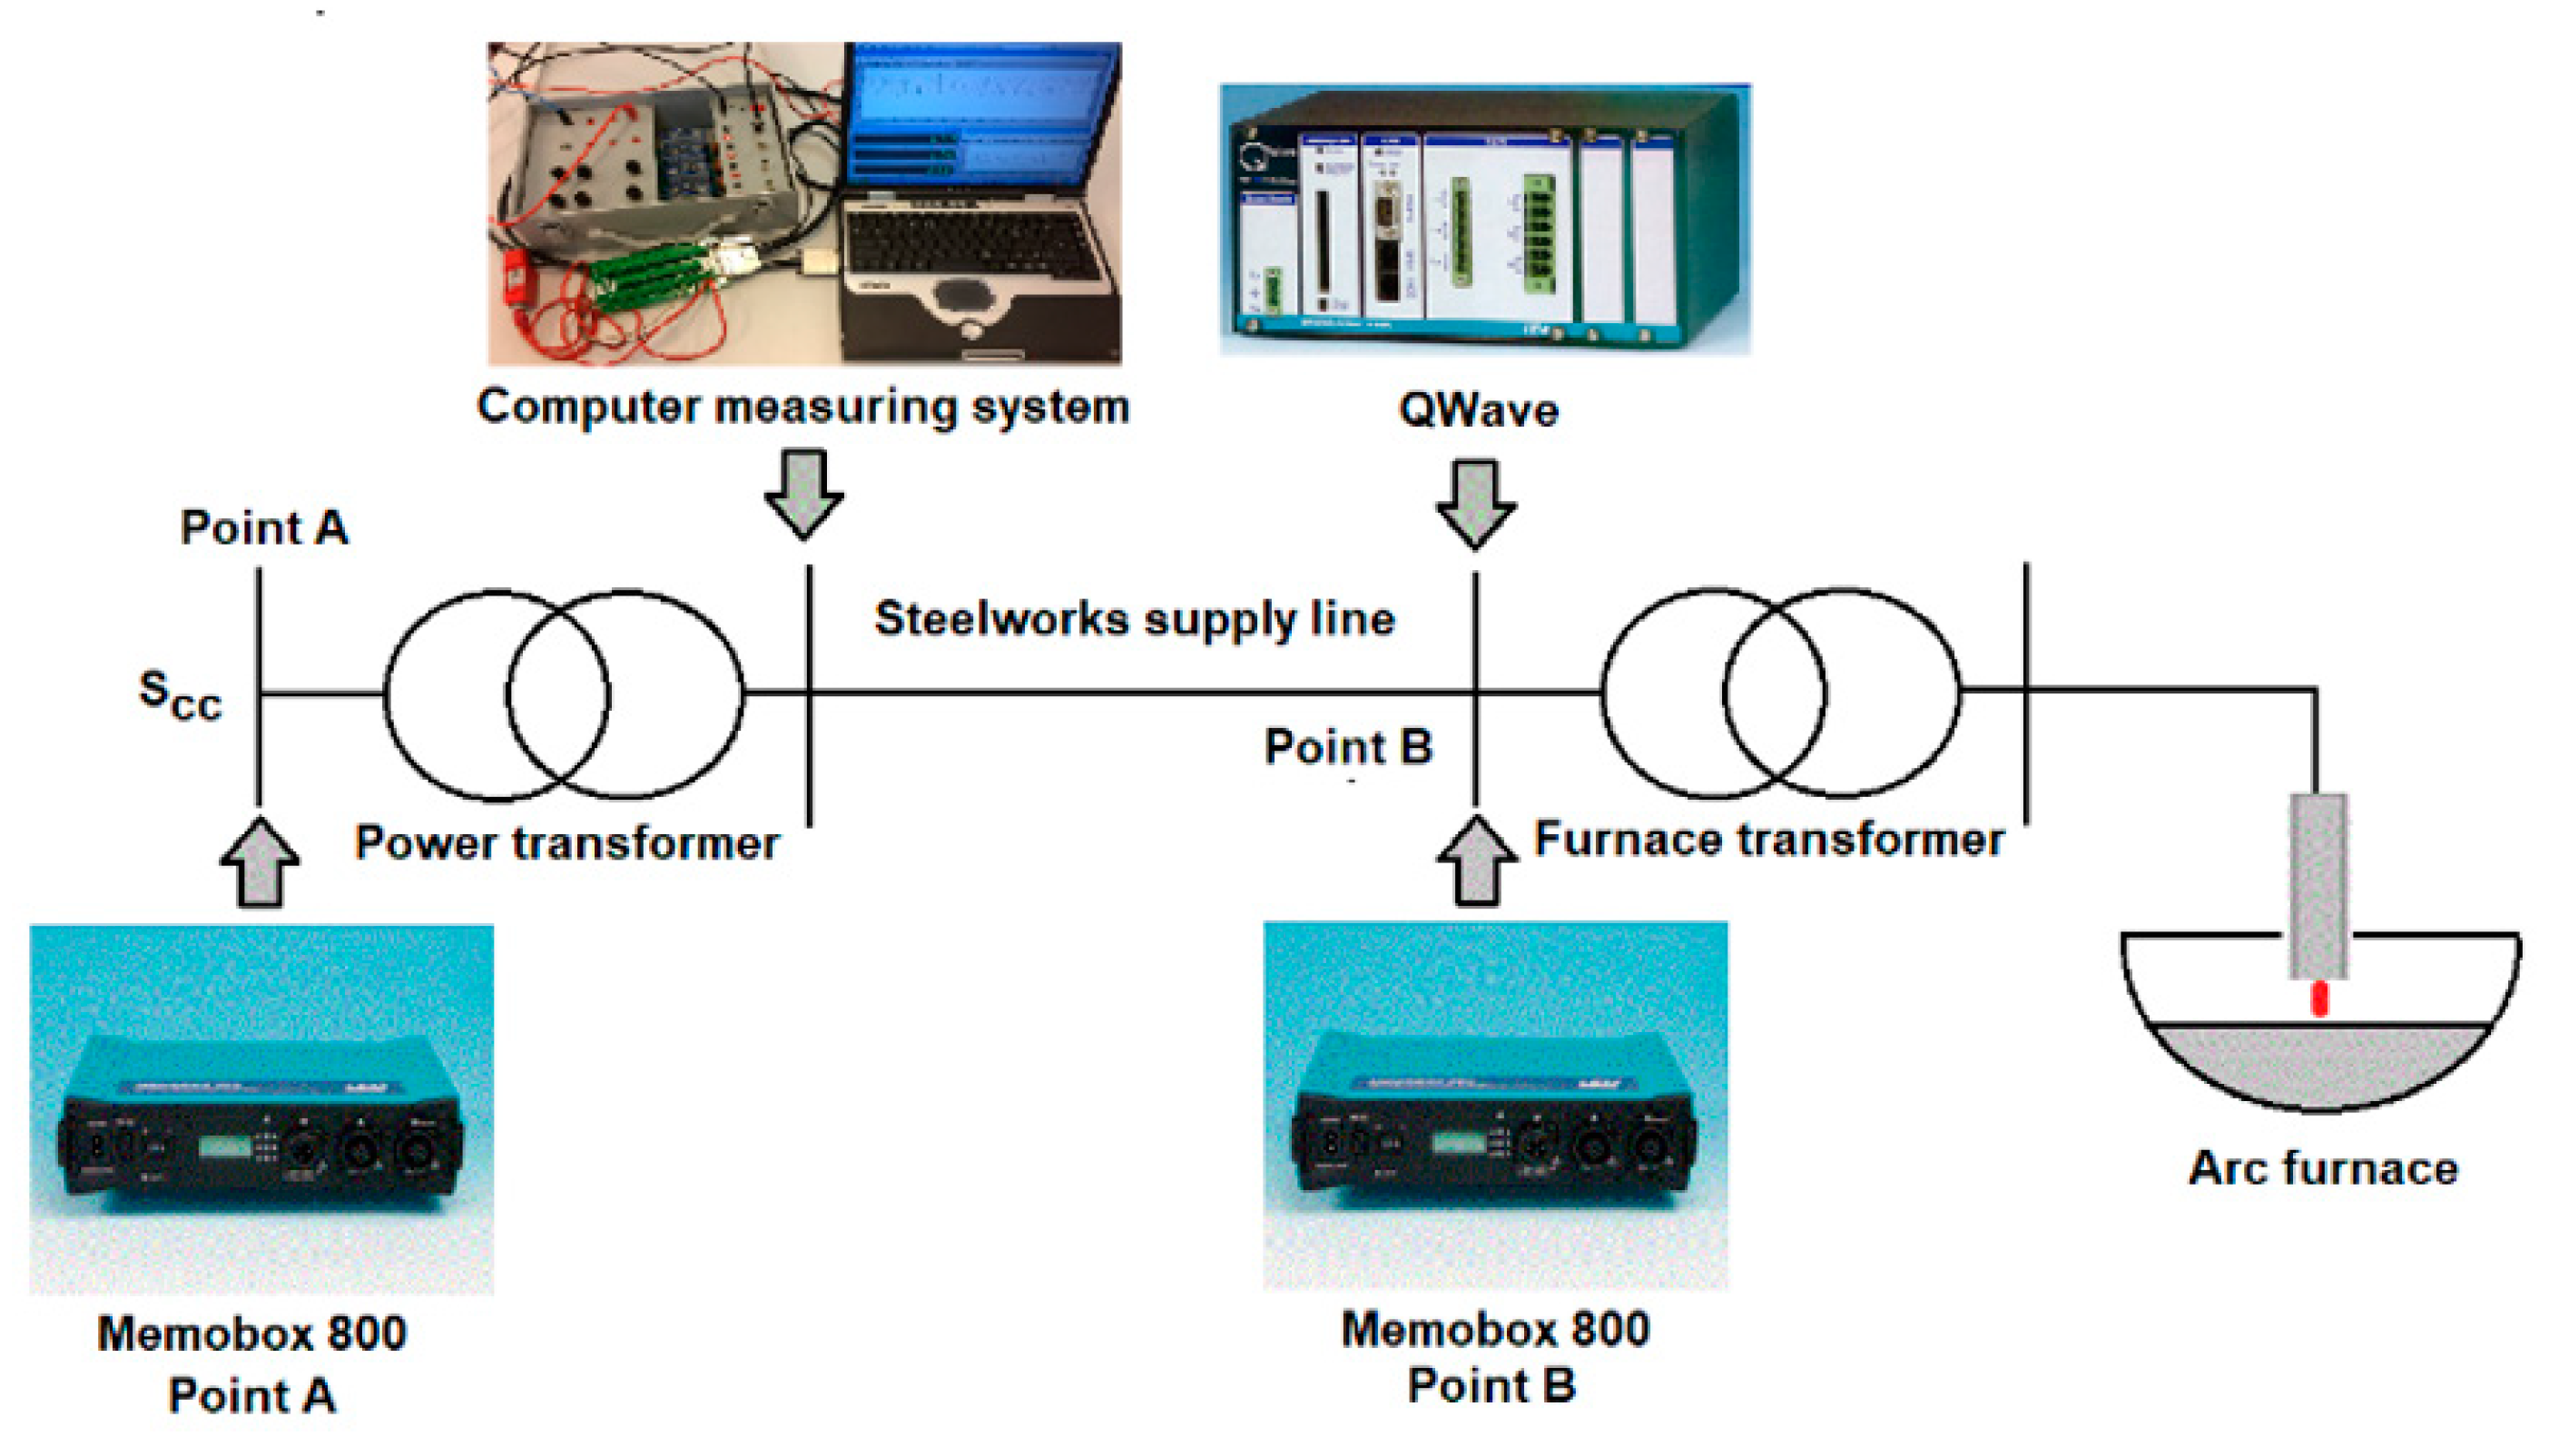
To estimate voltage fluctuations at different voltage levels, measurements were carried out at two points: A: the steel mill power supply, HV; and B: the steel mill power supply, MV; as seen in
Figure 1.
Voltage changes as defined in formula1 now represent the difference between the largest and smallest effective value recorded in the five-second measurement window, expressed as a percentage of the rated voltage UN.
Voltage changes from
UA to
UB determine fluctuations:
or are expressed as a percentage of the supply voltage:
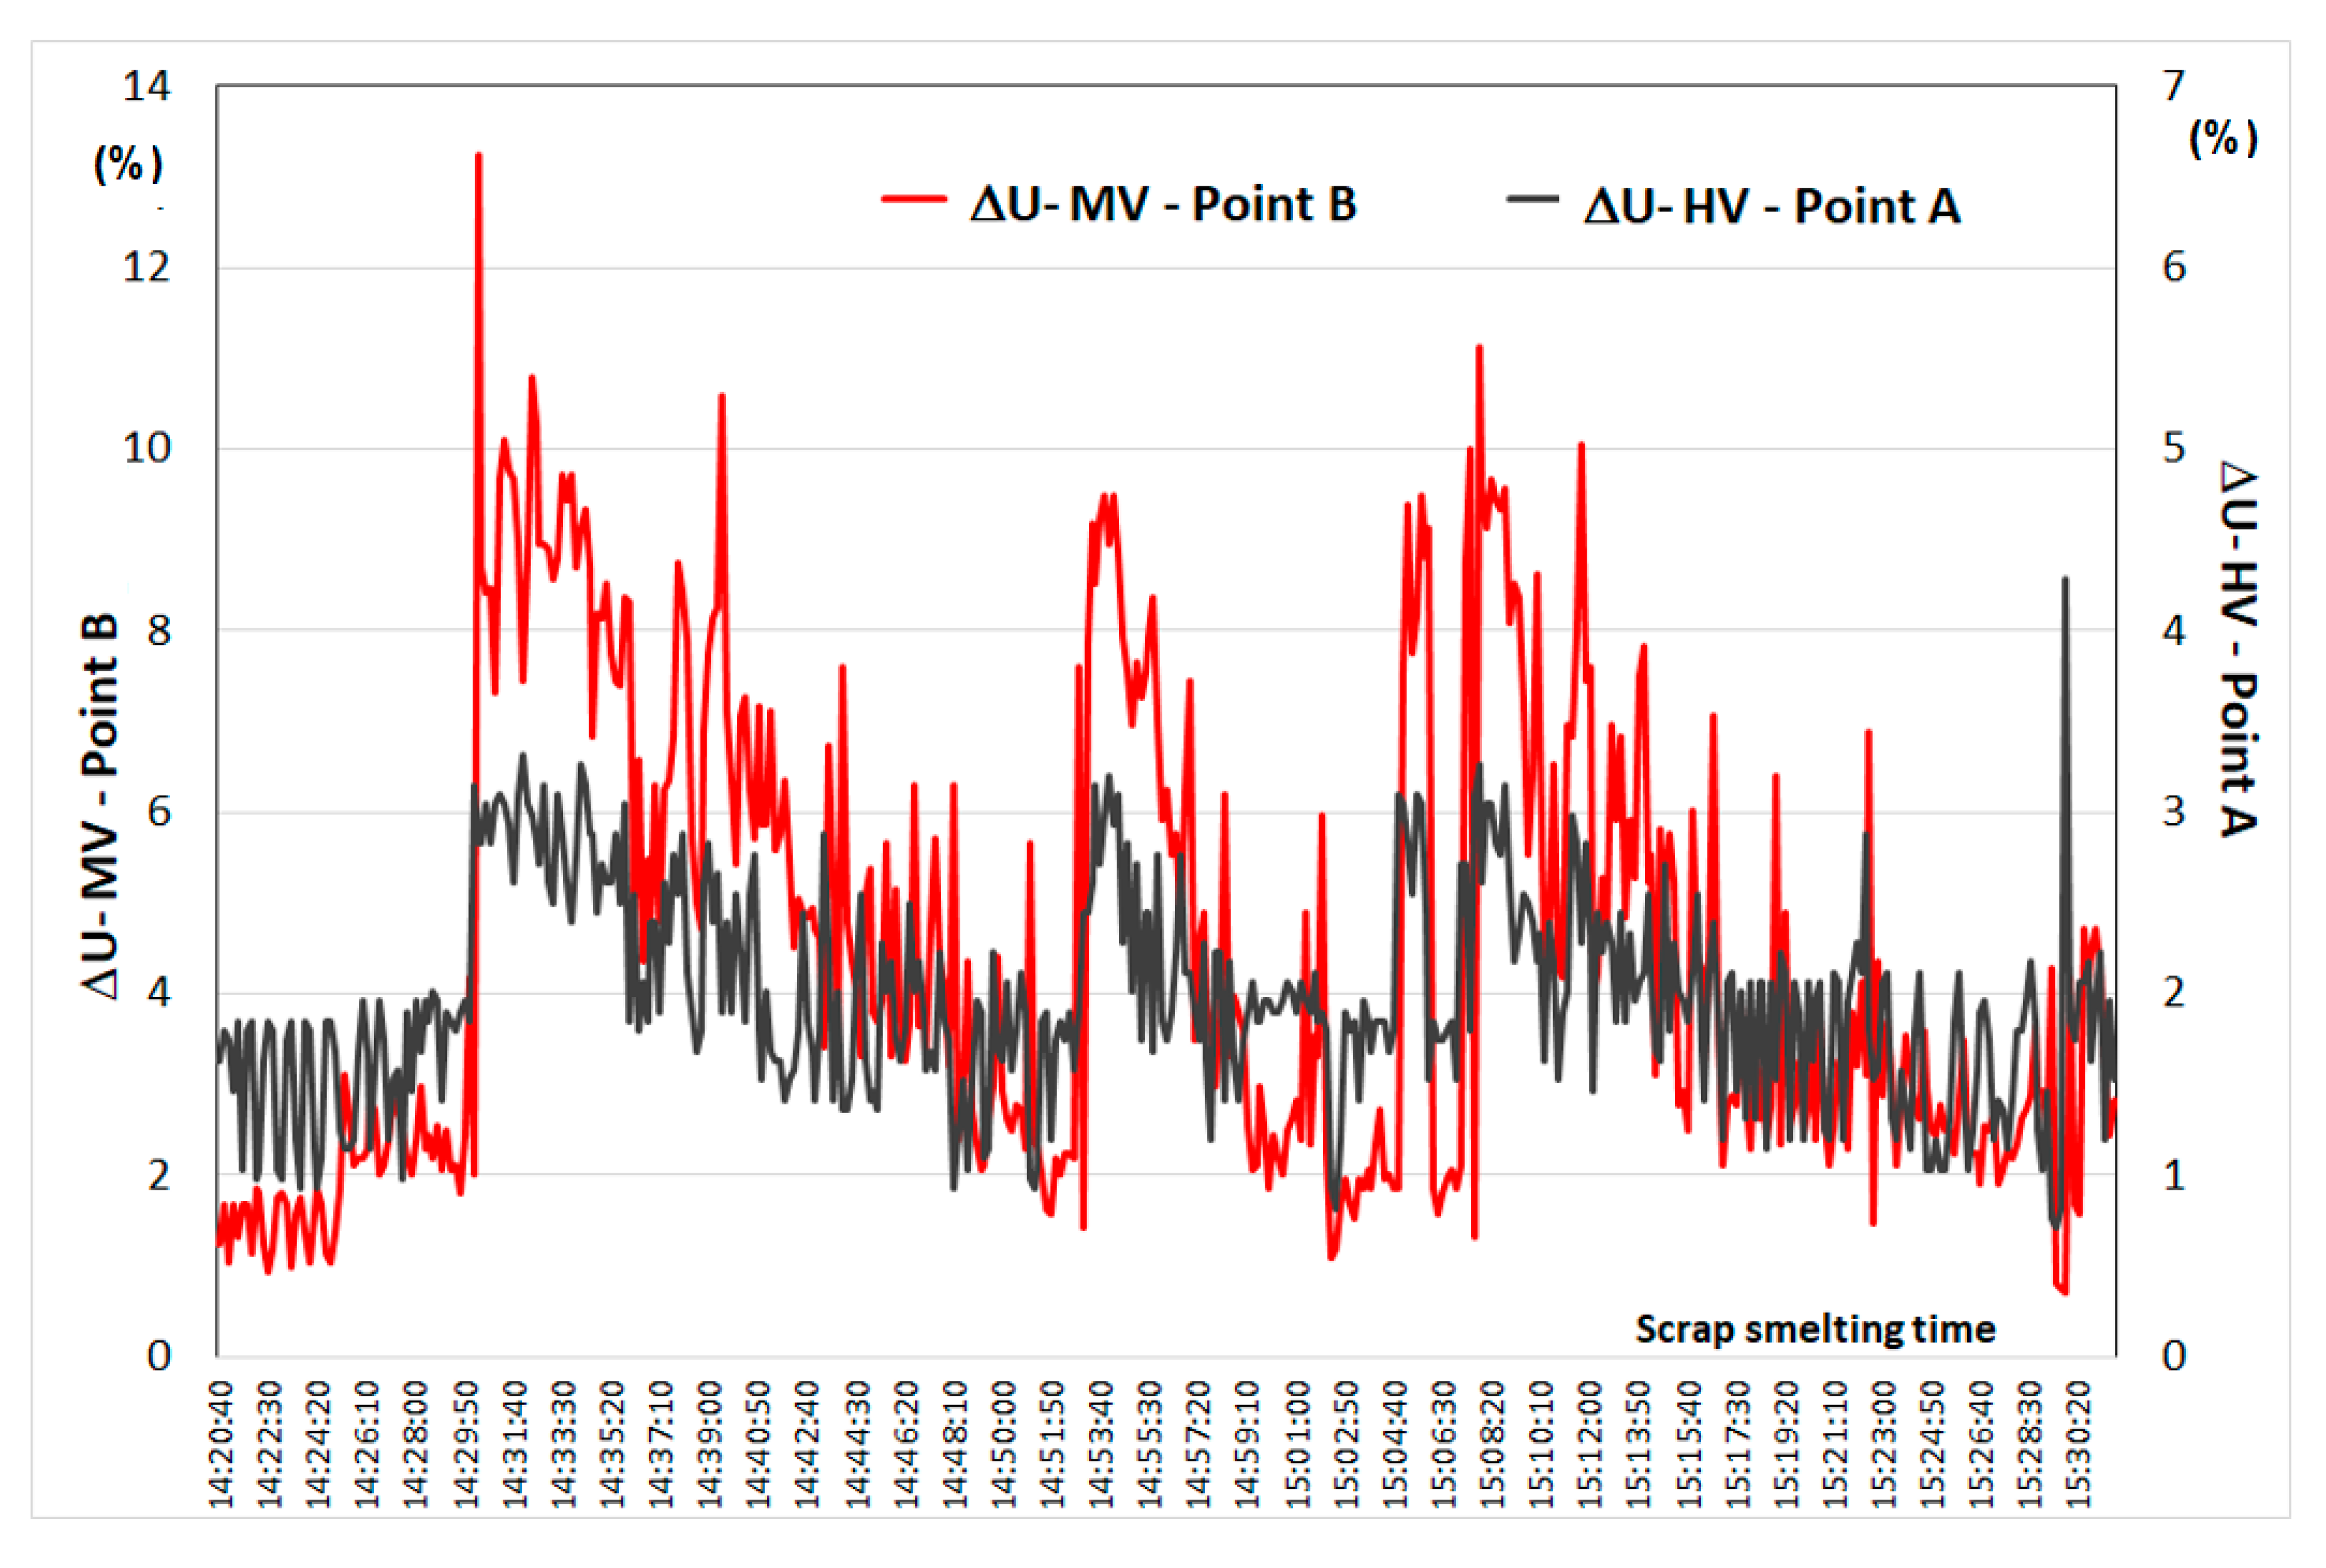
Steel mains supply voltage fluctuates between 90% and 104% of the rated voltage. The biggest fluctuations occur after turning the furnace on and after loading the next scrap bins. The range of voltage fluctuations in the HV network is 3.5%
UN and in the MV network 14%
UN, with an attenuation factor between THE HV and MV of 0.8, hence it can be assumed that the increase in voltage fluctuations is inversely proportional to the change in the short circuit power of the network, as shown in
Figure 2.
Voltage fluctuations are propagated to the mains and other lines inside the smelter, including lighting circuits. Changes in the voltage supplying the lighting receivers cause changes in the luminous flux, which at a given amplitude and frequency of changes are perceived by the human eye, causing the negative effects described above.
Luminous flux changes resulting from voltage fluctuations are referred to as flashing light. Flicker is a phenomenon that is purely physiological. Voltage fluctuations, causing a perceptible flickering of light, are very difficult to determine objectively. Flicker, to which the eye of one person is sensitive, may be unnoticed by another person [
31,
32,
33,
34,
35,
36]. The type of light source may also play a fundamental role in the perception of flickering [
37,
38,
39,
40,
41]. At a certain amplitude and frequency of changes in voltage fluctuations, flickering light causes nervousness in people, reaching the level of irritation, beyond which most people are not able to do any work related to the perception of objects of small dimensions, poorly contrasting with the surrounding background. In some cases, flickering can trigger epilepsy attacks [
42].
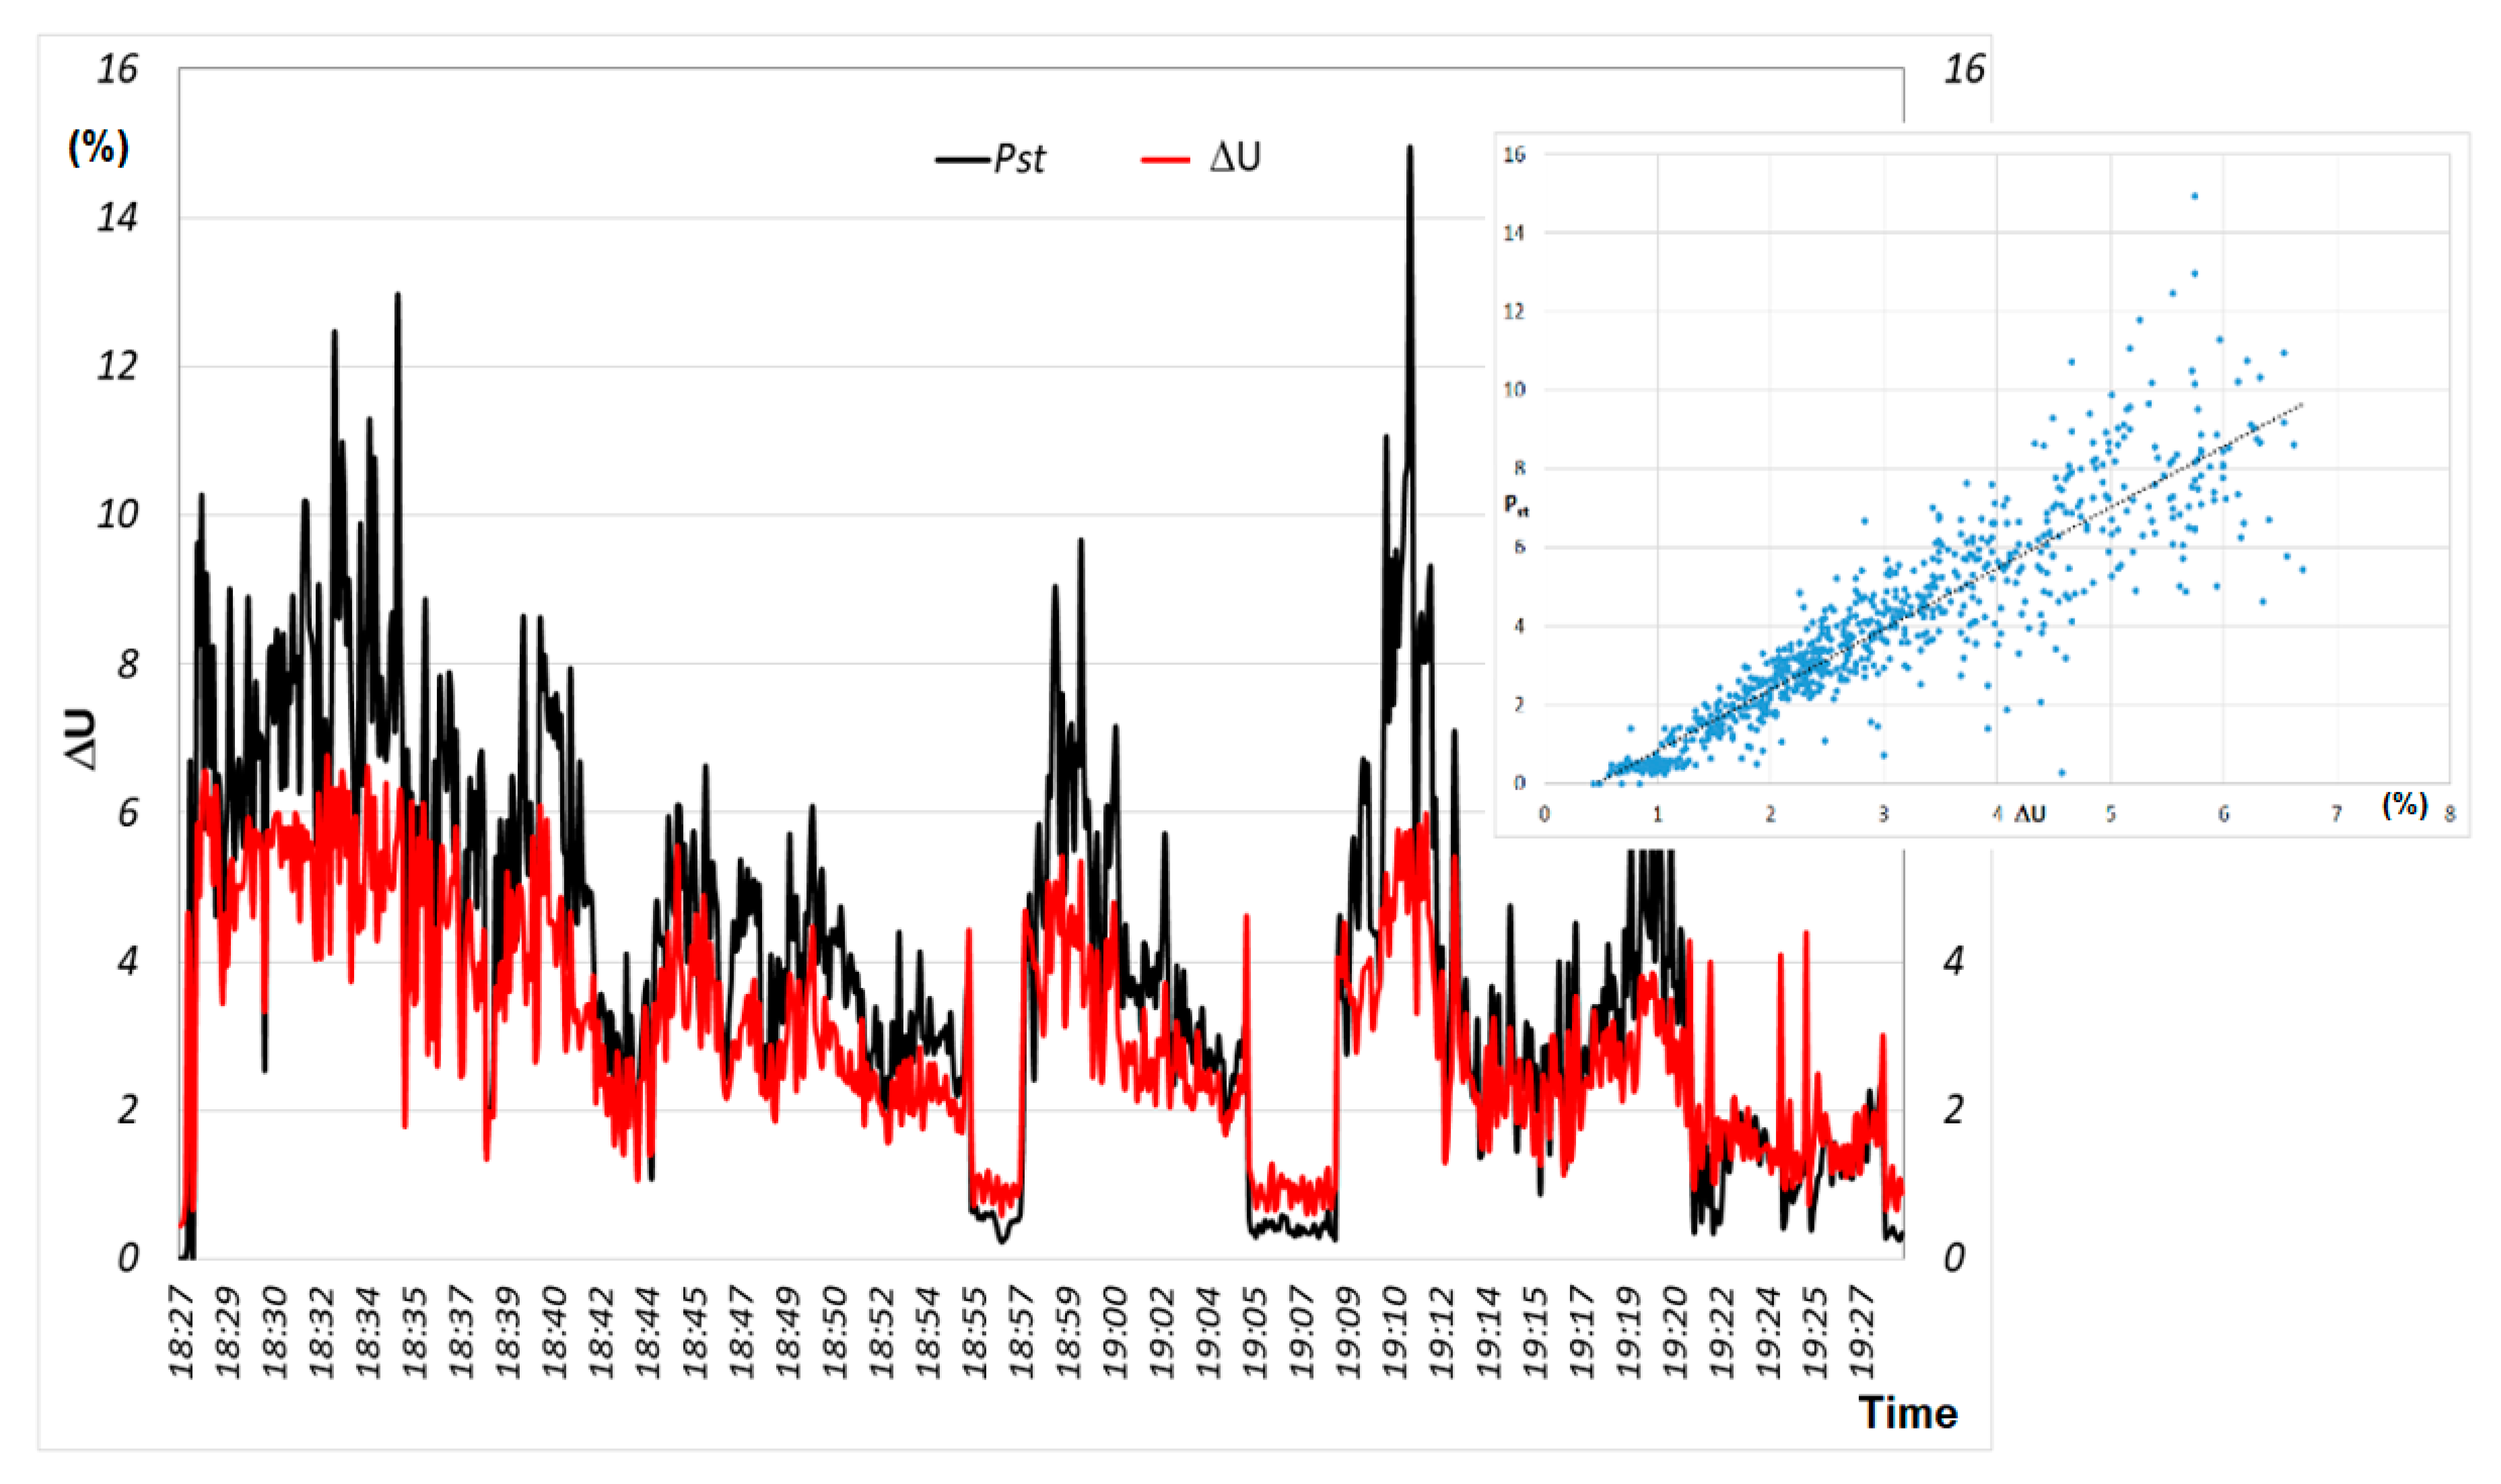
It is reasonable to determine the relationship between voltage fluctuations and the severity of flickering light. Assuming that the frequency of voltage fluctuations generated by arc furnaces changes to a small extent, it can be stated that the increase in voltage fluctuations causes a proportional increase in light flickering. This thesis is confirmed by the results of the measurements of light flicker indicators and voltage fluctuations made in the network supplying arc furnaces.
Figure 3 presents changes in voltage fluctuations and the
Pst indicator recorded during melting in an arc furnace in the steel network supplying the steel plant (point B,
Figure 1).
Based on the analysis of the relationship between voltage changes and flicker indicators, it can be concluded that the increase in voltage changes causes a proportional increase in light flicker.
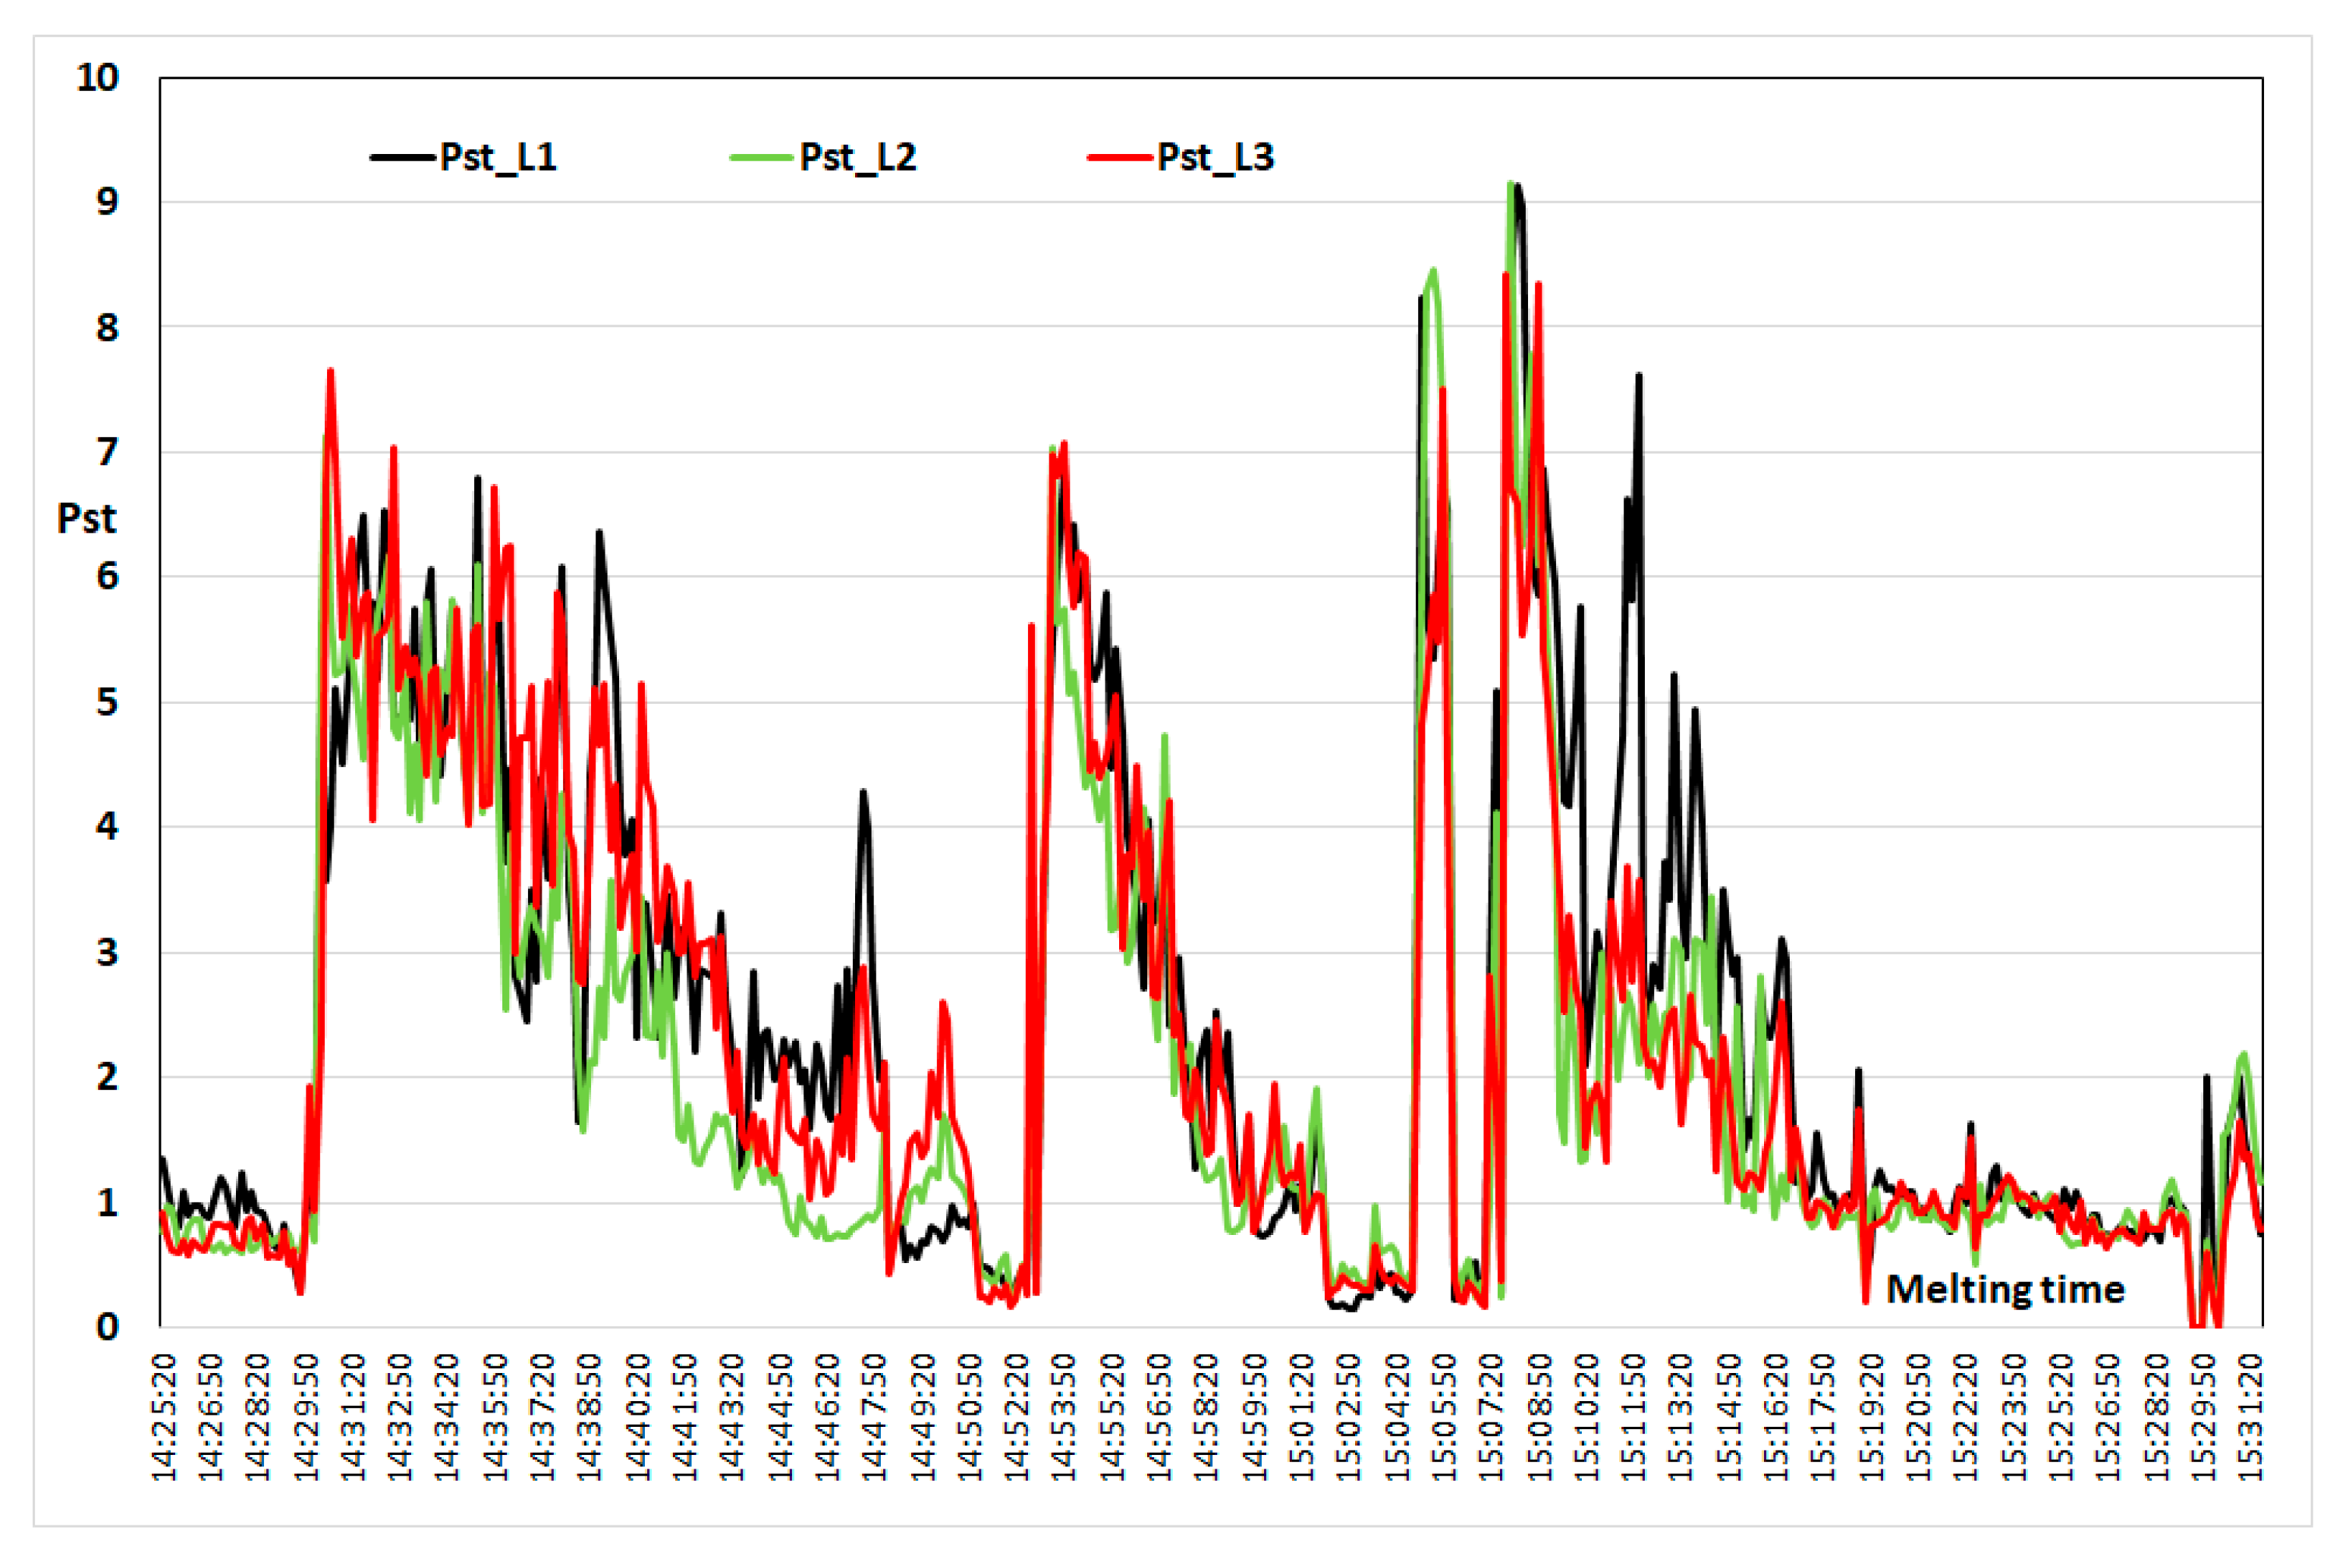
A single-phase substitute scheme is adopted in model tests for voltage fluctuations generated by arc furnaces. The adoption of such a scheme results from a large correlation of indicators characterizing the voltage distortion in individual phases (ΔU, Pst, Plt,). For example, the correlation coefficients between indicators recorded during one melt in individual phases, are, respectively: for the short-term light flicker indicator: rPst1 − Pst2 = 0.87, rPst2 − Pst3 = 0.90, rPst3 − Pst1 = 0.89, and for the long-term light flicker indicator: rPlt1 − Plt2 = 0.92, rPlt2 − Plt3 = 0.94, rPlt3 − Plt1 = 0.93, and for the voltage fluctuations: rΔUL1-L2 = 0.95, rΔUL2-L3 = 0.93, rΔUL3-L1 = 0.94.
Figure 4 presents changes in the short-term light flicker
Pst index recorded in phases L
1, L
2, L
3 during one melt in an arc furnace.
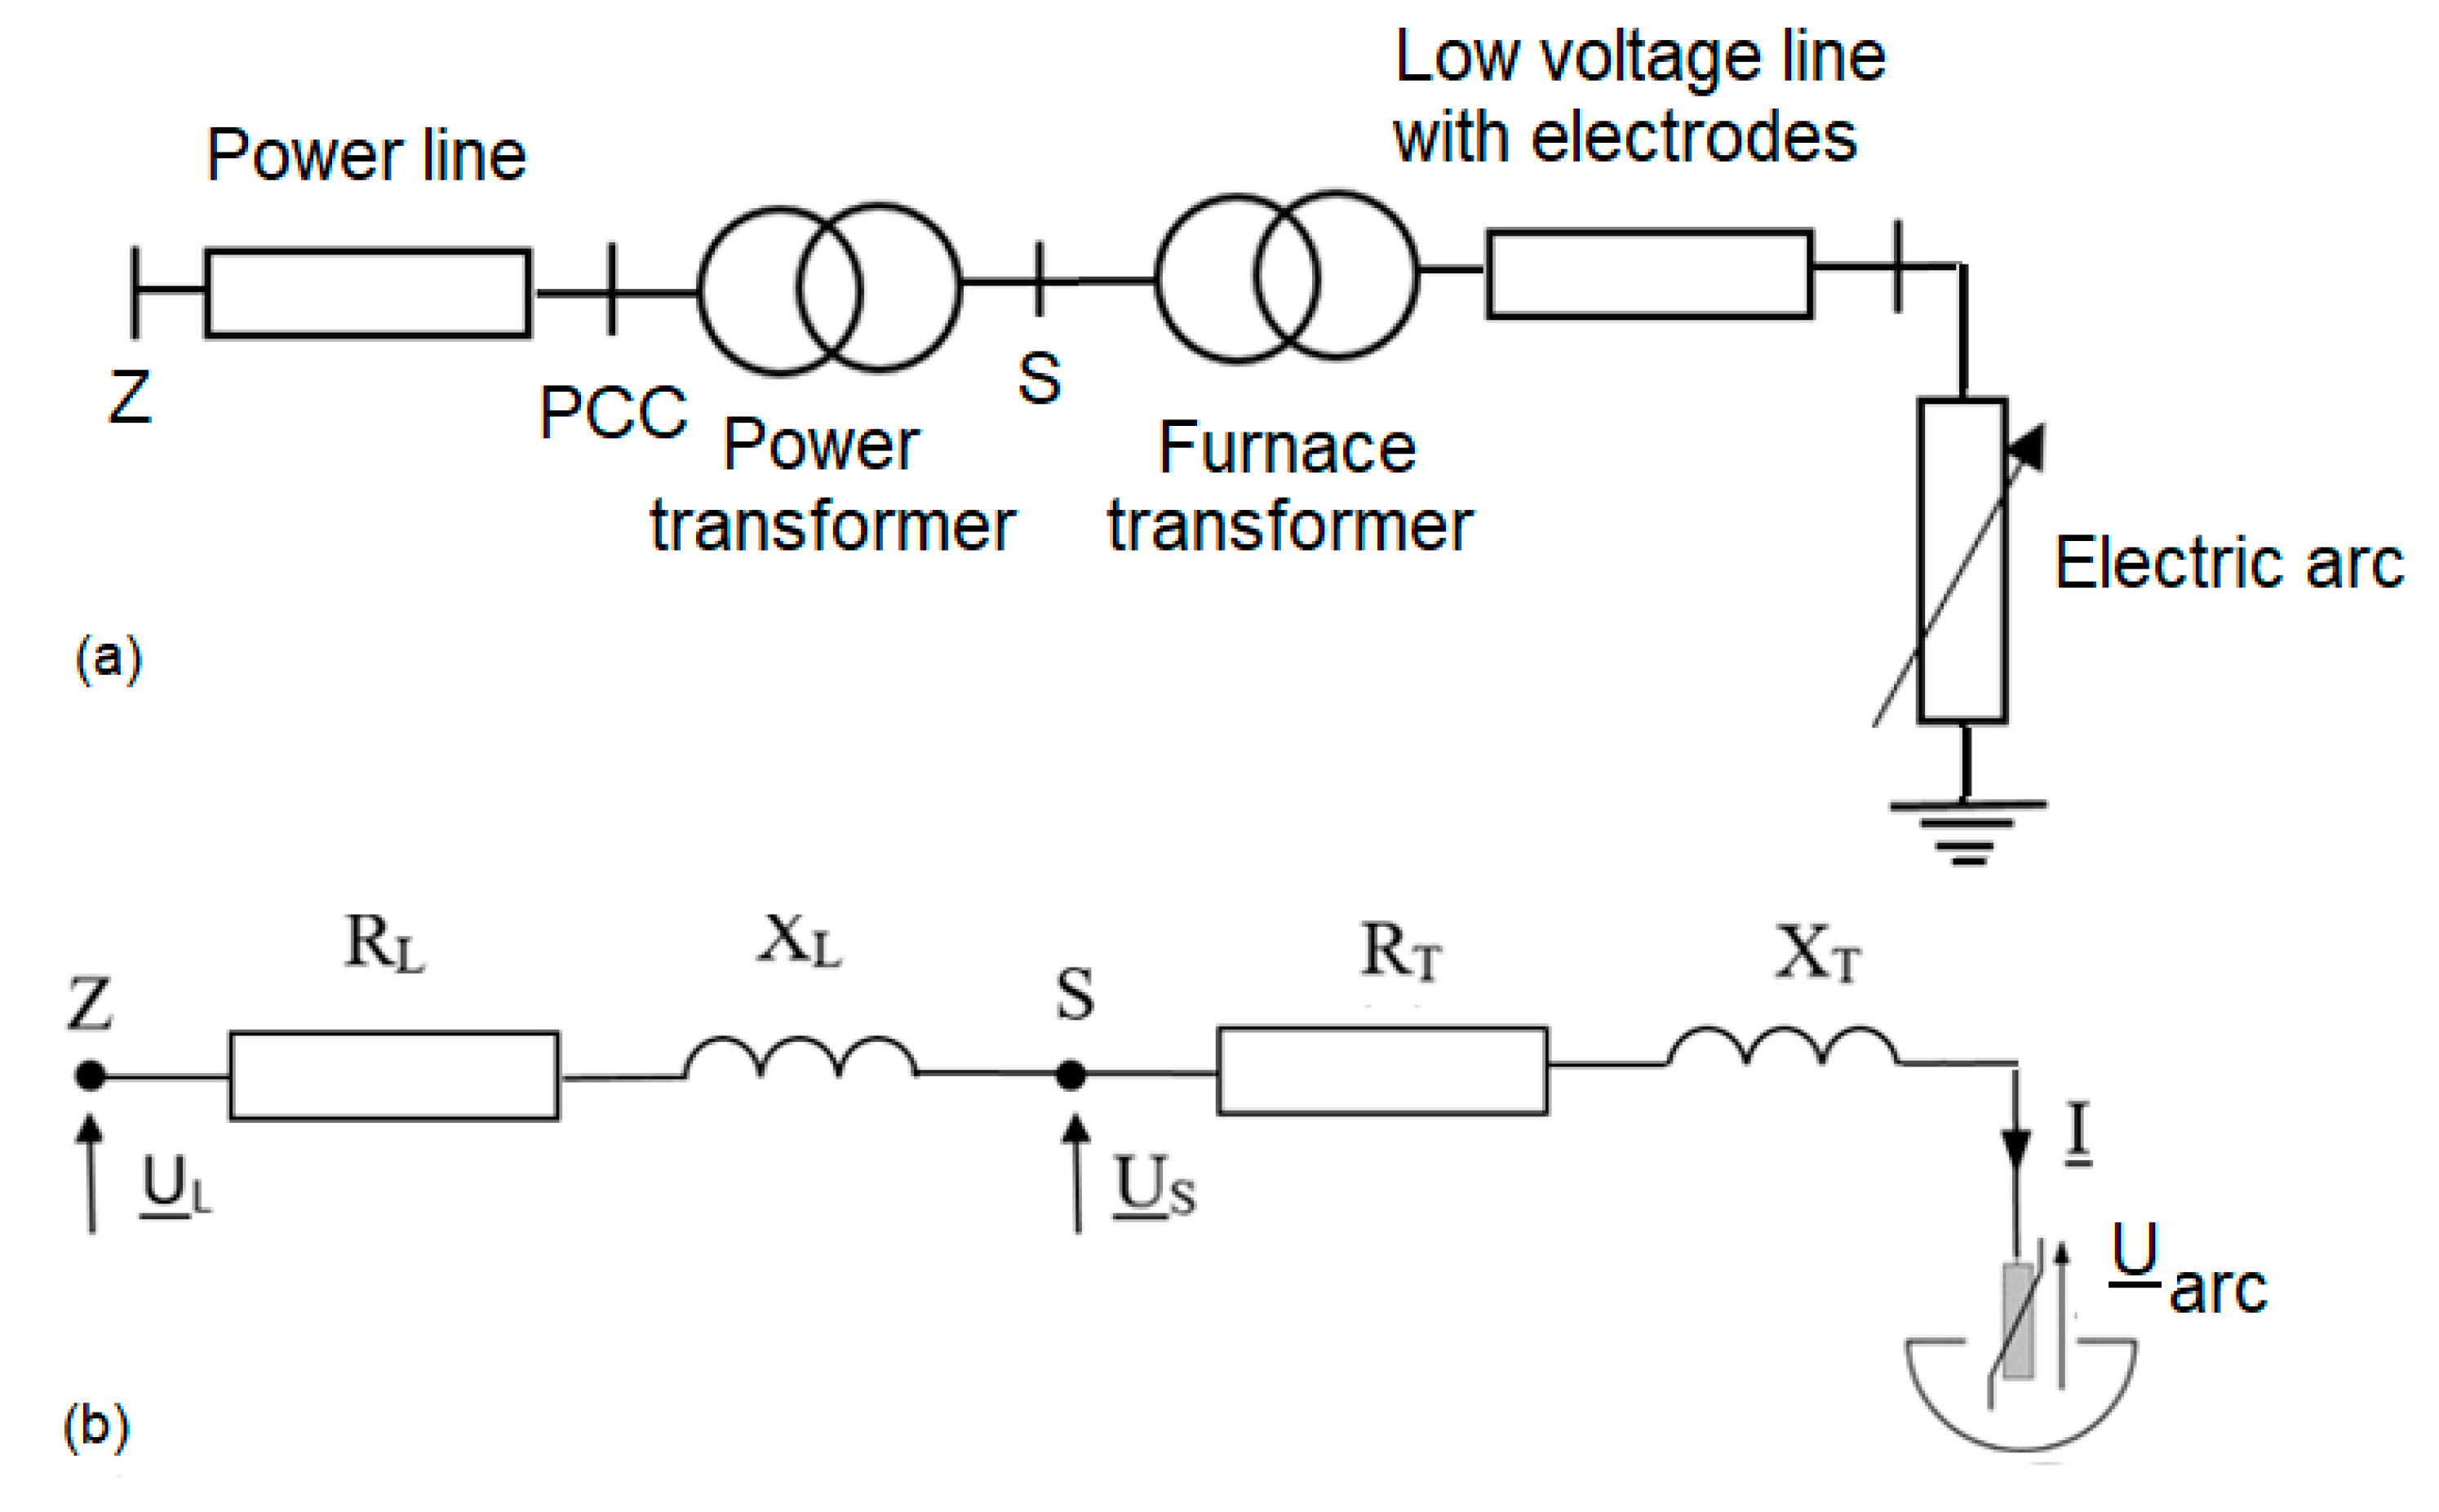
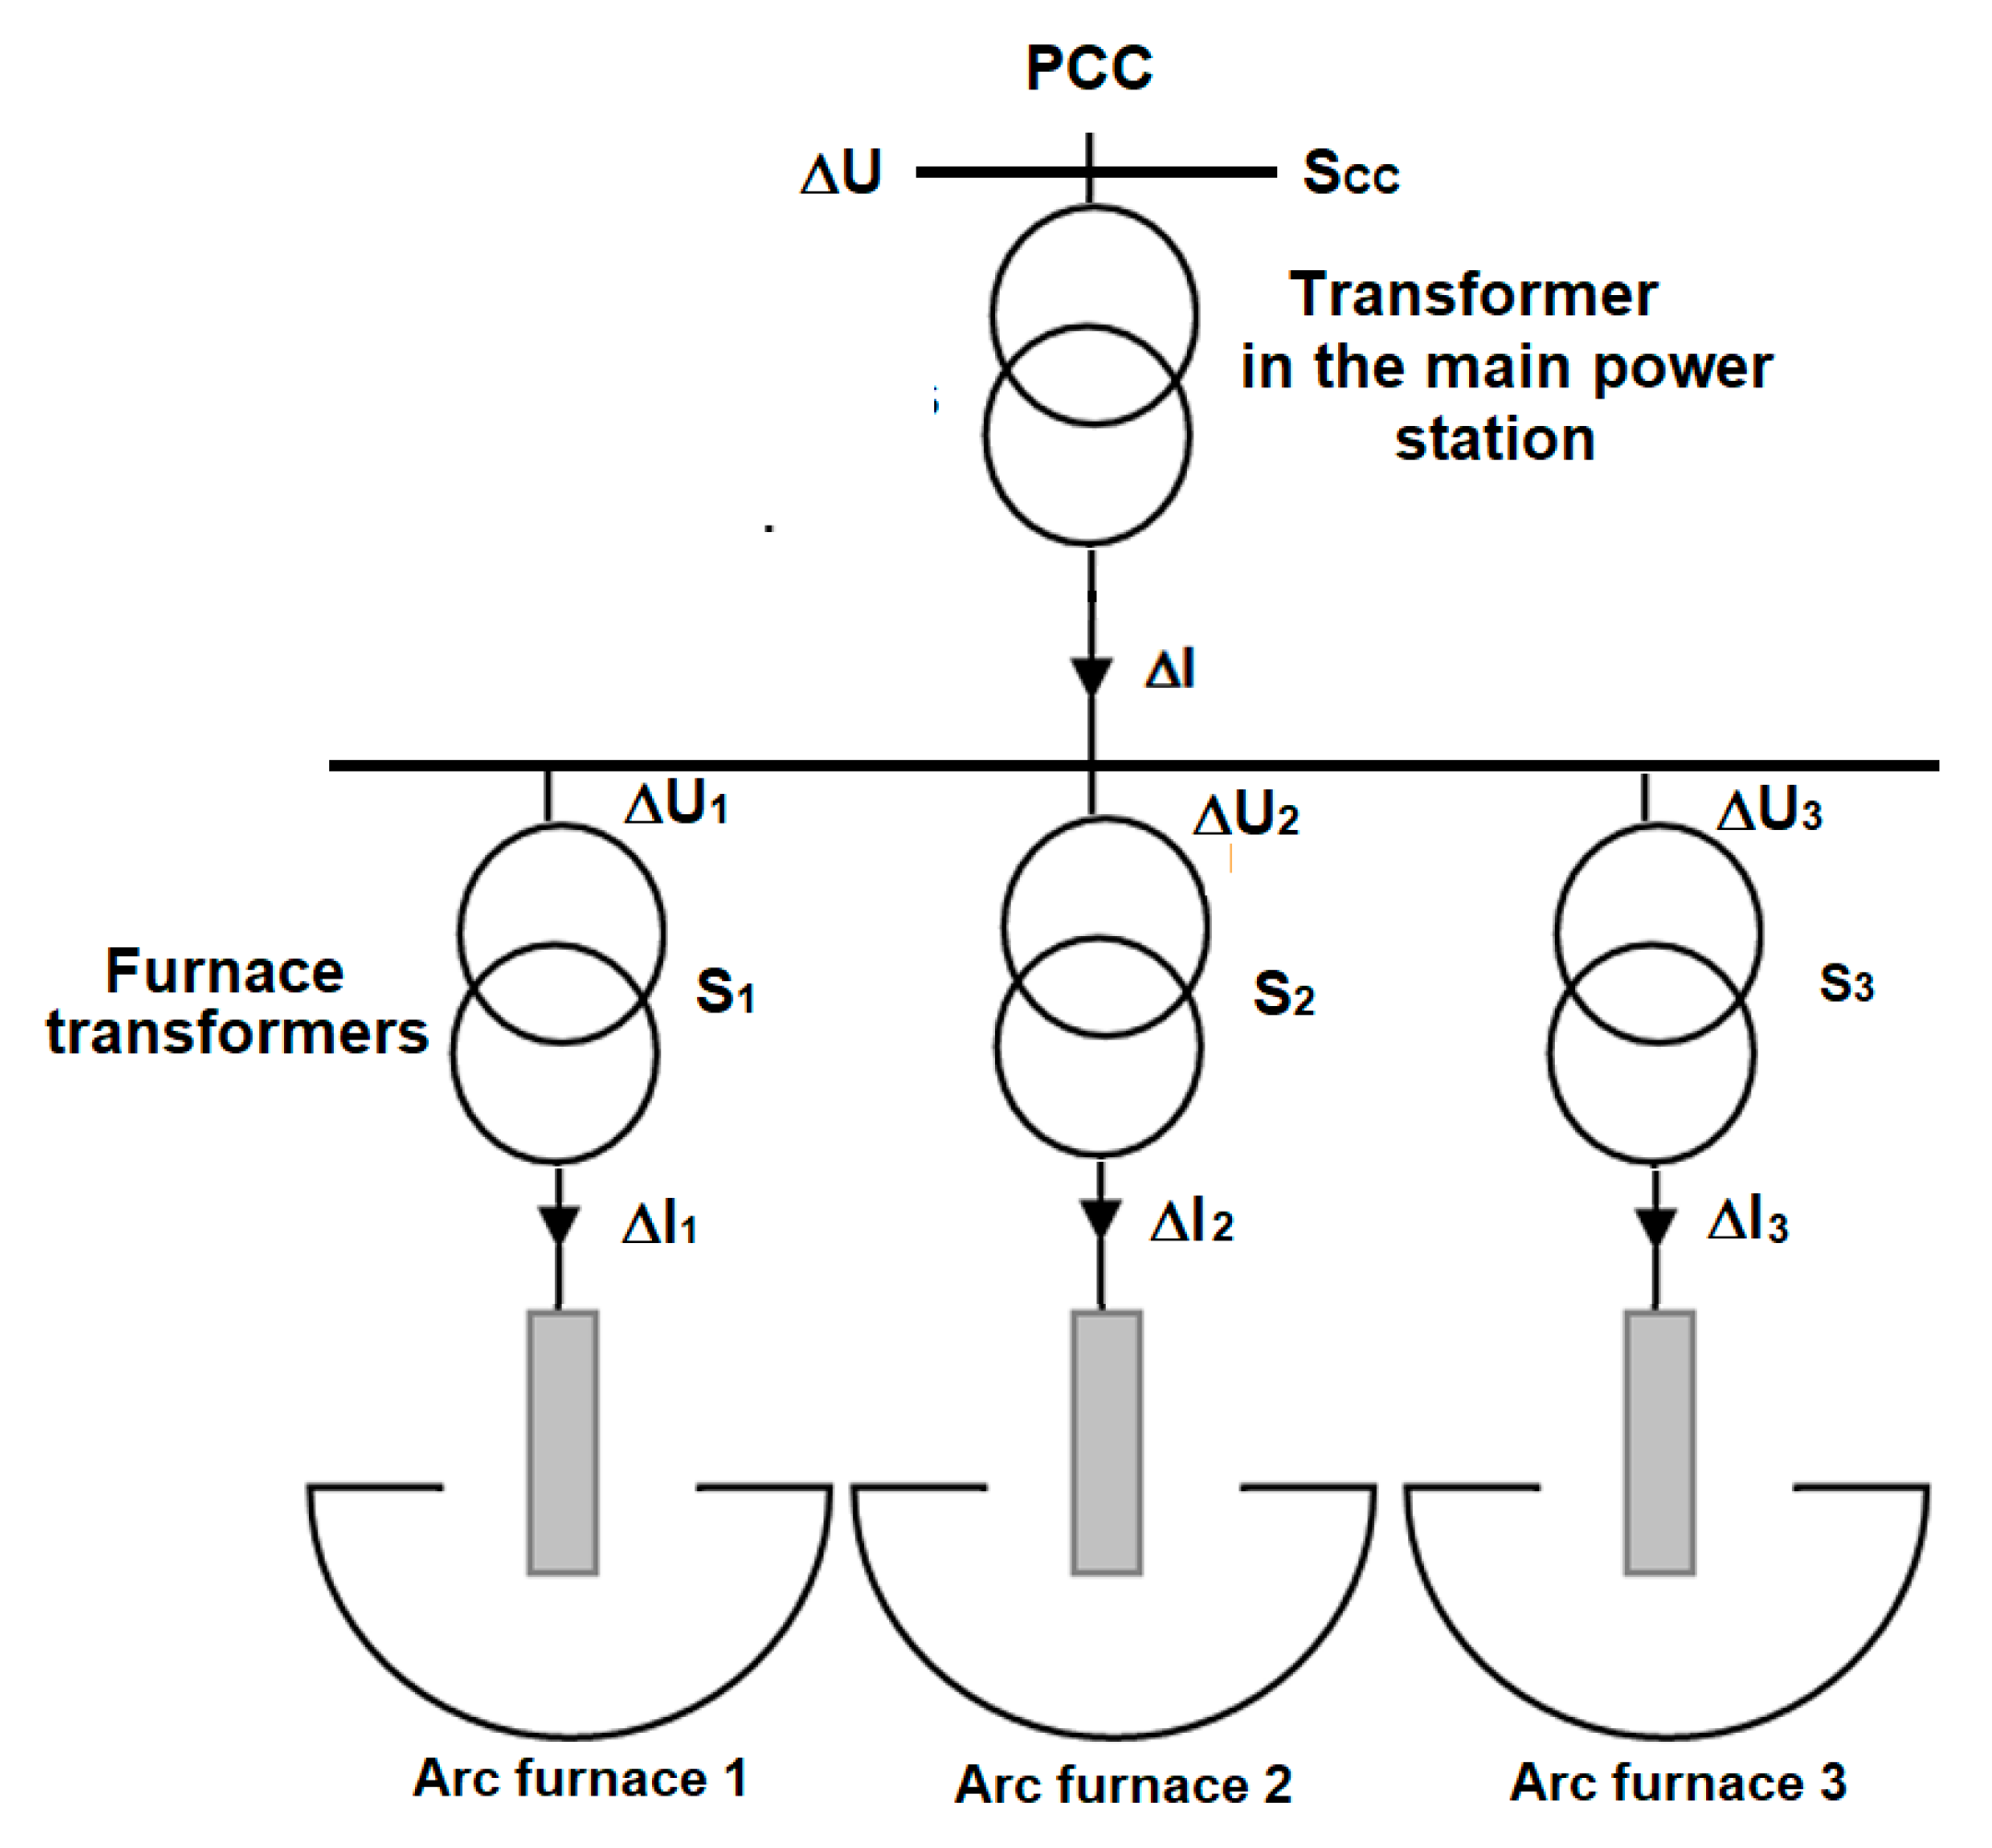
A typical arc furnace power supply system is shown in
Figure 5. The arc power supply system consists of the following elements: power supply line, often connecting the steel mill directly with the energy source (power plant); a power transformer at the main power supply point; the steel plant power supply line; and the furnace transformer with a high-current track.
The supply voltage (source)
UL was adopted as a sinusoidal reference voltage of
UL = 100%, point Z, as in
Figure 5. The application of the measure expressed as a percentage allows for independence from the voltage value expressed in volts, occurring in different furnace supply systems. This also makes it easier to compare the results obtained from model tests to the acceptable levels of energy quality indicators; e.g., changes in the effective value, fluctuations, or voltage drops given in standards or legal regulations [
43,
44].
The steel mill is supplied from a source with UL voltage, via a power supply line with RL resistance and XL reactance. The impedance value of the smelter supply line reflects the supply conditions (short-circuit power) at the PCC point.
The arc furnace power supply system consists of RT resistance and XT reactance, determining the parameters of the high-current path together with the furnace transformer.
The electric arc was simulated using a sinusoidal voltage source with an amplitude depending on the arc length, which is the basic harmonic of the arc voltage. Such a model was adopted in [
30].
The electric arc is represented by the Uarc arc voltage. As already mentioned, the arc was simulated using an ideal sinusoidal voltage source with an amplitude depending on the arc length, which is the basic harmonic of the arc voltage.
In many publications, the electric arc of the arc furnace is replaced by a nonlinear resistance. In our publication, the electric arc has been replaced by a voltage depending upon the arc length. For example, when the furnace current is IA (e.g. 80% of the furnace rated current), the arc voltage UarcA was calculated. When the current changed its value to another, e.g. IB (e.g. 120% of the furnace’s rated current), then the arc voltage was UarcB. Knowing the UarcA and UarcA arc voltages, the ΔUAB voltage fluctuations were determined due to the change in the length of the electric arc, which is also associated with the change in the furnace current. This allowed a modeling the nonlinear nature of the electric arc. By analyzing the voltage fluctuations and voltage asymmetry, the authors adopted a constant value of its resistance RL and reactance XL of the power supply network.
During the contact of the electrodes with the charge, the electric system supplying the furnace works in a short circuit. The amount of current is limited by the supply network impedance and high-current path impedance (including the furnace transformer impedance).
The short-circuit current can be determined by the formula (based on
Figure 5b):
while the voltage supplying the steel plant, point S, as in
Figure 5:
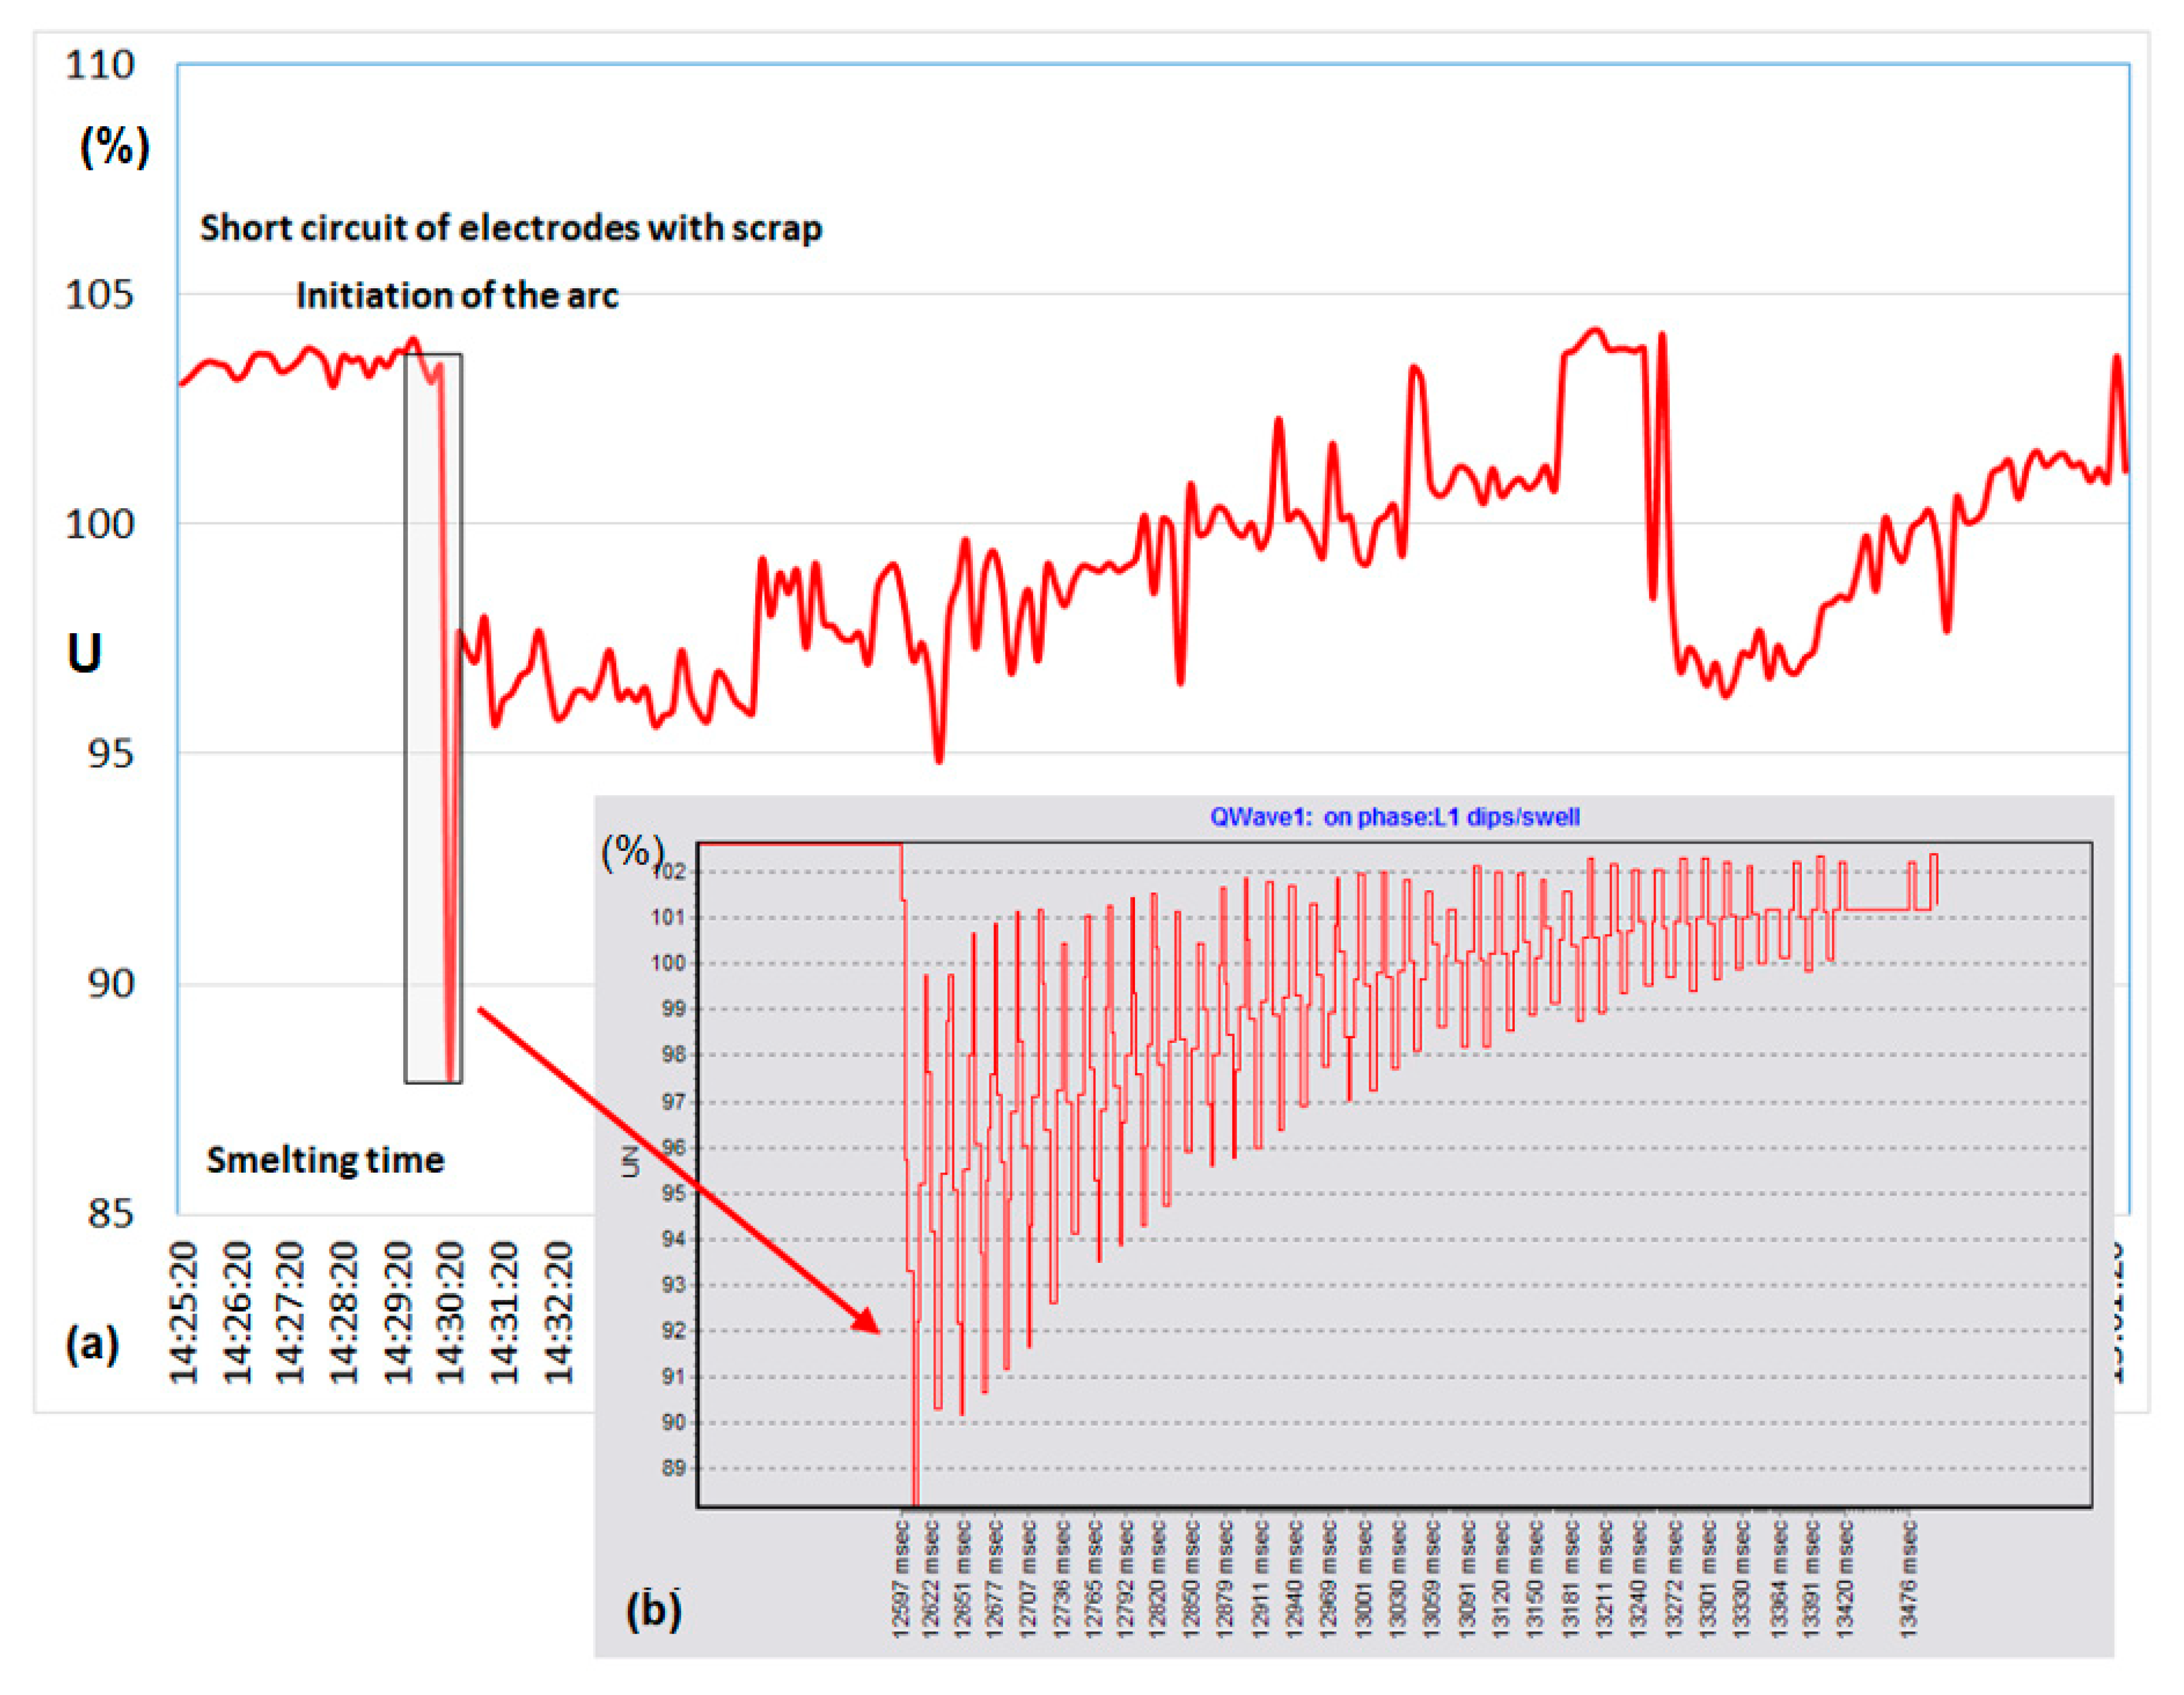
The electrodes must be shorted to the charge to ignite the electric arc. Raising the electrodes initiates the electric arc, which, however, burns unstably and goes out. This requires the electrodes to contact the charge again. This process is repeated several times until the arc ignites.
When the electrodes are connected to the charge, a very short circuit current flows through both the electrodes and the charge, which heats the electrodes at the point of contact with the scrap. In the event of a short circuit of the electrodes with the charge, there is a voltage drop in the steel mains supply network, which lasts until the electrodes are lifted (without the arc being initiated). The amount of current is limited by the supply network impedance, together with high-current path impedance (including the furnace transformer impedance).
Figure 6a presents changes in the RMS voltage recorded in the steel mains supply network during melting in the arc furnace.
Figure 6b illustrates the change in voltage in the network at the moment of arc initiation (short circuit and lifting the electrodes). The voltage then decreases below 90% Un. With the insufficient short-circuit power of the network in relation to the furnace power, the electric arc may not be initiated.
In arc furnaces, the largest current changes occur in the initial phase of casting, and after loading further baskets with scrap. The furnace changes its operating state from break to short circuit in the high-current circuit.
Figure 7 shows the rapid voltage changes at S (steelworks power supply), when the electrodes are shorted with the charge in the initial stage of casting. They were determined on the basis of model tests. Three cases are presented for three different short-circuit powers of the supply network, for which the ratio of the short-circuit power of the network to the power at short circuit of the electrodes with the charge is respectively: change of voltage waveform for
Scc/
Sctr = 140 –
Figure 7b and
Scc /
Sctr = 20 –
Figure 7c.
Figure 7d shows the changes in the RMS voltage when the electrodes are shorting with the charge. The short-circuit power values represent the actual parameters of the steel mains supply network. The PSpice program was used in model tests.
For a specific arc length, (which may change, e.g., due to the movement of the electrodes associated with the operation of the electrode position regulator, the sliding of melted scrap metal, movement of the arc over the electrode surface and charge, etc.)., a certain arc voltage occurs. The change in length causes a change in the arc voltage value, which has a direct effect on the furnace current.
The arc voltage can be determined by the formula:
After determining the arc voltage
Uarc, you can determine the voltage value at the connection point of the furnace transformer, point S, as in
Figure 5.
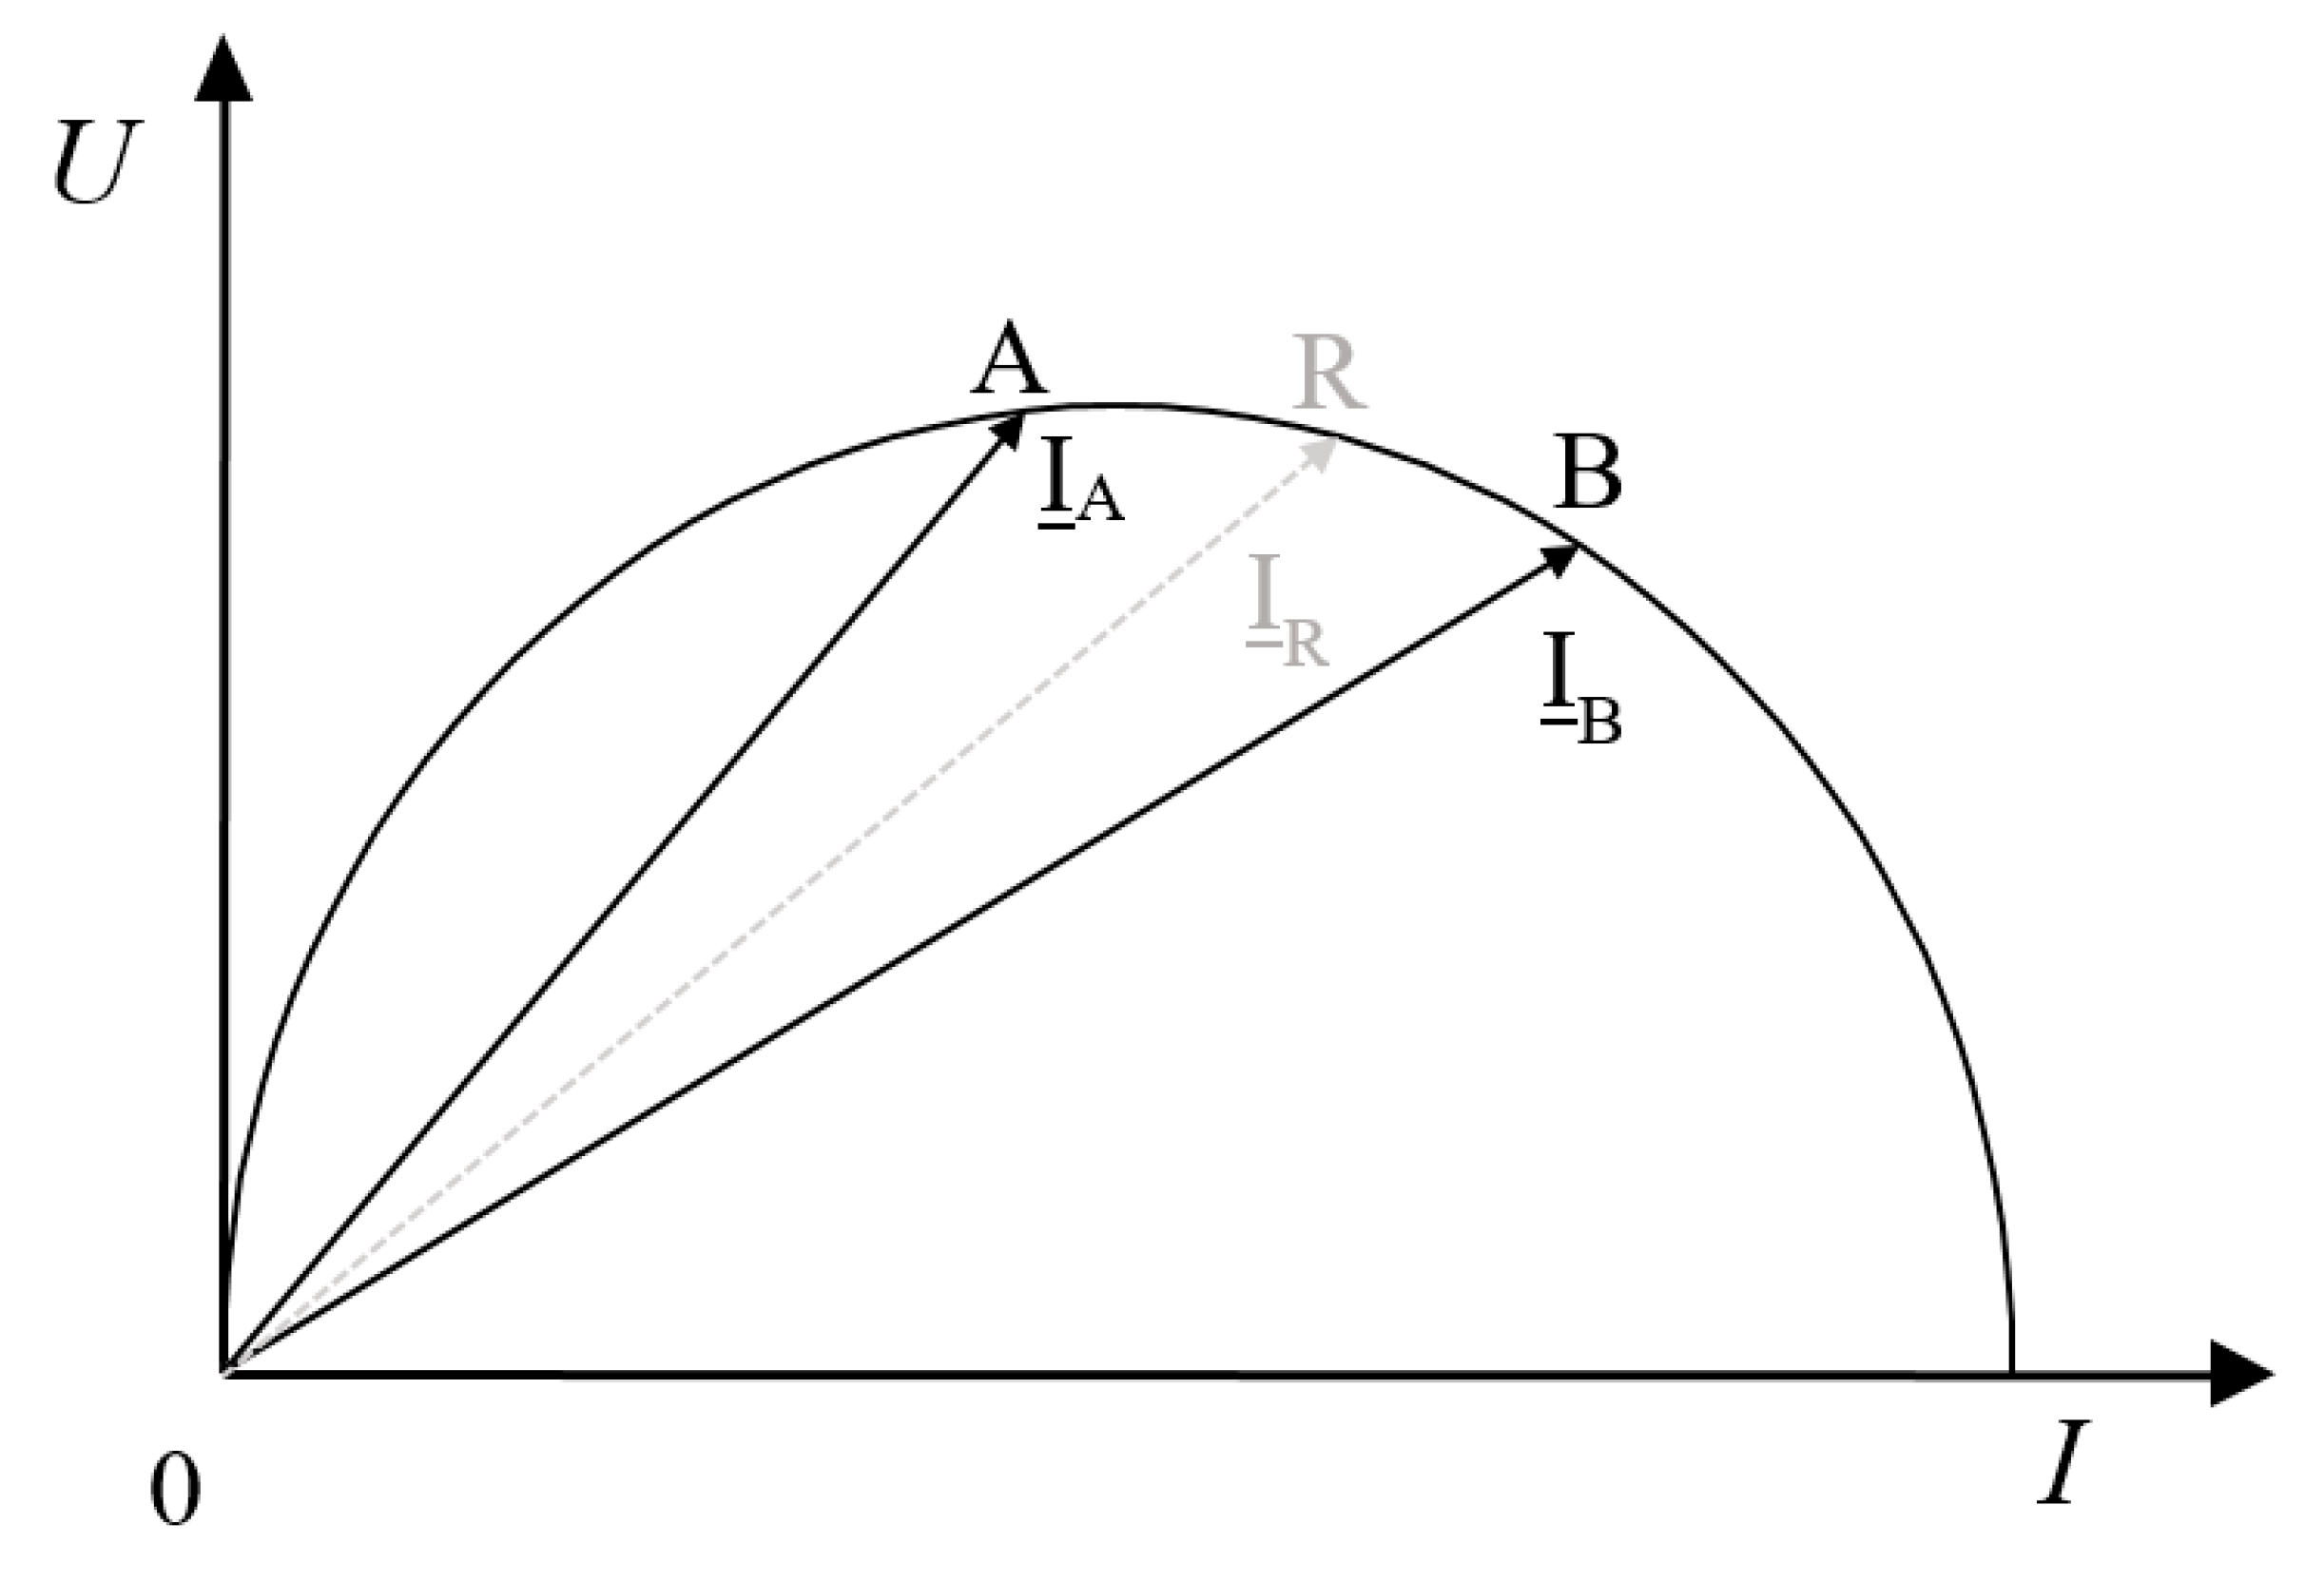
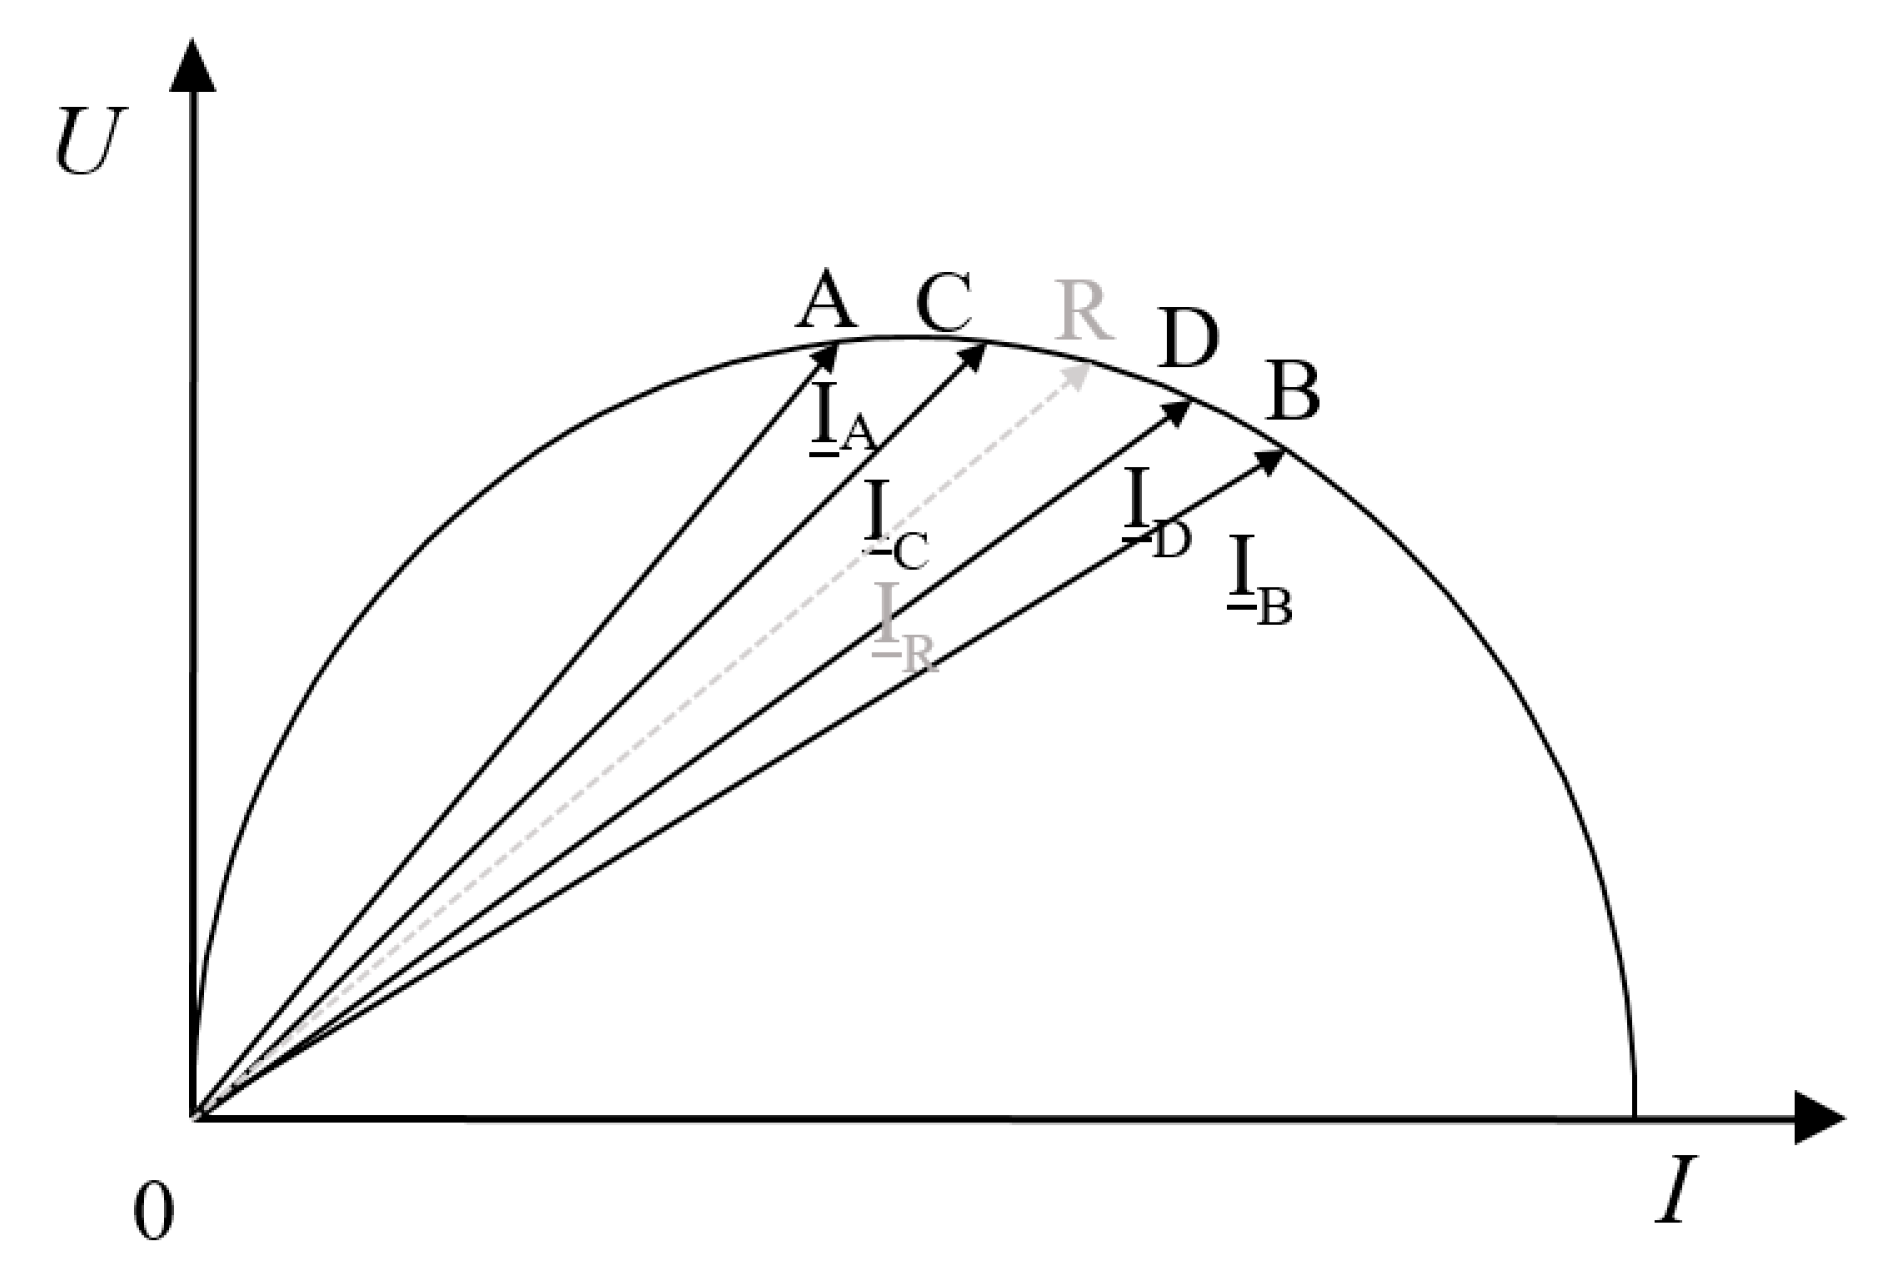
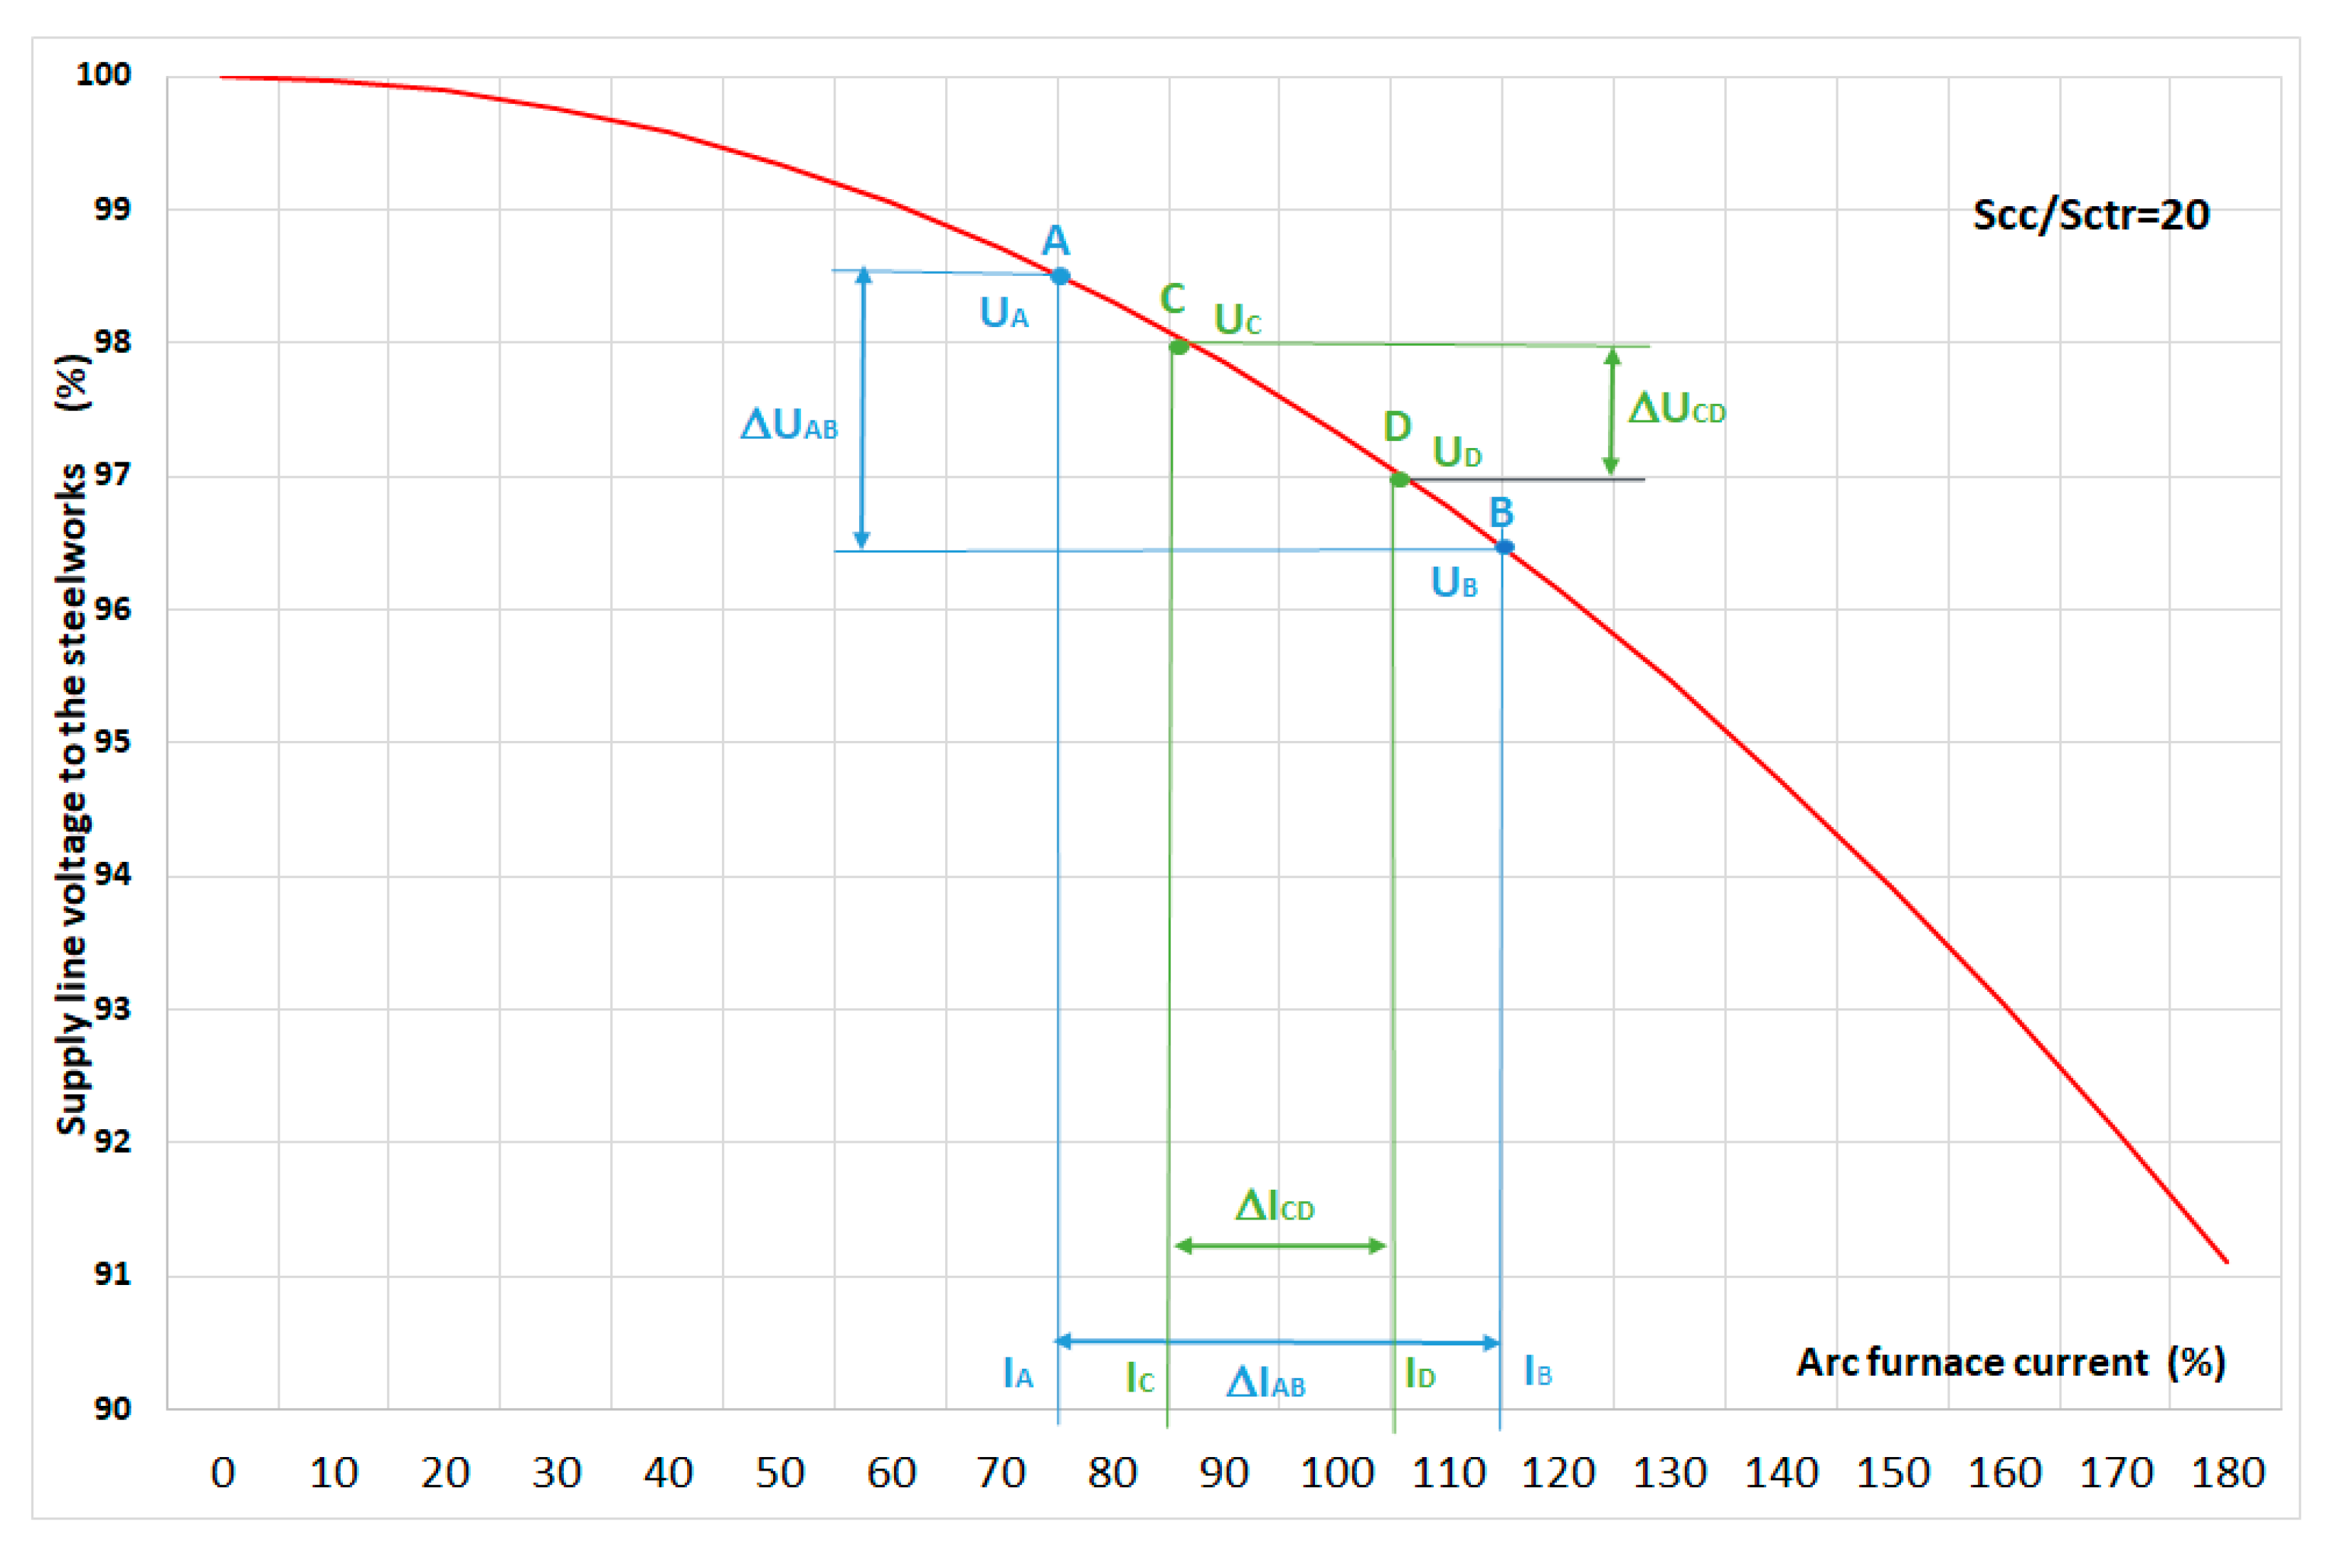
After ignition of the arc between the electrodes and the charge, as a result of changes in the arc length, the current changes its value dynamically, around the I
R melting current (between points A-B) a pie chart, see
Figure 8.
The
UarcA and
UarcB arc voltages can be determined:
and voltages on at
IA and
IB:
Voltage changes from
USA to
USB determine fluctuations in point S,
Figure 5.
or expressed as a percentage of the
UL reference voltage:
or as a standard deviation voltage:
In order to take into account changes in short-circuit power, which power has a decisive impact on the value of the voltage fluctuations, two power supply impedance values are adopted for model analysis, which correspond to two different ratios of the short-circuit power of the network to the furnace transformer power with short circuit electrodes, and are, respectively: 140, 20.
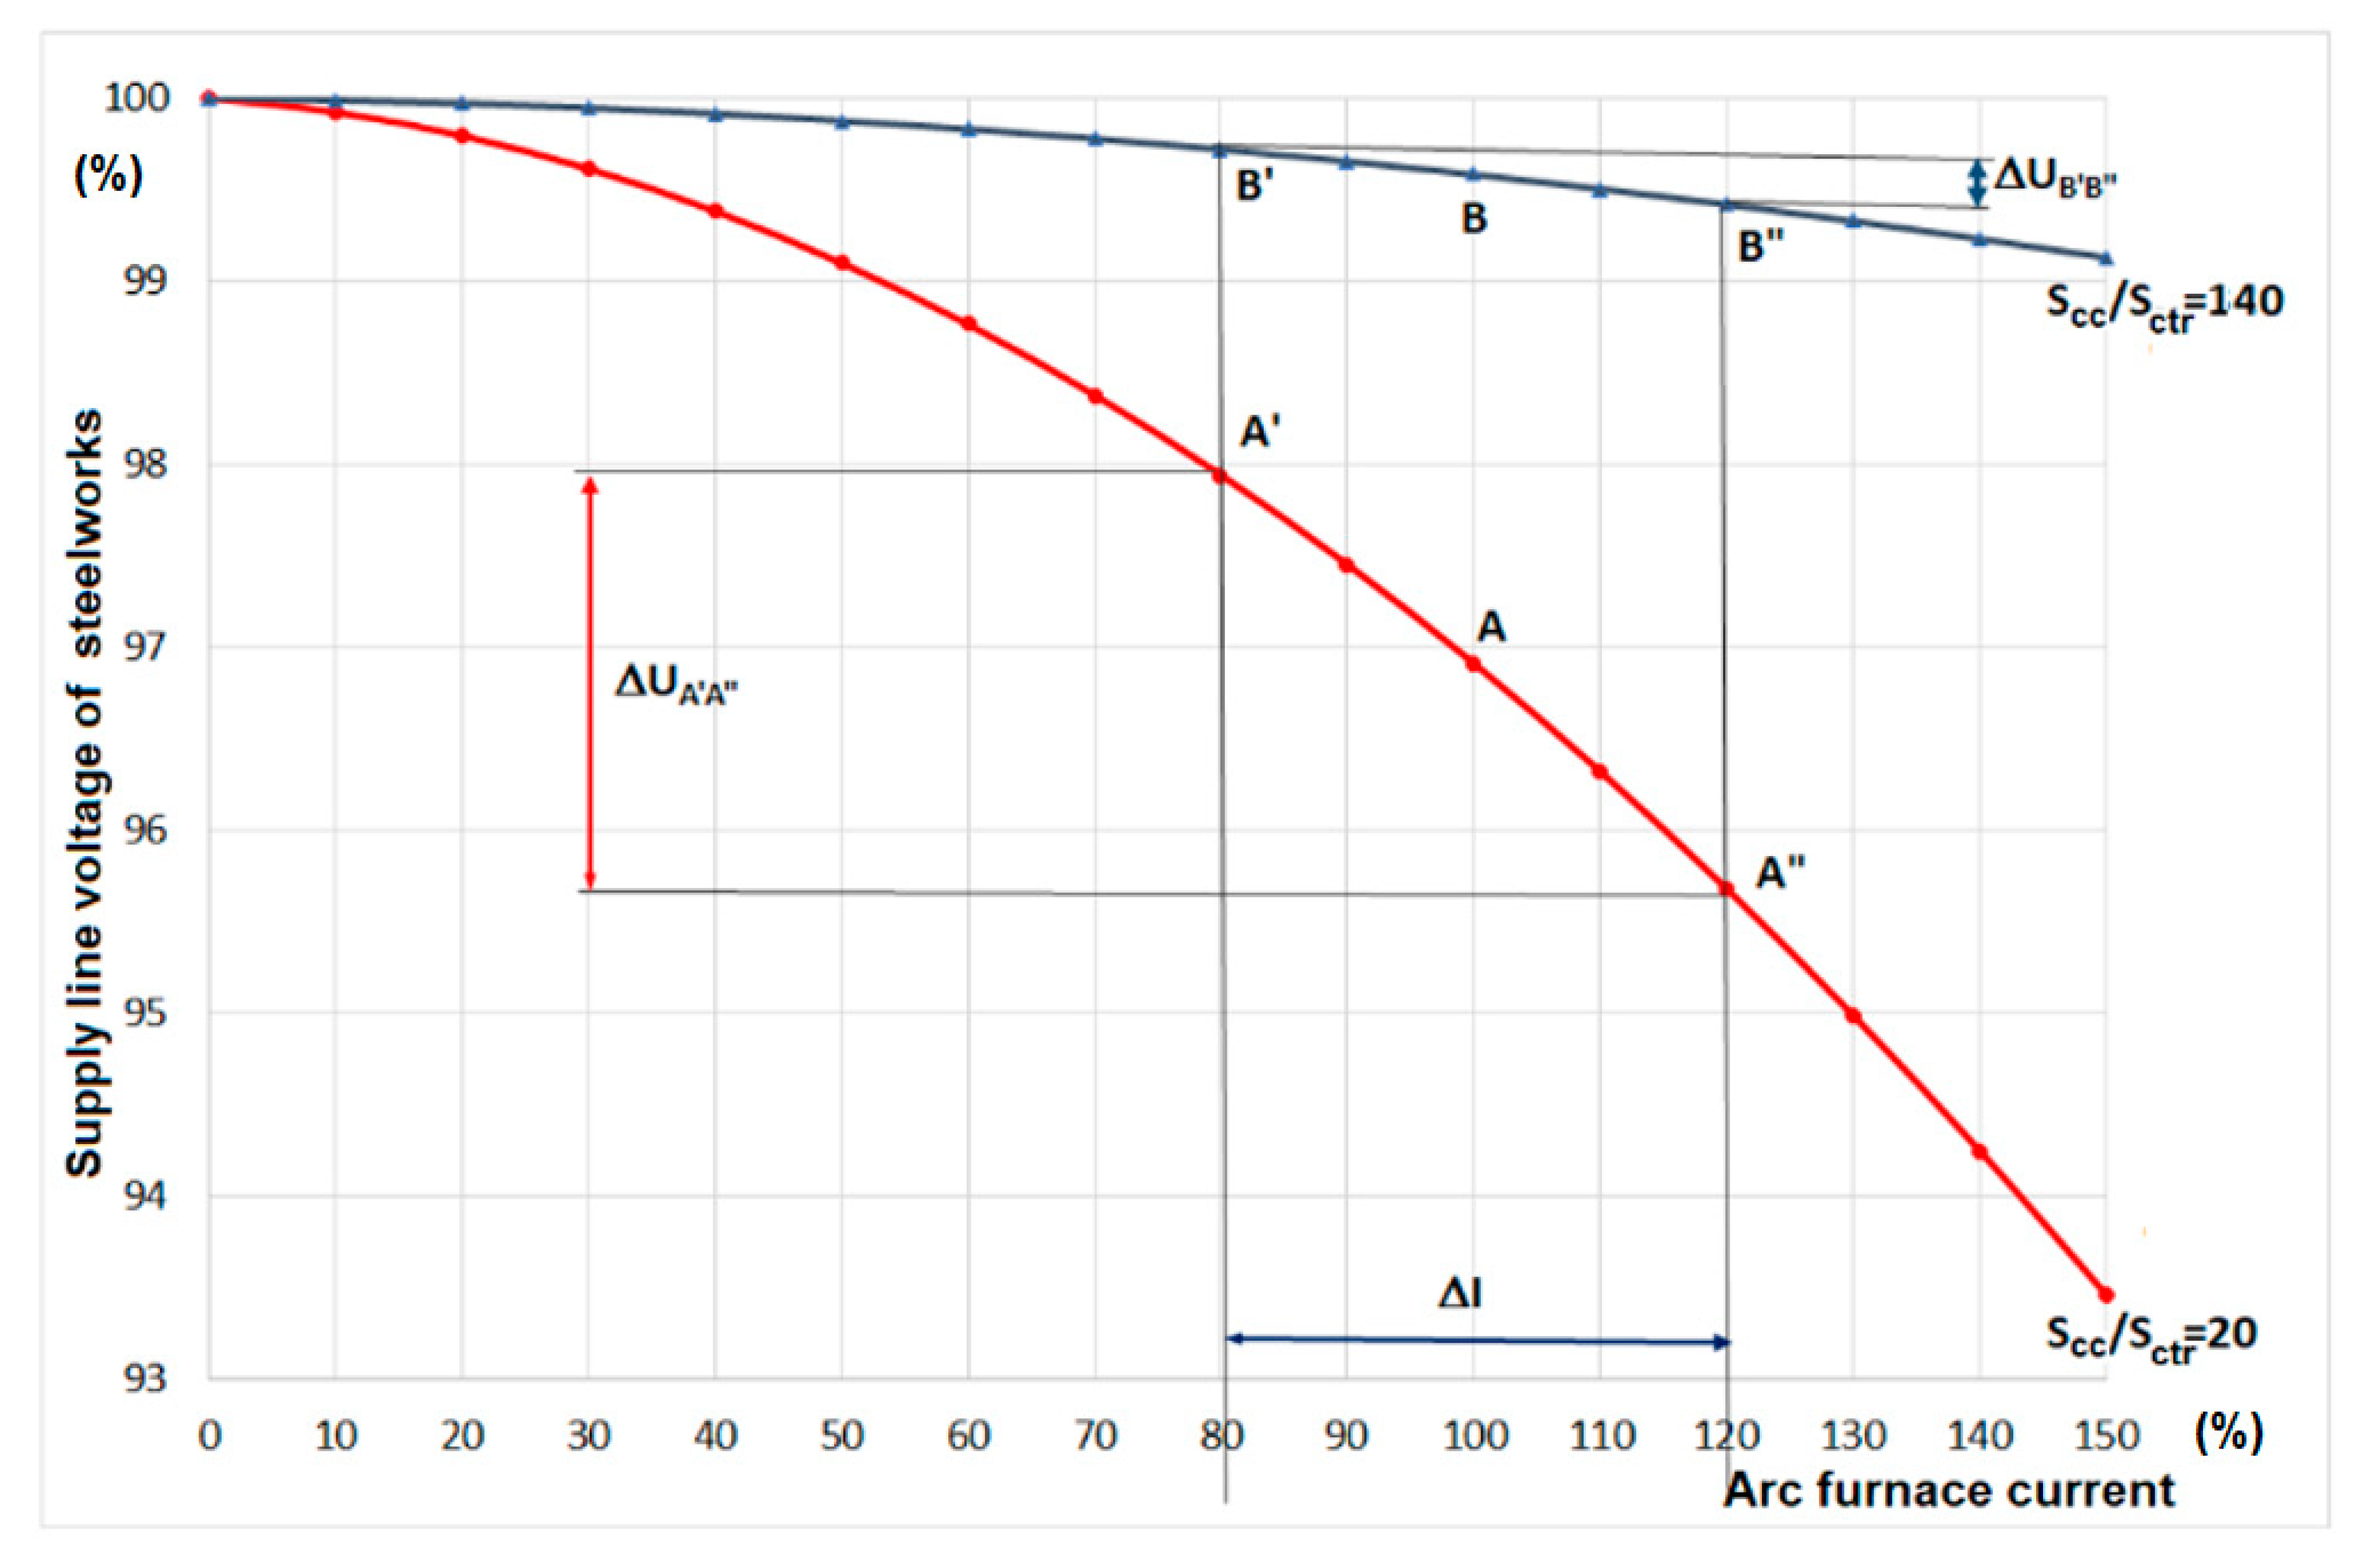
For arc furnaces, especially in the initial phase of melting scrap metal, there are dynamic changes in the current around the duty point set by the electrode control system. Assuming that the highest arc power used for melting scrap metal by the arc furnace is at a rated current of
IR = 100%In, the electrode position controller should ensure the furnace operation at a given optimal current, with points A and B depending on the short-circuit power of the supply network, from
Figure 2. The changes in the length of the electric arc are so dynamic, that the regulator is not able to correct its settings in such a short time. The operating point of the furnace therefore changes between A’ and A’ for a network with the
Scc/S
ctr ratio of 20, and between B’ and B’ for the
Scc/
Sctr = 140 network. Then a voltage fluctuation value corresponding to these changes Δ
UA’A" and Δ
UB’B" is received –
Figure 9.
Using the proposed model, it is also possible to determine the magnitude of voltage fluctuations at a different range of changes in the current consumed by the arc furnace and different short circuit power of the network and arc furnace power.
The conducted model tests and measurements carried out by the authors in the networks supplying arc devices show that the increase in voltage fluctuations for the analyzed case ΔUA’A"ΔUB’B"=7.57 is inversely proportional to the short-circuit ratio power SccB/SccA = 7.
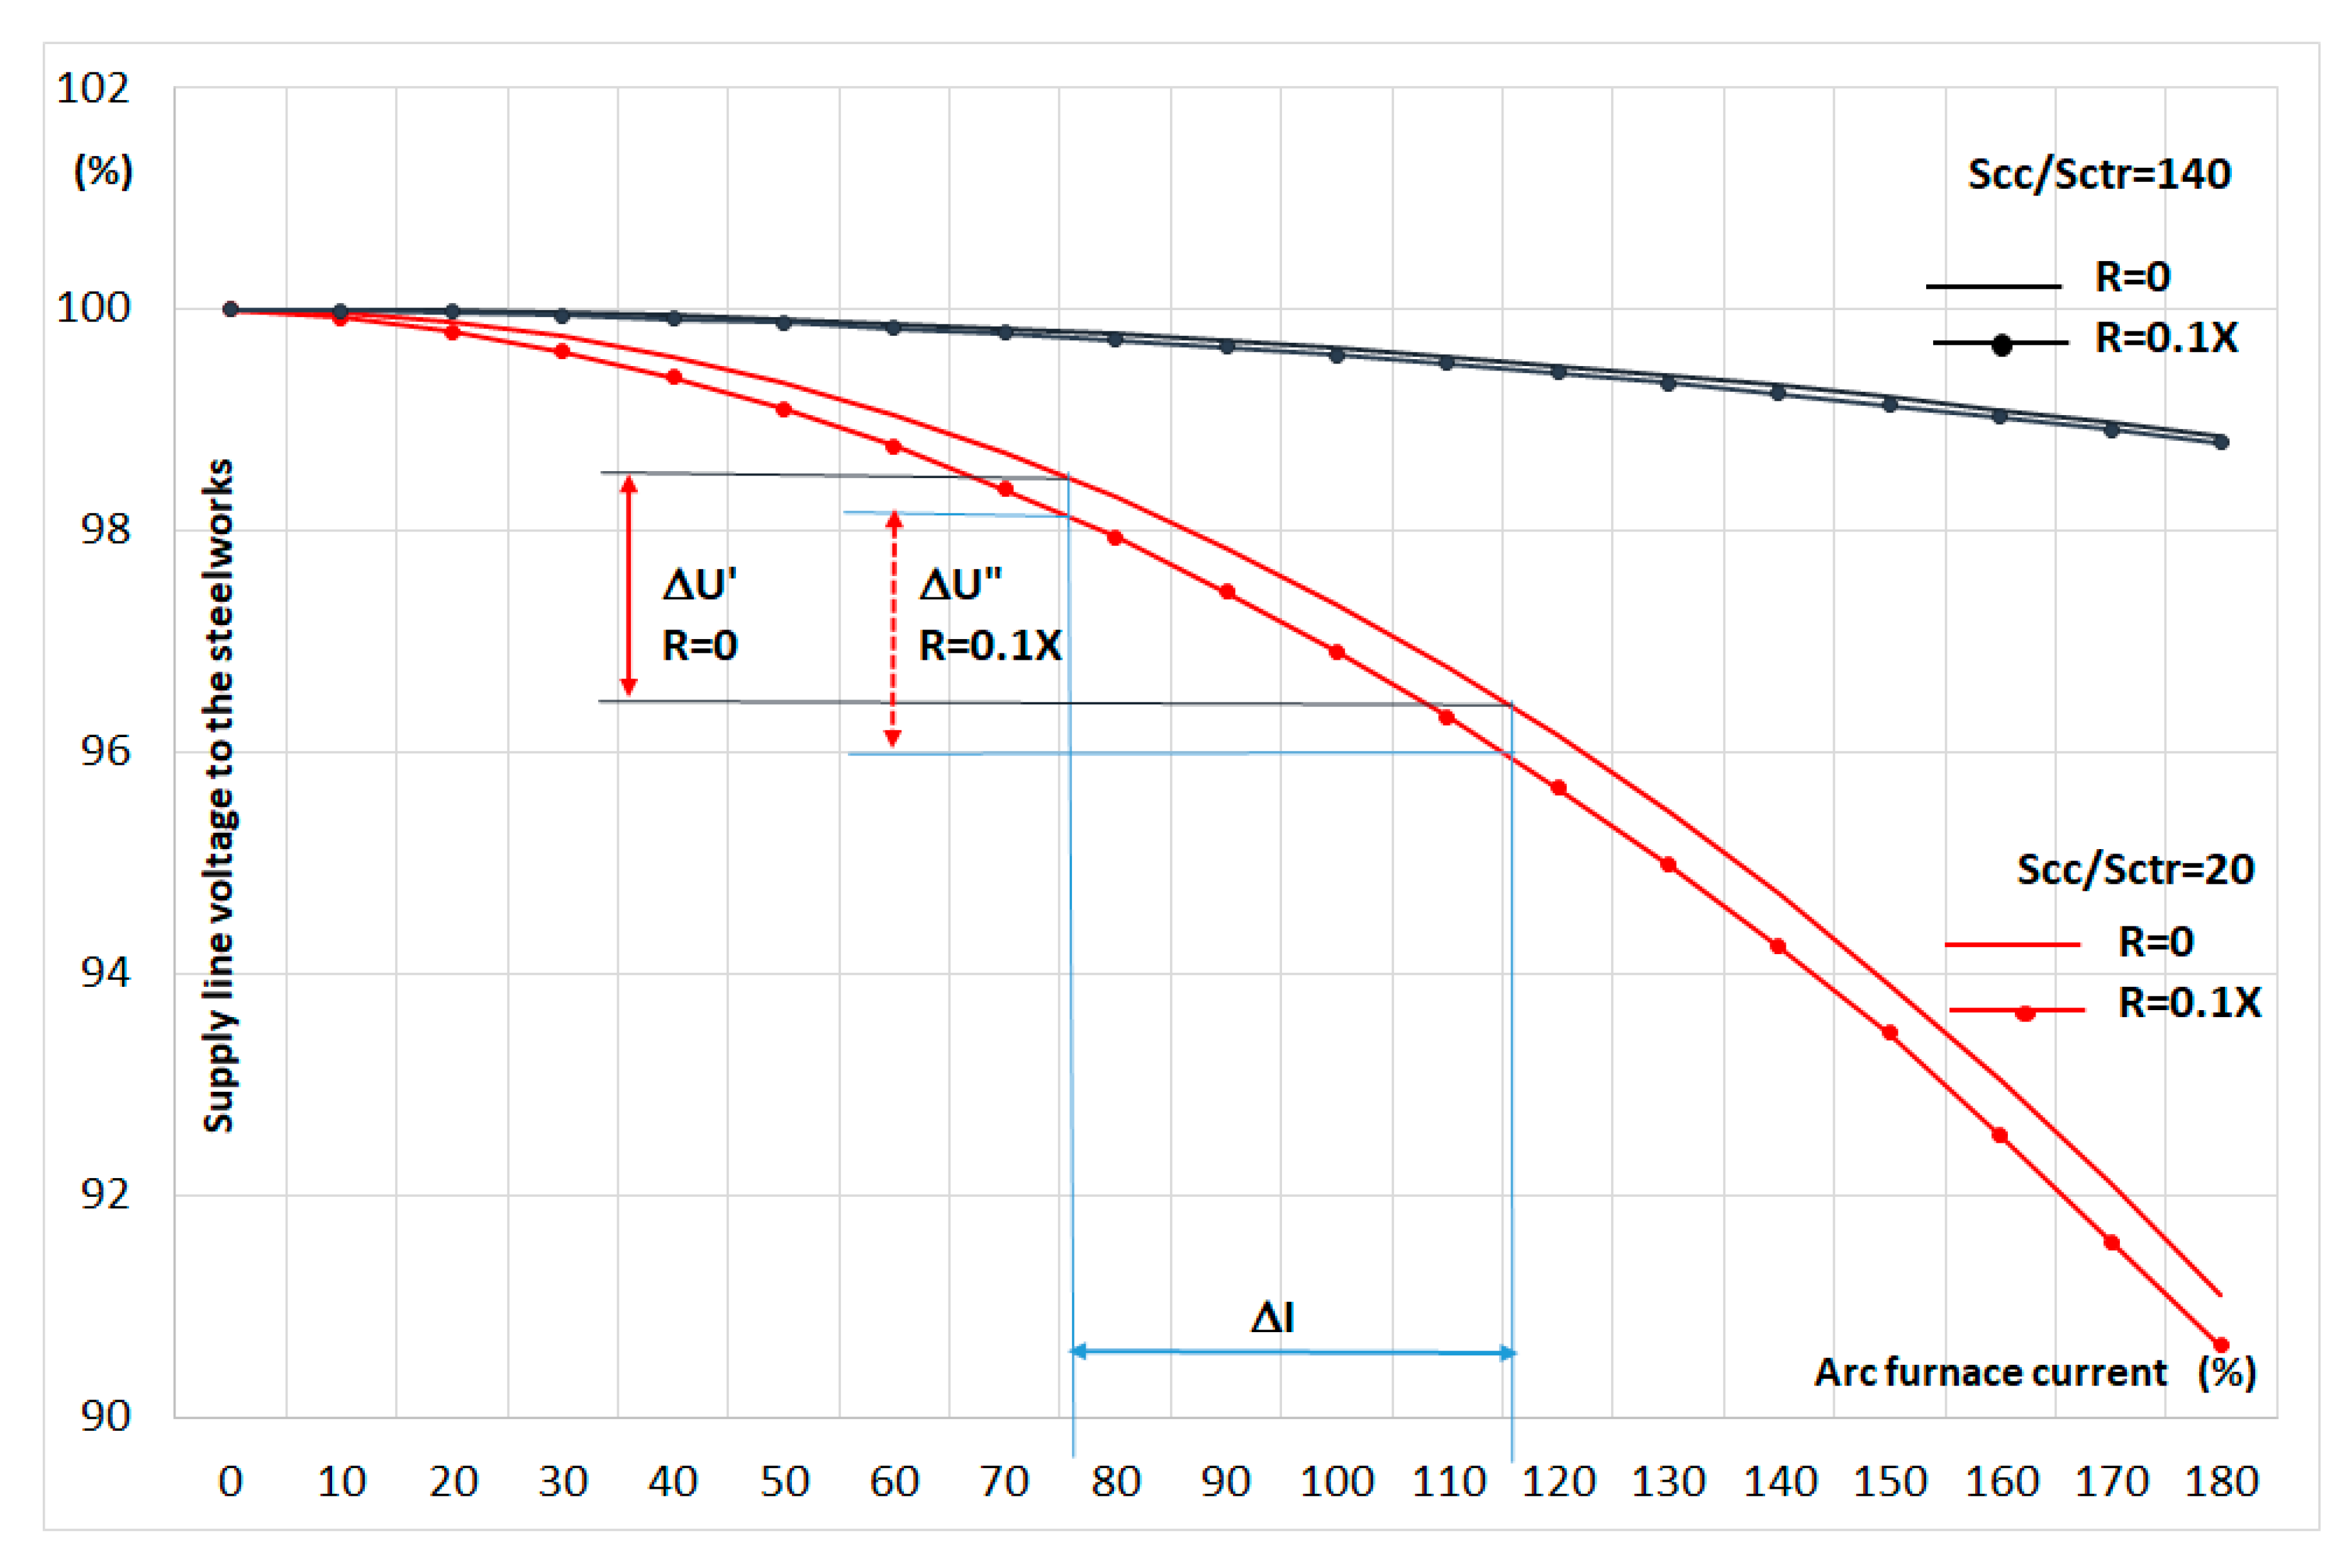
The decrease in the supply voltage to the US steel mill results from the decrease in voltage at the network impedance, whereby the results. The results have been compared, taking into account and omitting the resistance in the circuit supplying the electric arc.
With sufficiently short-circuit power (
Scc/
Sctr = 140), the influence of arc supply resistance can be basically neglected. At low short-circuit power (
Scc/
Sctr = 20) for the melting current of
IR = 100%I
N, the difference in the steel supply voltage, taking into account and omitting the resistance, is about 0.4%
UN –
Figure 10.
The assumption of two-state current changes seems to be correct only for the initial stage of casting, and after loading the next bins with scrap. In order to take into account the changing current fluctuations at different melting periods, it was assumed that the current changes around the I
R (melting current) value,
Figure 11.
The arc voltages
UarcA,
UarcB and
UarcC,
UarcD can be determined respectively:
and steel supply voltage at
IA,
IB and
IC,
ID:
Based on the calculated
USA,
USB,
USC,
USD voltages, the average voltage on the steel rail is:
average squares of
US voltages:
and standard deviation
D(
US):
As the furnace steadily becomes more stable, currents with smaller ranges of change occur more often, up to a completely stable operation, when the arc device consumes a melting current of a fixed value (IR).
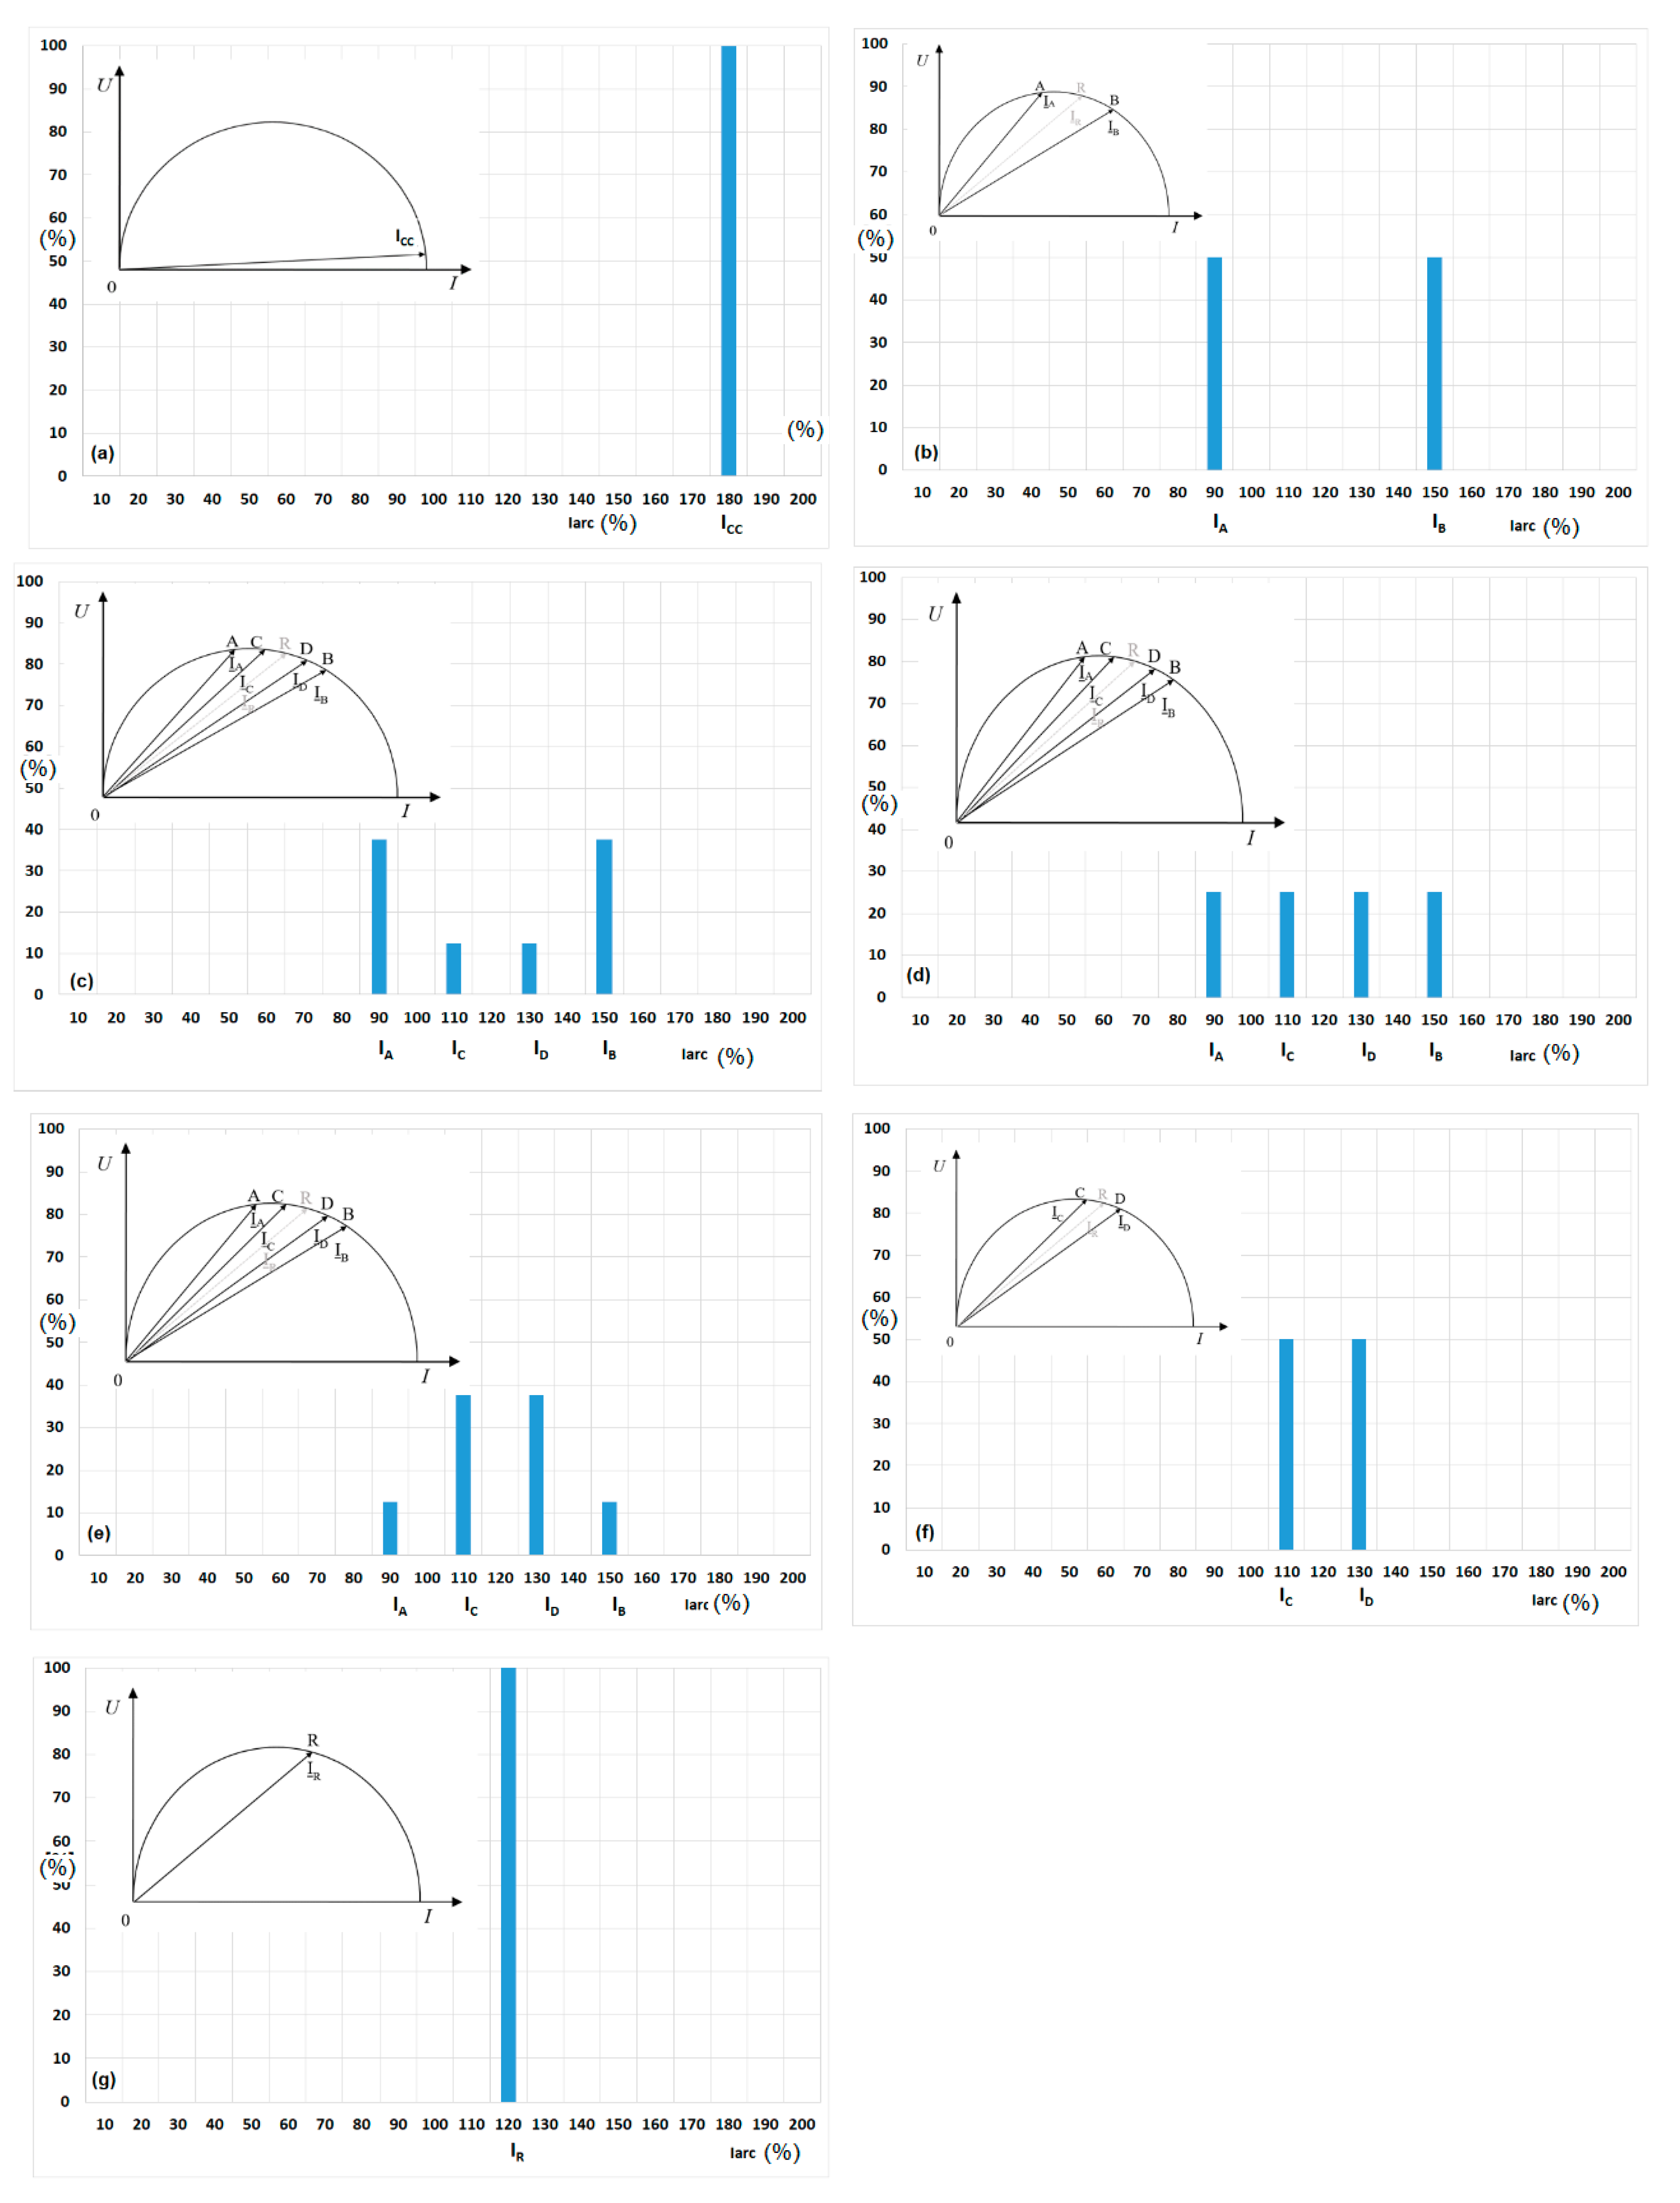
The probability of the occurrence of individual current values is determined in histograms,
Figure 12, which correspond to different melting phases in the arc furnace. Histogram (a) corresponds to the operation of the furnace when the electrodes are shorted with the charge, whereas the (b)–(f) histograms characterize the current fluctuations from the largest in the initial melting period, to the stable operation of the furnace with a constant I
R melting current, histogram (g).
The maximum four-state current changes are shown above. A larger number of states (values) can be assumed in which the current consumed by the arc furnace will be located. This will enable a more accurate determination of the variability of voltage fluctuations during the melting.
Taking into account the impact of the furnace on the power system, however, the most important is the period when the changes of the current, together with voltage fluctuations, are the largest –
Figure 13. The increase in voltage fluctuations resulting from arc devices switched in succession (
Figure 14) is characterized by the
KN factor. This factor determines the extent to which voltage fluctuations will increase with successively connected arc furnaces, with reference to the fluctuations arising during the operation of a single device (reference furnace). The
KN voltage fluctuation coefficient is determined as the ratio of the
US standard voltage deviation when operating
N furnaces
D(
USN), to the standard voltage deviation when operating single furnace
D(
US1):
Respectively for the value of the short-term flicker index,
KN can be determined from the formula:
where:
PstN is the value of the short-term light flicker indicator recorded during the operation N of arc furnaces, and Pst1 represents the value of the short-term light flicker indicator recorded during the operation of a single arc furnace.
According to the method proposed by UIE for the assessment of superposition of voltage fluctuations, the substitute parameter
Pst obtained with the use of the light flicker meter is assumed, and it is determined from the relationship [
45,
46].
where:
Pstn corresponds to flicker level induced by n-th disrupting receiver
The value of the coefficient m, occurring in the above formula, depends upon the characteristics of unquiet receivers, and can be categorized into five categories:
m = 4: used only for the summation of voltage changes due to arc furnaces specifically run to avoid coincident melts,
m = 3.2: this choice matches the slope of the straight part of the Pst = 1 curve,
m = 3: this is used for most types of voltage changes where the risk of coincident voltage occurring is small. The vast majority of studies combining unrelated disturbances will fall into this category, and it should be used where there is any doubt over the magnitude of the risk of coincident voltage changes occurring,
m = 2: this is used where coincident stochastic noise is likely to occur, e.g. coincident melts on arc furnaces,
m = 1: the resultant Pst will approach the value given by this coefficient when there are very high occurrences of coincident voltage changes.
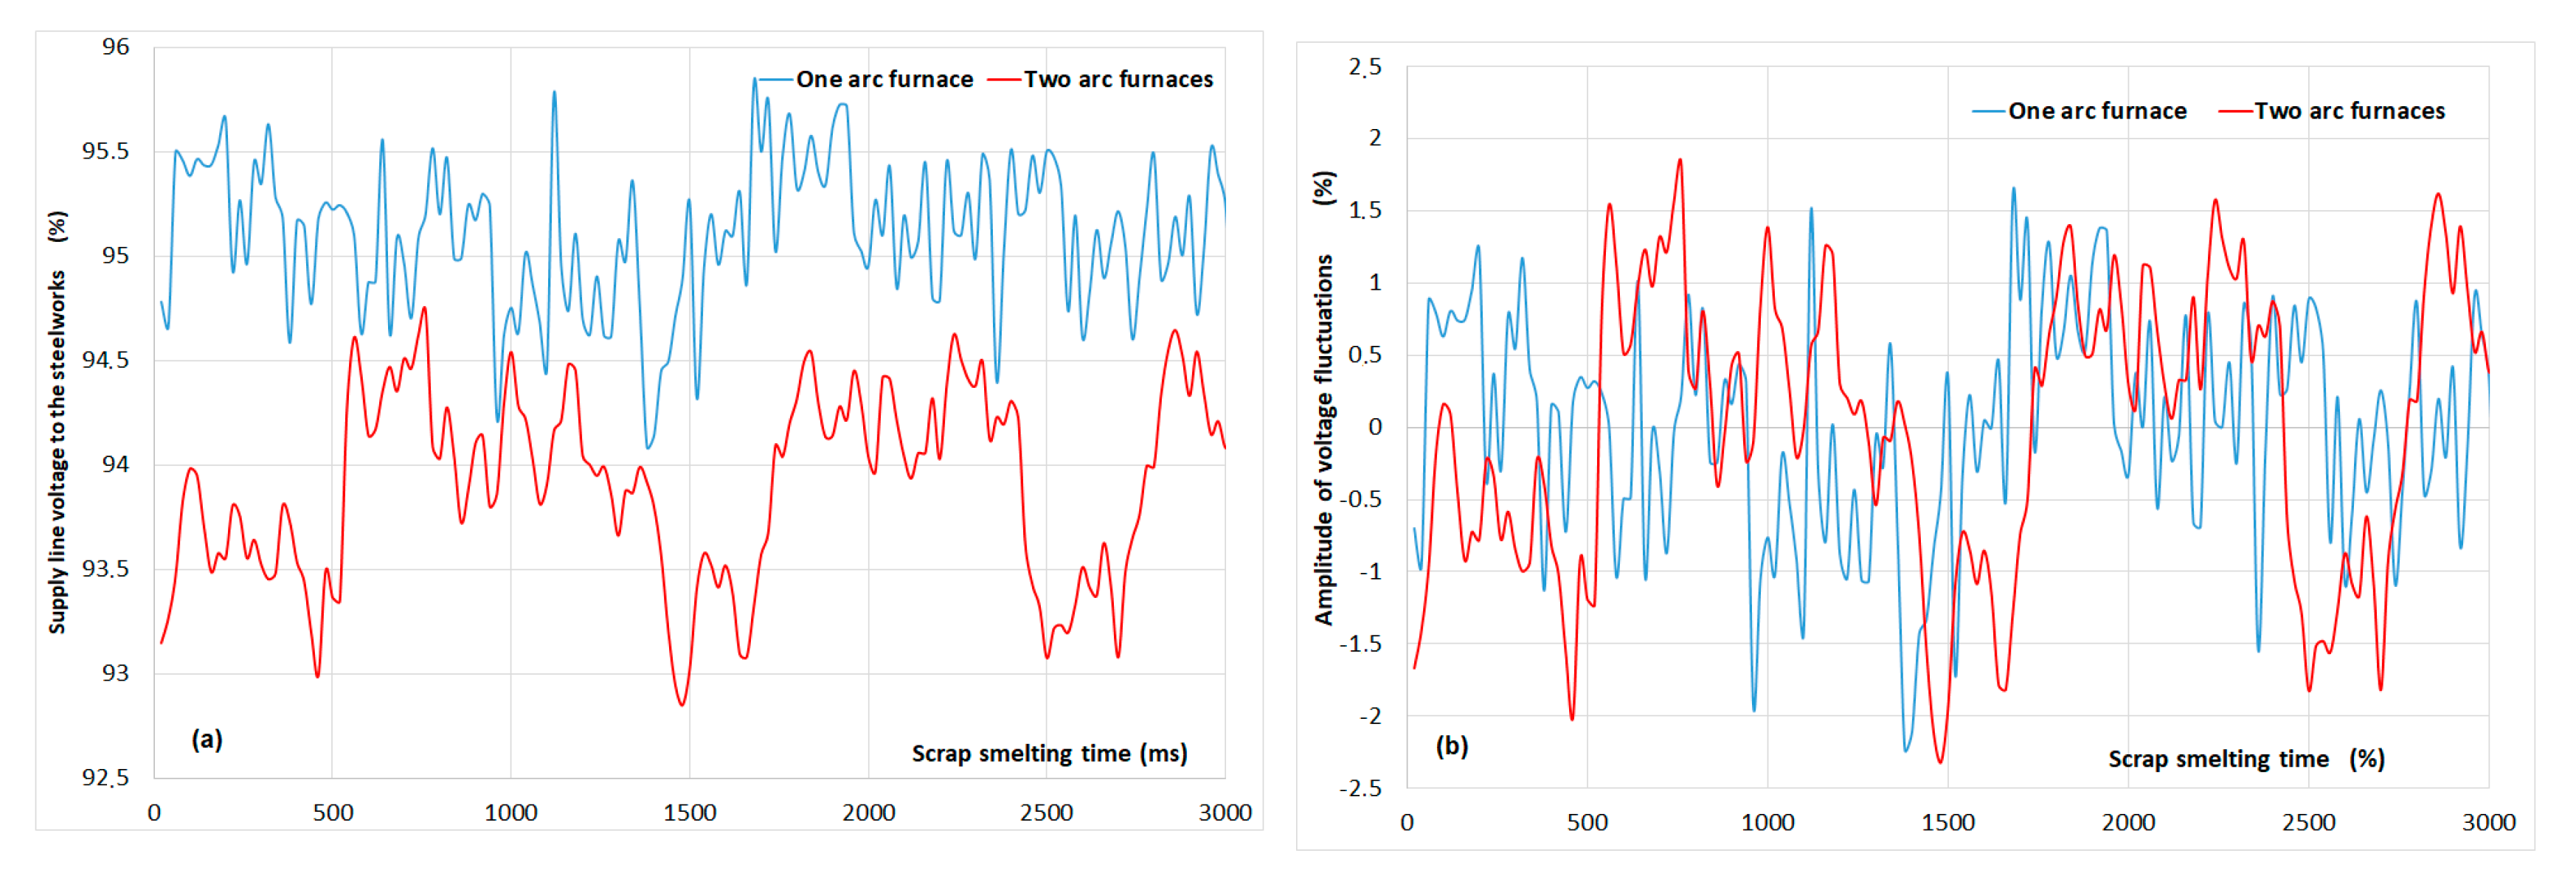
Analyzing the voltage fluctuation waveforms recorded at a different number of arc furnaces operating in parallel, it was found that in addition to the increase in the fluctuation amplitude,
Figure 15b, a decrease in the average voltage value should also be taken into account,
Figure 15a. Therefore, a method of determining the
KN factor has been developed, taking into account the change in average voltage value when switching on subsequent furnaces, the short circuit power of the network, furnace transformer power and the melting phase of the arc furnace [
47].
On the basis of the developed power–voltage characteristics, the set of formulae allowing the determination of the coefficient
KN were worked out [
48]. The formula determining an increase in voltage fluctuations for arc devices being in the melting process can be expressed in the following form:
and for arc devices of different power:
Using the relationship determined for power–voltage characteristics, and replacing the arc by the voltage source formula (28) and (29) at identical devices, we can present the coefficient
KN in the following form:
and at different devices:
where:
- -
; - slope coefficients of the power–voltage characteristic calculated at a constant arc voltage and a constant arc resistance respectively,
- -
- the mean reactive power drawn by j-th furnace,
- -
- the short-circuit power on the bus-bars of the steelwork (in PCC furnaces),
- -
- the shorting power of the arc device being exploited,
- -
- the nominal power drawn by i-th furnace,
- -
- the voltage on the bus-bars of the steelwork at the work of N furnaces and the work of a single furnace (the furnace of the highest power, reference furnace) respectively.
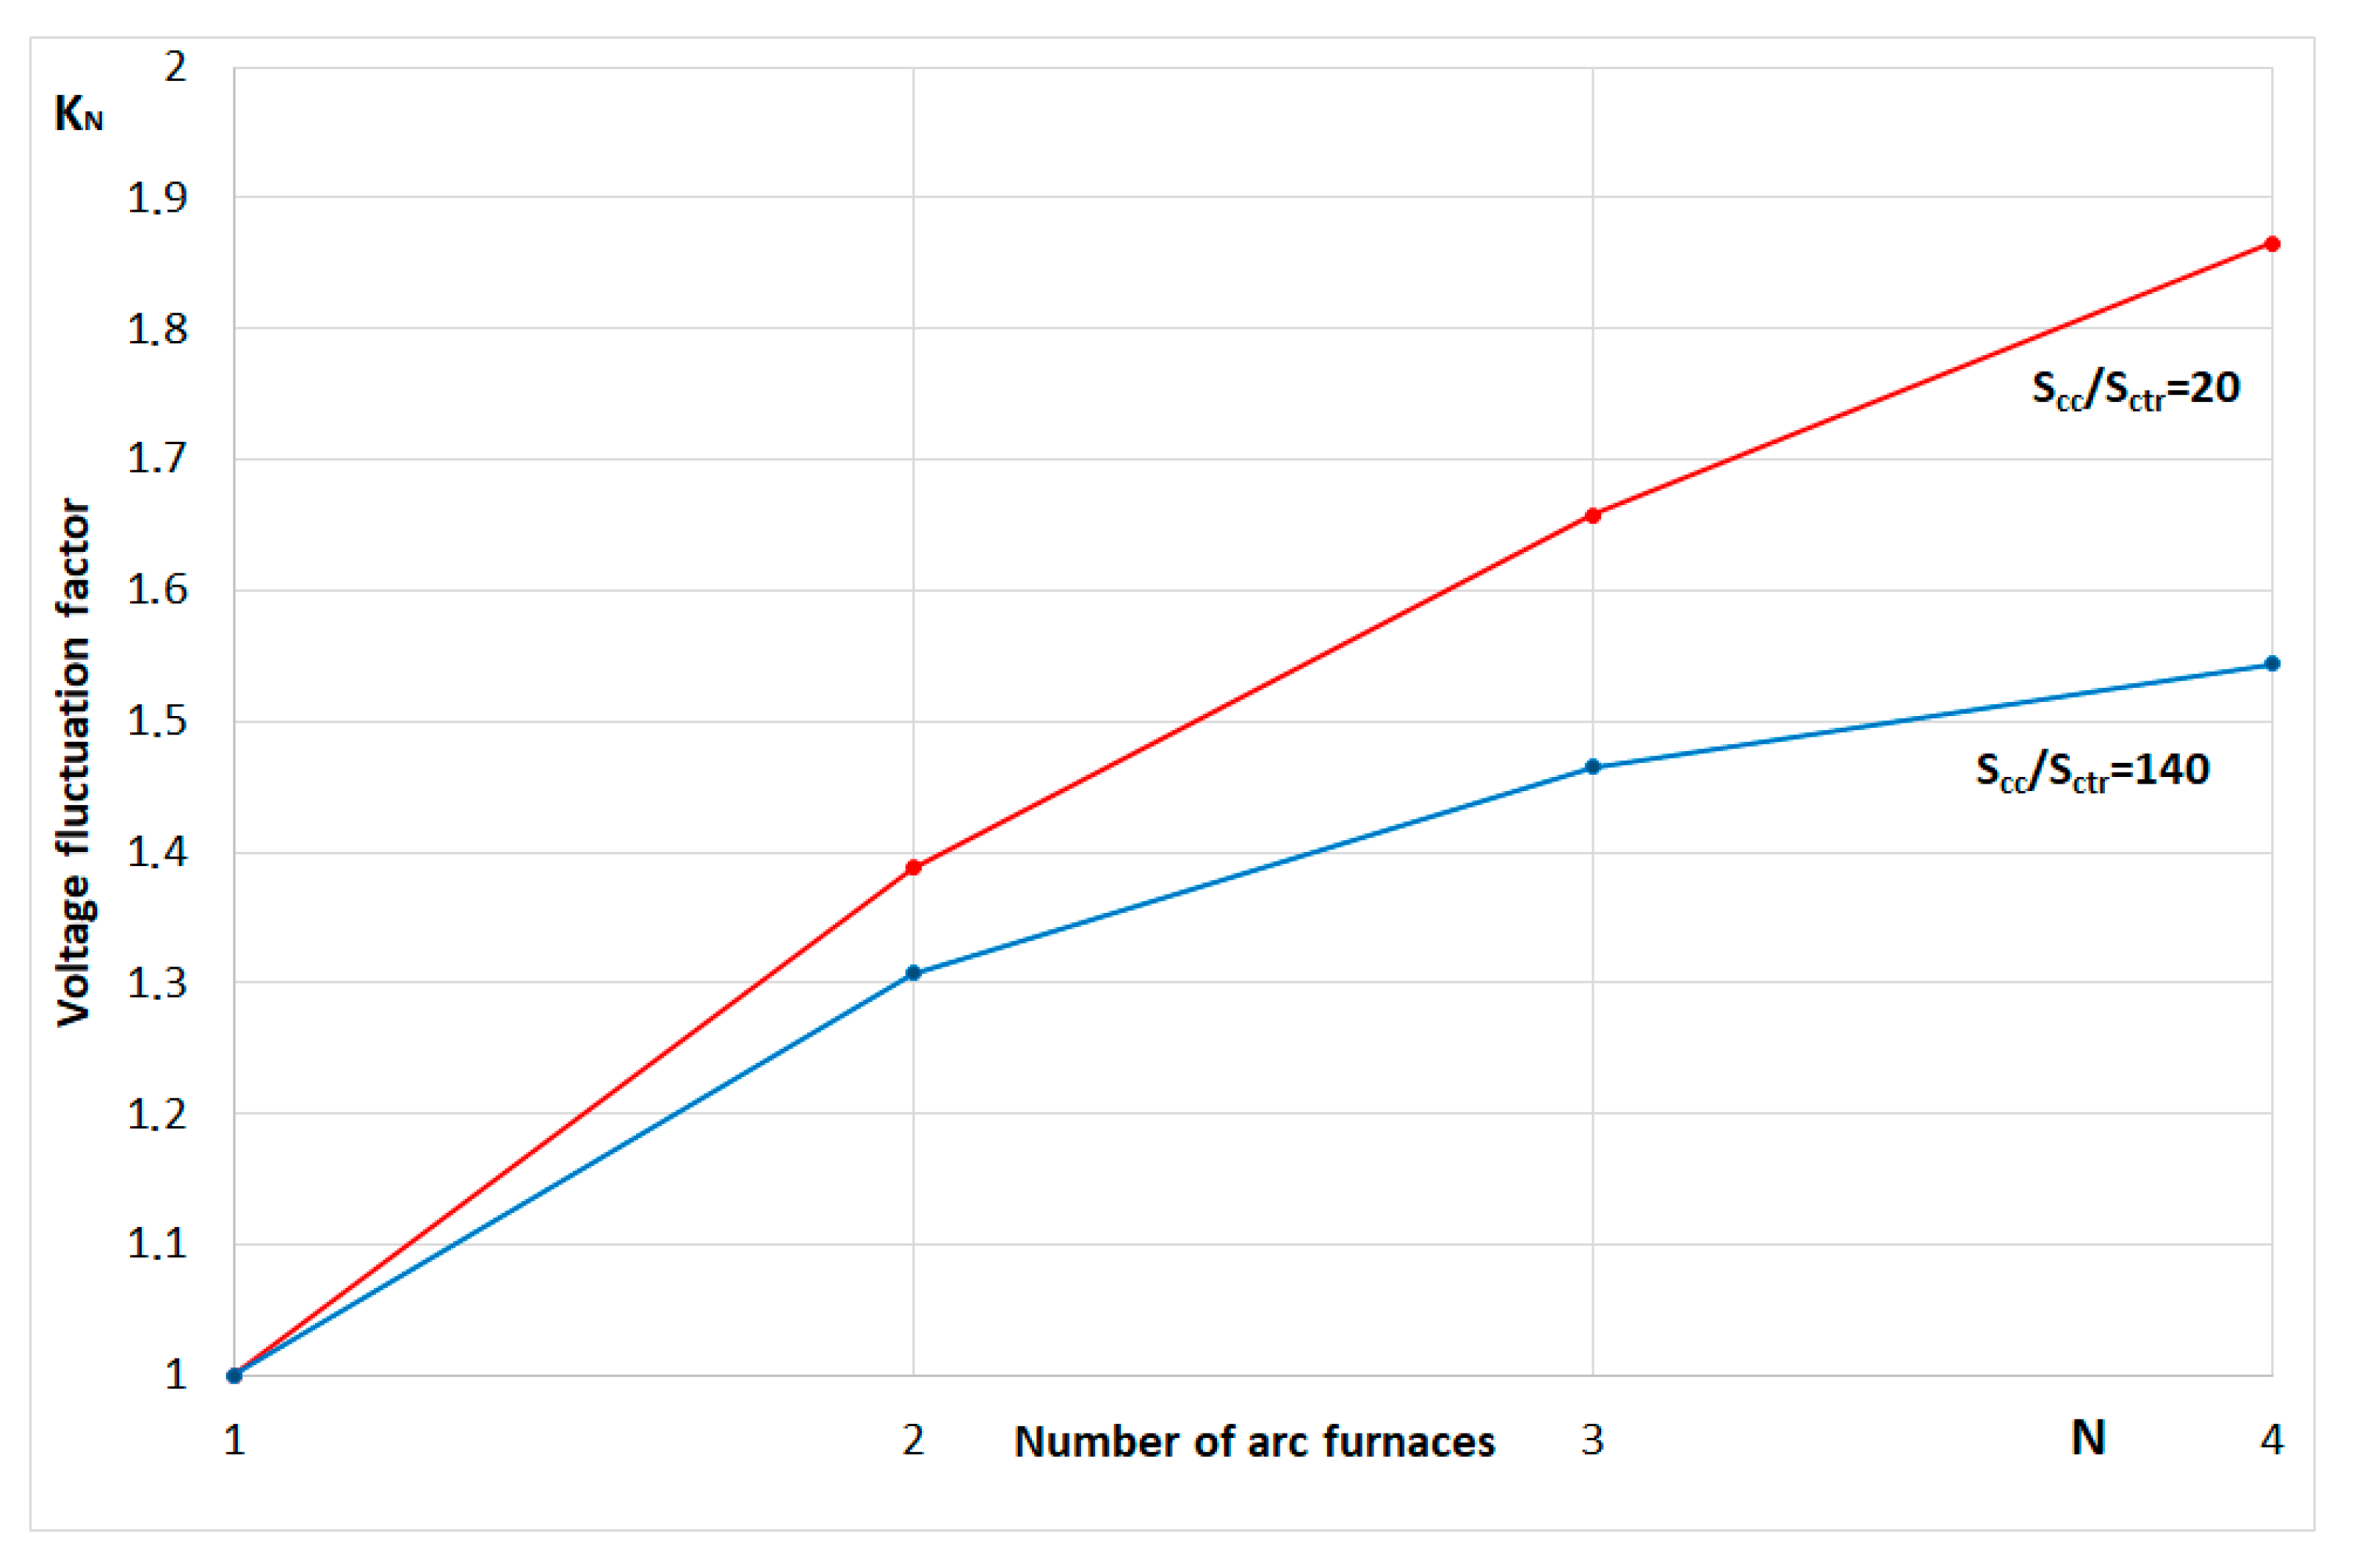
Figure 16 presents changes in the value of the
KN coefficient resulting from successively connected arc furnaces for two different short circuit powers of the supply network.
At higher short-circuit power (Scc/Sctr = 140), the KN factor achieves higher values, which is due to, among others, less damping of voltage fluctuations by the power system. For lower short-circuit power (Scc/Sctr = 20), the increase in fluctuations resulting from arc furnaces operating in parallel is smaller, while the values of fluctuations caused by individual furnaces are much higher.
The presented method of assessing the increase in voltage fluctuations in parallel operations of arc devices has been confirmed by empirical tests carried out in several steel mills, both in terms of voltage fluctuations and flicker indicators. The steel works in which the measurements were carried out were selected in such a way as to represent different power conditions (different ratios of short-circuit power to the power of installed arc devices), various types of arc devices were used in them (different generations of arc furnaces) and the process of steel casting was different (e.g. the entire casting cycle takes place in an arc furnace or after melting, the blast furnace steel is used).
3. Voltage Asymmetry
The values of voltage and current asymmetry coefficients (
K2U,
K2I) can be determined directly, based on measurements using, among others, power quality analyzers, as well as using various calculation methods. One of the basic methods used to analyze and evaluate asymmetry in three-phase circuits is the method of symmetrical components [
49].
The complex voltage asymmetry coefficient can be expressed by the formula:
In practical applications, there is often no need to consider the angle , the phase shift angle between the compatible and opposite components (in the reference phase) and for the assessment of asymmetry it is assumed:
Voltage asymmetry factor:
One of the basic documents defining the method of measuring asymmetry (as well as other parameters of electricity quality) is EN 61000-4-30 [
50]. The value of the asymmetry coefficient is determined by the formula:
where the auxiliary term
β is given by the formula:
In IEC 61000-2-12 [
51], the asymmetry factor is determined by the formula:
while, in IEC 61000-2-1 [
52], ANSI C84.1 [
53] and ER P29 [
54]:
where:
In Gost 13109-97 [
55], the consistent and opposite components are determined from the formulas:
and the asymmetry factor:
A nomogram is a graph with which you can quickly and without calculations get an approximate solution to a particular equation. In the Kowzan method, described in publication [
56], the asymmetry coefficient is read from the nomogram after determining the voltage ratios
UL23,
UL31 to
UL12, Formula (39):
Another method using nomograms (the method of the Institute of Energy of Ukraine) [
56] allows determining the voltage asymmetry coefficient with an absolute error that does not exceed 0.1%, and similarly to the Kowzan method, the relationships between individual voltage values are used: Formula (40).
Arc furnaces also cause voltage asymmetry. In the case of arc furnaces, the source of asymmetry is changing the arc resistance, which causes currents flowing in individual phases to have different values. It is also possible to deliberately introduce current asymmetry for furnaces with an asymmetrical design, which is to achieve the symmetry of the heating power in individual phases. The causes of voltage asymmetry can be divided into two groups: those resulting from the structural asymmetry of arc devices (construction asymmetry), as well as from the asymmetry arising during the melting in the arc furnace (operational asymmetry). The asymmetry of furnace currents affects the power supply network (causing voltage asymmetry) and the operation of a furnace itself. The assessment of voltage asymmetry in the arc power supply line can be made on the basis of an analysis of the asymmetry index measurement results, or based on calculated values. Due to the fact that the magnitude of the voltage asymmetry changes during melting, the assessment of the asymmetry based upon data obtained from measurements with electricity quality parameters meters seems to be the best method. However, one should take into account errors that may arise in the measuring path (indirect measurement using current and voltage transformers). In relation to the values adopted, as in [
56] as a reference, the asymmetry coefficient measured by means of electricity quality parameters meters is on average higher by 4.07% (
Table 1). The values of voltage and current asymmetry coefficients (
K2U,
K2I) can be determined directly, based on measurements using, among others, electricity quality analyzers, as well as using various calculation methods. The method proposed by the author made it possible to determine voltage asymmetry based on a differential factor and differential angle.
For the
UL12,
UL23,
UL31 voltages, the average square value of these
U2ave voltages will be calculated:
WU2 asymmetry differential module:
and differential angle:
Then the asymmetry differential coefficient was determined:
kU2:
On the basis of the differential coefficient k
U2, the voltage asymmetry coefficient is determined from the formula:
In the case of small voltage asymmetry, the formula (47) can be approximated:
Table 1 presents the values of voltage asymmetry coefficients measured in the steel supply network and determined by various methods. Additionally, voltage asymmetry coefficients determined by different methods were compared with those presented by Kowalski in [
56]. The asymmetry coefficient determined according to [
50,
51] based on the formula [
52,
53] is burdened with the largest error amounting to a maximum of 14.6% (average 7.47%) in relation to the reference values. The method of differential coefficients proposed by the author allows for the determination of the asymmetry coefficient with an average error, compared to the reference values, on average 0.87%, which is similar to the error in the method presented in Gost 13109-97 [
55], at 0.94%.
Similarly, as in the case of voltage fluctuations, the magnitude of the asymmetry arising in the supply network of arc devices, apart from the current asymmetry, is also influenced by the amount of power consumed by the furnace in relation to the short-circuit power of the supply network, which can be written with the formula:
where:
K2I is the current asymmetry factor
Sn is the rated apparent power of an arc furnace
Scc is the short circuit power of the supply network
Based on the measurements carried out in the networks supplying arc furnaces, it was found that the current asymmetry coefficient rarely exceeds the value of 30% [
57].
Assuming that the asymmetry factor should not exceed 1% for 110 kV lines and 2% for 110 kV lines, it is possible to determine the ratio of the rated furnace power to the short circuit power of the network at which an unacceptable voltage asymmetry will not occur [
44].
For the connection groups I-II, the relationship can be presented:
which corresponds to:
For connection groups III-VI:
and respectively:
In monograph [
56], the author presents a relationship that should be met, so that a single-phase receiver can be connected to the network, without the need to install any symmetrization devices:
Assuming that the voltage asymmetry factor should not exceed 2% and k = 1.1, the short-circuit power should be more than 60 times higher than the receiver’s power.
Structural asymmetry is associated with the construction of multi-current circuits feeding an arc furnace. The high-current track is designed to supply electricity to a charge. Knowledge of the high-current path parameters allows for the determination of the arc operating characteristics. These characteristics show the relationship between basic electrical and thermal quantities determining the operating state of a furnace as a function of arc current. Operating characteristics are determined for individual furnace transformer taps. They can be determined by calculation methods, or measuring methods for working arc devices. Knowledge of high-current path parameters is also necessary to determine the electrode position regulator settings. The author has developed a method for determining the actual values of high-current path parameters based on the measurements of currents and voltages at the conclusion of electrodes with a charge, using measurement data from power quality parameters analyzers. This method has been patented and verified in real conditions. A short circuit is carried out with a simultaneous immersion of all three electrodes in molten metal when feeding the furnace with the lowest voltage, and the highest inductance in the high-current path. This is to limit the flowing short-circuit current. The electrodes are lowered in such a way that their ends are immersed in liquid metal, ensuring a complete short circuit, and then immobilized. Details of the method are presented in the publication [
46].
4. Distortion of the Voltage Curve
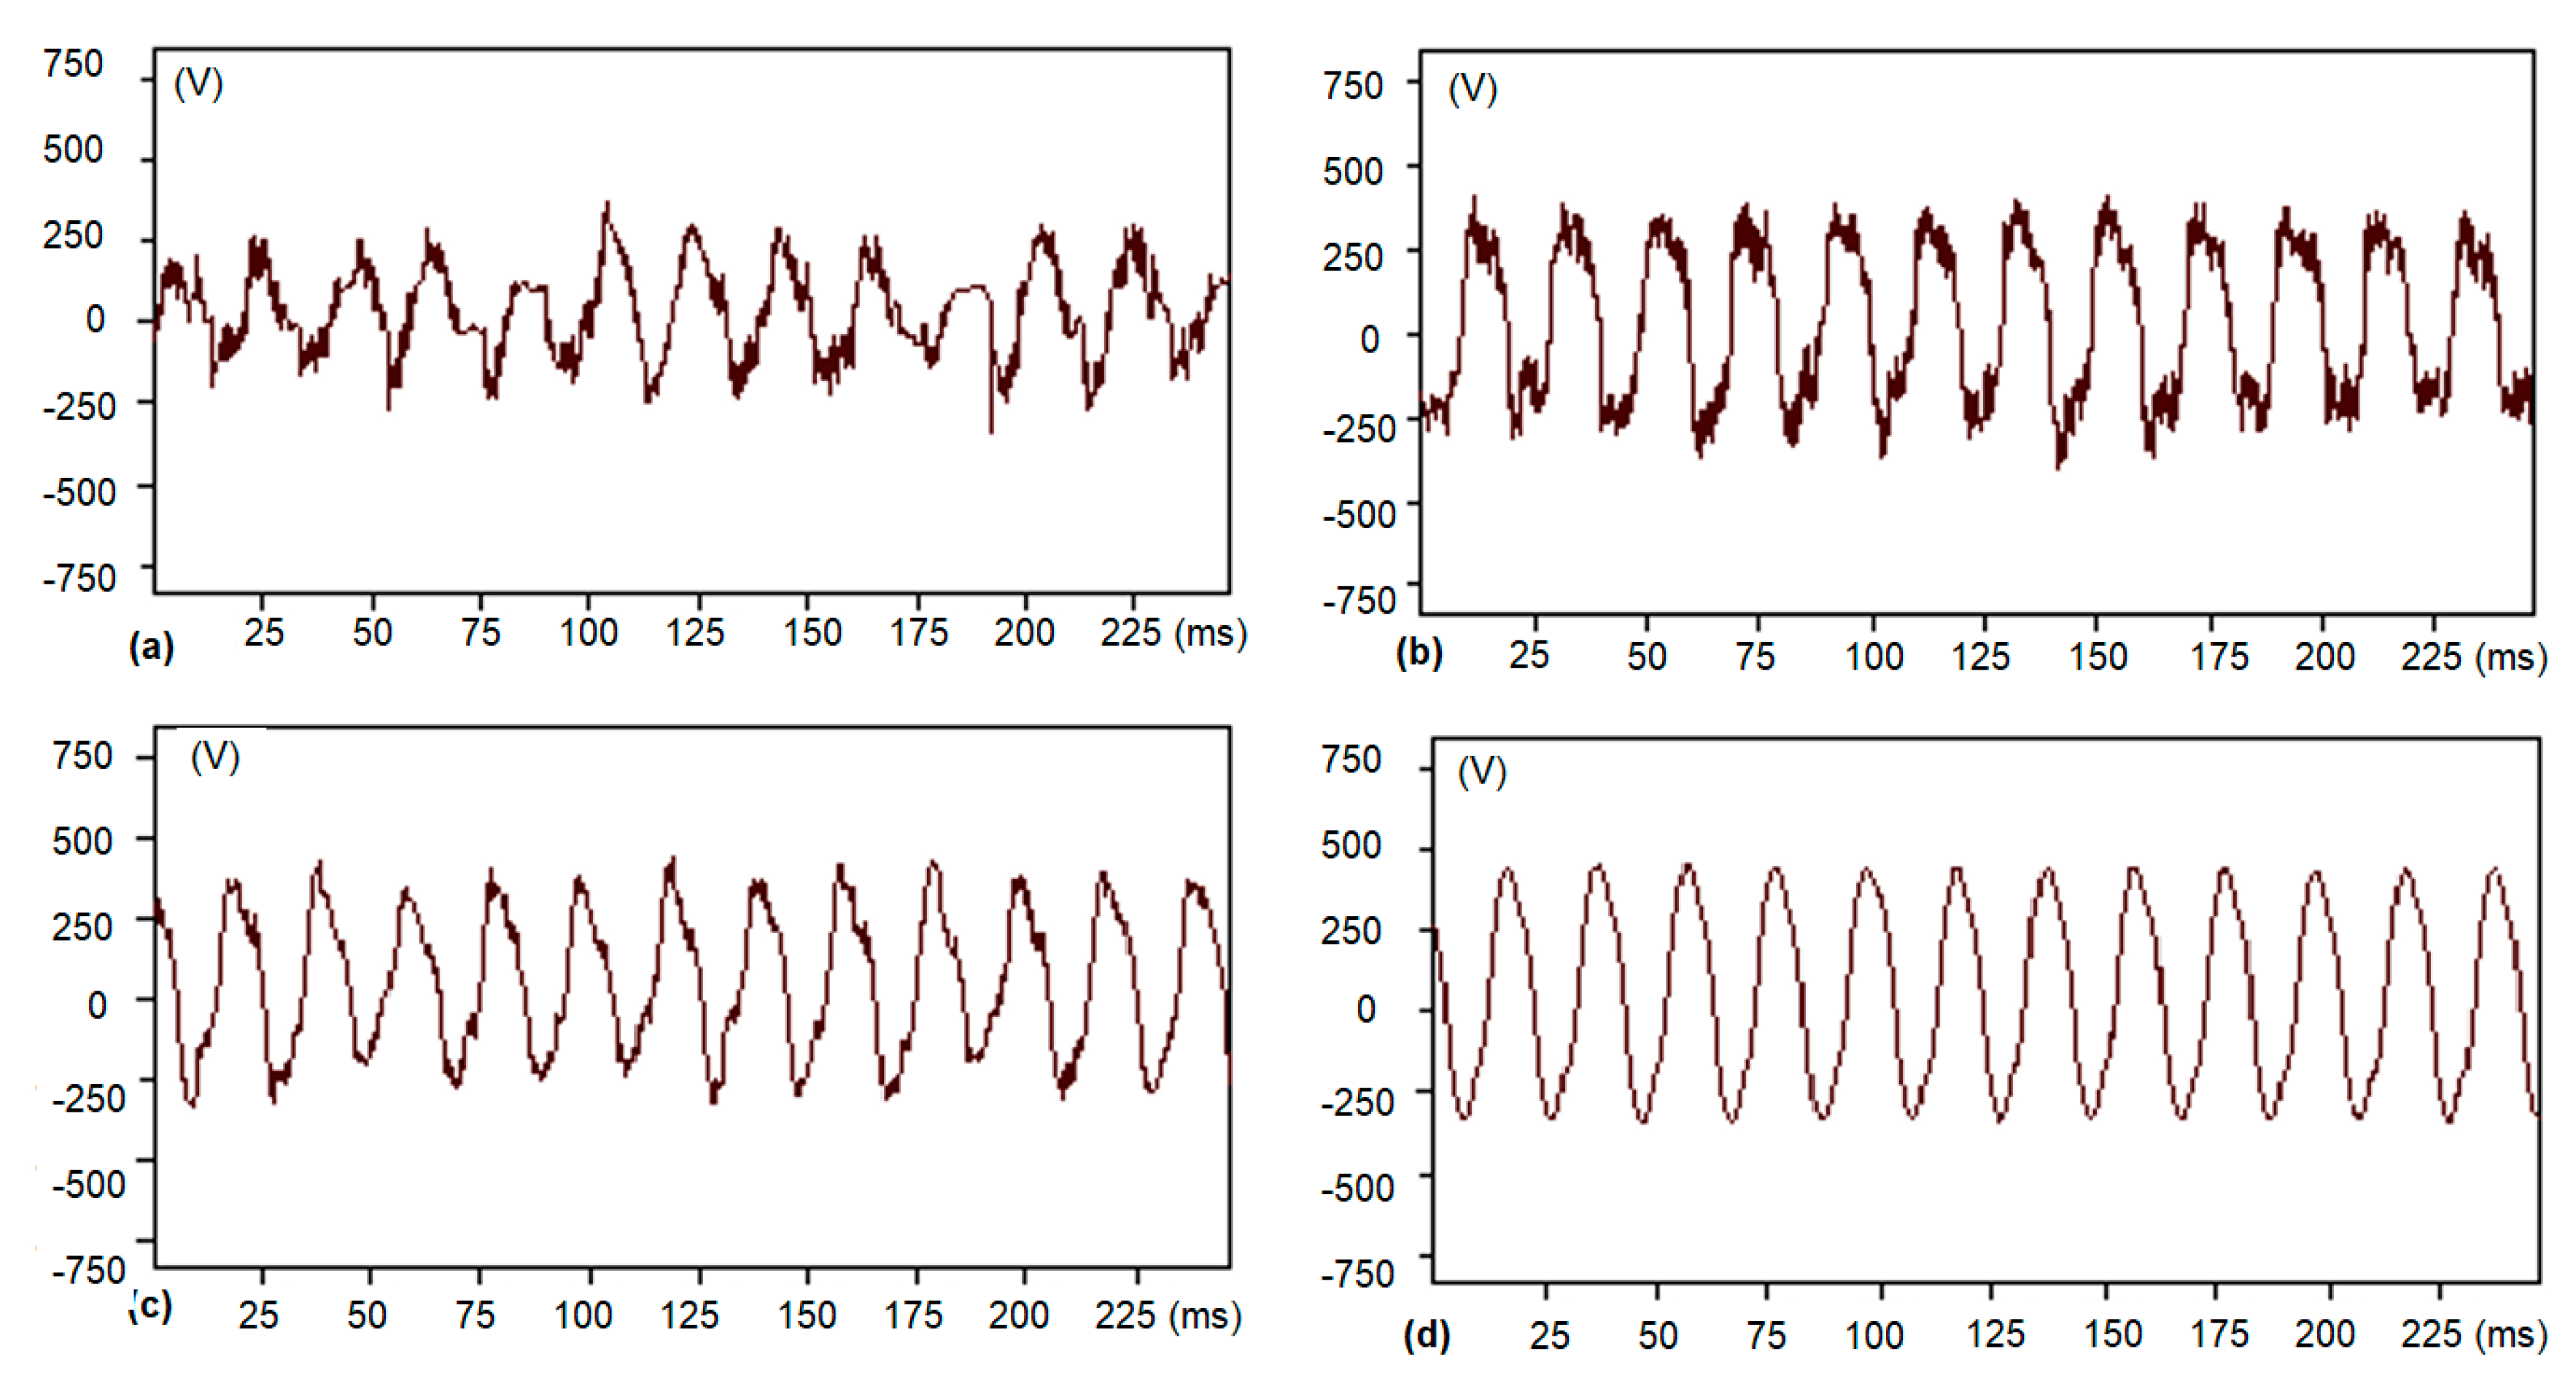
The degree of arc voltage distortion has a direct effect on the furnace current shape. Distorted current flowing in the supply network causes a distorted voltage drop at the network impedance, which by subtracting from the sinusoidal supply (source) voltage causes that the supply voltage of the steel mill and steelworks is not sinusoidal. The measured arc voltage waveforms show changes in voltage shape during the melting process in the arc furnace, seen in
Figure 17. In the initial phase, after the ignition of the arc, the voltage shows large stochastic changes that result from the change in the length of the arc moving along the charge. The shapes of the positive and negative semi-periods differ from each other, and their duration is different (
Figure 17a). This causes both even and odd harmonics to form in the supply network. Along with the amount of molten charge under the electrodes, the arc stabilizes. The arc voltage has a rectangular shape, see
Figure 17b. The changes are no longer as stochastic as in the initial casting period. We can talk about the periodicity of changes in the arc voltage. After melting the charge, when the arc is not yet completely covered by foamed slag, the arc voltage is similar to a triangular one, as in
Figure 17c. The temperature of the molten charge, furnace atmosphere, as well as the very electrodes, increases. In the last stage of casting, the electric arc stabilizes. This is due to the fact that the arc is covered with foamed slag, which affects the thermal conditions of the furnace operation. The voltage shape is similar to a sinusoidal one, as in
Figure 17d.
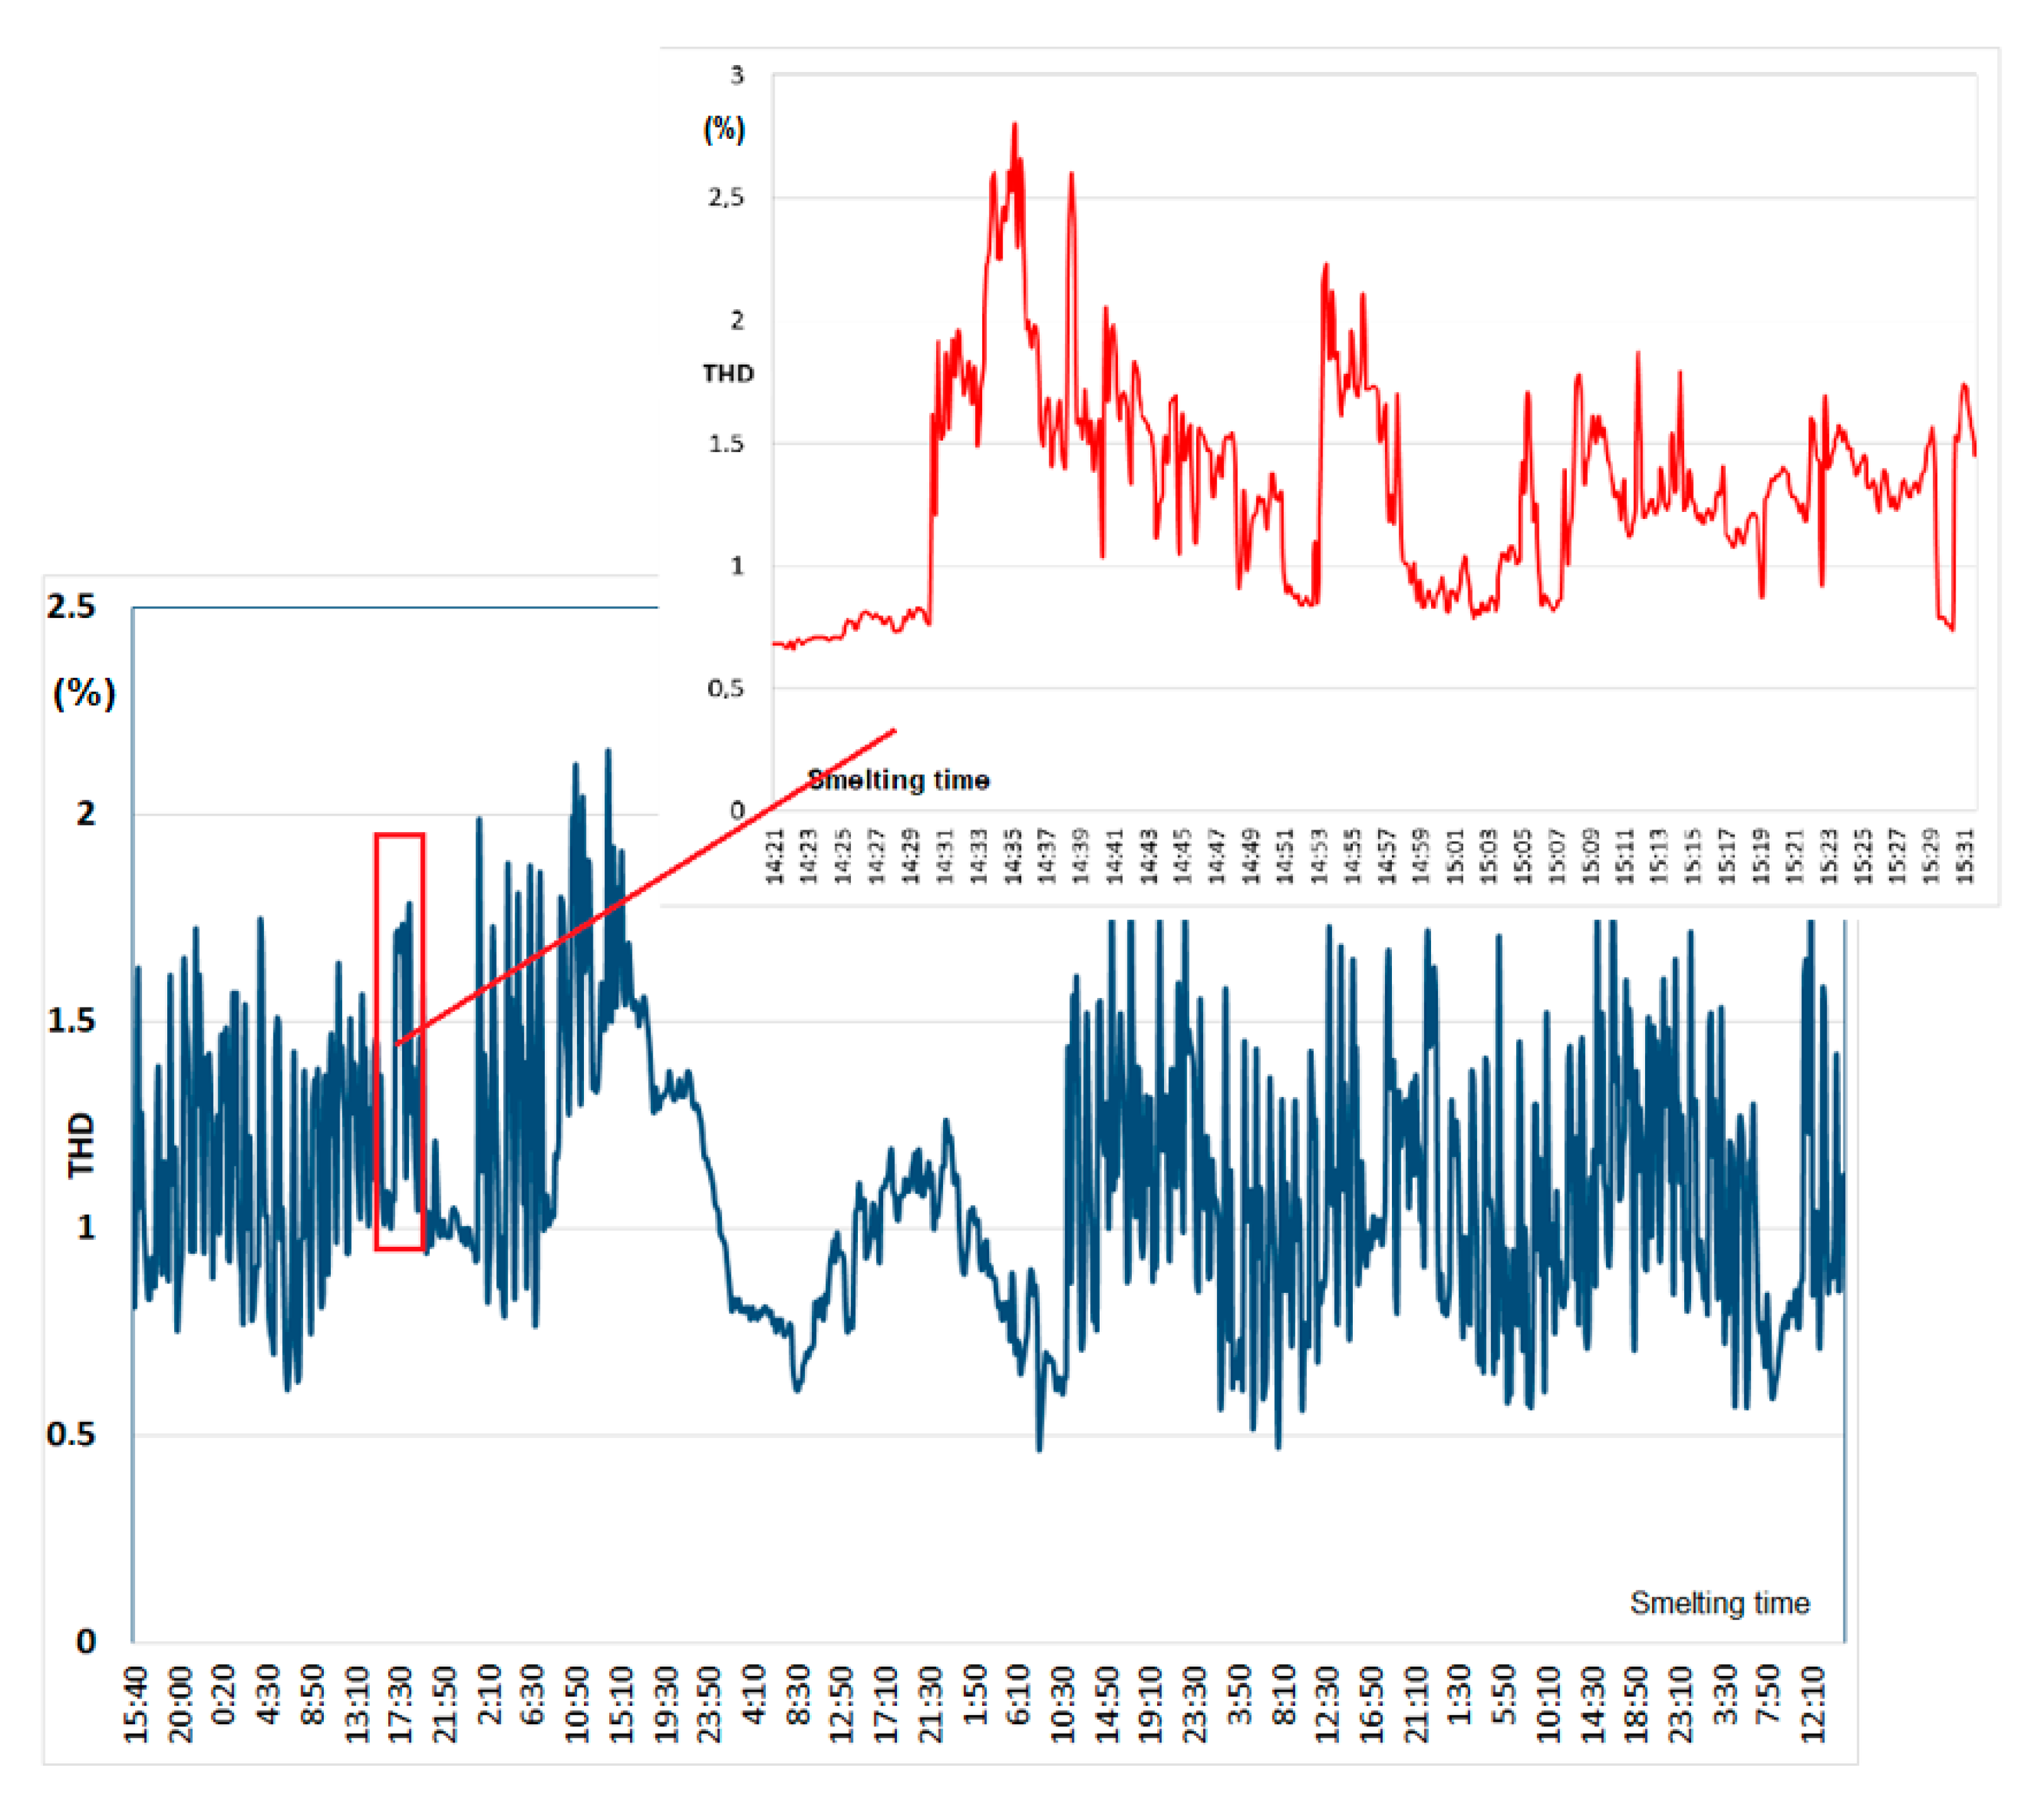
The arc furnace, which is a nonlinear receiver, is a source of higher harmonics. Especially in the initial phase of casting, when the arc voltage in a shape similar to a rectangular waveform occurs as both even and odd harmonics. An additional difficulty in the analysis of voltage distortion in the networks supplying arc devices is the impact of the load of the power system with nonlinear receivers, where the degree of distortion is variable in time, and has a waveform similar to the daily load of the power system, from
Figure 18.
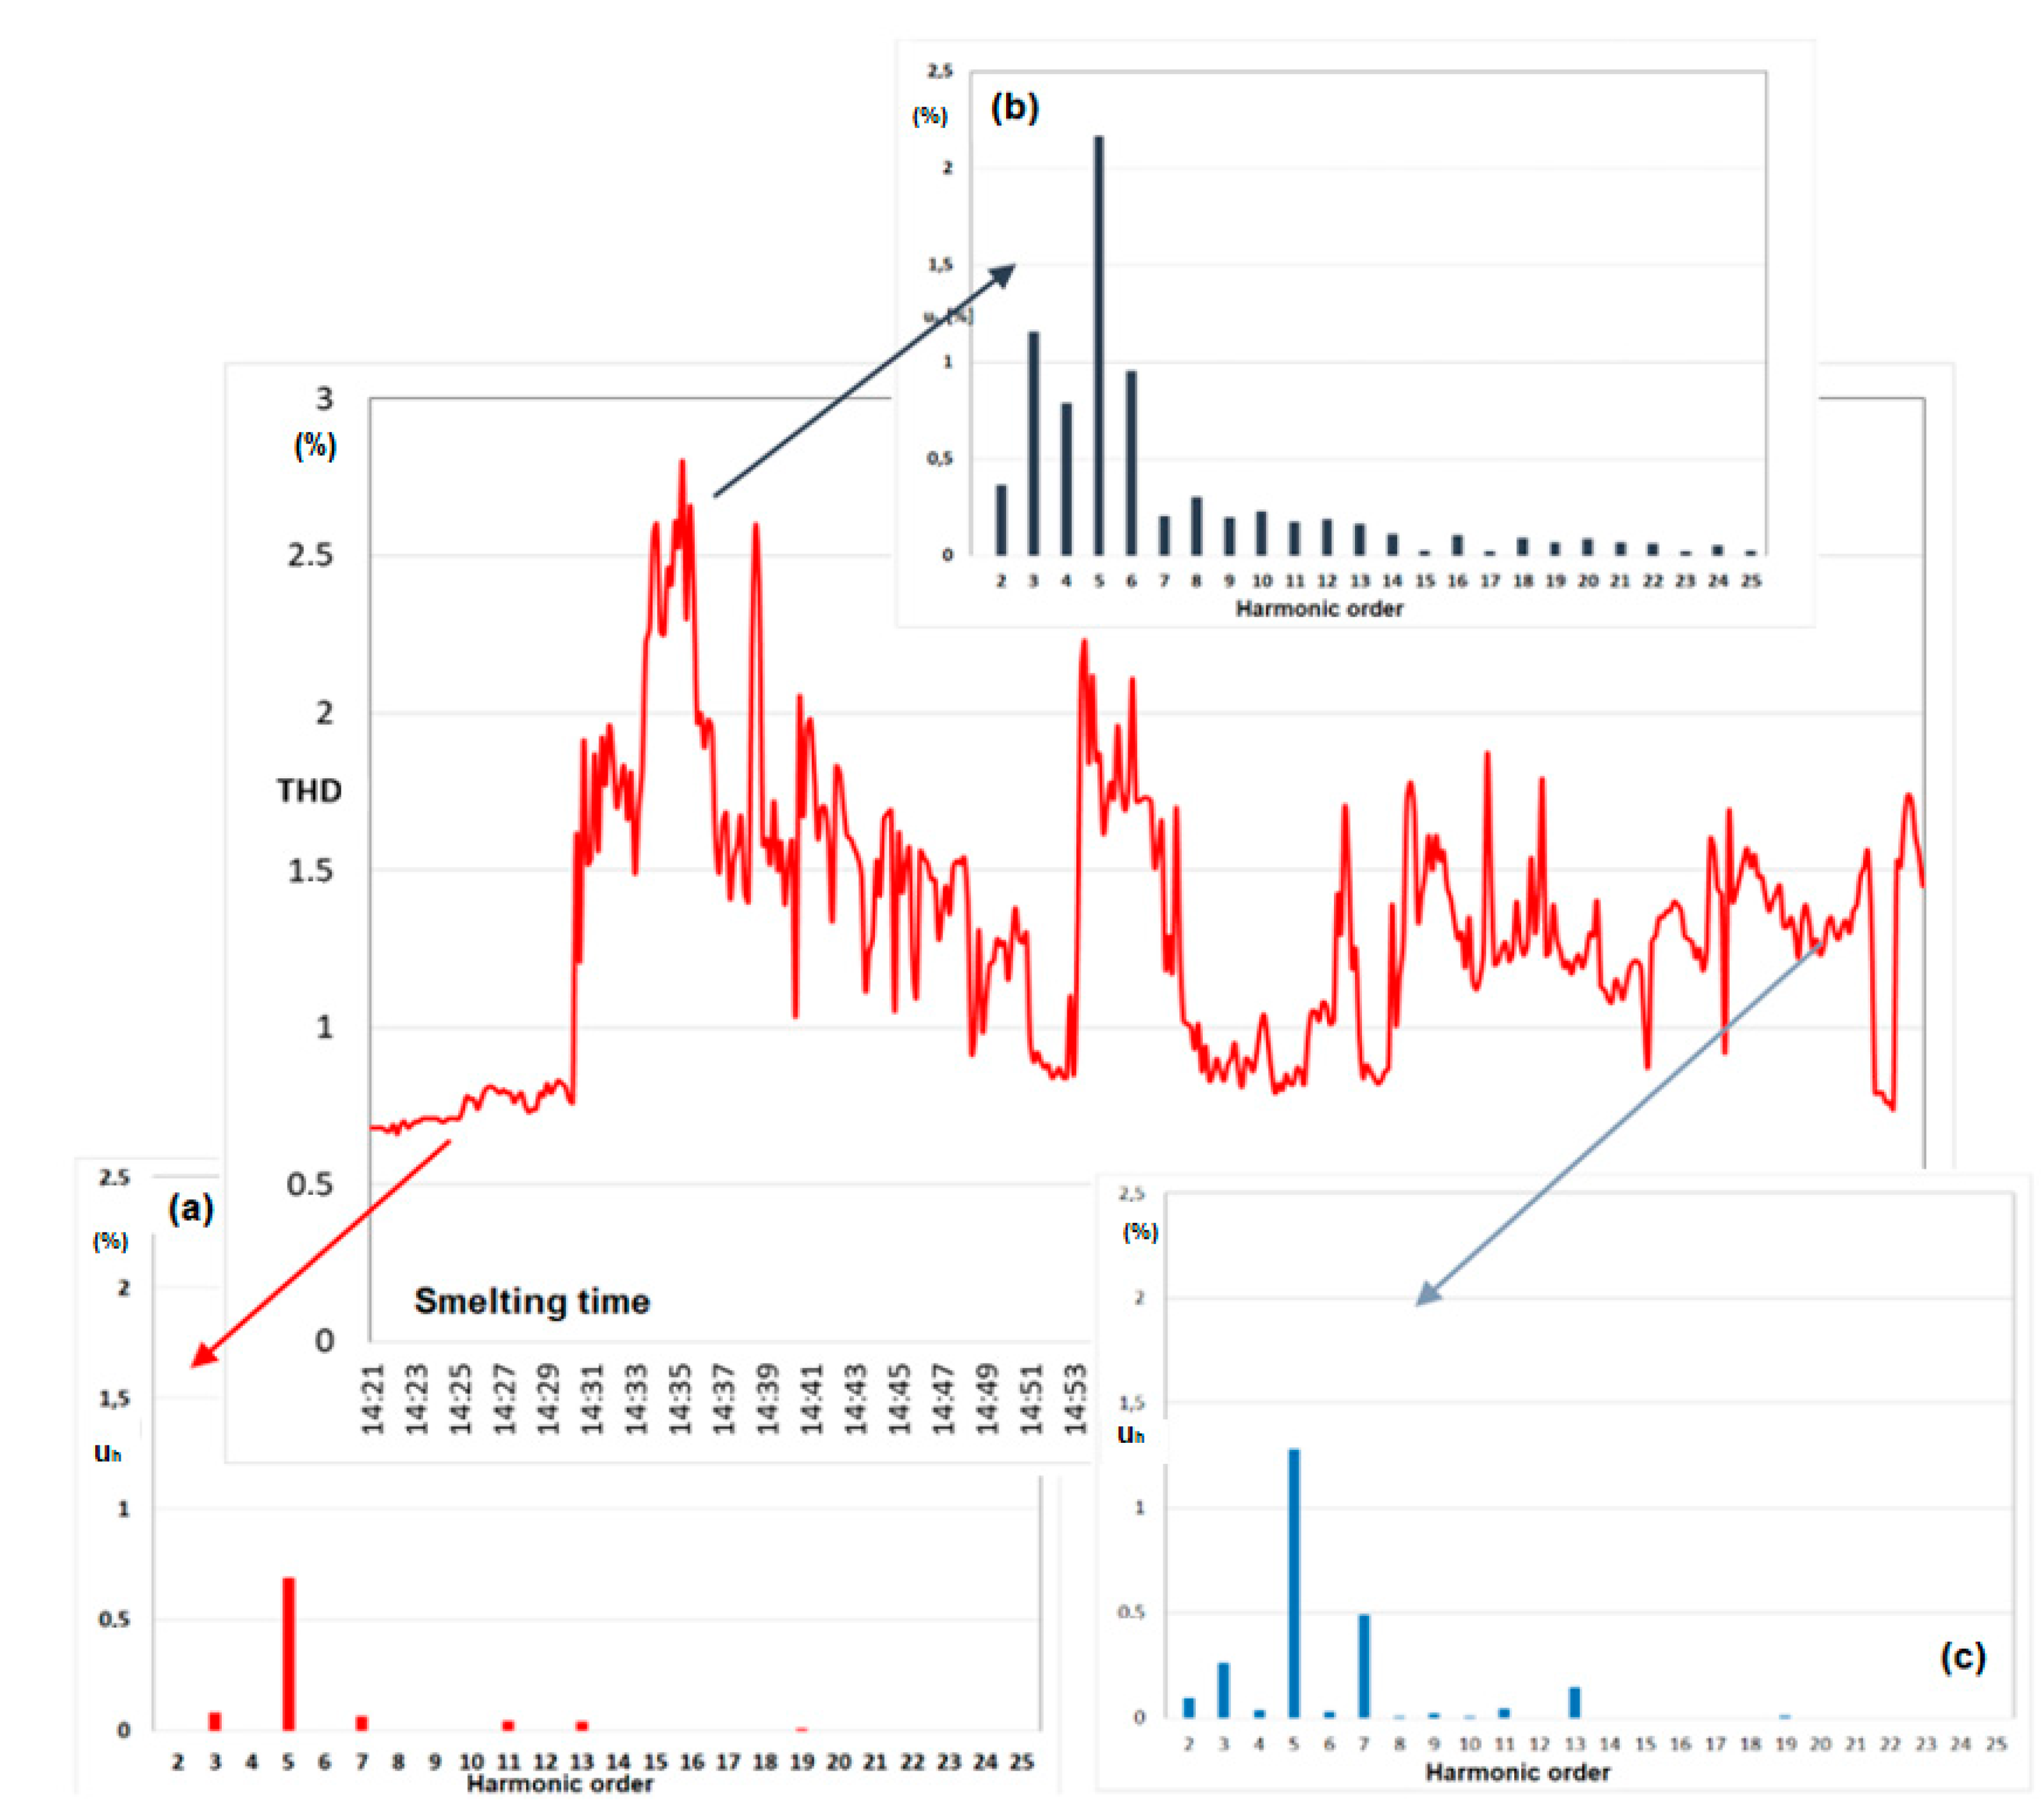
The specific nature of the work of arc furnaces causes that the values of the parameters characterizing the voltage quality change with the stages of melting the charge within the same melt. This also applies to indicators determining the supply voltage distortion, i.e. total harmonic distortion (THD) and uh. In addition, the supply voltage spectrum changes during melting. The values of individual harmonics change, with both even and odd harmonics.
Figure 19 presents changes in the total THD harmonic voltage coefficient recorded during one melt (at five-second measuring intervals) and the spectrum of voltage harmonics with the arc furnace turned off (a), during scrap melting, when this THD reached its maximum value (b), and after the melting charge, before loading the next scrap bin (c). With the furnace switched off, only odd harmonics occur, with the dominant fifth harmonic being u(5) = 0.69% of the basic harmonic (u(3) = 0.09%, u(7) = 0.06%),
Figure 19a. Turning on the furnace causes the flow of distorted current, which increases the voltage distortion of the odd harmonics: u(5) = 2.17%, u(3) = 1.15%, u(7) = 0.2%, and the appearance of even harmonics of respectively: u(2) = 0.36%, u(4) = 0.79%, u(6) = 0.95%, u(8) = 0.30%,
Figure 19b. In the final stage of melting the first scrap basket, the voltage distortion decreases, and the content of individual harmonics is: even u(2) = 0.09%, u(4) = 0.04%, u(6) = 0.03%, u(8) = 0.01%, and odd u(3) = 0.26%, u(5) = 1.28%, u(7) = 0.49%, u(9) = 0.02%,
Figure 19c.
The changing harmonics spectrum in terms of the values of individual components, as well as in order, may cause interference in the operation of the furnace installation devices. Capacitor batteries used to compensate the reactive power of an arc furnace are particularly at risk. Voltage increases due to resonance conditions may appear at the capacitor terminals.
For the model analysis of voltage and current distortion arising in the networks supplying arc furnaces, a single-phase equivalent circuit of an arc device with a multi-voltage model of an electric arc was proposed, as can be seen in
Figure 20.
The multi-voltage model of the arc device was developed on the basis of analysis of the recorded real arc voltage waveforms, while the voltage changes its shape during the individual stages of melting in the arc furnace.
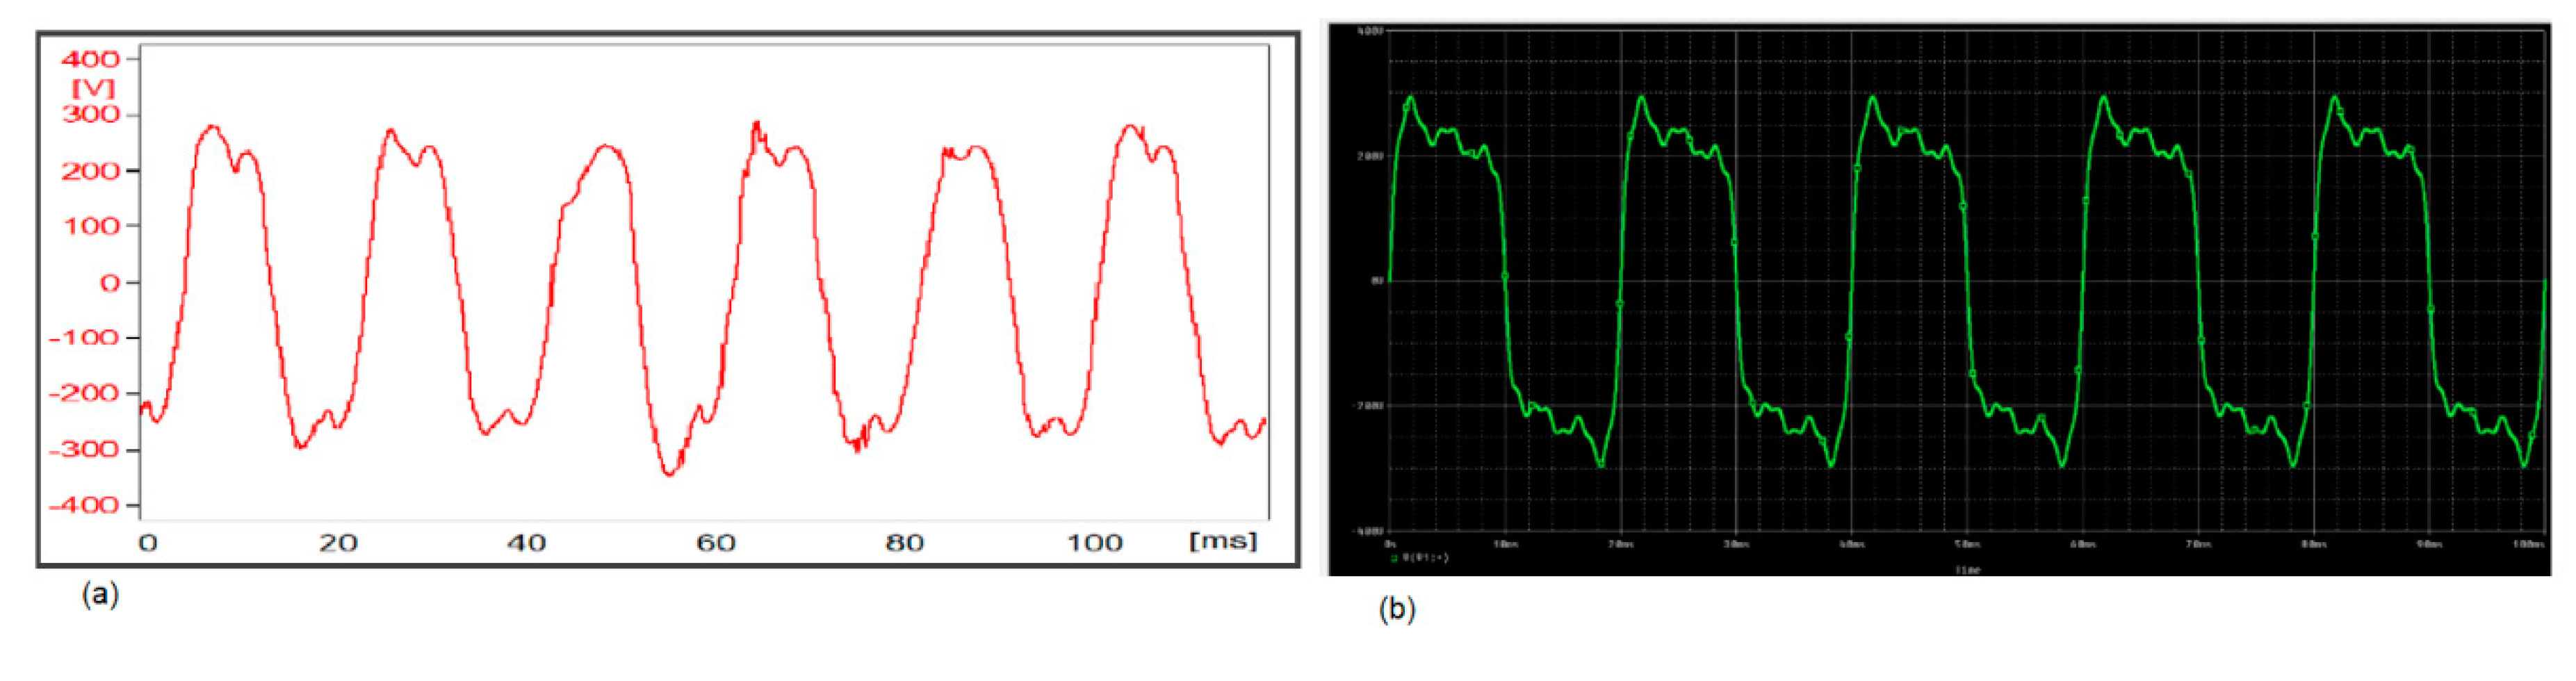
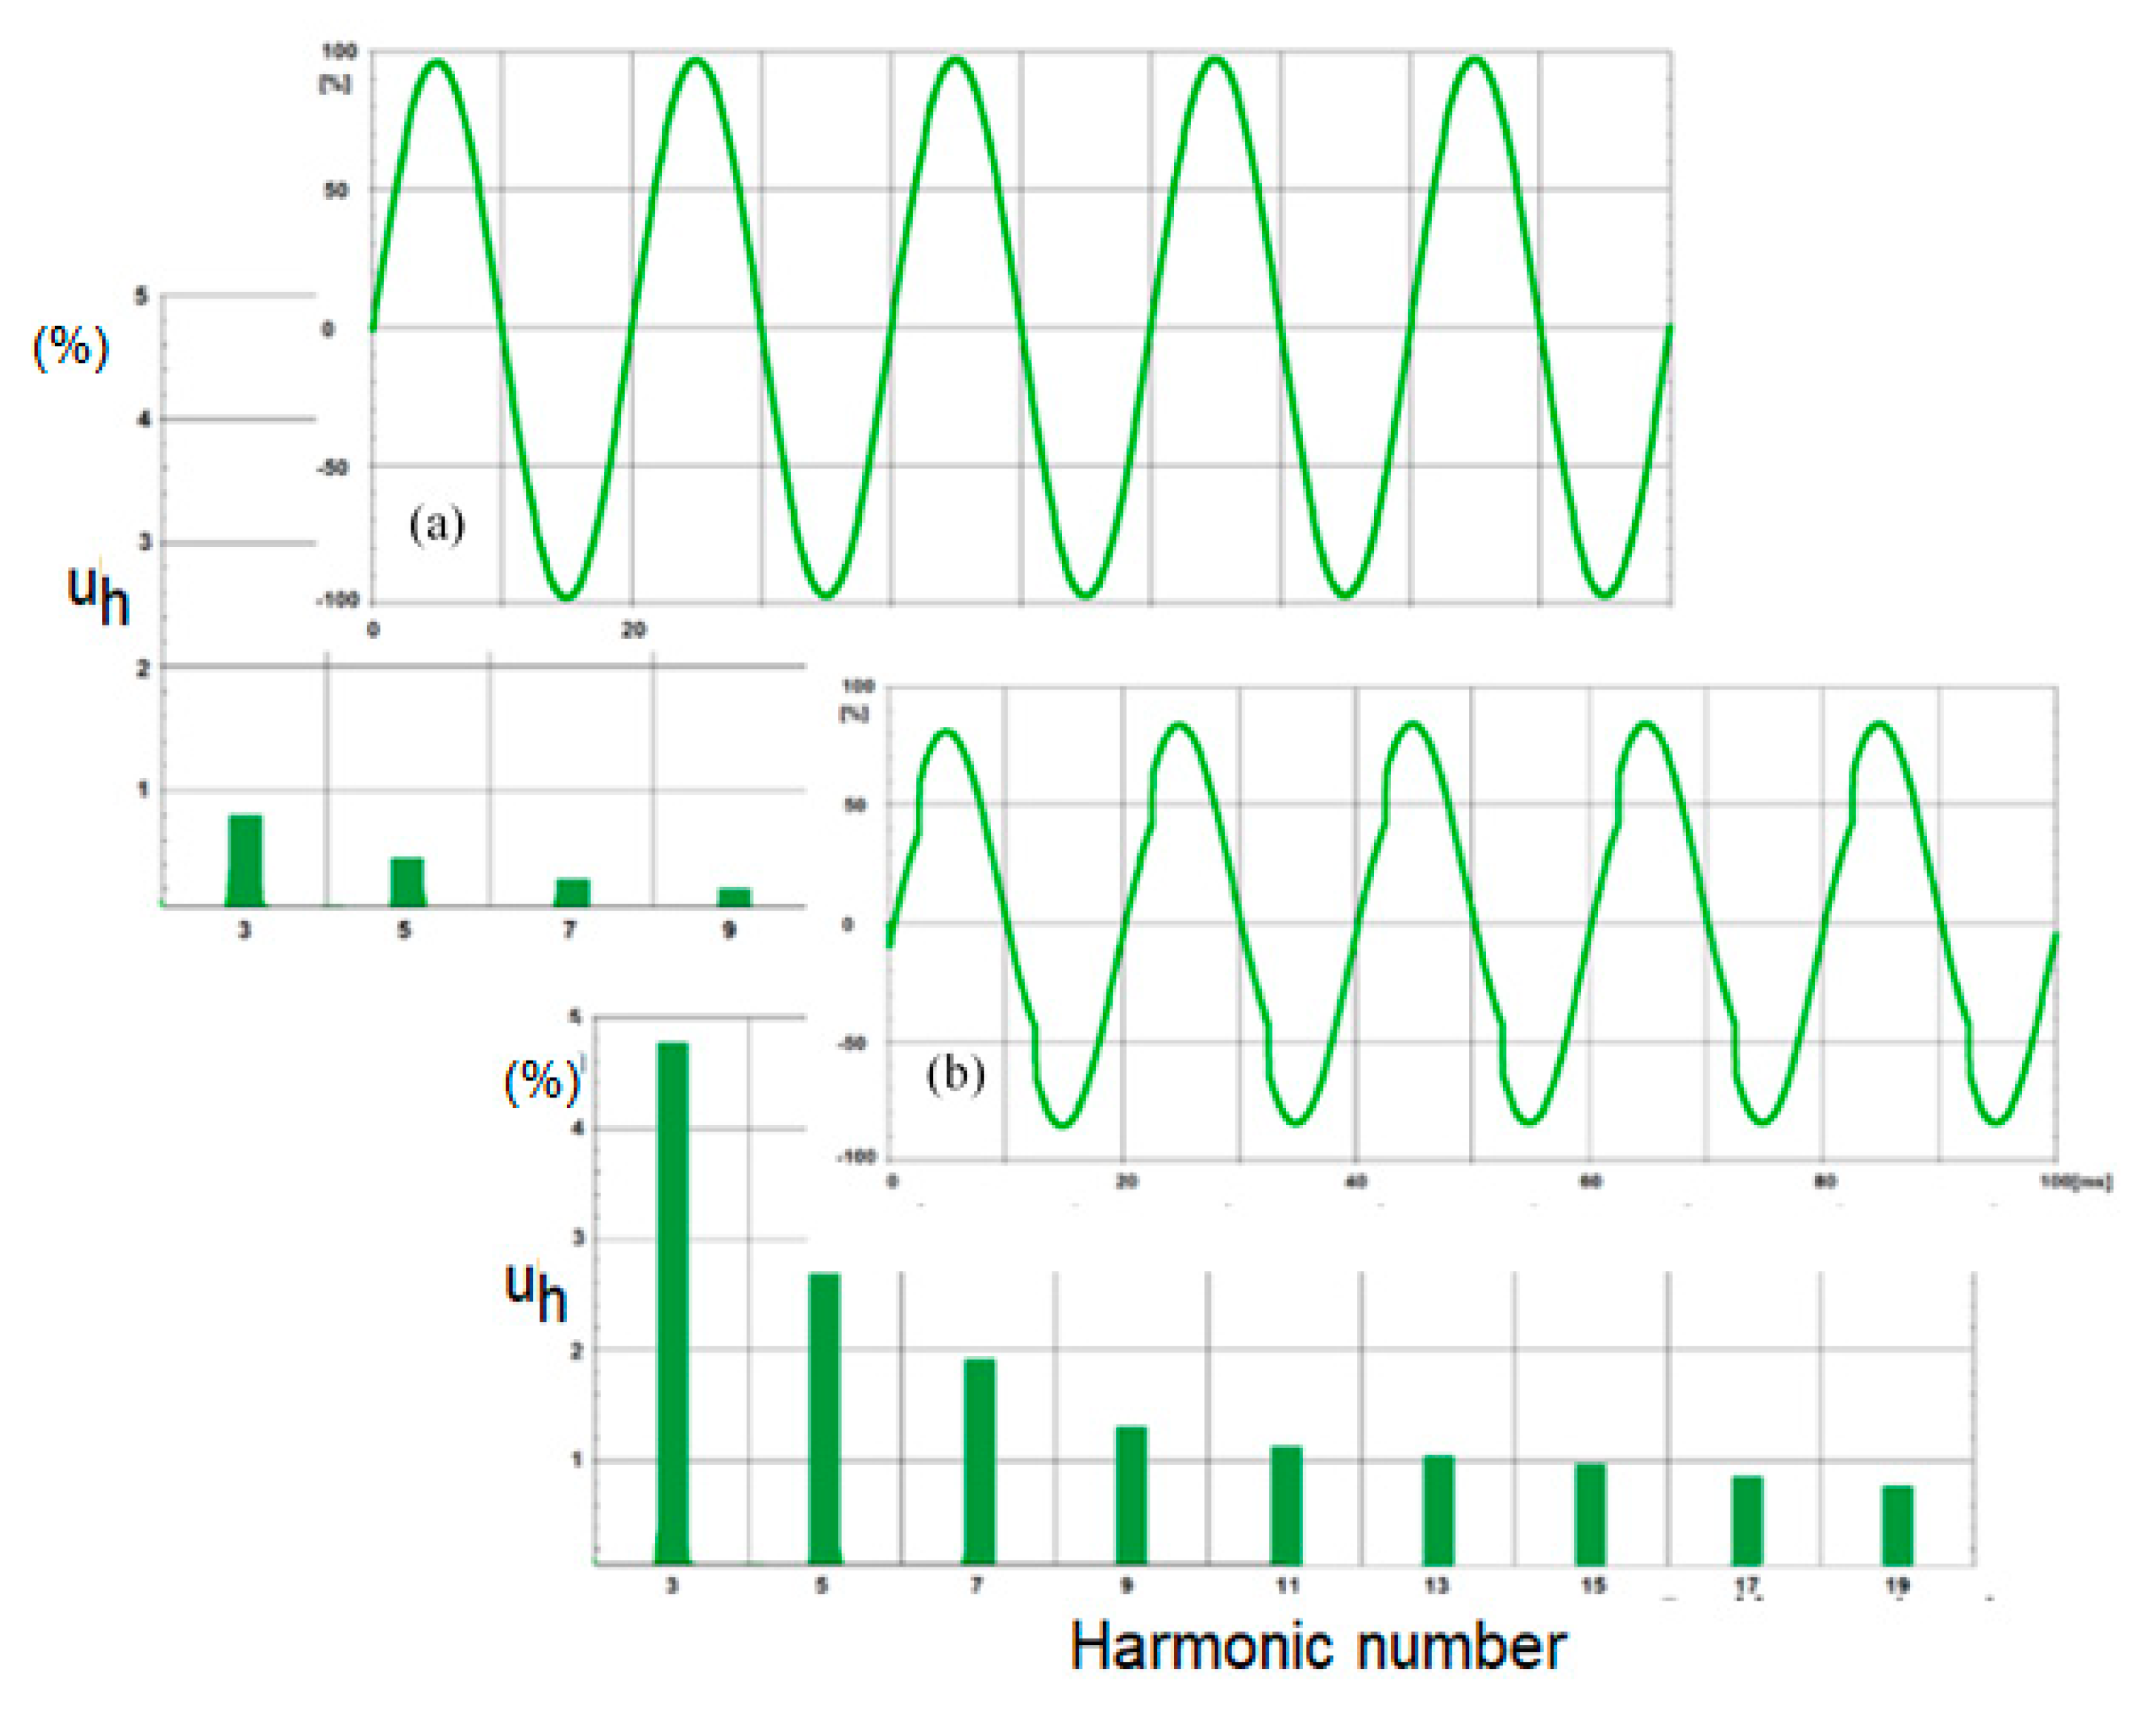
The multi-voltage arc model is a series connection of the voltage sources of successive harmonics. Having arc voltage waveforms recorded in industrial conditions (
Figure 21a), using the fast Fourier transform (FFT), the arc voltage harmonic spectrum was determined, which allowed modeling of the arc voltage with the use of a multi-voltage model (
Figure 21b). Taking into consideration the multi-voltage arc model, determined on the basis of the actual arc voltage curve u
arc(t), voltage waveforms on the steel bus bars u
s(t) were modeled, as in
Figure 22, for two different short-circuit power ratios of the network to the furnace when the electrodes are short-circuited with the charge, respectively, 140 (
Figure 22a) and 20 (
Figure 22b)(similar to voltage fluctuations).
The simulation of arc furnaces based on real data requires a lot of measurements, in a very difficult industrial environment, that will be representative of different power supply systems, and will include individual melts in various types of arc devices. An additional difficulty is taking into account changes in the voltage supplying the steel mill, which is influenced by other nonlinear recipients. The proposed model is a compromise between the accuracy of the mapping voltage and current distortion in networks supplying arc devices and the possibility of using it in practical applications. The multi-voltage model can be included both in dynamic models, when real arc voltage waveforms are used, as well as quasi-dynamic, in the case of theoretical waveforms (rectangle, triangle) representing the arc voltage in individual melting phases.
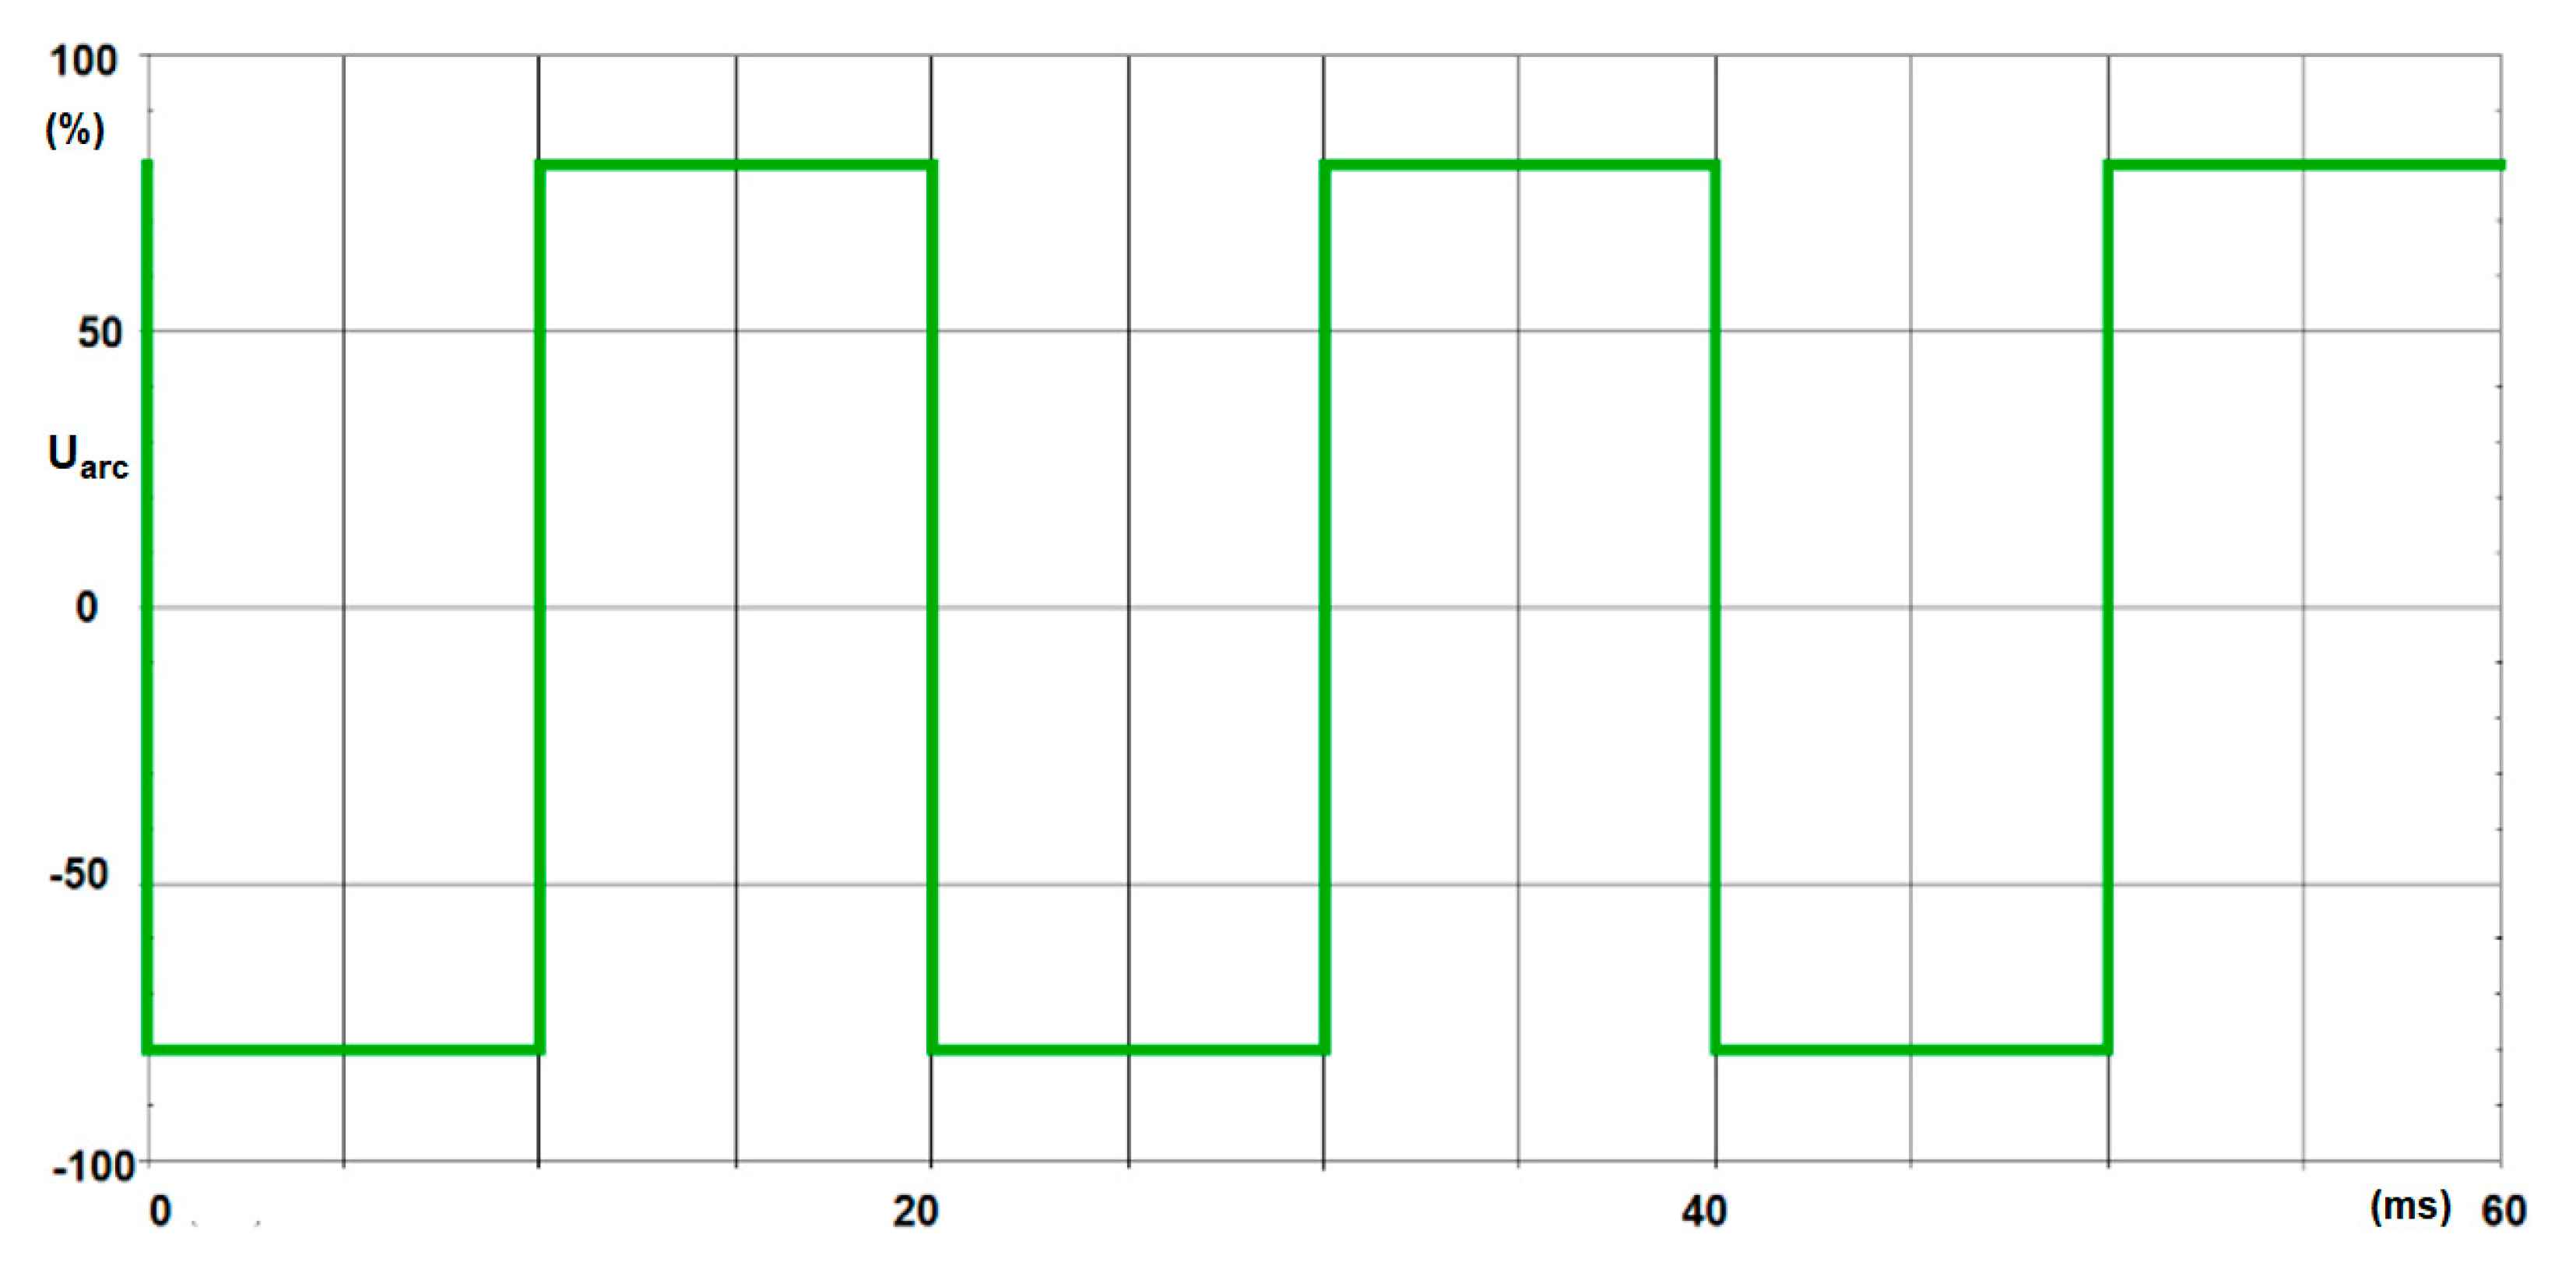
In the case when the arc voltage is presented by a theoretical waveform, e.g. rectangular, we have a characteristic spectral distribution –
Figure 23. The amplitudes of the next odd harmonics are equal to the ratio of the amplitude of the first harmonic to the harmonic order, h, e.g., u(3) = u(1)/3, u(5) = u(1)/5, u(7) = u(1)/7, … u(h) = u(1)/h. It can be assumed that in the initial phase of casting, the arc voltage takes a rectangular shape [
59,
60].
In the further stages of melting the charge, the arc voltage distortion is reduced (close to triangular) to reach a sinusoidal wave in the final phase.
Using the multi-voltage model of an arc device (
Figure 24), a simulation of the influence of an arc furnace on voltage distortions in the steelworks supply network, taking into account the steel plant supply conditions, was carried out. The parameters of the network supplying the steel mill and the steel line supplying the steel mill were the same as for the voltage fluctuation analysis.
The effect of the arc furnace on the voltage distortion in the steel mains supply network increases with increasing impedance of the steel mains supply network.
Figure 24 presents the harmonics spectrum and the voltage supplying the steelworks for various short circuit power supplying the steelworks at a rectangular arc voltage.
Figure 24a relates to the distortion and voltage drop at the impedance of the network supplying the steel mill, with the short-circuit power ratio of the network to the power at short circuits of the electrodes with the charge of
Scc/
Sctr = 140, respectively,
Figure 24b -
Scc/
Sctr = 20.
Due to the fact that arc devices are characterized by significant inductive reactive power consumption, it is necessary to use reactive power compensation devices. These include capacitors connected in parallel to the furnace installation, e.g. in the station from which the furnaces are supplied.
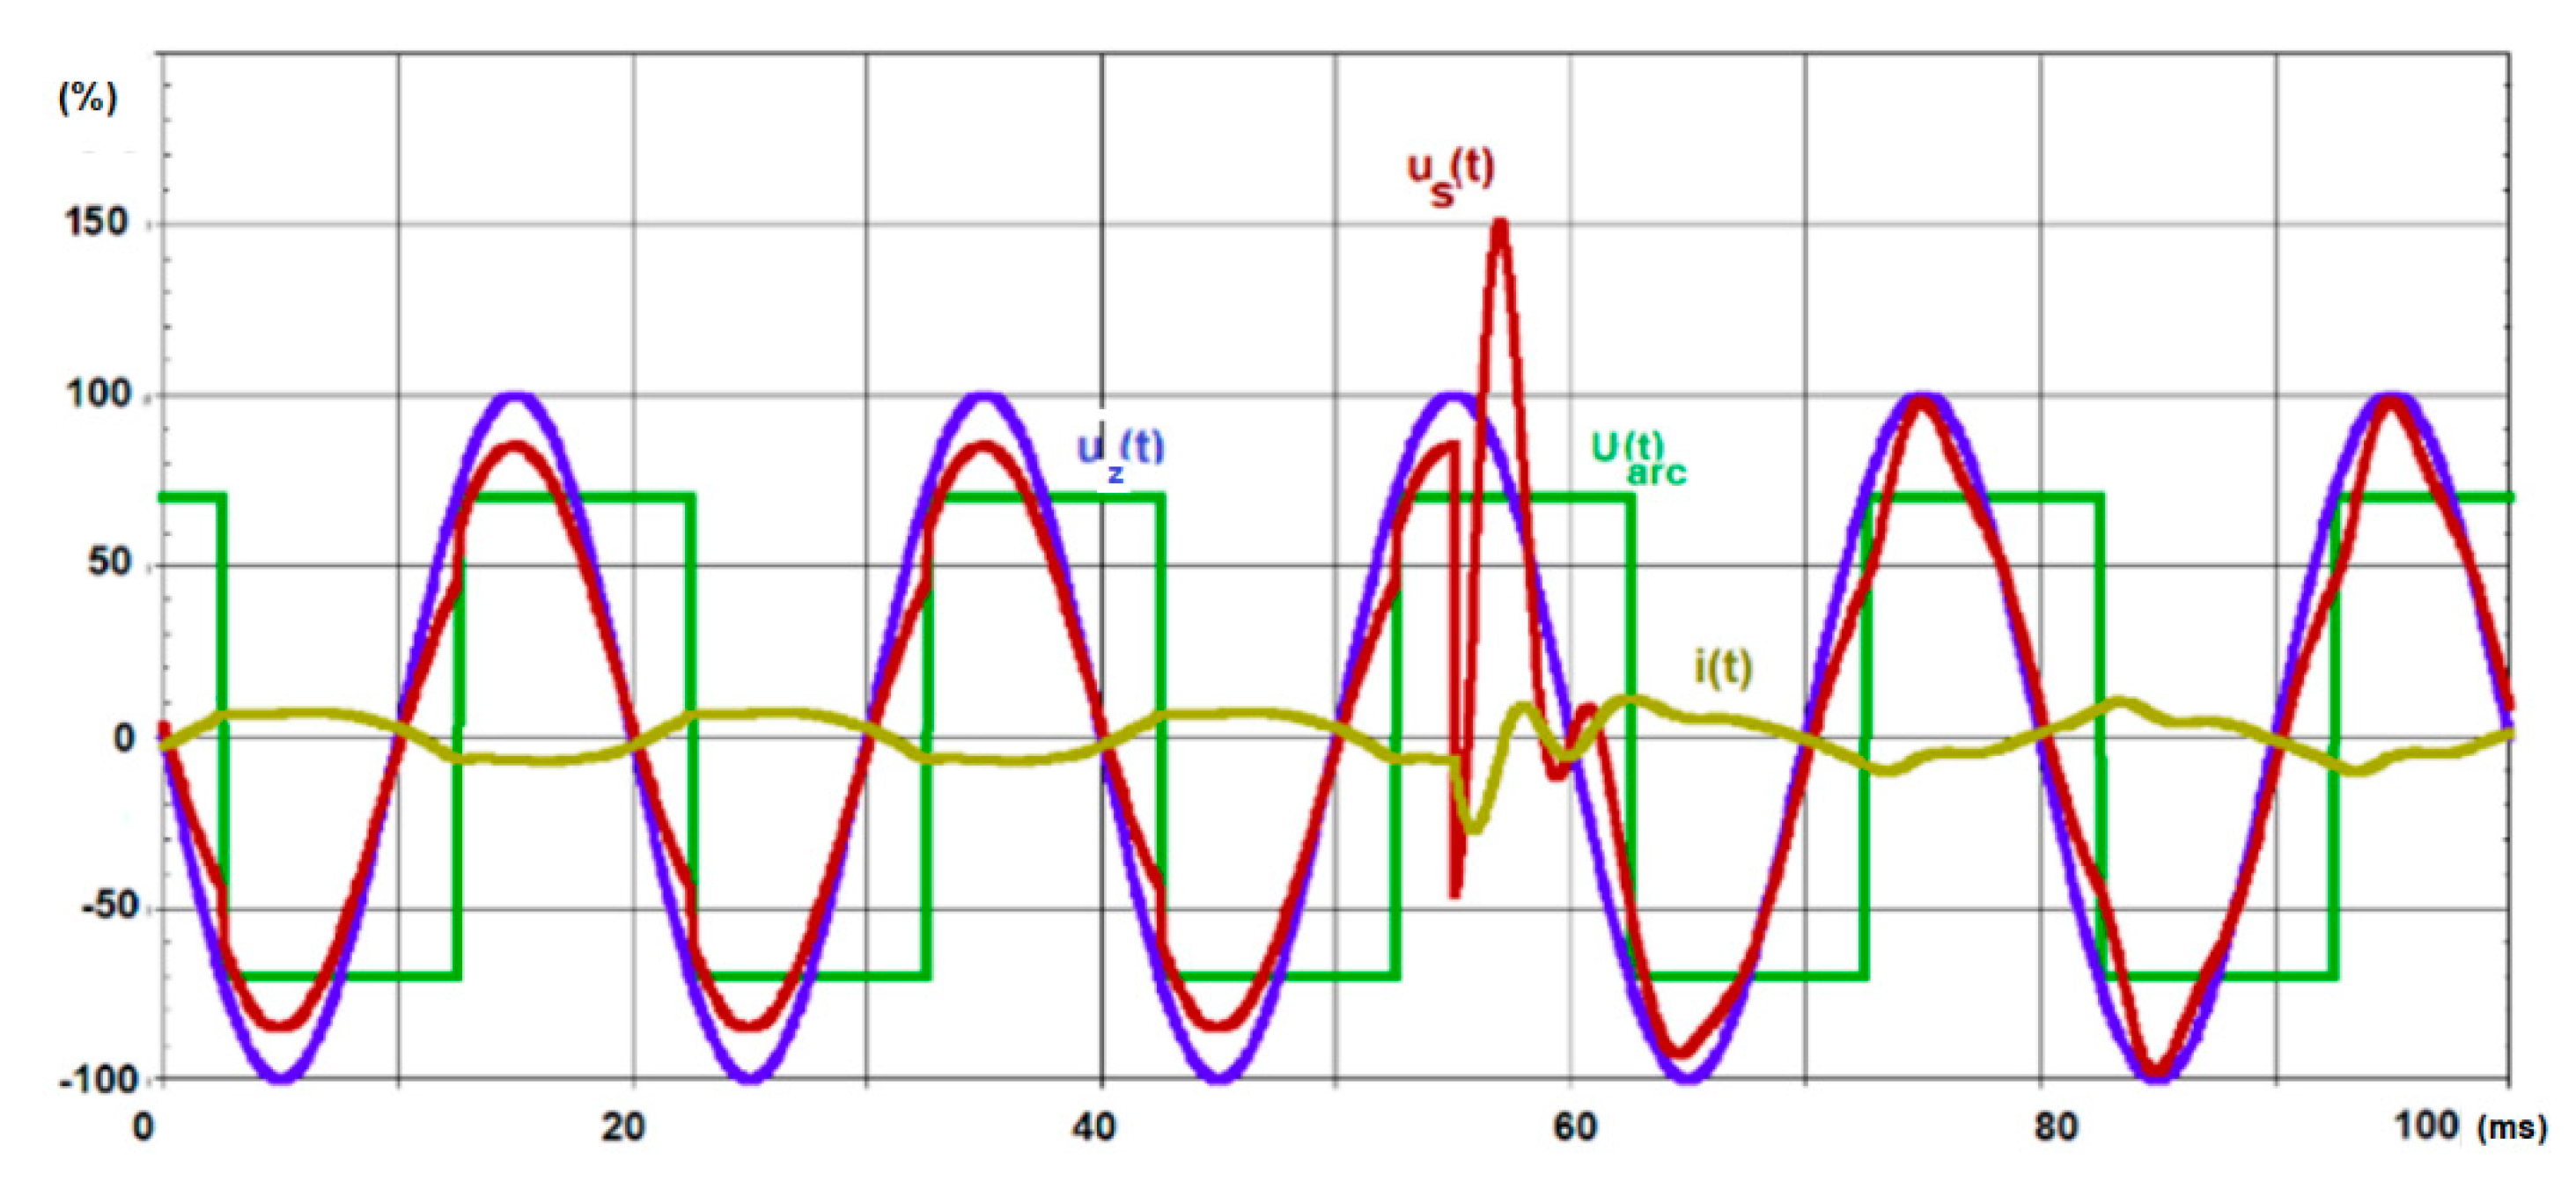
Using a multi-voltage model of the electric arc, the author analyzed the impact of the attached capacitor bank on improving power conditions on steel rails. Switching on the capacitors causes distortion (during the transient state) of the current shape, as well as the increase and oscillation of the voltage supplying the furnace transformer, as in
Figure 25.
The range of voltage changes us(t) and the duration of transients depends mainly on the parameters of the RL and XL supply lines.
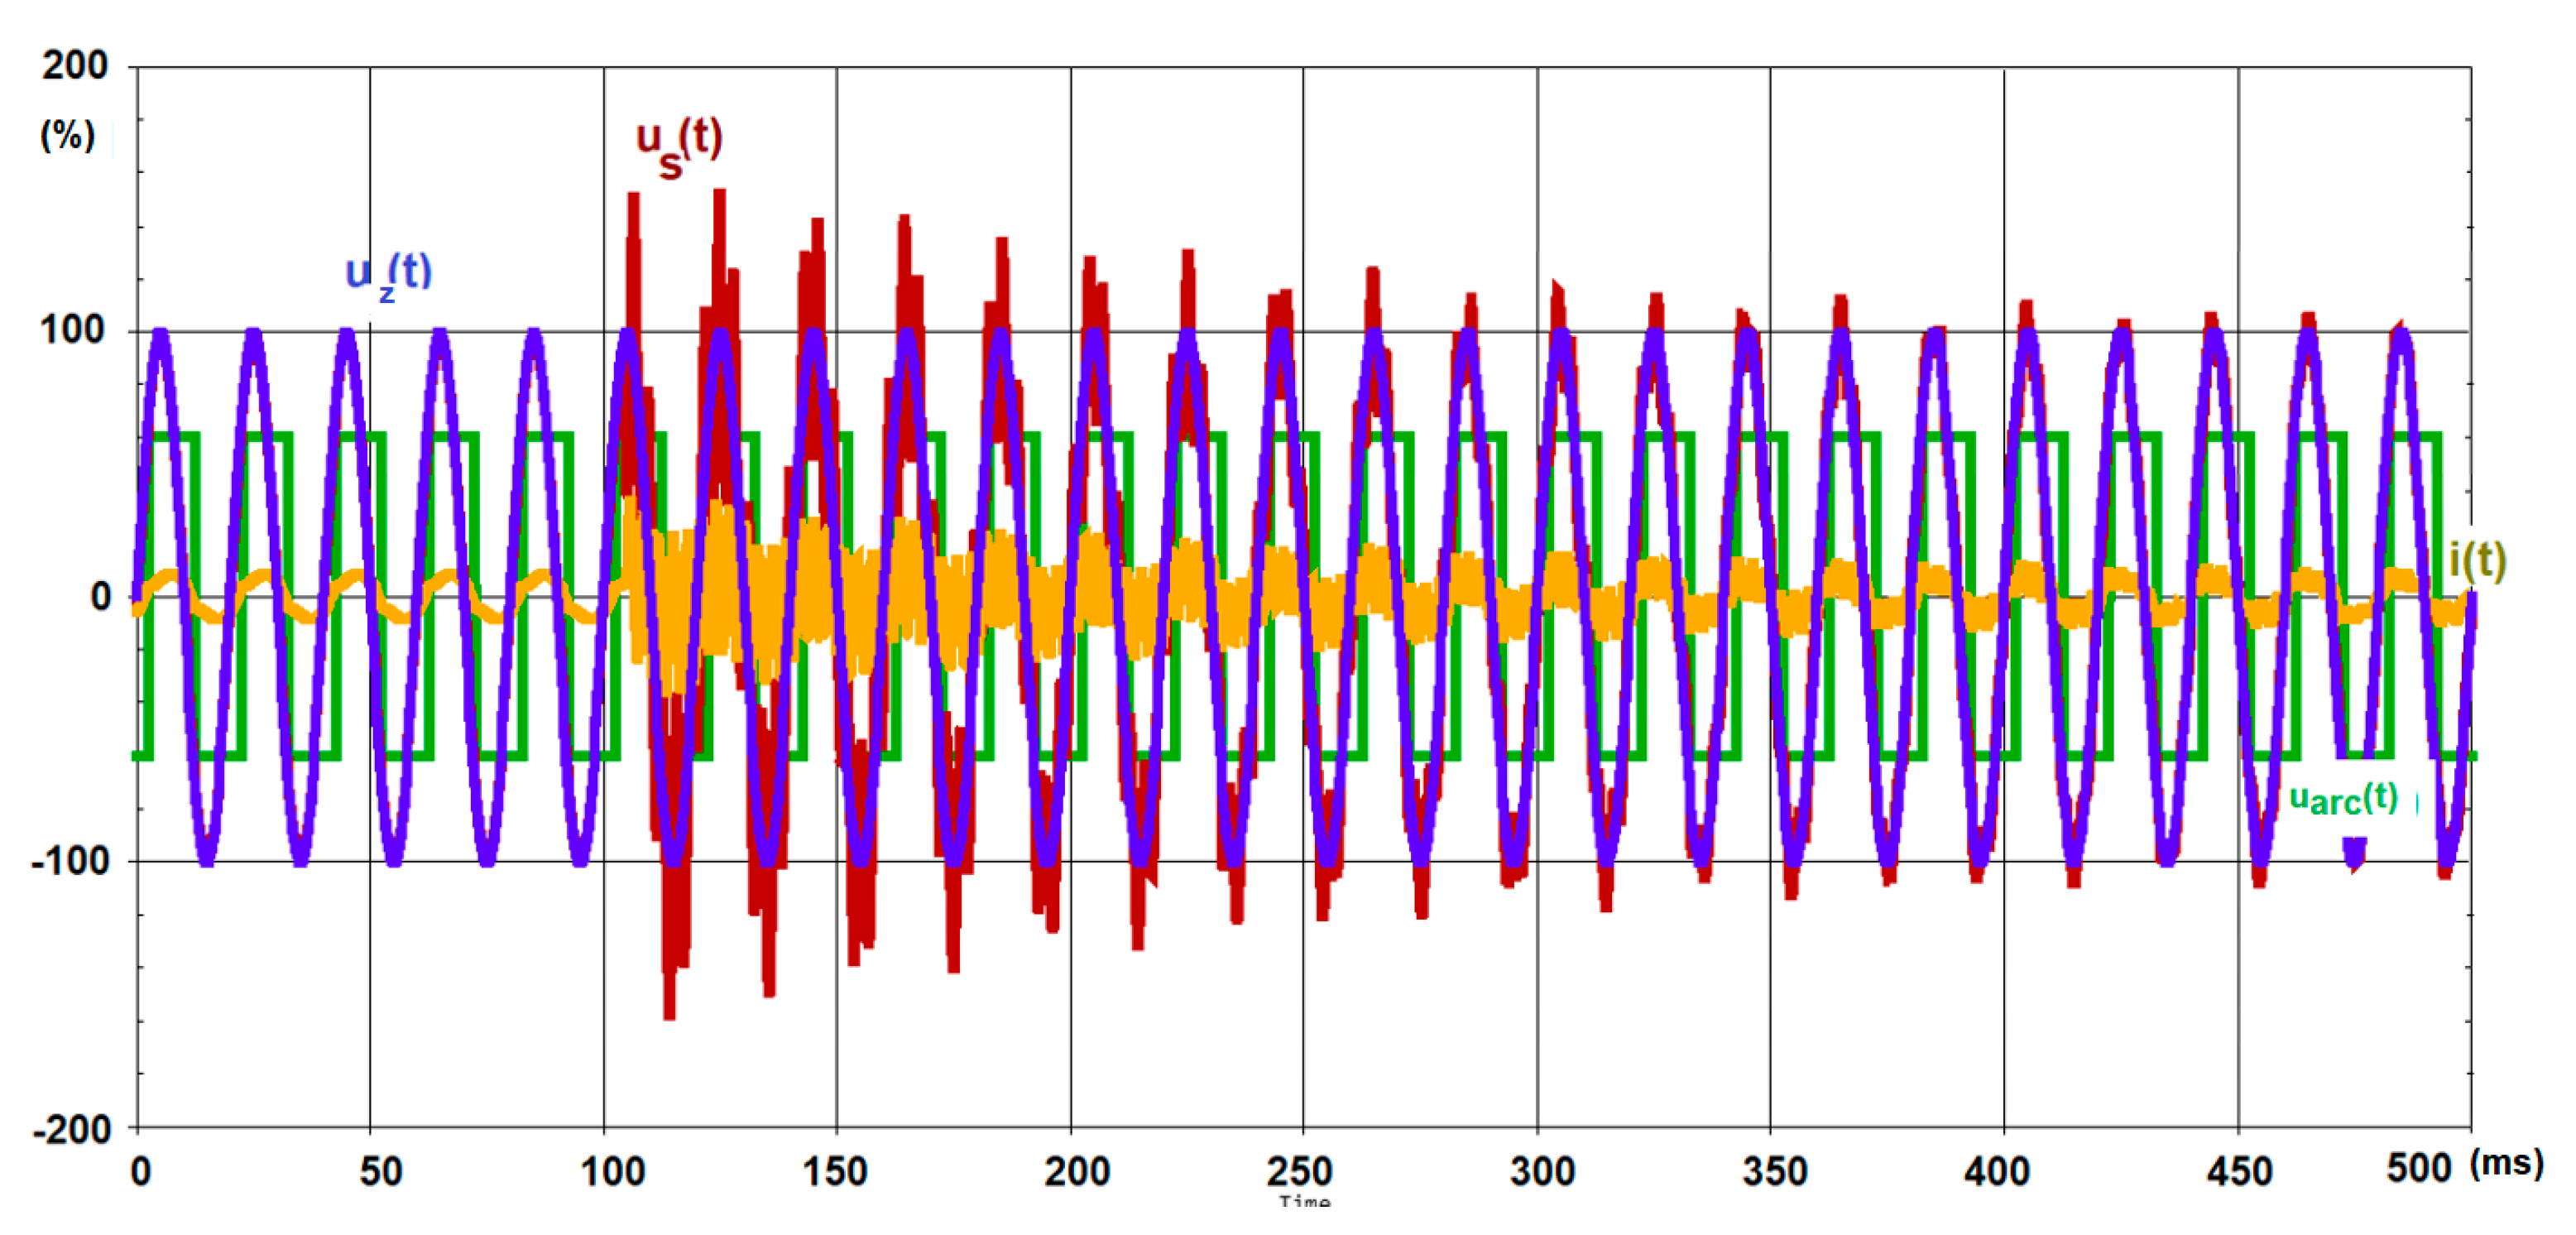
Figure 26 shows the following waveforms: voltage supplying steelworks
uz(t), voltage on steel bus rails
us(t) and current in the steel supply line
i(t) when switching on capacitor banks for networks with low resistance and reactance.
As already mentioned, in the case of worse furnace supply conditions (lower short-circuit power), there is a greater impact of the furnace on the value and distortion of the voltage supplying the steel mill.
Sudden voltage increases due to transient states occurring when switching on the capacitor banks can be limited by the use of chokes.
The proposed model takes into account changes in arc voltage amplitude and spectrum during melting. For another phase of casting, e.g. before loading another scrap bin, based on the recorded arc voltage, you can model a different arc voltage.


