Article

Underfrequency Load Shedding: An Innovative Algorithm Based on Fuzzy Logic

by
Robert Małkowski
* and
Janusz Nieznański
Gdańsk University of Technology, 11/12 Gabriela Narutowicza Street, 80-233 Gdańsk, Poland
*
Author to whom correspondence should be addressed.
Energies 2020, 13(6), 1456; https://doi.org/10.3390/en13061456
Submission received: 17 February 2020 / Revised: 19 March 2020 / Accepted: 20 March 2020 / Published: 20 March 2020

Abstract

:
In contemporary power systems, the load shedding schemes are typically based on disconnecting a pre-specified amount of load after the frequency drops below a predetermined value. The actual conditions at the time of disturbance may largely differ from the assumptions, which can lead to non-optimal or ineffective operation of the load shedding scheme. For many years, increasing the effectiveness of the underfrequency load shedding (UFLS) schemes has been the subject of research around the world. Unfortunately, the proposed solutions often require costly technical resources and/or large amounts of real-time data monitoring. This paper puts forth an UFLS scheme characterized by increased effectiveness in the case of large disturbances and reduced disconnected power in the case of small and medium disturbances compared to the conventional load-shedding solutions. These advantages are achieved by replacing time-consuming consecutive load dropping with the simultaneous load dropping mechanism and by replacing ineffective fixed-frequency activation thresholds independent of the state of the system with implicit adaptive thresholds based on fuzzy logic computations. The proposed algorithm does not require complex and costly technical solutions. The performance of the proposed scheme was validated using multivariate computer simulations. Selected test results are included in this paper.

1. Introduction

The algorithms of underfrequency load shedding (UFLS) operating in power systems were adopted more than half a century ago. Conventional load shedding relies on frequency relays. The principle is elementary and consists of switching off pre-defined groups of loads when the frequency drops below certain thresholds. The main drawbacks of the typical load-shedding scheme are the lack of the adaptation of frequency threshold values to the current operating conditions of the power system and consecutive disconnection of load portions. Over the decades, power systems have undergone significant changes. On one hand, certain measures have been taken to increase the stability of system operation such as increasing the number of interconnections or enhancing the reliability of the generating units. On the other hand, the capacities of thermal power plant units have increased, and the number of renewable energy sources (wind, photovoltaic) has risen dramatically. As a result, the stability of system operation exhibits extended risks due to potential failures of large power plant units or unexpected changes in the system inertia, which can cause significant difficulties in maintaining the balance of active power.
There is no confidence that the existing UFLS schemes will effectively handle the stability of power systems in the changing settings. Additionally, as reported in [1], UFLS algorithms currently used are not compliant with the latest European Network of Transmission System Operators for Electricity (ENTSO-E) standards [2,3], and should be upgraded in the near future. Consequently, transmission system operators are on the lookout for improvements in UFLS performance.
For many years, increasing the effectiveness of UFLS has been the subject of research around the world. The algorithms proposed in the literature focus inter alia on the following issues:
  • advanced load monitoring concepts including centralized [4,5,6,7,8,9,10,11,12,13,14,15,16] or decentralized monitoring [17,18,19,20,21,22];
  • application of various types of hybrid systems [13,23,24] including those using advanced optimization algorithms (e.g., meta-heuristic techniques [14,15]);
  • application of wide area monitoring systems [25,26,27,28] or smart grid technology [13,26,27,28,29,30,31,32,33,34];
  • use of information technology [4,33,34] including Supervisory Control and Data Acquisition (SCADA) systems [35,36,37].
Another approach to minimizing frequency deviations is to apply demand side management tools [13,38,39]. A popular functionality belonging to this category is load curtailment [40,41,42]. However, it is mainly used to optimize economic profits, for instance, by reducing the use of expensive energy sources during peak hours, while typical load shedding addresses large frequency deviations for the sake of power system safety. Some other algorithms focus specifically on the dynamic determination of power to be disconnected [13,14,15,18,29,43,44,45] in order to limit random load shedding. Still, another group of algorithms address the voltage dependence of power loads [15,17,46,47,48].
The cited solutions tend to be complex and require costly technical measures (centralized management and control with complex communication infrastructure and wide-area distributed measurements). The complexity of the algorithm may result in its insufficient selectiveness due to large numbers of decision variables. In the case of the centralization of decision making, reliable and fast communication infrastructure is necessary and the coordination of multiple devices is a serious challenge.
The dispatcher control services are reluctant to introduce more complex solutions to operational practice. The more complex the algorithm, the greater the range of changes needed when updating the algorithm (including the development of new usage procedures, changes in the threshold settings etc.). The parameterizing of the most popular UFLS algorithms involves the following settings:
  • total number of shedding thresholds and the frequency values at each threshold; and
  • values of power to be switched off at each threshold.
The appropriate values of all parameters are determined by simulations. The first group of parameters are changed every few years. The second group of parameters need verification once a year. In the Polish Power System, for example, UFLS schemes include about 2500 underfrequency relays. Each relay may require several threshold values, meaning that it can be necessary to verify several tens of thousands of connections between relays and circuit breakers.
It is known that the higher the number of parameters to be set, the more maintenance work is needed, the higher the competences required and the bigger the risk of mistakes. Therefore, new solutions for the UFLS should limit, as much as possible, the role and responsibility of dispatcher control services. To this end, an algorithm was sought that would be capable of effective and reliable load shedding while using a limited number of decision thresholds (frequency values) and values of power to be disconnected. The above goal was achieved using an adaptive algorithm and fuzzy logic.
The rest of this paper is organized as follows. Section 2 presents the general idea of the proposed approach, Section 3 discusses the implementation, Section 4 briefly presents and discusses sample results of simulation tests used to validate the proposed algorithm, and Section 5 concludes the paper.

2. General Idea of the Proposed Approach

The operating range of UFLS is delimited by fmax and fmin, where the former denotes the frequency at which the load shedding process is initiated and the latter is the safety threshold defined by steam turbines. This range is very narrow (Δf ≅ 1 Hz), which poses a challenge to the UFLS. The effectiveness of load shedding depends on a number of variables. The most important variables are the actual frequency f , the rate of frequency change f (also referred to as the frequency derivative or RoCoF), the assumed total amount of load that can be disconnected ΔPmax, and the opening time of the considered circuit breaker Tcb. The current frequency value and circuit breaker opening time determine the theoretical maximum rate of frequency change as follows:
f max = f min f T cb
If the actual rate of frequency change is lower than that calculated from Equation (1), some amount of load (either predetermined or evaluated on-line) will typically be disconnected before the frequency reaches f min . However, this does not guarantee that the load shedding process will be effective. If the disconnected load power is insufficient and the frequency decrease cannot be counteracted by appropriate control of the power generation, the frequency decrease can continue until some generating units have to be disconnected. This will deepen the power imbalance, possibly leading to a blackout. Consequently, the load shedding process will be ineffective. For the UFLS process to be effective, sufficient load power has to be disconnected at the appropriate time. Thus, the following goals were to be achieved by the new algorithm: (1) to increase the effectiveness of the UFLS, while reducing the incidence of unnecessary load shedding actions, and (2) to reduce the number of UFLS parameters that have to be set.
The first goal was achieved by fast disconnection of the calculated amount of load. The latter was determined online, based on the current frequency and its rate of change. Shorter disconnection time was achieved by the use of a new variable— f min * —that is a dynamically corrected value of f min (cf. Equation (3) in the next section). Stated differently, the dynamic operating range of the UFLS (from f max to f min * ) is constantly updated. The idea is illustrated in Figure 1. Consider two different cases of power imbalance. A low power imbalance (plot A) means that the magnitude of the frequency derivative at an example frequency measurement denoted f1 is also low. As a consequence, the corrected minimum frequency evaluated at this point, denoted as f*min(tA1), is close to fmin. Based on this, the proposed algorithm decides that no load dropping is necessary (comp. simulation results in Figures 8 and 10). When the imbalance is high (plot B), the magnitude of the frequency derivative at f1 is much higher, that is f*min(tB1) ≫ f*min(tA1). As the frequency continues to drop, the dynamic operating range is further narrowed, meaning f*min(tB2) > f*min(tB1). This can lead to a decision of disconnecting one or more load power portions, as described in the sequel.
It is typically assumed for the UFLS that the total amount of load to be disconnected is predetermined and that the frequency is measured locally. The same assumptions were adopted in the development of the proposed algorithm. Concerning the amount of power to be shed at a given stage, it should depend on the current generation deficit. According to Newton’s Second Law, a good indicator of this deficit can be the rate of frequency change f . Therefore, the proposed algorithm evaluates the maximum permissible rate of frequency change f max using Equation (1). Based on this quantity as well as the current frequency and its rate of change, the amount of load to be shed is evaluated online. The evaluation is inevitably fuzzy, which justifies the use of fuzzy logic for performing this task.
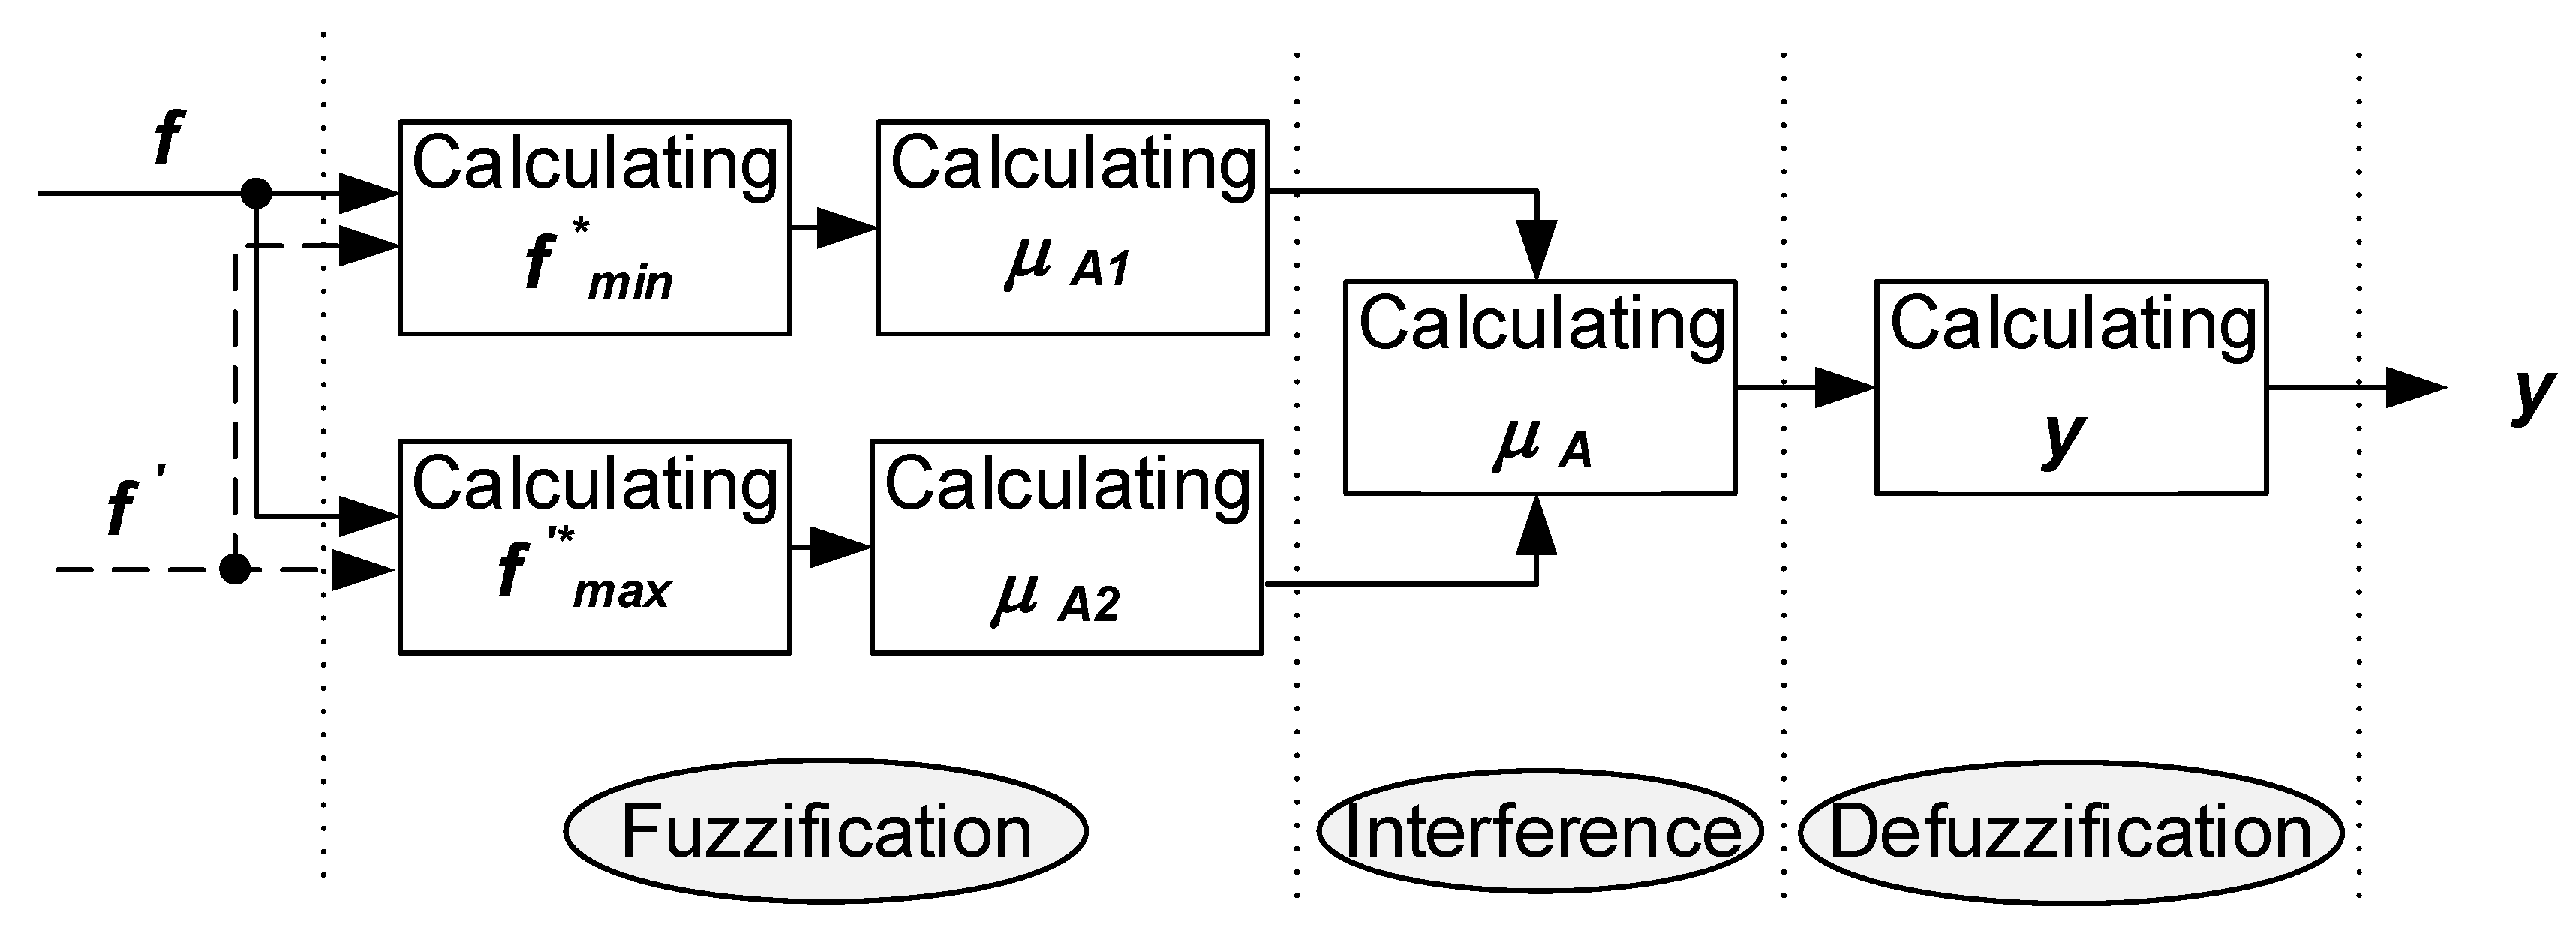
In order to reduce the number of parameters required in the configuration of the UFLS (frequency thresholds and powers to be dropped at a particular threshold), the total amount of load to be disconnected is divided into identical groups. Such a solution means that there is no need to carry out simulations to find the best values. The frequency at which a load portion is dropped is a function of the frequency itself and its rate of change. There are no fixed and explicit activation thresholds. The thresholds are only implicit in the output y of the algorithm (cf. Figure 2 and Equation (10)). Thanks to this, in the event of high imbalance, it is possible to disconnect several or even all groups available for shedding. Stated differently, the proposed approach permits simultaneous disconnection of load groups, in contrast with the inherently consecutive disconnection characteristic of conventional UFLS procedures. If the imbalance is low, even if the frequency falls below f max , the operation of the algorithm will not disconnect any load, or will only disconnect a relatively small single group.

3. Implementation

The block diagram of the considered algorithm is depicted in Figure 2. The input quantities are the measured values of frequency f and its derivative f . Based on the measured values and assumed parameter values, the algorithm computes online the number of load groups that have to be disconnected to assure effective functioning of the UFLS.

3.1. Fuzzification

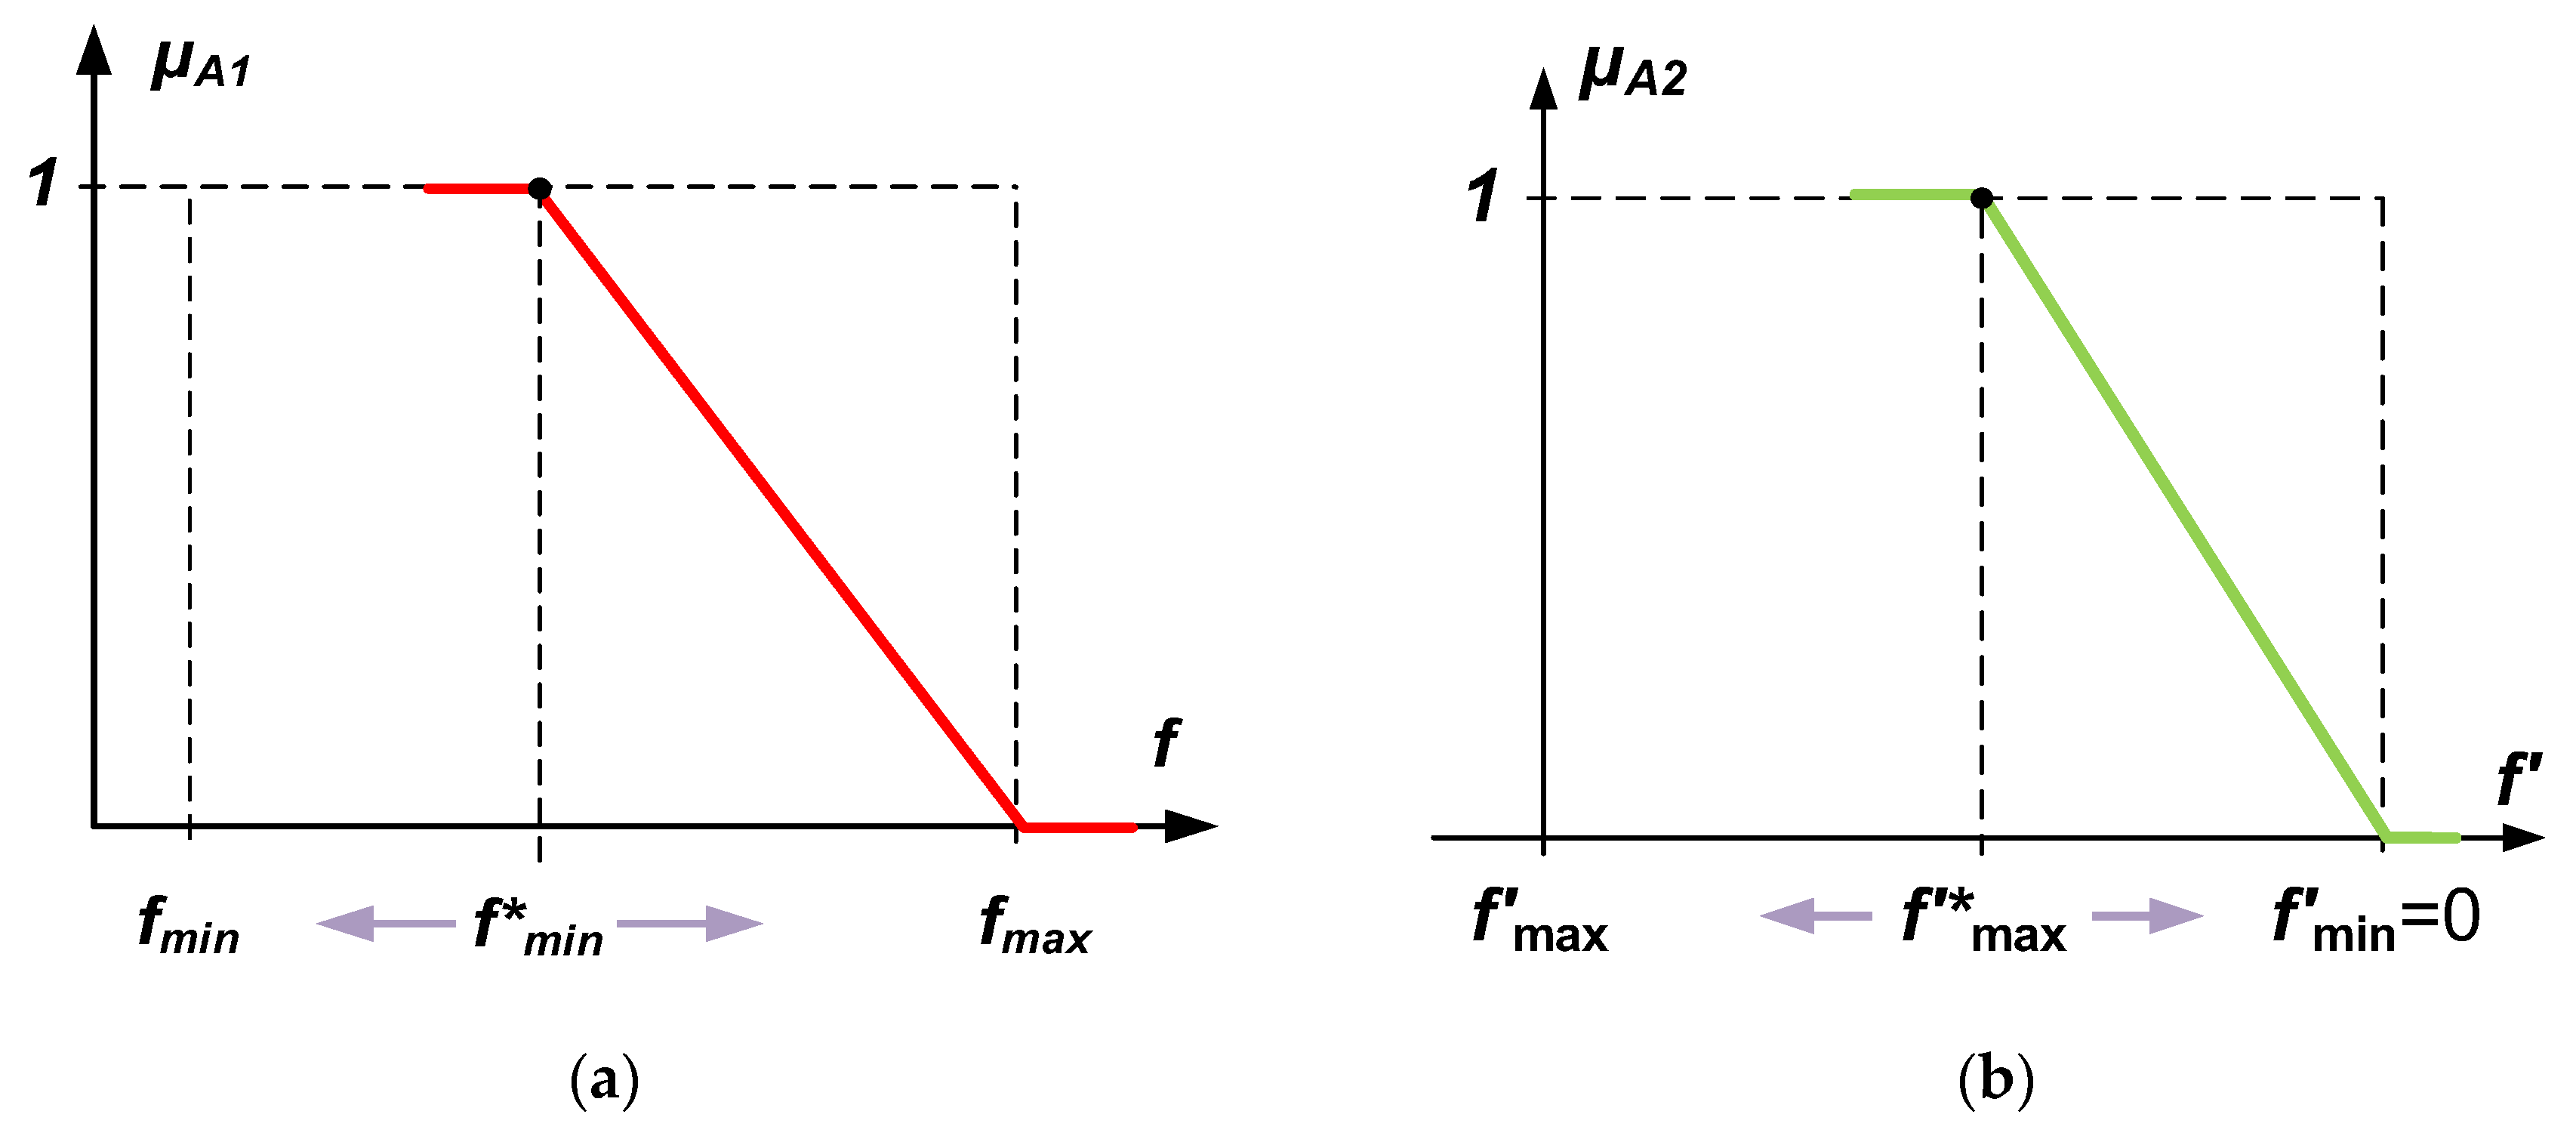
The algorithm relies on fuzzy logic and thus it starts by determining two membership functions μA1 and µA2. A graphical interpretation of μA1 is given in Figure 3a. The second membership function (µA2) shows the membership degree of the current frequency derivative in the fuzzy set high rate of frequency change (Figure 3b).
The first function evaluates the membership degree of the current frequency in the fuzzy set low frequency using the following formula:
μ A 1 = { 0 f o r f f max f max f f max f min * f o r f min < f < f max 1 f o r f f min
As mentioned in Section 2, in order to ensure high effectiveness of the algorithm, the fixed minimum frequency fmin is replaced in the computation of μA1 by its dynamically corrected value f*min
f min * = f min + Δ f 1 f · T cb
Δ f 1 = { 0 for f f max f max f for f min < f < f max f max f min for f f min
The second membership function (µA2) shows the membership degree of the current frequency derivative in the fuzzy set high frequency derivative (Figure 3b). The quantity f max * appearing in this figure is the assumed maximum rate of frequency change at a given frequency f and can be defined by the following semi-empirical formula:
f max * = Δ f 2 N sh · T sh
Δ f 2 = { f min f max for f f max f min f for f min < f < f max 0 for f f min
where N sh is the maximum number of shedding stages and T sh is the sum of the circuit breaker opening time and the relay operating time. The assumed upper limit of the rate of frequency change is zero because the UFLS only reacts to negative frequency derivatives. Taking the above into account, µA2 can be expressed as follows:
μ A 2 = { 0 for f 0 f f max * for f max * < f < 0 1 for f f max *

3.2. Inference

Based on the values of μA1 and µA2, the inference block calculates the resultant function µA; the function represents the number of load groups that should be disconnected.
Due to the structure of the analyzed fuzzy sets (one set covering the entire input signal space) used in the developed model, the inference was performed using compensating operators. As the function of affiliation, the Iγ operator [49,50] was used, leading to the following formula:
μ A = ( i = 1 2 μ A i ) ( 1 γ ) Element   I · ( 1 i = 1 2 ( 1 μ A i ) ) γ Element   II
If f f max or f 0 , one or both of the corresponding membership functions μA1 and µA2 assume zero values and hence element I also assumes a zero value (no load shedding action is necessary). Element II assumes a value of 1 if f goes below f min or f is greater than or equal to 0. The application of the Iγ operator has enabled all components to be taken into account, not just the ones with the highest degree of fulfillment.
In order to obtain a proportional contribution to the resulting function of both elements in Equation (9), γ = 0.5 is assumed, leading to
μ A = μ A 1 · μ A 2 · ( 1 ( 1 μ A 1 ) · ( 1 μ A 2 ) )

3.3. Defuzzification

As the number of load groups to be disconnected must be an integer and the result of the above formula is a real (non-integer) value, µA should be appropriately discretized to yield the ultimate output y, that is, the number of load groups to be disconnected. The discretization can be effected by the following formula:
y = { 0 for μ A < 1 N sh i for μ A i N sh N sh for μ A > 1
where i = 1, 2, …, N sh . It is worth observing that nonzero values of y implicitly represent context-adaptable activation thresholds, while zero means no action.
Note that the block diagram in Figure 2 does not include a block responsible for assigning circuit breakers to the output y (it is not part of the algorithm).

3.4. Frequency Thresholds

At least two frequency thresholds are necessary in the UFLS. One is the frequency value at which the UFLS should initiate counteracting the frequency reduction (the UFLS remains idle if the system frequency is above this value). This threshold is usually f max = 49 Hz and this value was assumed in this study. The other threshold is the so-called safety margin fmin, defined by steam turbines and house loads. In order to comply with the regulations in force, the results presented in the next part of the paper are based on the assumption that fmin = 48.1 Hz. Of course, it is possible to assume other values.

3.5. Maximum Number of Shedding Stages

The influence of the number of shedding stages on the efficacy of the proposed algorithm was assessed by simulations using a 23-node CIGRE test grid model (french: Conseil International des Grands Réseaux Électriques, CIGRÉ is the International Council on Large Electric Systems). The tests were multivariant and included:
  • Five different structures of turbine controllers used in the Polish Power System;
  • A variety frequency- and voltage-dependent characteristic of loads;
  • Fifteen different operating points of the grid, including different initial loads Pg(t = 0) and power imbalances; and
  • Different numbers of thresholds Nsh ranging from six to 72.
The selection of the best solution relied on a successive elimination approach. The assessment of efficacy was based on two indicators. One of them was ΔP% given by Equation (11) and expressed the relative difference between the total disconnected load power PNshΣ (corresponding to the tested number of thresholds) and the total power of the reference variant PNshRefΣ, which corresponds to the assumed reference number of thresholds NshRef; the difference is related to the maximum expected power deficit ΔPmax.
Δ P % = P N s h Σ P N s h R e f Σ Δ P m a x · 100 %
The other indicator is given by Equation (12) and expresses the relative difference between fminNsh, which is the lowest frequency that occurred during the load shedding for the given number of thresholds Nsh, and fminRef that denote the minimum frequency of the reference variant; the difference is related to the maximum permissible distance between the rated frequency and the actual frequency.
Δ f m i n % = f m i n N s h ( t ) f m i n R e f ( t ) f n f m i n · 100 %
The reference number of thresholds was assumed to be NshRef = 6.
The results of the studies confirmed the expectation that the more thresholds are used, the better the disconnected power fits the actual deficit, which leads to a more efficient limiting of frequency excursions. Nevertheless, the effect of the number of thresholds on the frequency nadir becomes weaker and weaker as Nsh becomes large enough. Based on the results of numerous simulation studies, Nsh = 12 was identified as a good tradeoff between efficacy and simplicity. It is worth stressing that the number of thresholds does not significantly affect the ability of the UFLS to work efficiently under large imbalances.

3.6. Selection of the Amounts of Power to Be Disconnected

Due to the fact that all stage thresholds except for fmax are determined in real time, it is convenient and justifiable to divide the total power ΔPmax that can be disconnected by the UFLS into equal portions, that is
P s h = Δ P m a x N s h

4. Validation of the Proposed Algorithm

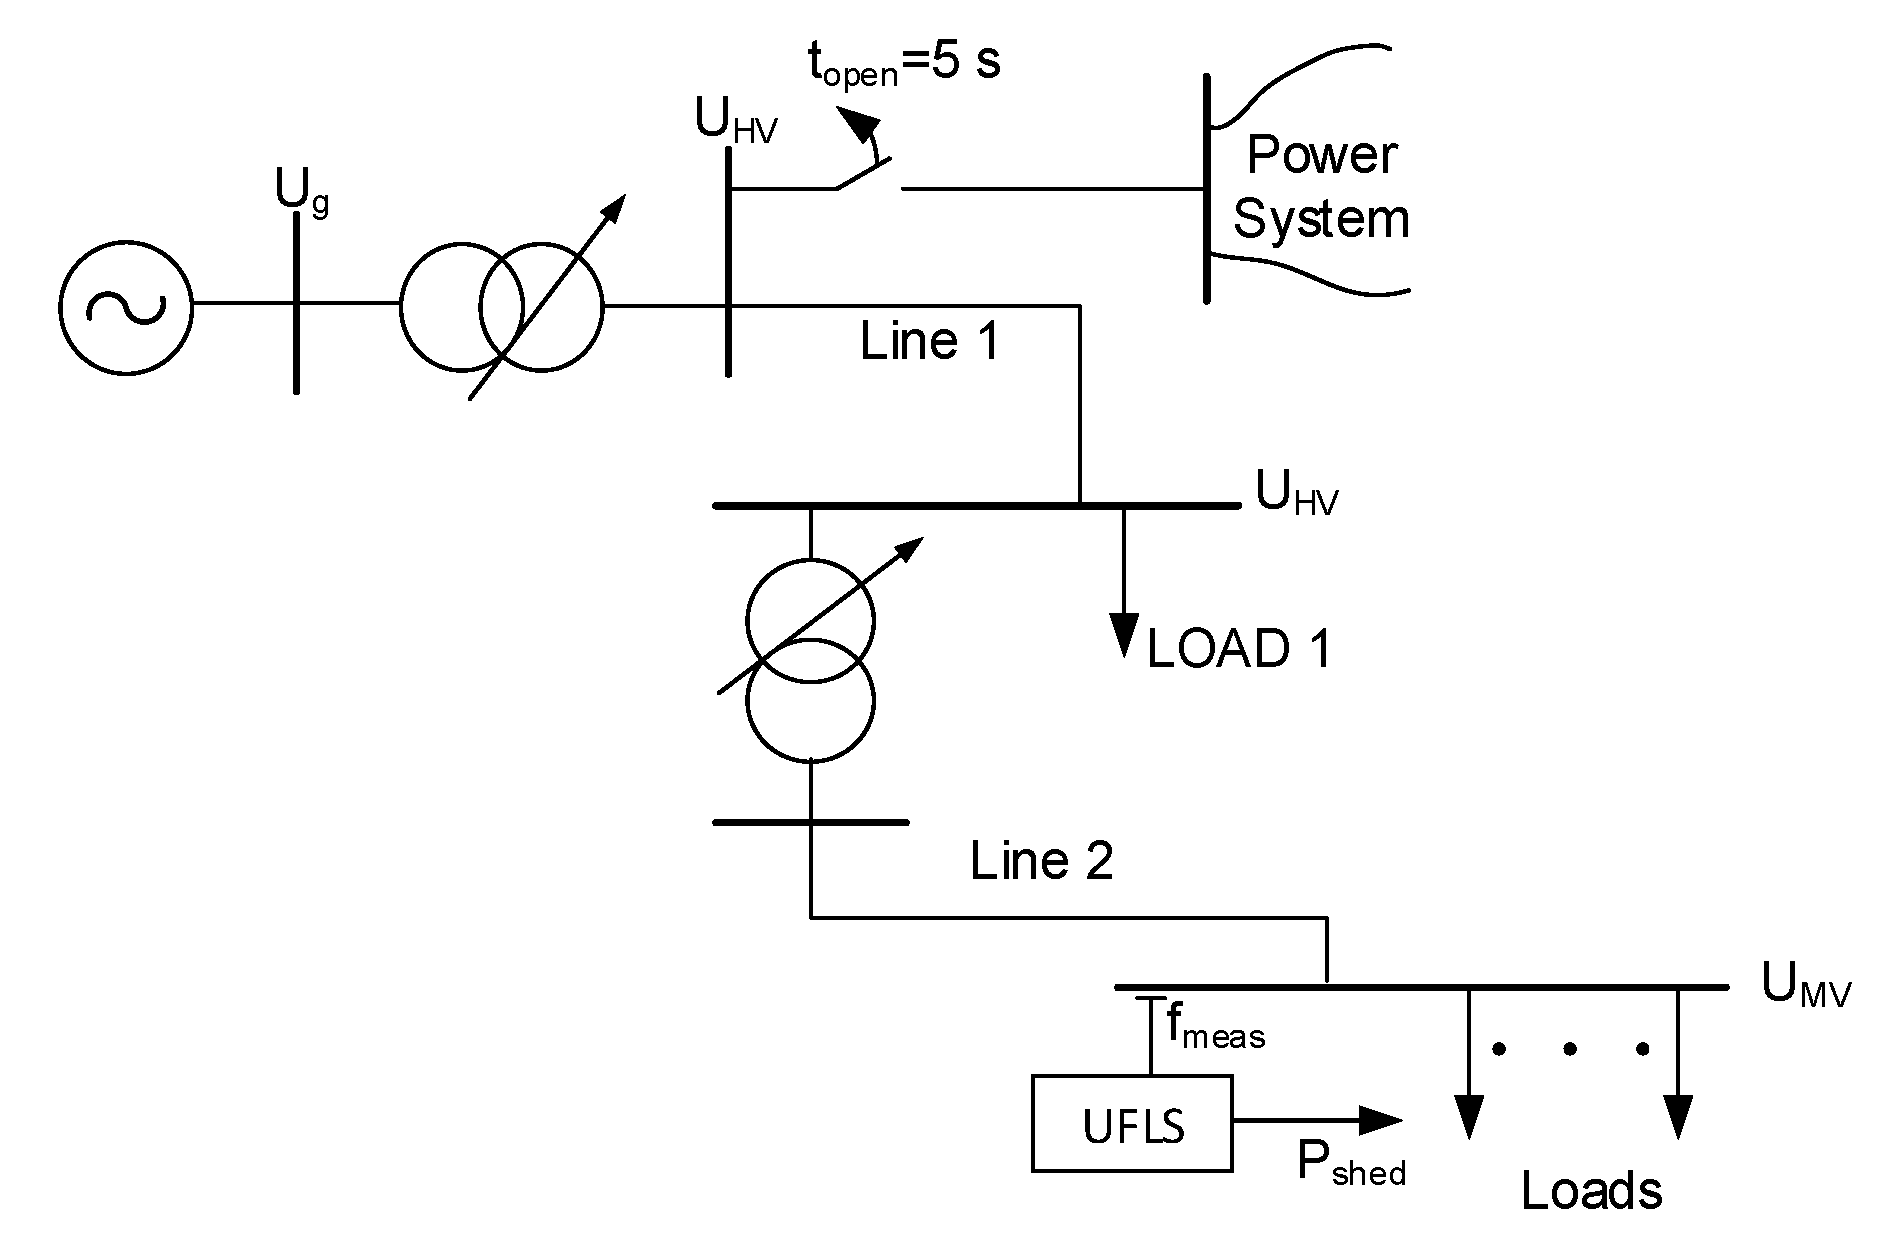
Validation of the effectiveness of the presented algorithm was carried out on a single synchronous machine island (Figure 4). In each simulation test, the disturbance was initiated by opening the grid circuit breaker.
The rated generator power was assumed to be Pgr = 0.85 and the minimum technically allowed power was Pgmin = 0.45. The UFLS was validated under the following four test conditions:
  • rated load of generator Pg(t=0) = Pgr and ΔP = 0.41;
  • rated load of generator Pg(t=0) = Pgr and ΔP = 0.15;
  • generator operation with a power equal to the technical minimum Pg(t=0) = Pgmin and ΔP = 0.25;
  • generator operation with a power equal to the technical minimum Pg(t=0) = Pgmin and ΔP = 0.05;
where ΔP denotes the initial power imbalance after the disturbance. The above power values are given as pu of the assumed rated generator power Sgr = 235.4 MVA. The use of diverse generator operating points and ΔP values leads to different control margins of the generating unit and different rates of frequency change.
A conventional UFLS was used as a reference solution for comparisons. The number of stages Nsh = 5 was assumed and the amounts of power to be shed at a particular stage threshold were as shown in Table 1 (as a percentage of ΔPmax), based on the requirements of the Polish grid operator.
Concerning the proposed method, the amounts of power were evaluated from Equation (13). Following [2], it was assumed for all tests that the total active power that can be used in the load shedding process equals 50% of the peak load power.
Δ P max = 0.5 · P g ( t = 0 )
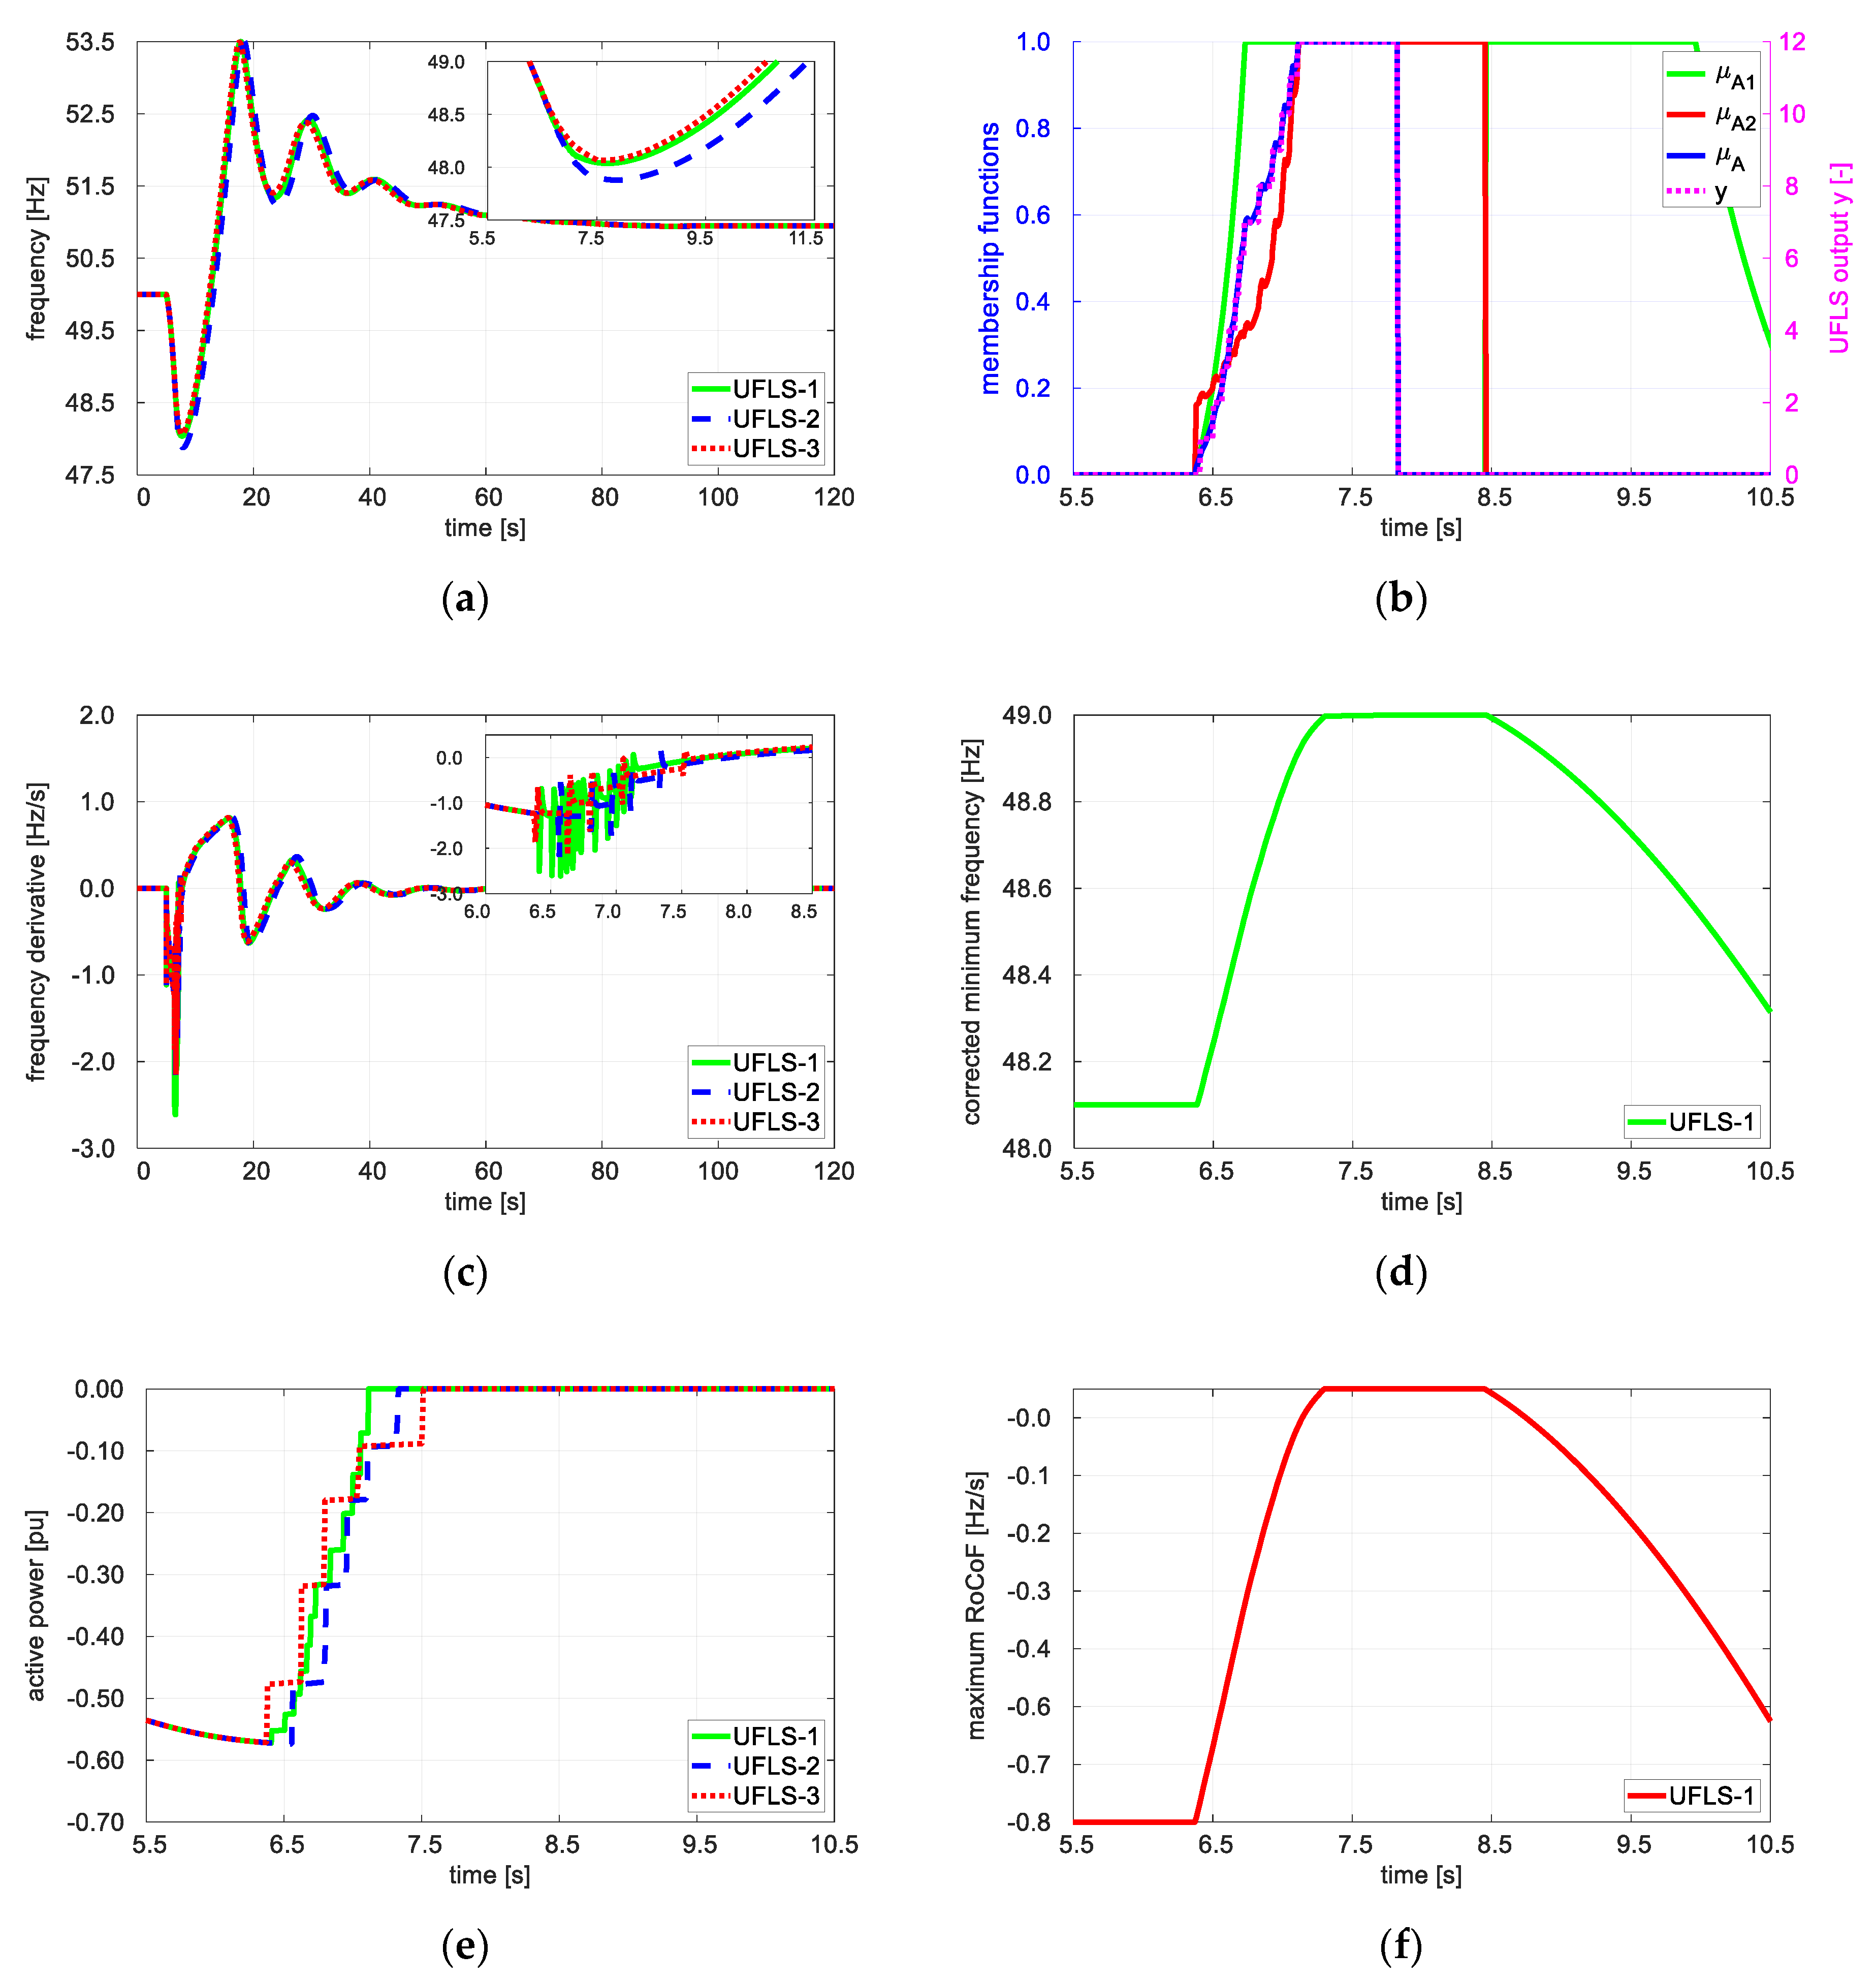
The workings of the proposed solution denoted UFLS-1 was compared with the conventional UFLS denoted UFLS-2 on the basis of frequency variation during the unloading process (Figure 5, Figure 6, Figure 7 and Figure 8). An additional criterion was the total active power disconnected during the shedding process (Figure 9). Since one of the most important factors influencing the effectiveness of the UFLS is the sum of the circuit breaker opening time and the relay operating time, the same value of this parameter ( T sh = 150 ms) was used for both the proposed and conventional UFLS solutions. The corresponding plots in Figure 5, Figure 6, Figure 7, Figure 8 and Figure 9, respectively. Additionally, a zero-delay conventional UFLS ( T sh = 50 ms) was tested to get a greater basis for comparisons (the corresponding plots are denoted by UFLS-3). For easy reference, Table 2 shows the rate of frequency change at the first threshold (fmax = 49 Hz), corresponding to the four test conditions A through D as defined earlier in this section.
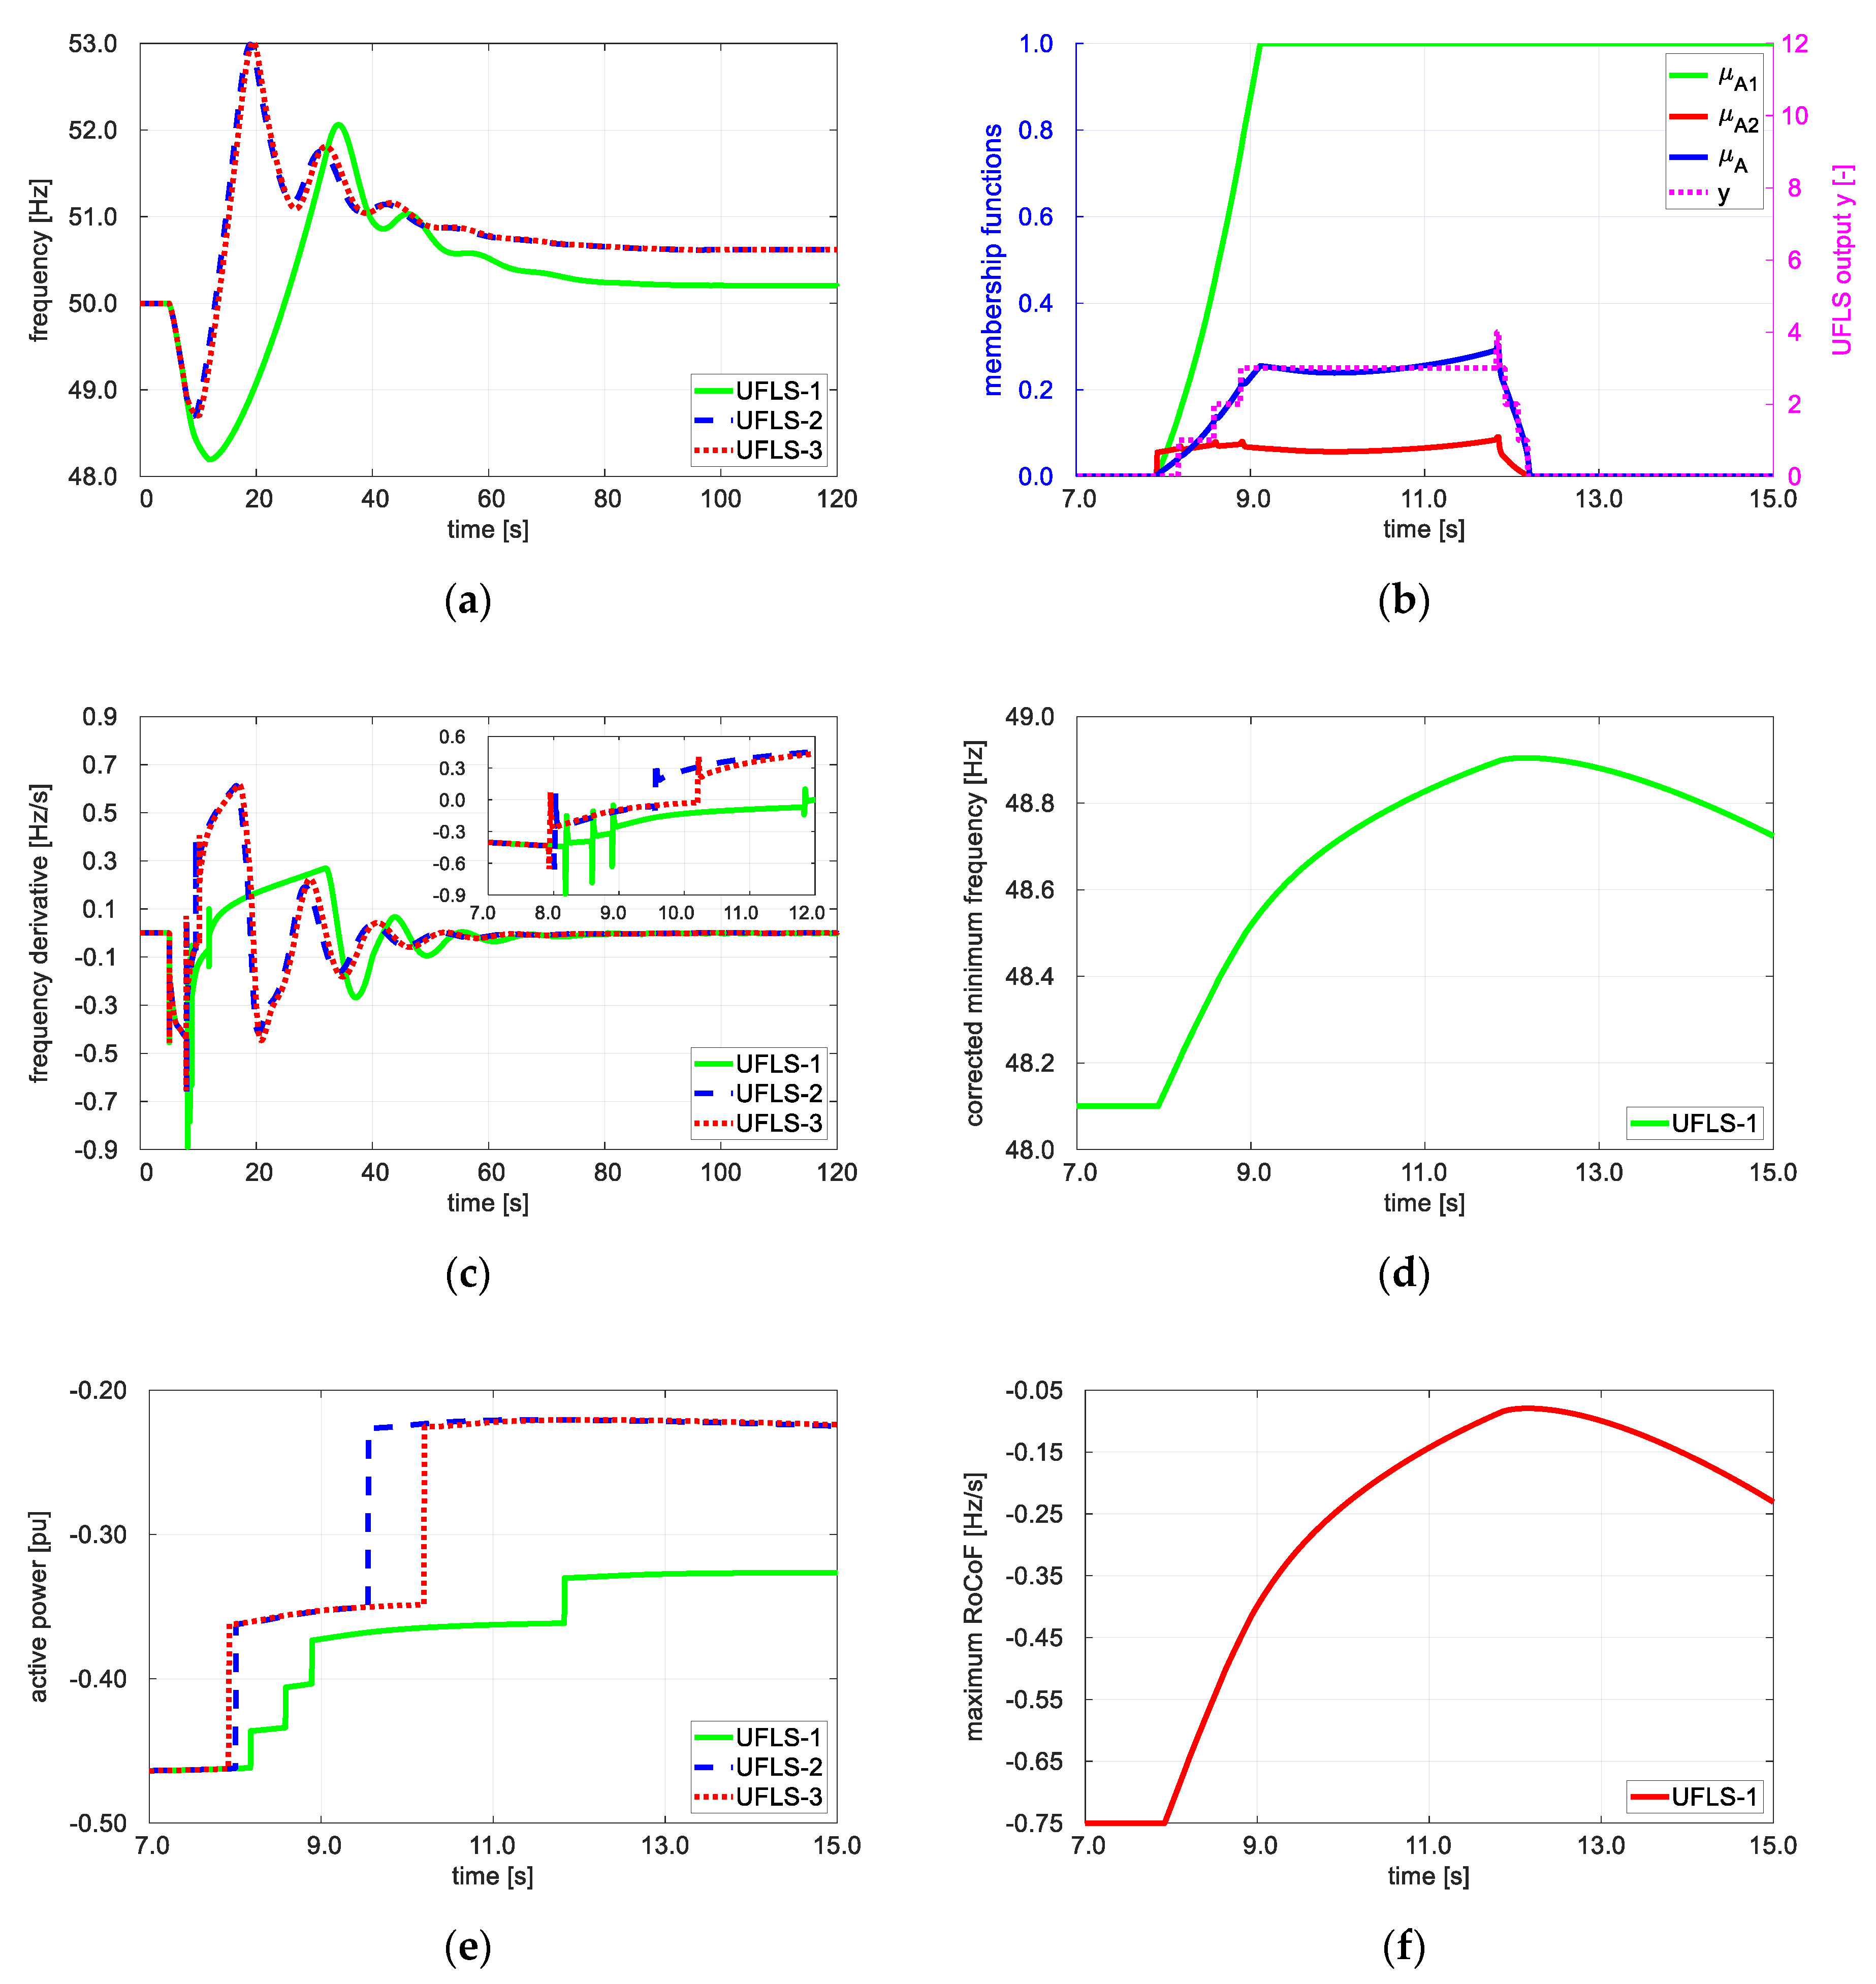
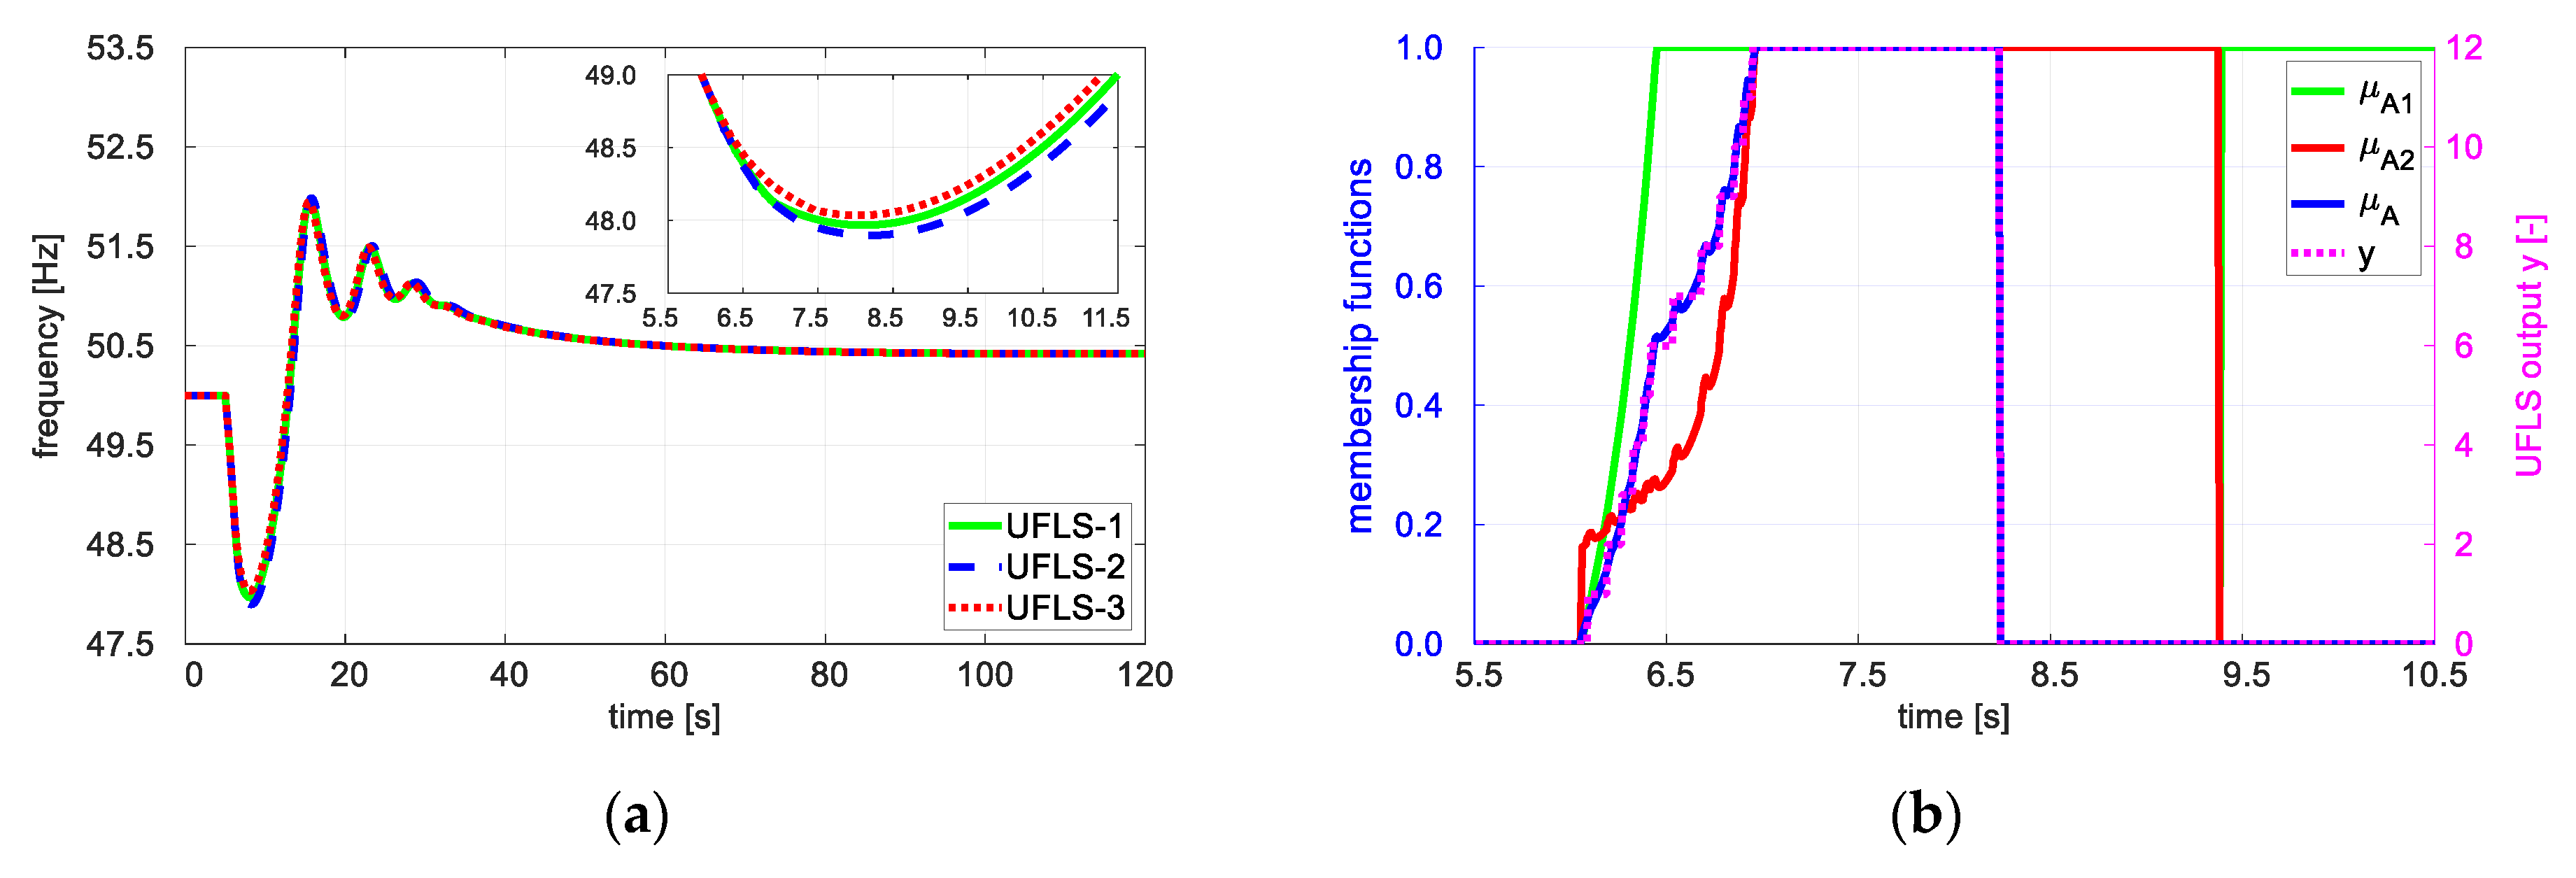
In the event of large initial power imbalances (Figure 5 and Figure 7), the rate of frequency decrease is high, and thus for the load shedding to be effective, a sufficiently high power should be disconnected at a sufficiently short time. The proposed algorithm achieves this by simultaneously disconnecting an arbitrary part of the available ΔPmax. For example, in Case A (Figure 5) almost 60% of ΔPmax was shed before the conventional UFLS reached the second stage threshold. Consecutive tripping, characteristic of conventional load shedding, introduces additional time delays—on top of the circuit breaker operate times—corresponding to the times of passage from one stage to the next stage. The delays may result in the frequency remaining relatively long below the threshold of underfrequency protections (ca. 47.5 Hz in the Polish Power System), as can be seen in Figure 5 and Figure 7 (magnified views of traces UFLS-2). This, in turn, poses a risk of disconnection of part of the generating units and consequently a blackout. The behavior of the idealized conventional UFLS (traces UFLS-3 in Figure 5 and Figure 7) is comparable to that of the proposed solution. This underlines the fact that the latter has the ability to speed up the load shedding.
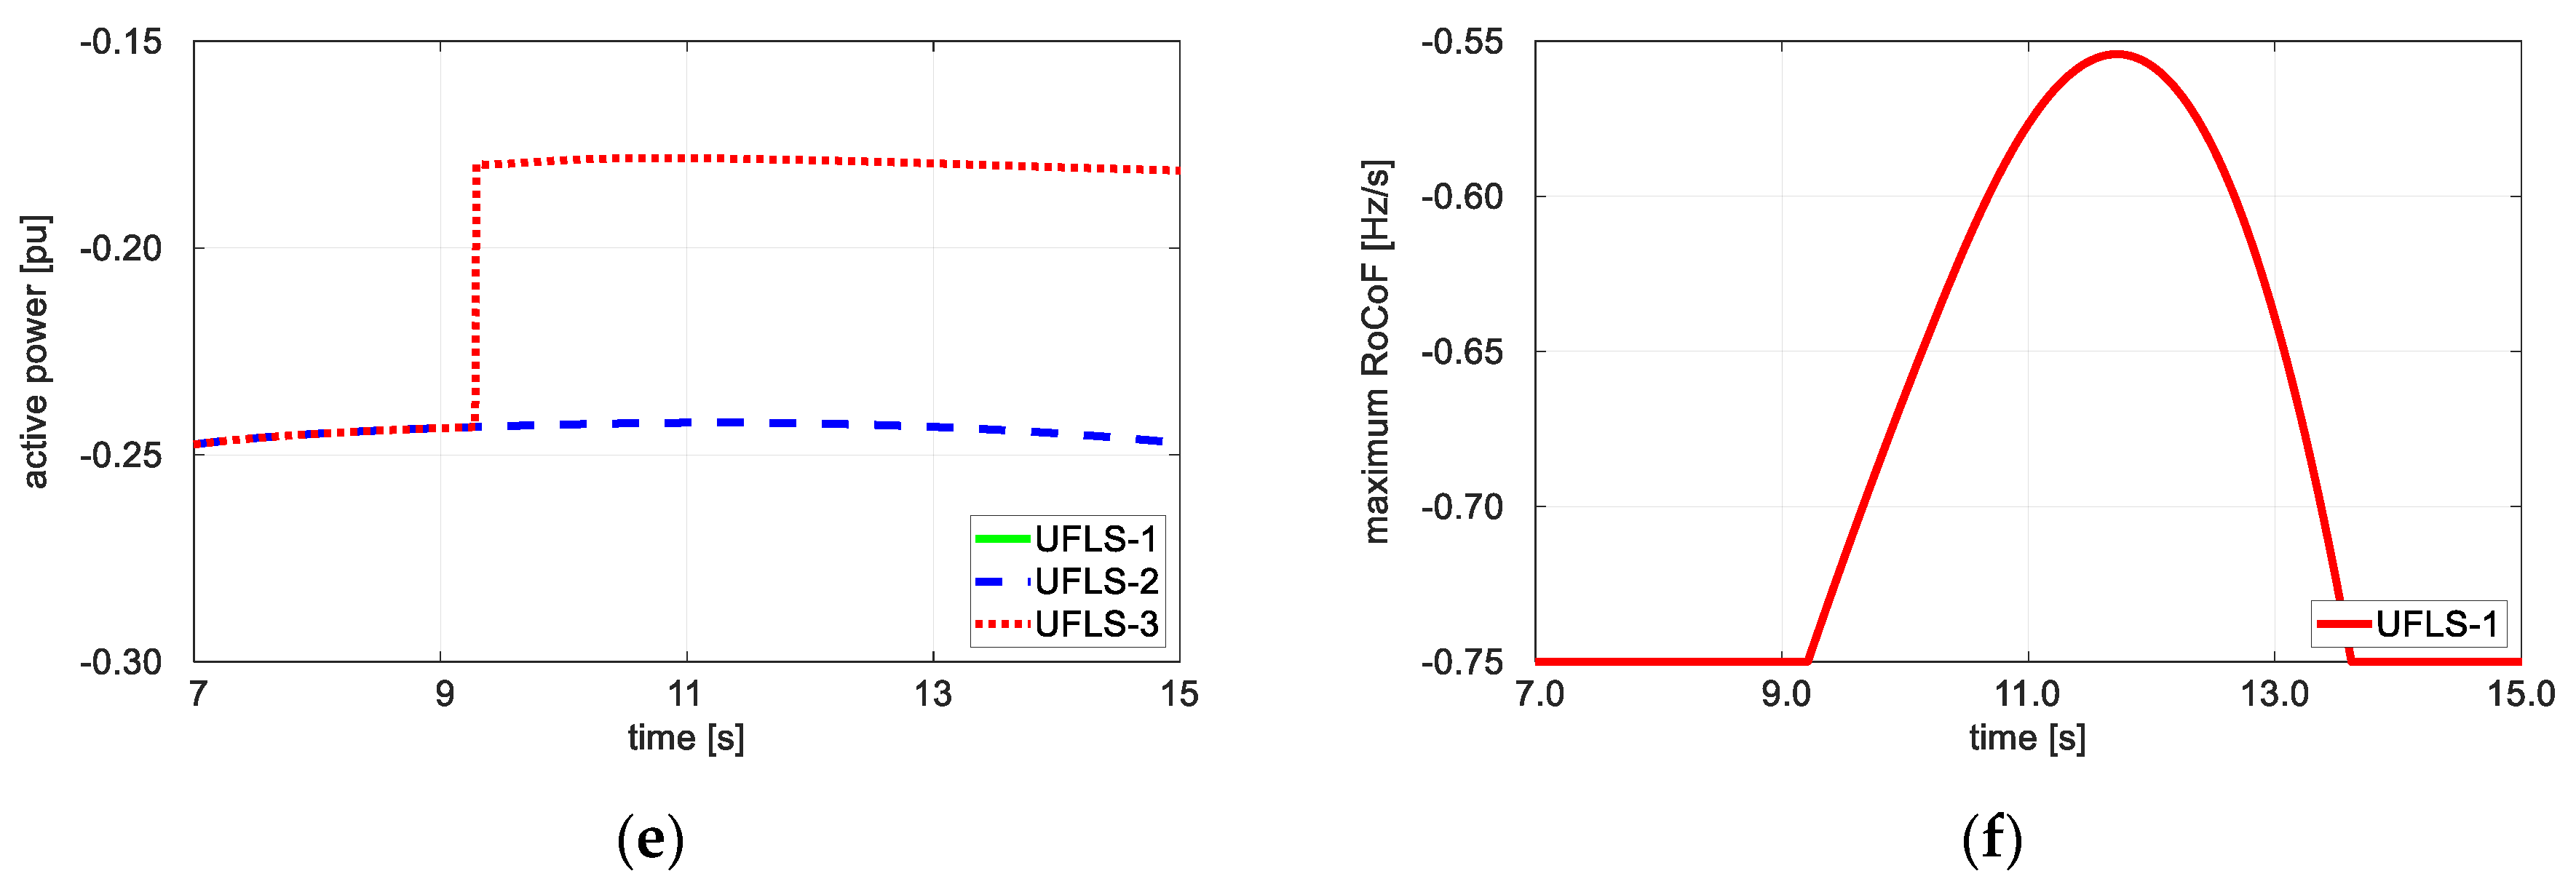
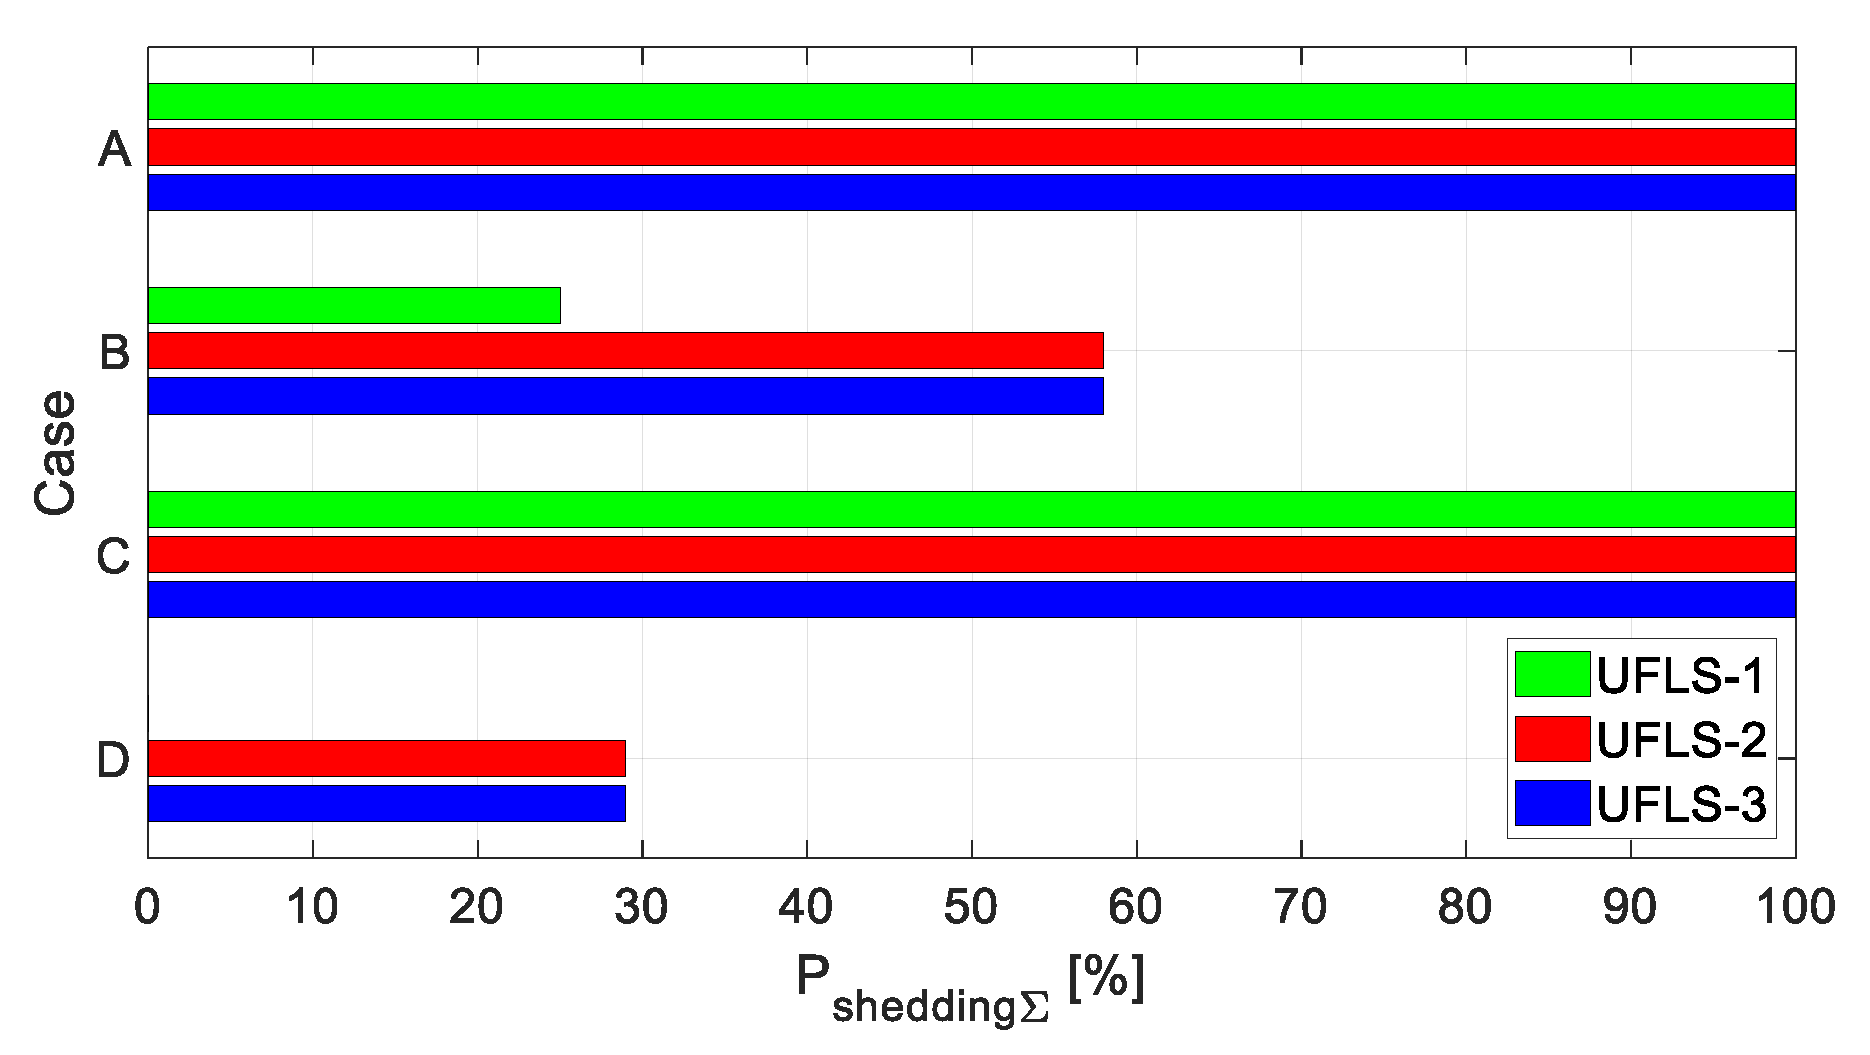
Even if the power imbalance after the disturbance is relatively low (Figure 6 and Figure 8), the proposed algorithm exhibits a valuable additional advantage. As can be seen in Figure 9, the power disconnected by this algorithm in Case B is significantly lower than for the conventional approach. The effect is even more spectacular in Case D. As can be seen in Figure 8, the frequency remained below the first threshold (fmax = 49 Hz) for almost 5 s, but the proposed procedure did not trip any load, correctly assessing the system condition as not requiring intervention of the UFLS. The frequency nadir can be worsened (Figure 6 and Figure 8), but the idea is exactly to allow deeper frequency excursions (yet well controlled above fmin) in order to allow more loads remaining connected during the disturbance. This reduces the economic cost of load shedding and speeds up the restitution of the grid after a blackout.
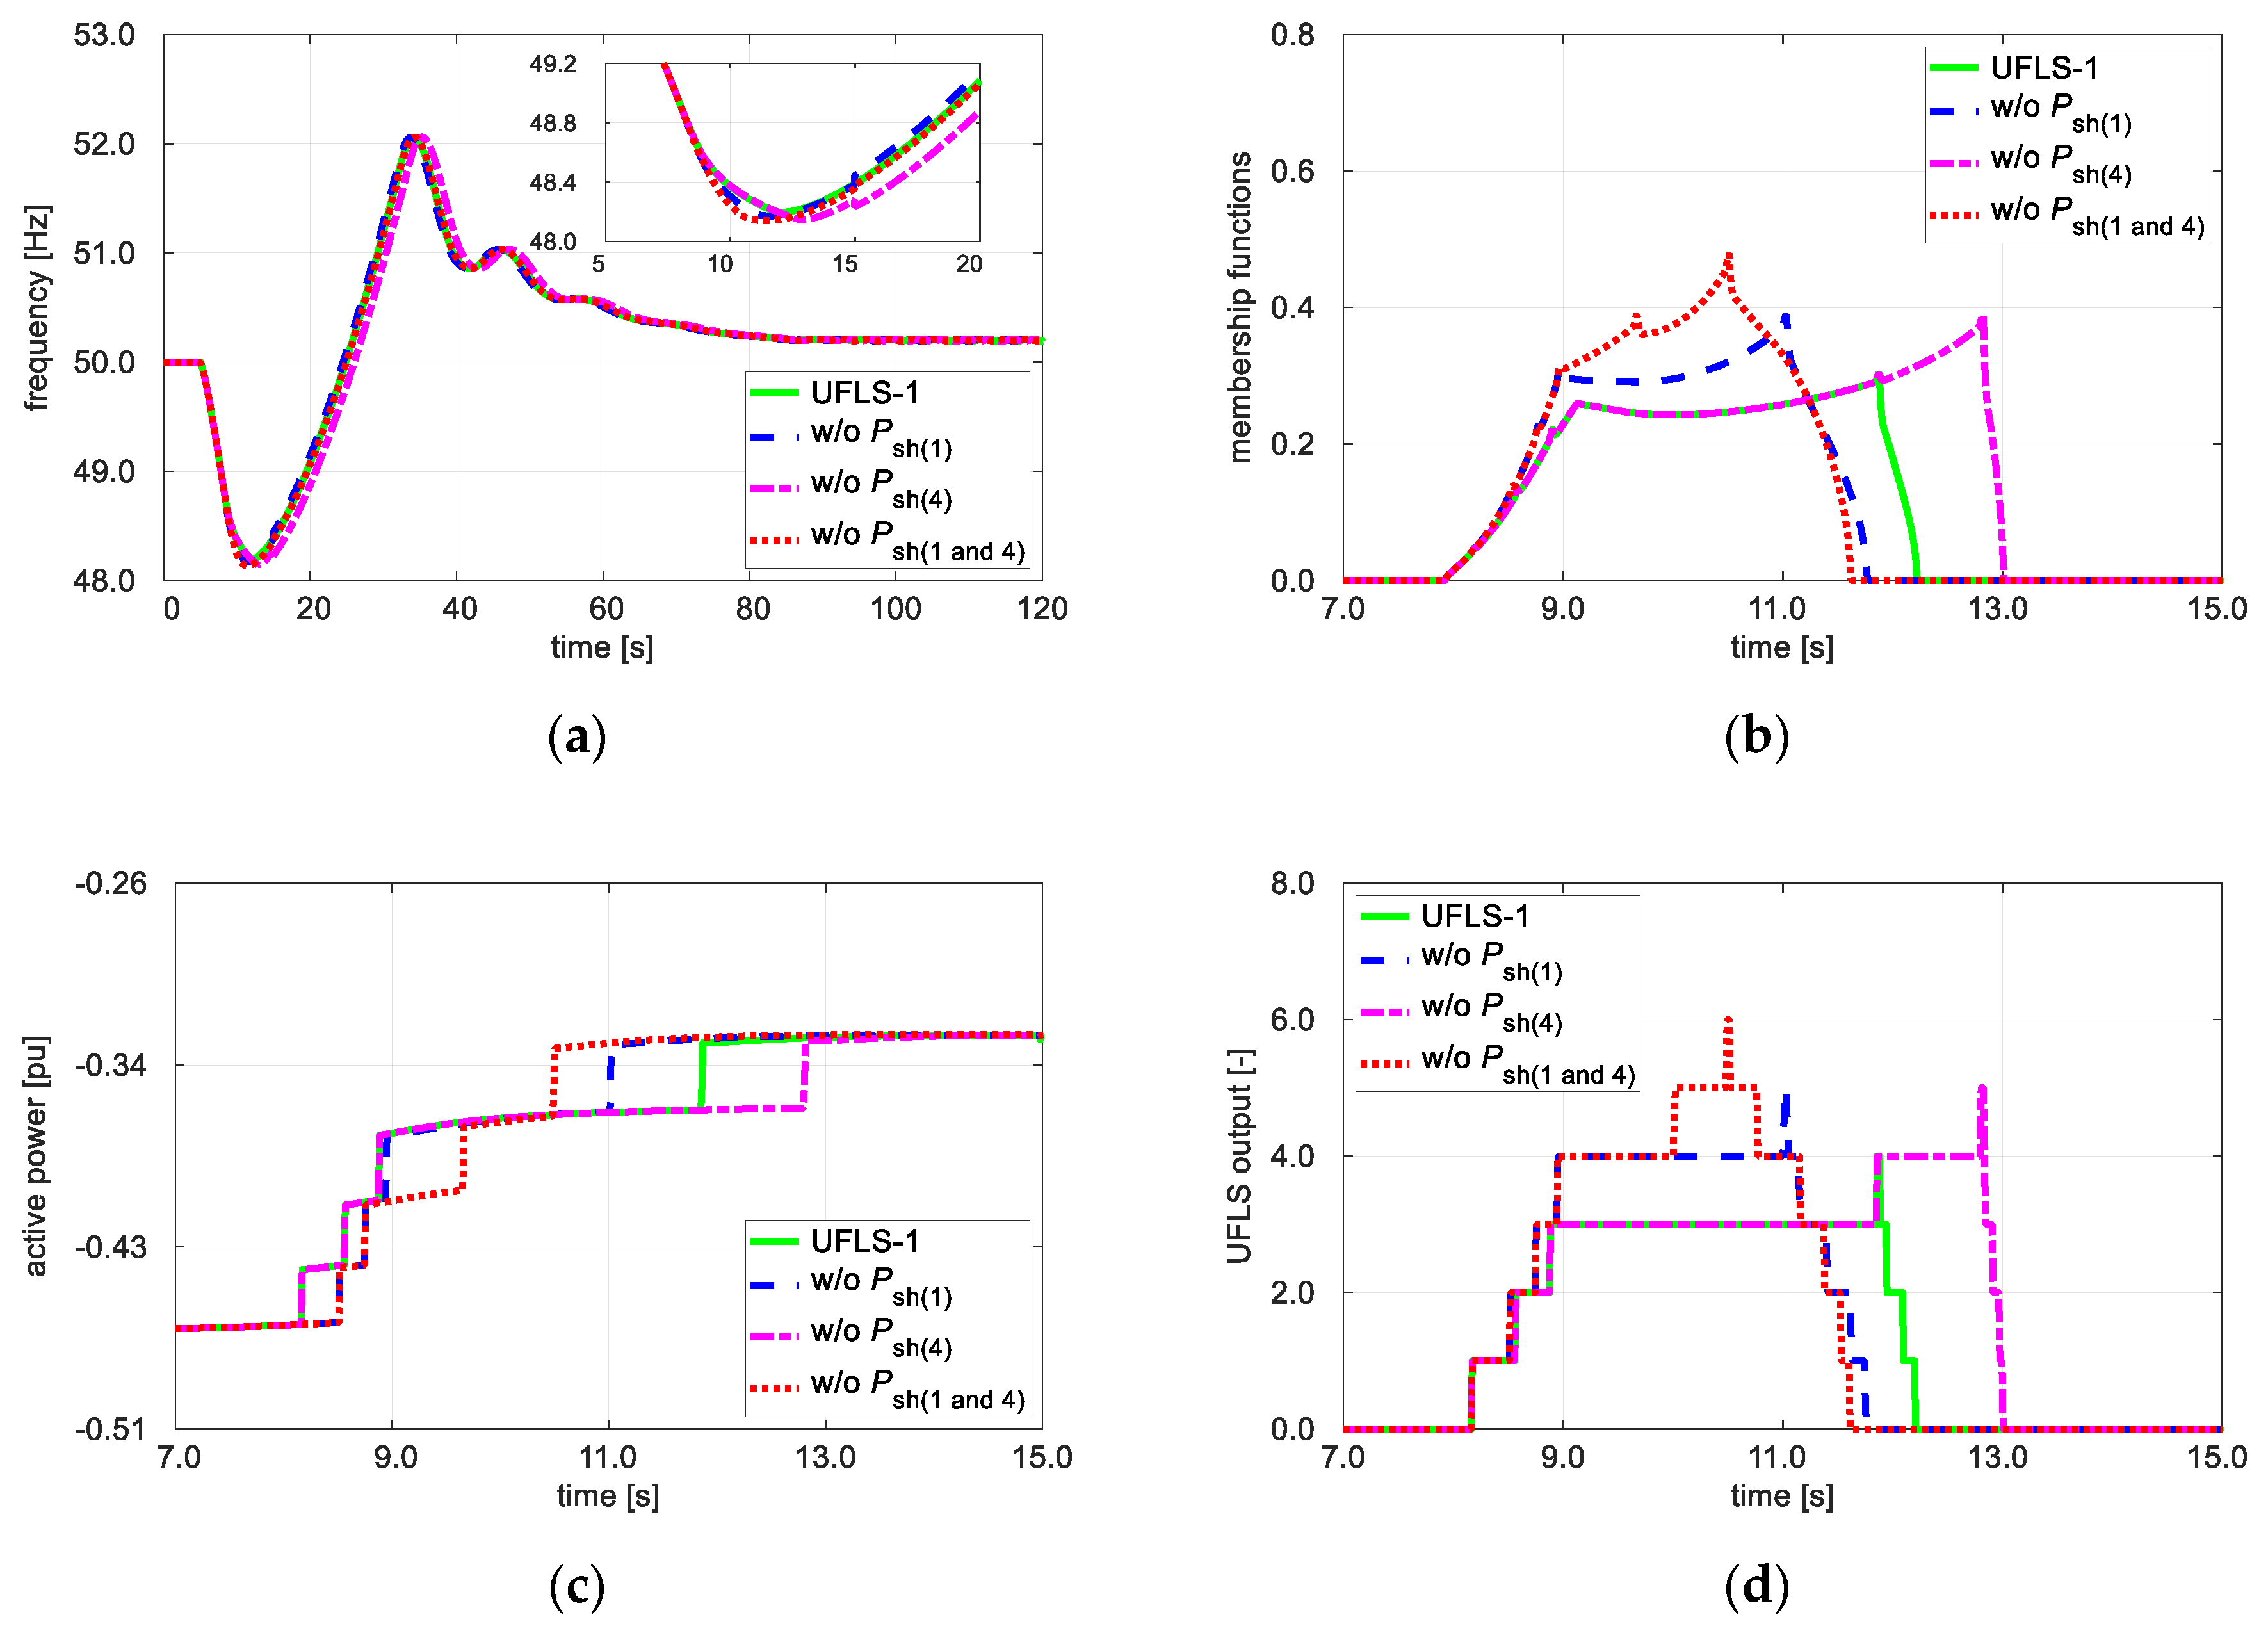
It should be stressed that the algorithm is capable of adapting to possible contingencies including failures of the switchgear to effect the requested disconnections. This is because μA1 and μA2 depend on both f and f . A possible disconnection failure will lead to steeper frequency decrease, which will result in an appropriate correction of the load to be shed. This feature of the proposed algorithm is illustrated by the waveforms shown in Figure 10. The waveforms were obtained for the following cases:
  • disconnection failure at the first stage threshold, meaning Psh(1) = 0 (the corresponding plots are labeled “w/o Psh(1)“ in Figure 10);
  • disconnection failure at the fourth stage threshold, meaning Psh(4) = 0 (the corresponding plots are labeled “w/o Psh(4) “ in Figure 10); and
  • disconnection failures at the first and fourth stage thresholds, meaning Psh(1) = 0 and Psh(4) = 0 (the corresponding plots are labeled “w/o Psh(1 and 4)“ in Figure 10).
The reference plots correspond to UFLS-1 in Figure 6; the fourth stage represents the last load group disconnected in the reference case. The plots labeled “w/o Psh(1)“ illustrate the situation with a disconnection failure at the beginning of the shedding process. Insufficient reduction of the RoCoF and continuing drop in frequency resulted in the algorithm deciding to disconnect additional load group Nsh = 5 at time t ≅ 11 s (Figure 10c,d). The plots labeled “w/o Psh(4)“ illustrate the situation where the initial shedding stages are effected correctly, but when y = 4, the RoCoF remains unchanged compared to y = 3, which results in a decision to disconnect another load group Nsh = 5 at time t ≅ 12.8 s (Figure 10c,d). Finally, the plots labeled “w/o Psh(1 and 4)“ illustrate the situation with two disconnection failures to which the algorithm responds with two additional load shedding decisions fixing the problem. This study confirmed that the proposed algorithm has the ability to reduce the risk of the unsuccessful operation of the shedding process.

5. Conclusions

The example test results presented in this paper confirm the following favorable effects resulting from the application of the proposed algorithm:
  • high effectiveness in the case of large disturbances; and
  • reduced disconnected power in the case of small and medium disturbances.
The above advantages were achieved while decreasing the number of variables required for appropriate parameterization of the load shedding process. The approach only relies on local measurements of frequency and frequency derivative; thus it can be implemented without additional infrastructure costs. It preserves the decentralized structure of conventional UFLS, which can facilitate its application.
Physical implementation issues such as the maximum sampling time and the effect of measurement noise on the workings of the proposed UFLS have not been addressed in the studies reported in this paper. However, the authors are currently preparing physical model tests in the LINTE^2 Laboratory where we can control the level of electromagnetic interference, notably from various power electronic converters, and thus study the robustness of the proposed algorithm to noise and disturbances. The sampling frequency of real-time measurements can also be changed in a broad range with the resolution of 1 millisecond, and so the significance of this parameter can also be studied in a demanding test environment. We expect to be able to publish interesting results thereon in a future paper.

Author Contributions

Conceptualization, R.M. and J.N.; Methodology, R.M.; Software, R.M.; Validation, R.M.; Formal analysis, R.M. and J.N.; Investigation, R.M.; Resources, R.M.; Writing–original draft preparation, R.M.; Writing–review and editing, J.N.; Supervision, J.N. All authors have read and agreed to the published version of the manuscript.

Funding

The funding sponsors had no role in the design of the study, in the collection, analysis, or interpretation of the data, in the writing of the manuscript, or in the decision to publish the results. This research received no external funding. The APC was funded by Gdańsk University of Technology.

Conflicts of Interest

The authors declare no conflicts of interest.

References

  1. Potel, B.; Debusschere, V.; Cadoux, F.; de Alvaro Garcia, L. Under-frequency load shedding schemes characteristics and performance criteria. In Proceedings of the 2017 IEEE Manchester PowerTech, Manchester, UK, 18–22 June 2017; pp. 1–6. [Google Scholar]
  2. ENTSO-E. Network Code on Emergency and Restoration; ENTSO-E: Brussels, Belgium, 2015. [Google Scholar]
  3. Sub Group “System Protection and Dynamics” Under Regional Group Continental Europe. Technical Background and Recommendations for Defence Plans in the Continental Europe Synchronous Area; ENTSO-E: Brussels, Belgium, October 2010. [Google Scholar]
  4. Ceja-Gomez, F.; Qadri, S.; Galiana, F. Under-frequency load shedding via integer programming. IEEE Trans. Power Syst. 2012, 27, 1387–1394. [Google Scholar] [CrossRef]
  5. Yang, D.Y.; Cai, G.W.; Jiang, Y.T.; Liu, C. Centralized adaptive under frequency load shedding schemes for smart grid using synchronous phase measurement unit. J. Electr. Eng. Technol. 2013, 8, 446–452. [Google Scholar] [CrossRef] [Green Version]
  6. Seyedi, H.; Sanaye-Pasand, M. New centralised adaptive loadshedding algorithms to mitigate power system blackouts. IET Gener. Transm. Distrib. 2009, 3, 99–114. [Google Scholar] [CrossRef]
  7. Powell, C.; Bahadoorsingh, S.; Singh, A.; Sharma, C. An adaptive under frequency load shedding scheme for a small island power system. In Proceedings of the 2016 IEEE/PES Transmission and Distribution Conference and Exposition (T&D), Dallas, TX, USA, 3–5 May 2016; pp. 1–5. [Google Scholar]
  8. Zin, A.A.M.; Hafiz, H.M.; Wong, W.K. Static and dynamic under-frequency load shedding: A comparison. In Proceedings of the International Conference on Power System Technology, Singapore, 21–24 November 2004; pp. 941–945. [Google Scholar]
  9. Mollah, K.U.Z.; Bahadornejad, M.; Nair, N.K. Automatic under-frequency load shedding in New Zealand power system—A systematic review. In Proceedings of the Universities Power Engineering Conference (AUPEC 2011), Brisbane, QLD, Australia, 25–28 September 2011; pp. 1–7. [Google Scholar]
  10. Terzija, V.V. Adaptive underfrequency load shedding based on the magnitude of the disturbance estimation. IEEE Trans. Power Syst. 2006, 21, 1260–1266. [Google Scholar] [CrossRef]
  11. Rudez, U.; Mihalic, R. Monitoring the first frequency derivative to improve adaptive underfrequency load-shedding schemes. IEEE Trans. Power Syst. 2011, 26, 839–846. [Google Scholar] [CrossRef]
  12. Pasand, M.S.; Seyedi, H. New Centralized Adaptive Under Frequency Load Shedding Algorithms. In Proceedings of the 2007 Large Engineering Systems Conference on Power Engineering, Montreal, QC, Canada, 10–12 October 2007; pp. 44–48. [Google Scholar]
  13. Wang, Q.; Tang, Y.; Li, F.; Li, M.; Li, Y.; Ni, M. Coordinated Scheme of Under-Frequency Load Shedding with Intelligent Appliances in a Cyber Physical Power System. Energies 2016, 9, 630. [Google Scholar] [CrossRef] [Green Version]
  14. Dreidy, M.; Mokhlis, H.; Mekhilef, S. Application of Meta-Heuristic Techniques for Optimal Load Shedding in Islanded Distribution Network with High Penetration of Solar PV Generation. Energies 2017, 10, 150. [Google Scholar] [CrossRef] [Green Version]
  15. Jallad, J.; Mekhilef, S.; Mokhlis, H.; Laghari, J.; Badran, O. Application of Hybrid Meta-Heuristic Techniques for Optimal Load Shedding Planning and Operation in an Islanded Distribution Network Integrated with Distributed Generation. Energies 2018, 11, 1134. [Google Scholar] [CrossRef] [Green Version]
  16. Li, S.; Tang, F.; Shao, Y.; Liao, Q. Adaptive Under-Frequency Load Shedding Scheme in System Integrated with High Wind Power Penetration: Impacts and Improvements. Energies 2017, 10, 1331. [Google Scholar] [CrossRef] [Green Version]
  17. Niro, G.; Salles, D.; Alcântara, M.V.P.; da Silva, L.C.P. Largescale control of domestic refrigerators for demand peak reduction in distribution systems. Electr. Power Syst. Res. 2013, 100, 34–42. [Google Scholar] [CrossRef]
  18. Anderson, P.M.; Mirheydar, M. An adaptive method for setting underfrequency load shedding relays. IEEE Trans. Power Syst. 1992, 7, 647–655. [Google Scholar] [CrossRef]
  19. Thompson, J.G.; Fox, B. Adaptive load shedding for isolated power systems. IEE Proc. Gener. Transm. Distrib. 1994, 141, 491–496. [Google Scholar] [CrossRef]
  20. Hoseinzadeh, B.; da Silva, F.F.; Bak, C.L. Power system stability using decentralized under frequency and voltage load shedding. In Proceedings of the 2014 IEEE PES General Meeting | Conference & Exposition, National Harbor, MD, USA, 27–31 July 2014; pp. 1–5. [Google Scholar]
  21. Albrecht, M.; Robitzky, L.; Rehtanz, C. Selective and decentralized underfrequency protection schemes in the distribution grid. In Proceedings of the 2017 IEEE Manchester PowerTech, Manchester, UK, 18–22 June 2017; pp. 1–6. [Google Scholar]
  22. Gu, W.; Liu, W.; Zhu, J.; Zhao, B.; Wu, Z.; Luo, Z.; Yu, J. Adaptive Decentralized Under-Frequency Load Shedding for Islanded Smart Distribution Networks. IEEE Trans. Sustain. Energy 2014, 5, 886–895. [Google Scholar] [CrossRef]
  23. Shariati, O.; Zin, A.A.M.; Khairuddin, A.; Pesaran, M.H.A.; Aghamohammadi, M.R. An Integrated Method for under Frequency Load Shedding Based on Hybrid Intelligent System-Part I: Dynamic Simulation. In Proceedings of the 2012 Asia-Pacific Power and Energy Engineering Conference, Shanghai, China, 27–29 March 2012; pp. 1–6. [Google Scholar]
  24. Shariati, O.; Zin, A.A.M.; Khairuddin, A.; Pesaran, M.H.A.; Aghamohammadi, M.R. An Integrated Method for under Frequency Load Shedding Based on Hybrid Intelligent System-Part II: UFLS Design. In Proceedings of the 2012 Asia-Pacific Power and Energy Engineering Conference, Shanghai, China, 27–29 March 2012; pp. 1–9. [Google Scholar]
  25. Seethalekshmi, K.; Singh, S.N.; Srivastava, S.C. A synchrophasor assisted frequency and voltage stability based load shedding scheme for self-healing of power system. IEEE Trans. Smart Grid 2011, 2, 221–230. [Google Scholar] [CrossRef]
  26. Li, S.; Liao, Q.; Wang, J. Dynamic optimization of adaptive under-frequency load shedding based on WAMS. In Proceedings of the 2016 IEEE Information Technology, Networking, Electronic and Automation Control Conference, Chongqing, China, 20–22 May 2016; pp. 920–926. [Google Scholar]
  27. Shams, N.; Wall, P.; Terzija, V. Adaptive under frequency load shedding scheme based on dynamic security assessment. In Proceedings of the IET International Conference on Resilience of Transmission and Distribution Networks (RTDN) 2015, Birmingham, UK, 22–24 September 2015; pp. 1–6. [Google Scholar]
  28. Larsson, M.; Rehtanz, C. Predictive frequency stability control based on wide-area phasor measurements. In Proceedings of the IEEE Power Engineering Society Summer Meeting, Chicago, IL, USA, 21–25 July 2002; pp. 233–238. [Google Scholar]
  29. Pulendran, S.; Tate, J.E. Energy Storage System Control for Prevention of Transient Under-Frequency Load Shedding. IEEE Trans. Smart Grid 2017, 8, 927–936. [Google Scholar]
  30. Delille, G.; Francois, B.; Malarange, G. Dynamic frequency control support by energy storage to reduce the impact of wind and solar generation on isolated power system’s inertia. IEEE Trans. Sustain. Energy 2012, 3, 931–939. [Google Scholar] [CrossRef]
  31. Zhang, L.; Liu, Y.; Crow, M. Coordination of UFLS and UFGC by application of D-SMES. In Proceedings of the IEEE Power Engineering Society General Meeting, San Francisco, CA, USA, 16 June 2005; pp. 1064–1070. [Google Scholar]
  32. Hsu, C.-T. Enhancement of transient stability of an industrial cogeneration system with superconducting magnetic energy storage unit. IEEE Trans. Energy Convers. 2002, 17, 445–452. [Google Scholar] [CrossRef]
  33. Thalassinakis, E.J.; Dialynas, E.N.; Agoris, D. Method Combining ANNs and Monte Carlo Simulation for the Selection of the Load Shedding Protection Strategies in Autonomous Power Systems. IEEE Trans. Power Syst. 2006, 21, 1574–1582. [Google Scholar] [CrossRef]
  34. Bai, D.; Kirby, B.; He, J.; Writer, D.; Yang, X.; Liu, L. Under frequency load shedding scheme based on information sharing technology. In Proceedings of the 22nd International Conference and Exhibition on Electricity Distribution (CIRED 2013), Stockholm, Sweden, 10–13 June 2013; pp. 1–4. [Google Scholar]
  35. Abdel-Rahman, K.; Mill, L.; Phadke, A.; de la Ree, J.; Liu, Y. Internet based wide area information sharing and its roles in power system state estimation. In Proceedings of the 2001 IEEE Power Engineering Society Winter Meeting, Columbus, OH, USA, 28 January–1 February 2001; Volume 2, pp. 470–475. [Google Scholar]
  36. Nirenberg, S.A.; McInnis, D.A.; Sparks, K.D. Fast acting load shedding. IEEE Trans. Power Syst. 1992, 7, 873–877. [Google Scholar] [CrossRef]
  37. Parniani, M.; Nasri, A. SCADA based under frequency load shedding integrated with rate of frequency decline. In Proceedings of the 2006 IEEE Power Engineering Society General Meeting, Montreal, QC, Canada, 18–22 June 2006; p. 6. [Google Scholar]
  38. Lu, N. An Evaluation of the HVAC Load Potential for Providing Load Balancing Service. IEEE Trans. Smart Grid 2012, 3, 1263–1270. [Google Scholar] [CrossRef]
  39. Mirzazad-Barijough, S.; Mashhuri, M.; Ranjbar, A.M. A predictive approach to control frequency instabilities in a wide area system. In Proceedings of the PSCE’09 IEEE/PES Power Systems Conference and Exposition, Seattle, WA, USA, 15–18 March 2009; pp. 1–6. [Google Scholar]
  40. Qela, B.; Mouftah, H.T. Peak Load Curtailment in a Smart Grid via Fuzzy System Approach. IEEE Trans. Smart Grid 2014, 5, 761–768. [Google Scholar] [CrossRef]
  41. Chiu, W.; Sun, H.; Poor, H.V. Energy Imbalance Management Using a Robust Pricing Scheme. IEEE Trans. Smart Grid 2013, 4, 896–904. [Google Scholar] [CrossRef] [Green Version]
  42. Al-Awami, A.T.; Amleh, N.A.; Muqbel, A.M. Optimal Demand Response Bidding and Pricing Mechanism with Fuzzy Optimization: Application for a Virtual Power Plant. IEEE Trans. Ind. Appl. 2017, 53, 5051–5061. [Google Scholar] [CrossRef]
  43. Mitchell, M.A.; Lopes, J.A.P.; Fidalgo, J.N.; McCalley, J.D. Using a neural network to predict the dynamic frequency response of a power system to an under-frequency load shedding scenario. In Proceedings of the 2000 Power Engineering Society Summer Meeting, Seattle, WA, USA, 16–20 July 2000; pp. 346–351. [Google Scholar]
  44. Rostamirad, S. Intelligent Load Shedding Scheme for Frequency Control in Communities with Local Alternative Generation and Limited Main Grid Support. Master’s Thesis, Department of Electrical & Computer Engineering, The University of British Columbia, Vancouver, BC, Canada, June 2011. [Google Scholar]
  45. IGRID. A Benefit Comparison of Load Shedding Versus Use of Distributed Generation; Intelligent Grid Research Cluster, Technical Report: Broadway, NSW, Australia, June 2011; Available online: http://igrid.net.au/resources/index.html#project3 (accessed on 11 February 2020).
  46. Wang, J.; Zhang, H.; Zhou, Y. Intelligent Under Frequency and Under Voltage Load Shedding Method Based on the Active Participation of Smart Appliances. IEEE Trans. Smart Grid 2017, 8, 353–361. [Google Scholar] [CrossRef]
  47. Tang, J.; Liu, J.; Ponci, F.; Monti, A. Adaptive load shedding based on combined frequency and voltage stability assessment using synchrophasor measurements. IEEE Trans. on Power Syst. 2013, 28, 2035–2047. [Google Scholar] [CrossRef]
  48. Mollah, K.; Nair, N.C.-K. Coordinated strategy for under-voltage and under-frequency load shedding. In Proceedings of the 2010 20th Australasian Universities Power Engineering Conference (AUPEC), Christchurch, New Zealand, 5–8 December 2010; pp. 1–6. [Google Scholar]
  49. Zimmermann, H.-J. Fuzzy Set Theory-and Its Applications, 4th ed.; Springer: Berlin/Heidelberg, Germany, 2001. [Google Scholar]
  50. Yager, R.R.; Kacprzyk, J. (Eds.) The Ordered Weighted Averaging Operators: Theory and Applications; Kluwer Academic Publishers: Boston, MA, USA, 1997. [Google Scholar]
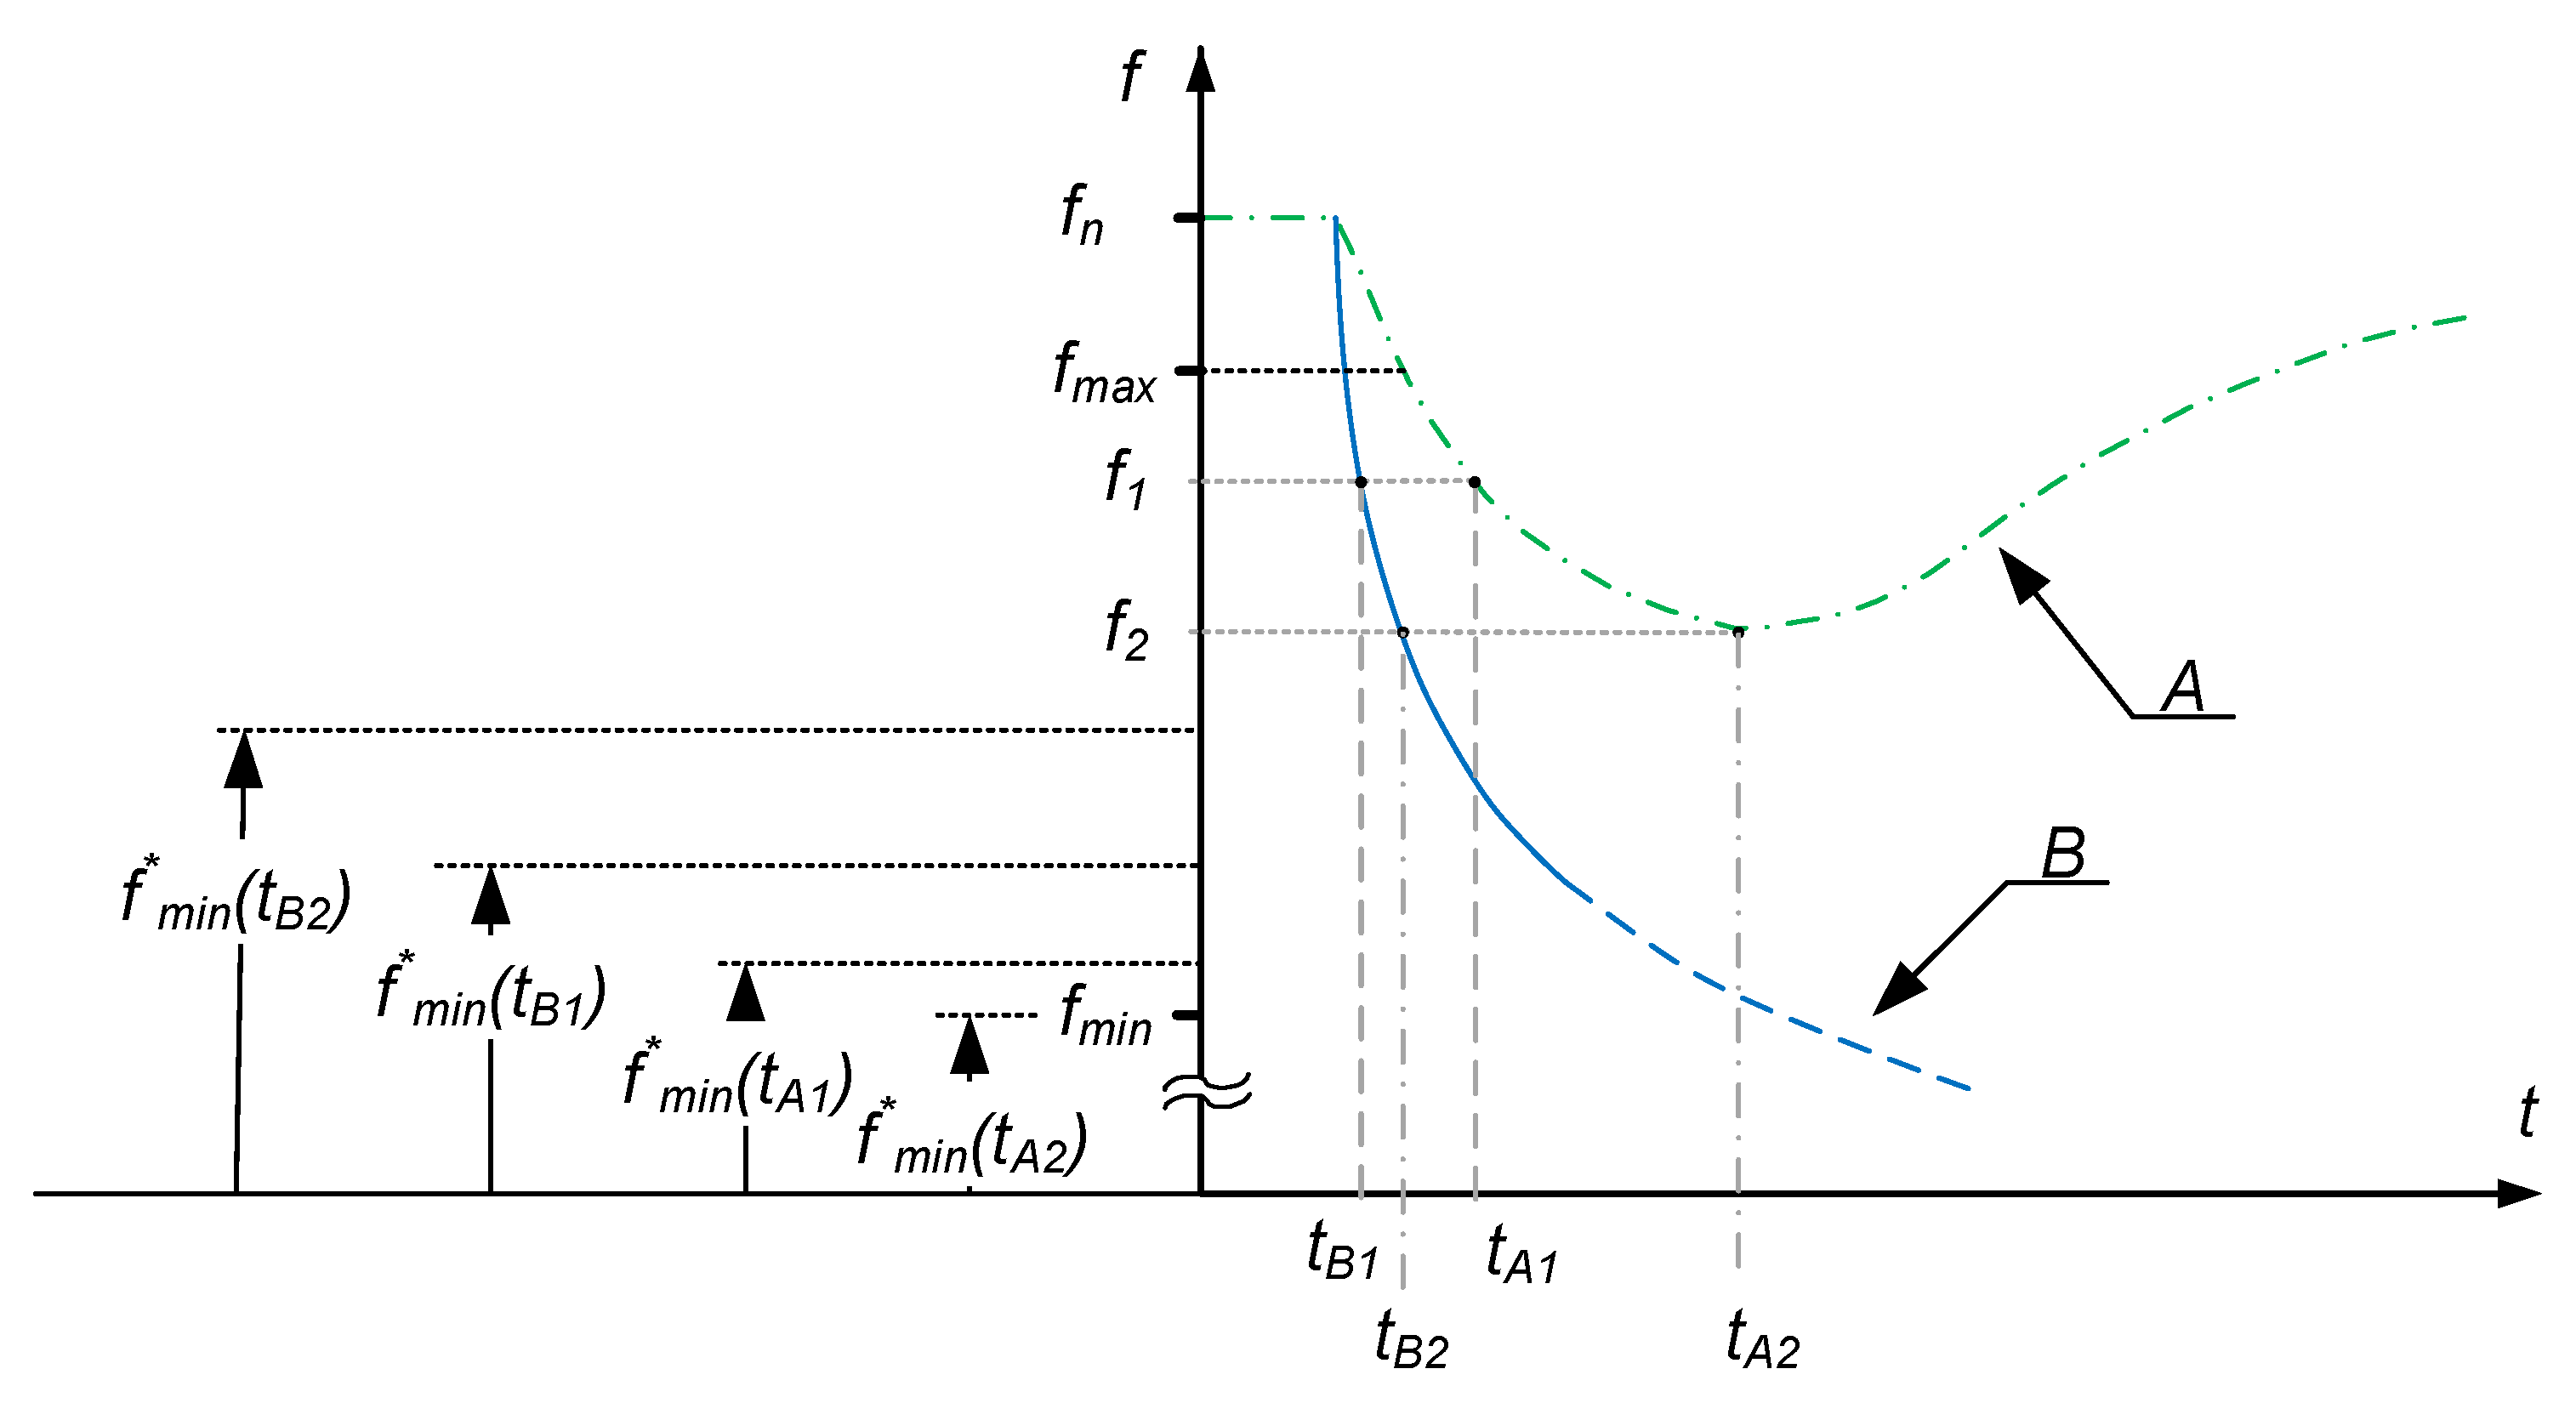
Figure 1. Illustration of the idea of changing the value f m i n * depending on the actual frequency f and the rate of frequency change f .
Energies 13 01456 g001
Figure 2. Flowchart of the fuzzy adaptive underfrequency load shedding (UFLS; y is the number of load groups to be disconnected).
Energies 13 01456 g002
Figure 3. Membership functions used in the proposed algorithm: (a) low frequency, (b) high rate of frequency change.
Energies 13 01456 g003
Figure 4. Test system topology.
Energies 13 01456 g004
Figure 5. Time variation of selected variables during the unloading process for Case A: (a) frequency, (b) membership functions and UFLS output y, (c) frequency derivative (RoCoF), (d) corrected minimum frequency f*min, (e) active power disconnected, (f) maximum RoCoF f max * .
Energies 13 01456 g005
Figure 6. Time variation of selected variables during the unloading process—Case B: (a) frequency, (b) membership functions and UFLS output y, (c) frequency derivative (RoCoF), (d) corrected minimum frequency f*min, (e) active power disconnected, (f) maximum RoCoF f max * .
Energies 13 01456 g006
Figure 7. Time variation of selected variables during the unloading process—Case C: (a) frequency, (b) membership functions and UFLS output y, (c) frequency derivative (RoCoF), (d) corrected minimum frequency f*min, (e) active power disconnected, (f) maximum RoCoF f max * .
Energies 13 01456 g007aEnergies 13 01456 g007b
Figure 8. Time variation of selected variables during the unloading process—Case D: (a) frequency, (b) membership functions and UFLS output y, (c) frequency derivative (RoCoF), (d) corrected minimum frequency f*min, (e) active power disconnected, (f) maximum RoCoF f max * .
Energies 13 01456 g008aEnergies 13 01456 g008b
Figure 9. Total value of the disconnected power during the shedding process for the considered cases.
Energies 13 01456 g009
Figure 10. Time variation of selected variables during the unloading process under disconnecting failures: (a) frequency, (b) membership functions, (c) active power disconnected, (d) UFLS output y.
Energies 13 01456 g010
Table 1. The assumed amounts of power to be shed at particular stages (conventional UFLS).
Stage No.IIIIIIIVV
Psh [%]2929201111
Table 2. Rate of frequency change at the first threshold.
CaseFrequency Derivative
A−1.15 Hz/s
B−0.430 Hz/s
C−1.198 Hz/s
D−0.141 Hz/s