Article

Studies on the Gasification Performance of Sludge Cake Pre-Treated by Hydrothermal Carbonization

1
Department of Environmental Engineering, Yonsei University, Wonju, Gangwon-do 26493, Korea
2
Environment and Sustainable Resources Center, Korea Research Institute of Chemical Technology, Daejeon 34114, Korea
3
Department of Chemical Engineering, Monash University, Clayton, Victoria 3800, Australia
*
Author to whom correspondence should be addressed.
Energies 2020, 13(6), 1442; https://doi.org/10.3390/en13061442
Submission received: 20 February 2020 / Revised: 15 March 2020 / Accepted: 16 March 2020 / Published: 19 March 2020
(This article belongs to the Section J: Thermal Management)

Abstract

:
Proper treatment and careful management of sewage sludge are essential because its disposal can lead to adverse environmental impacts such as public health hazards, as well as air, soil, and water pollution. Several efforts are being made currently not only to safely dispose of sewage sludge but also to utilize it as an energy source. Therefore, in this study, initiatives were taken to valorize sewage sludge cake by reducing the moisture content and increasing the calorific value by applying a hydrothermal treatment technique for efficient energy recovery. The sludge cake treated at 200 °C for 1 h was found to be the optimum condition for hydrothermal carbonization, as, in this condition, the caloric value of the treated sludge increased by 10% and the moisture content removed was 20 wt.%. To recover energy from the hydrothermally treated sludge, a gasification technology was applied at 900 °C. The results showed that the product gas from hydrothermally treated sludge cake had a higher lower heating value (0.98 MJ/Nm3) and higher cold gas efficiency (5.8%). Furthermore, compared with raw sludge cake, less tar was generated during the gasification of hydrothermally treated sludge cake. The removal efficiency was 28.2%. Overall results depict that hydrothermally treated sewage sludge cake could be a good source of energy recovery via the gasification process.

1. Introduction

Due to the rapid growth in population and the industrialization of society, the demand of water supply is increasing all over the world. To meet this demand, several water supply lines and sewerage lines are being constructed every year [1]. As the percentage of the sewered population is increasing rapidly, the sewage sludge production rate is increasing in a similar way. According to organization for economic cooperation and development (OECD) statistics, an increase was recorded not only in Korea but also globally [2,3,4]. Figure 1 clearly shows an increase in the facility capacity and penetration rate of sewage in Korea every year [5]. As of 2017, an average of 11,432 tons of sewage sludge is processed per day in 4072 sewage sludge treatment facilities nationwide [6].
Figure 2 illustrates current methods of disposal of sewage sludge, which includes incineration, landfill, fertilizer, fueling, recycling and others (such as ocean dumping and a failure to deal with sludge that year). The ratio of sludge treatment through recycling such as fueling, fertilization, and recycling was 57.5 wt.%, that through incineration was 18.7 wt.%, that through landfill was 15.4 wt.%, and that through drying was 6.0 wt.% in 2017, while sewage sludge generation continues to increase every year [7]. The graph shows a change in the method of sewage sludge treatment. The reason for the surge in sludge disposal from 2011 to 2012 was the ban on ocean dumping following the London convention in 2012, resulting in a surge in throughput. Since then, sewage sludge treatment method rates of fuel supply, landfill, and fertilizer are increasing.
However, all these disposal methods have drawbacks. For example, when treated by incineration, sewage sludge generates environmentally hazardous substances like heavy metals, particulate matter, dioxins, and other hydrocarbon materials. Eriksso et al. reported that 541 xenobiotic organic compounds (XOCs) could potentially be present in sewage sludge [8]. Among them, 99 compounds including polycyclic aromatic hydrocarbons (PAHs), dioxins, furans, polychlorinated biphenyl (PCB), etc. were identified as hazardous and require further hazard assessment. Furthermore, due to the higher moisture content of sewage sludge, the operation cost of the incineration process increases as well. The composting treatment method has some cons as well; it can enter into the human body through the food chain because of the presence of bacteria, heavy metals, or viruses in the sludge [9]. The problem related to the landfill method is its high organic matter content, which is highly decomposable and creates odor [10]. This series of elements could cause a loss of wellness for local residents. This causes Nimby syndrome. Nimby syndrome refers to the protectionist attitudes adopted by community groups that believe in the installation of “noxious” utilities but not near their homes [11]. Taking these environmental and economic problems into account, it is important to develop appropriate techniques for converting sewage sludge into usable energy [12]. Therefore, instead of conventional methods, advanced technologies are suggested in this study.
Firstly, hydrothermal carbonization (HTC) which is a technology that decomposes organic materials using subcritical conditions of water at high temperature and high pressure [13]. In addition, in the process of converting the polymers into low-molecular-weight materials, the viscosity of the material is lowered, and the particles are micronized [14]. The water of sludge can be divided into four categories, namely, free water, interstitial or capillary water, surface or vicinal water, and bound water. Free water accounts for 70–75% of the sludge moisture content [15].
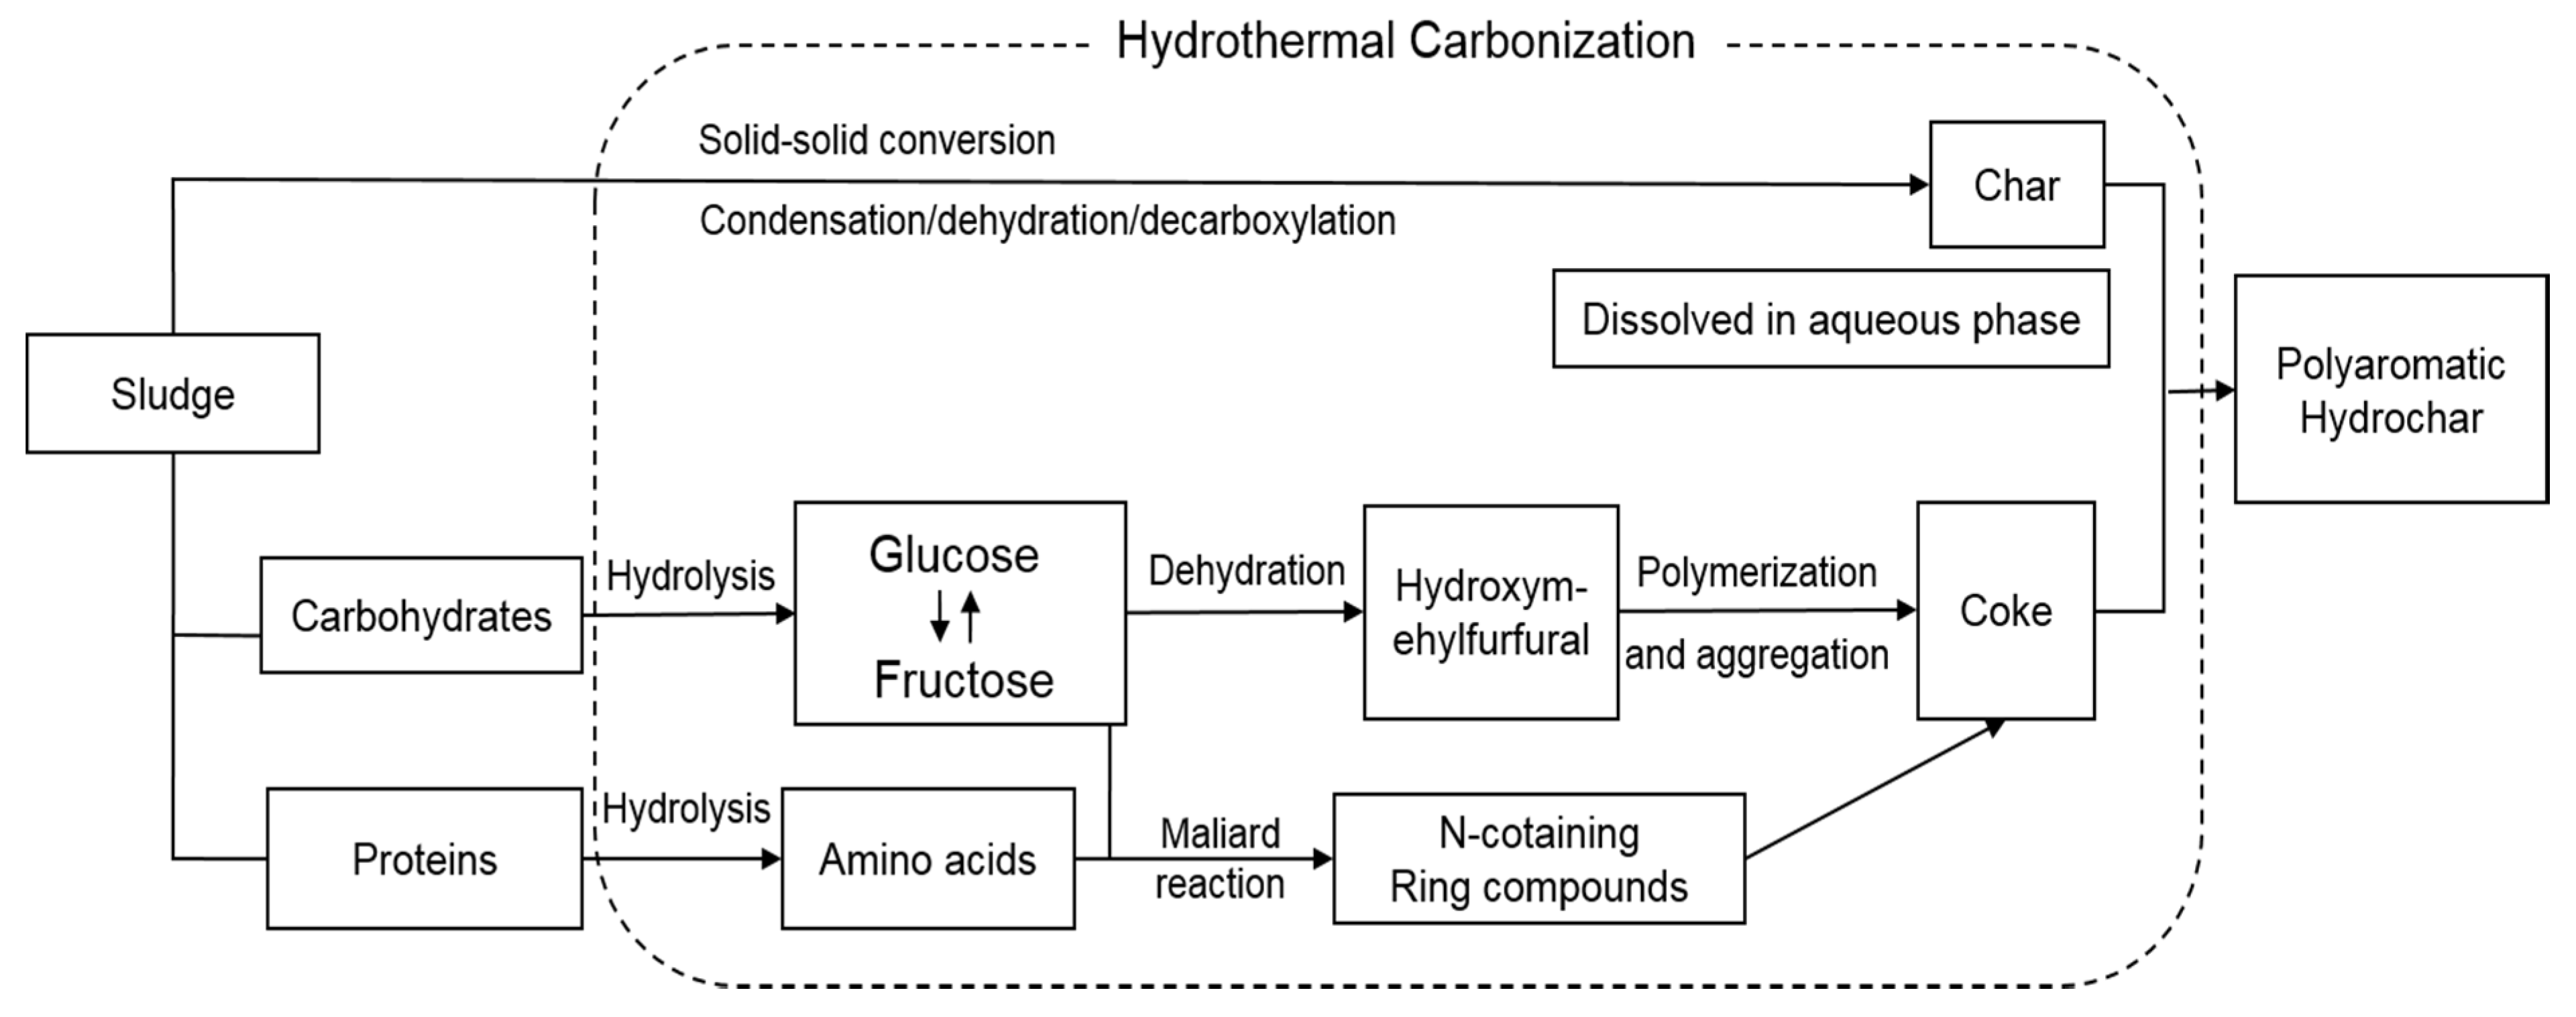
Figure 3 shows the HTC process and its mechanism in detail [16]. The HTC process converts bound water into free water, which breaks down the structure of organic cells, resulting in an effective drying process. The HTC involves various reactions such as hydrolysis, decarboxylation, condensation, and dehydration, which reduce moisture content, as well as inorganic components and hazardous materials [17]. Energy is also released during this process. This energy increases or maintains the reaction temperature of the HTC reactor, thus minimizing the need for additional energy input after the initial heating step, which minimizes the energy loss in the reactor. Escala et al. reported the theoretical energy balance for this case. According to their study, the energy balance shows that, even if the water content of stabilized sewage sludge is as low as 10%, there can theoretically be energy gains [18]. In this study, the HTC methodology was applied to valorize the sewage sludge cake quality by reducing the moisture content and reducing environmental risks such as the presence of perishable, pathogenic, and hazardous materials. This improves the economic value and reduces the environmental impacts of the sewage sludge cake, making it more suitable for future applications [19].
Secondly, gasification, which is suggested in this study, is a thermochemical conversion process of carbonaceous material into gaseous products at high temperatures with the aid of a gasification agent. The gasification agent (another gaseous compound) allows the feedstock to be quickly converted into gas by means of different heterogeneous reactions [20]. The syngas required from the process is produced via the reformation of fossil carbon sources, such as coal, oil, or natural gas. To give new perspectives for energy savings and greenhouse gas emission, mitigation for syngas production highlights gasification as a candidate for the future energy economy [21].
Gasification is an efficient technology used for the purposes of producing efficient gas fuels or using them as building blocks for making different chemicals [22,23]. The main advantage of this process is that any type of feedstock can be used. Moreover, gasification typically converts the entire carbon content of the feedstock. The second advantage is that the product gas can be converted into a variety of fuels (H2, biogas, synthetic diesel, and gasoline) and chemicals (methanol, urea). The other benefit of the gasification process is the lowered CO2 emissions when using a compact equipment set-up with higher thermal efficiency [21,24]. In general, during gasification, 20–40% of the stoichiometric oxidizing agent for complete combustion is injected into the gasifier, and the gasification reactions take place at a lower temperature compared to the incineration method. The main type of gasification reactors are downdraft, updraft, and cross draft [25]. A downdraft-type gasifier was selected for conducting this experiment. Since the final product gas of updraft reactors flows through the pyrolysis zone, it contains a large amount of tar, whereas the downdraft reactor reduces the tar content due to cracking and adsorption by char as the final product gas passes through the lower part [26]. The main stages of downdraft gasification are drying, pyrolysis, combustion, and reduction. Firstly, the moisture contained in sewage sludge cake is removed from the drying zone below 200 °C. Thereafter, the pyrolysis step proceeds slowly until it reaches 350 °C, and most of the reaction is performed at 700 °C. The pyrolysis step is an endothermic reaction, and thermal cracking and condensation take place [27]. The combustion reaction is an exothermic reaction, and all of the heat that causes drying, pyrolysis, and reduction is either directly generated from combustion or indirectly recovered from combustion by the heat exchange process of the gasifier. Finally, in the reduction zone, condensable and non-condensable vapors and char undergo gasification and produce combustible gases. Under these conditions, various chemical reactions take place, which are shown in Table 1 [28].
The gaseous product obtained during this process is called synthetic gas (syngas) or product gas, and it mainly contains hydrogen, carbon monoxide, carbon dioxide, and methane [29]. In addition, inert gases, hydrocarbons, tar, and gas pollutants can be found [30,31]. This method produces fewer air pollutants compared to direct combustion, and the generated gas is used in gas engines, boilers, and gas turbines to produce electricity and manufacturing of various chemical products [32,33]. The production of renewable energy using a gasification system is an environmentally friendly method that helps reduce dependence on fossil fuels. However, when the gasification technology was applied to sewage sludge, it was not found to be an efficient process as for other wastes. The main reason behind this is the calorific value of sewage sludge, which is low because of the high moisture and low carbon component. In addition, many harmful substances and contaminants are generated during this process. To supplement this, the feedstock was pre-treated using a hydrothermal treatment technique and applied to gasification. Many researchers already reported the HTC and gasification of sewage sludge [12,14,16]. However, these studies did not reduce contaminant and moisture content in natural conditions in the combined technology of HTC and gasification. Thus, in this study, an effort was made to investigate the effect of sewage sludge concurrently treated by HTC and gasification technology. Furthermore, in this study, tar, which is the biggest problem in gasification, was studied in detail.

2. Materials and Methods

2.1. Characteristics of Sewage Sludge Cake

The feedstock used in this study was sludge generated in a sewage treatment plant, which refers to the liquid solid precipitated by the action of gravity. The reduced and stabilized sludge was mixed with a flocculant in the digester. It was dehydrated in a dehydrator to be discharged as a sludge cake. Table 2 shows the methodology of sludge cake characteristics analysis. The target composition of elemental analysis was carbon (C), hydrogen (H), nitrogen (N), oxygen (O), and sulfur (S). These elements are combined to make high-molecular materials such as fat, protein, fiber, and so on [34]. Although it is not well dissolved in liquids, it is well known that cellulose films are destroyed by the physical properties of sludge. The particles are transformed from a high-molecular-weight material into a low-molecular-weight material to cause a particle refining reaction [35]. This characteristic change was observed using organic transform infrared spectroscopy.
In the case of proximate analysis, moisture, volatile matter (VM), fixed carbon (FC), and ash content (AC) were analyzed to determine the rate at which the sample’s volatile matter and fixed carbon can be converted to gas [36]. Furthermore, the calorific value refers to the maximum amount of heat generated when the sample reacts, and it is the most important criterion for the performance of the fuel. The higher heating value (HHV) was analyzed using the equipment in the table below, and the lower heating value (LHV) was calculated by substituting the elemental analysis value in Dulong’s equation [37].

2.2. Hydrothermal Carbonization Process

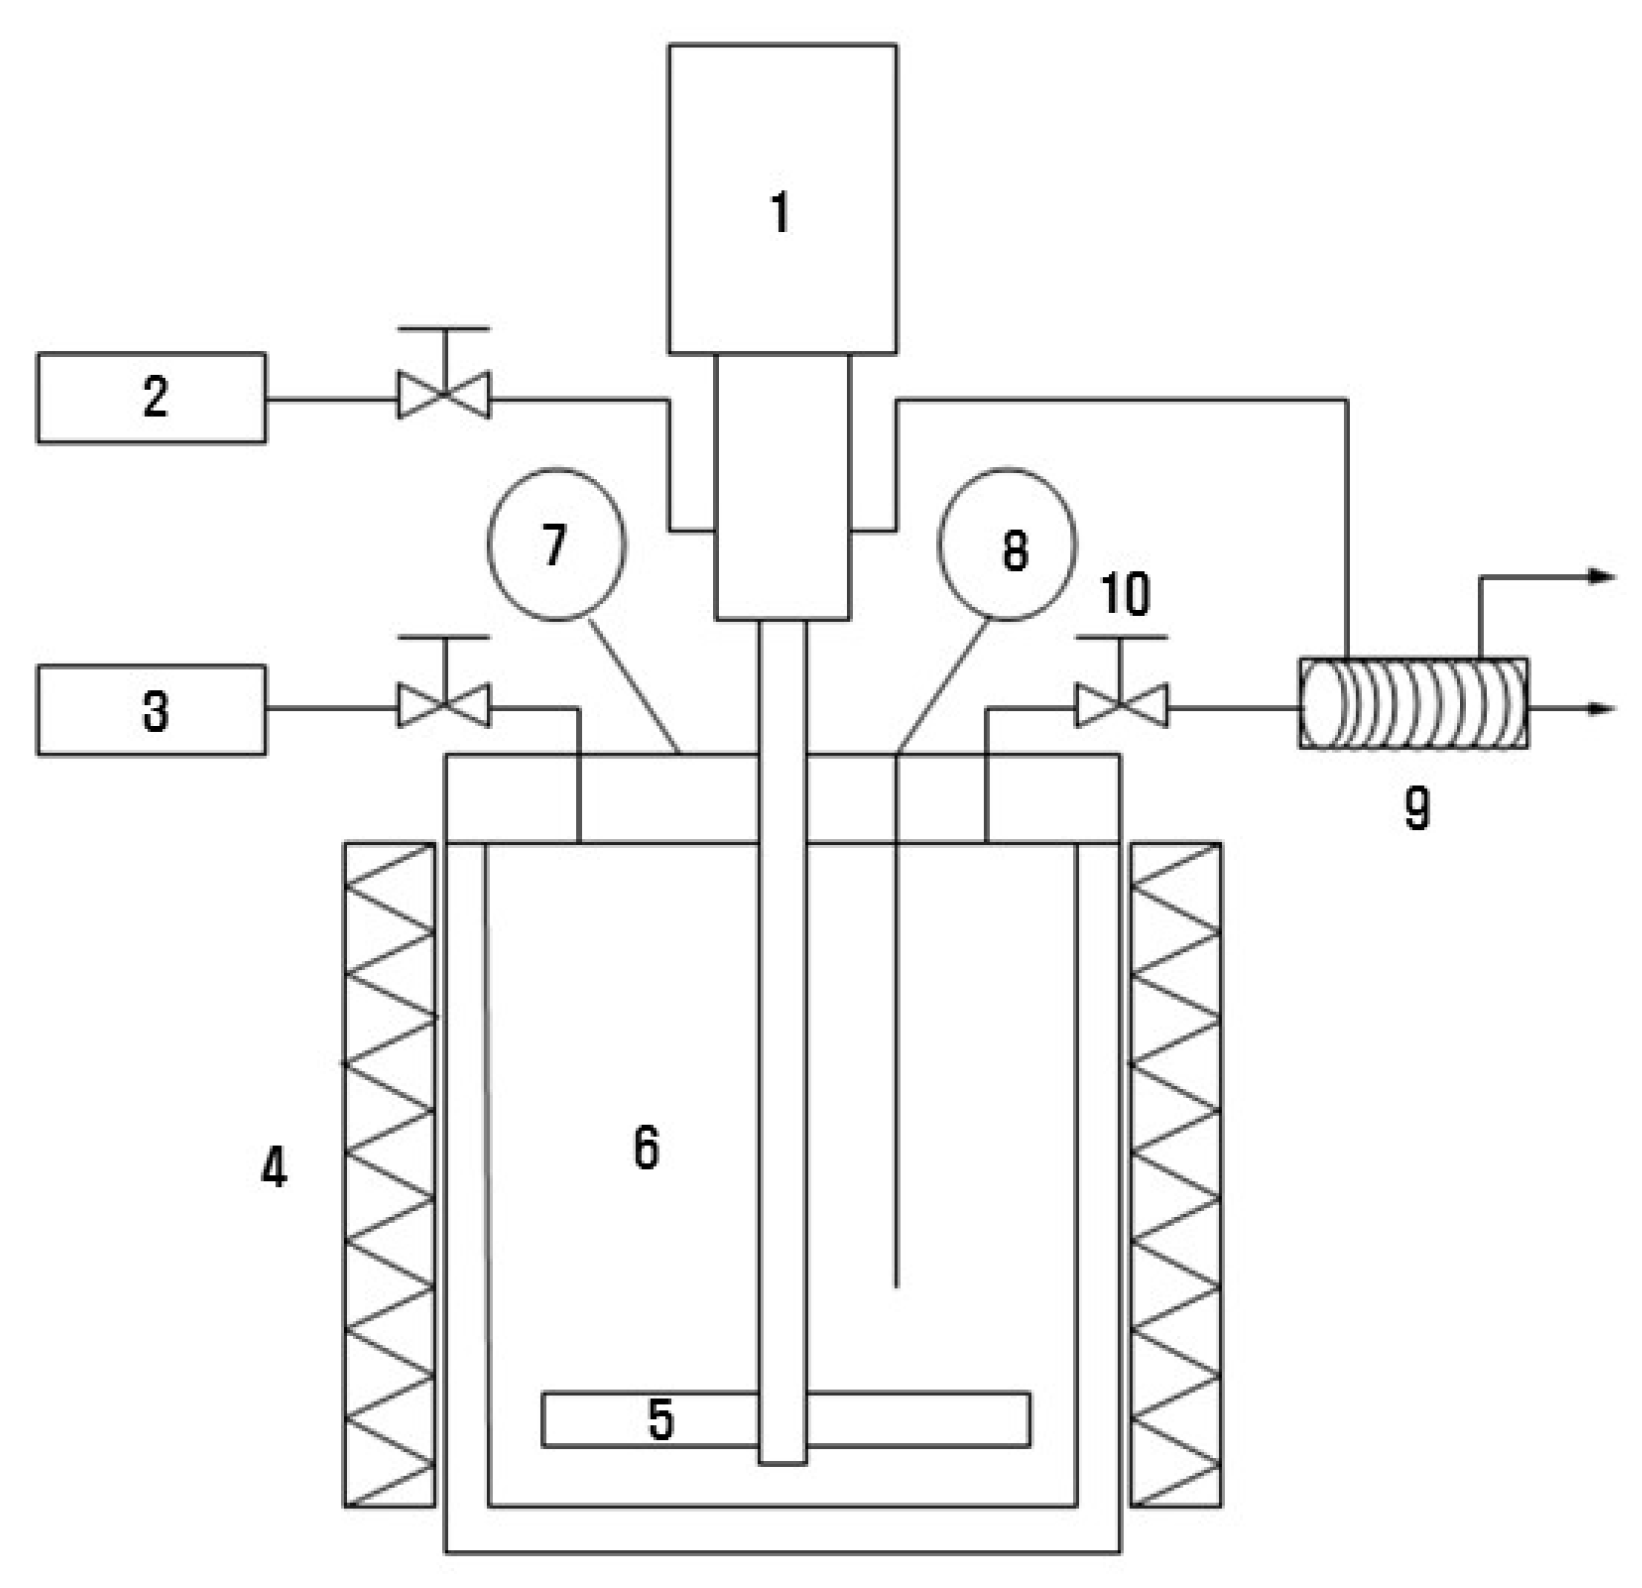
HTC is a treatment process for rupturing cell walls and organic membranes using subcritical conditions of water while improving the dehydration of sludge [38]. The process diagram of the hydrothermal reactor in this experiment is shown in Figure 4. The process consisted of a reactor, a heater, a condenser, a pressure gauge, etc., and the reactor had a capacity of 1 L. The amount of water and sewage sludge cake was mixed in a ratio of 4:1. The reaction temperature was increased for 30 min, and the reaction time was 1 h. A stirrer was installed in the reactor to ensure uniformity, and the stirrer was run at 400 rpm. Before starting the reaction, nitrogen was injected to achieve inert conditions inside the reactor. After the completion of the reaction, the decompression valve was opened, and steam was removed from the reactor to lower the pressure. A pressure gauge was installed to monitor the pressure change in the reactor during the reaction. The reaction temperatures were set to four conditions: the low-temperature condition of 0 °C and the sub-critical water temperatures of 180 °C, 200 °C, and 220 °C. In order to determine the drying efficiency over time, water was removed by applying constant pressure with a mechanical pressing device, measured 10 times every 6 h at 30 °C in a dryer.

2.3. Gasification Process

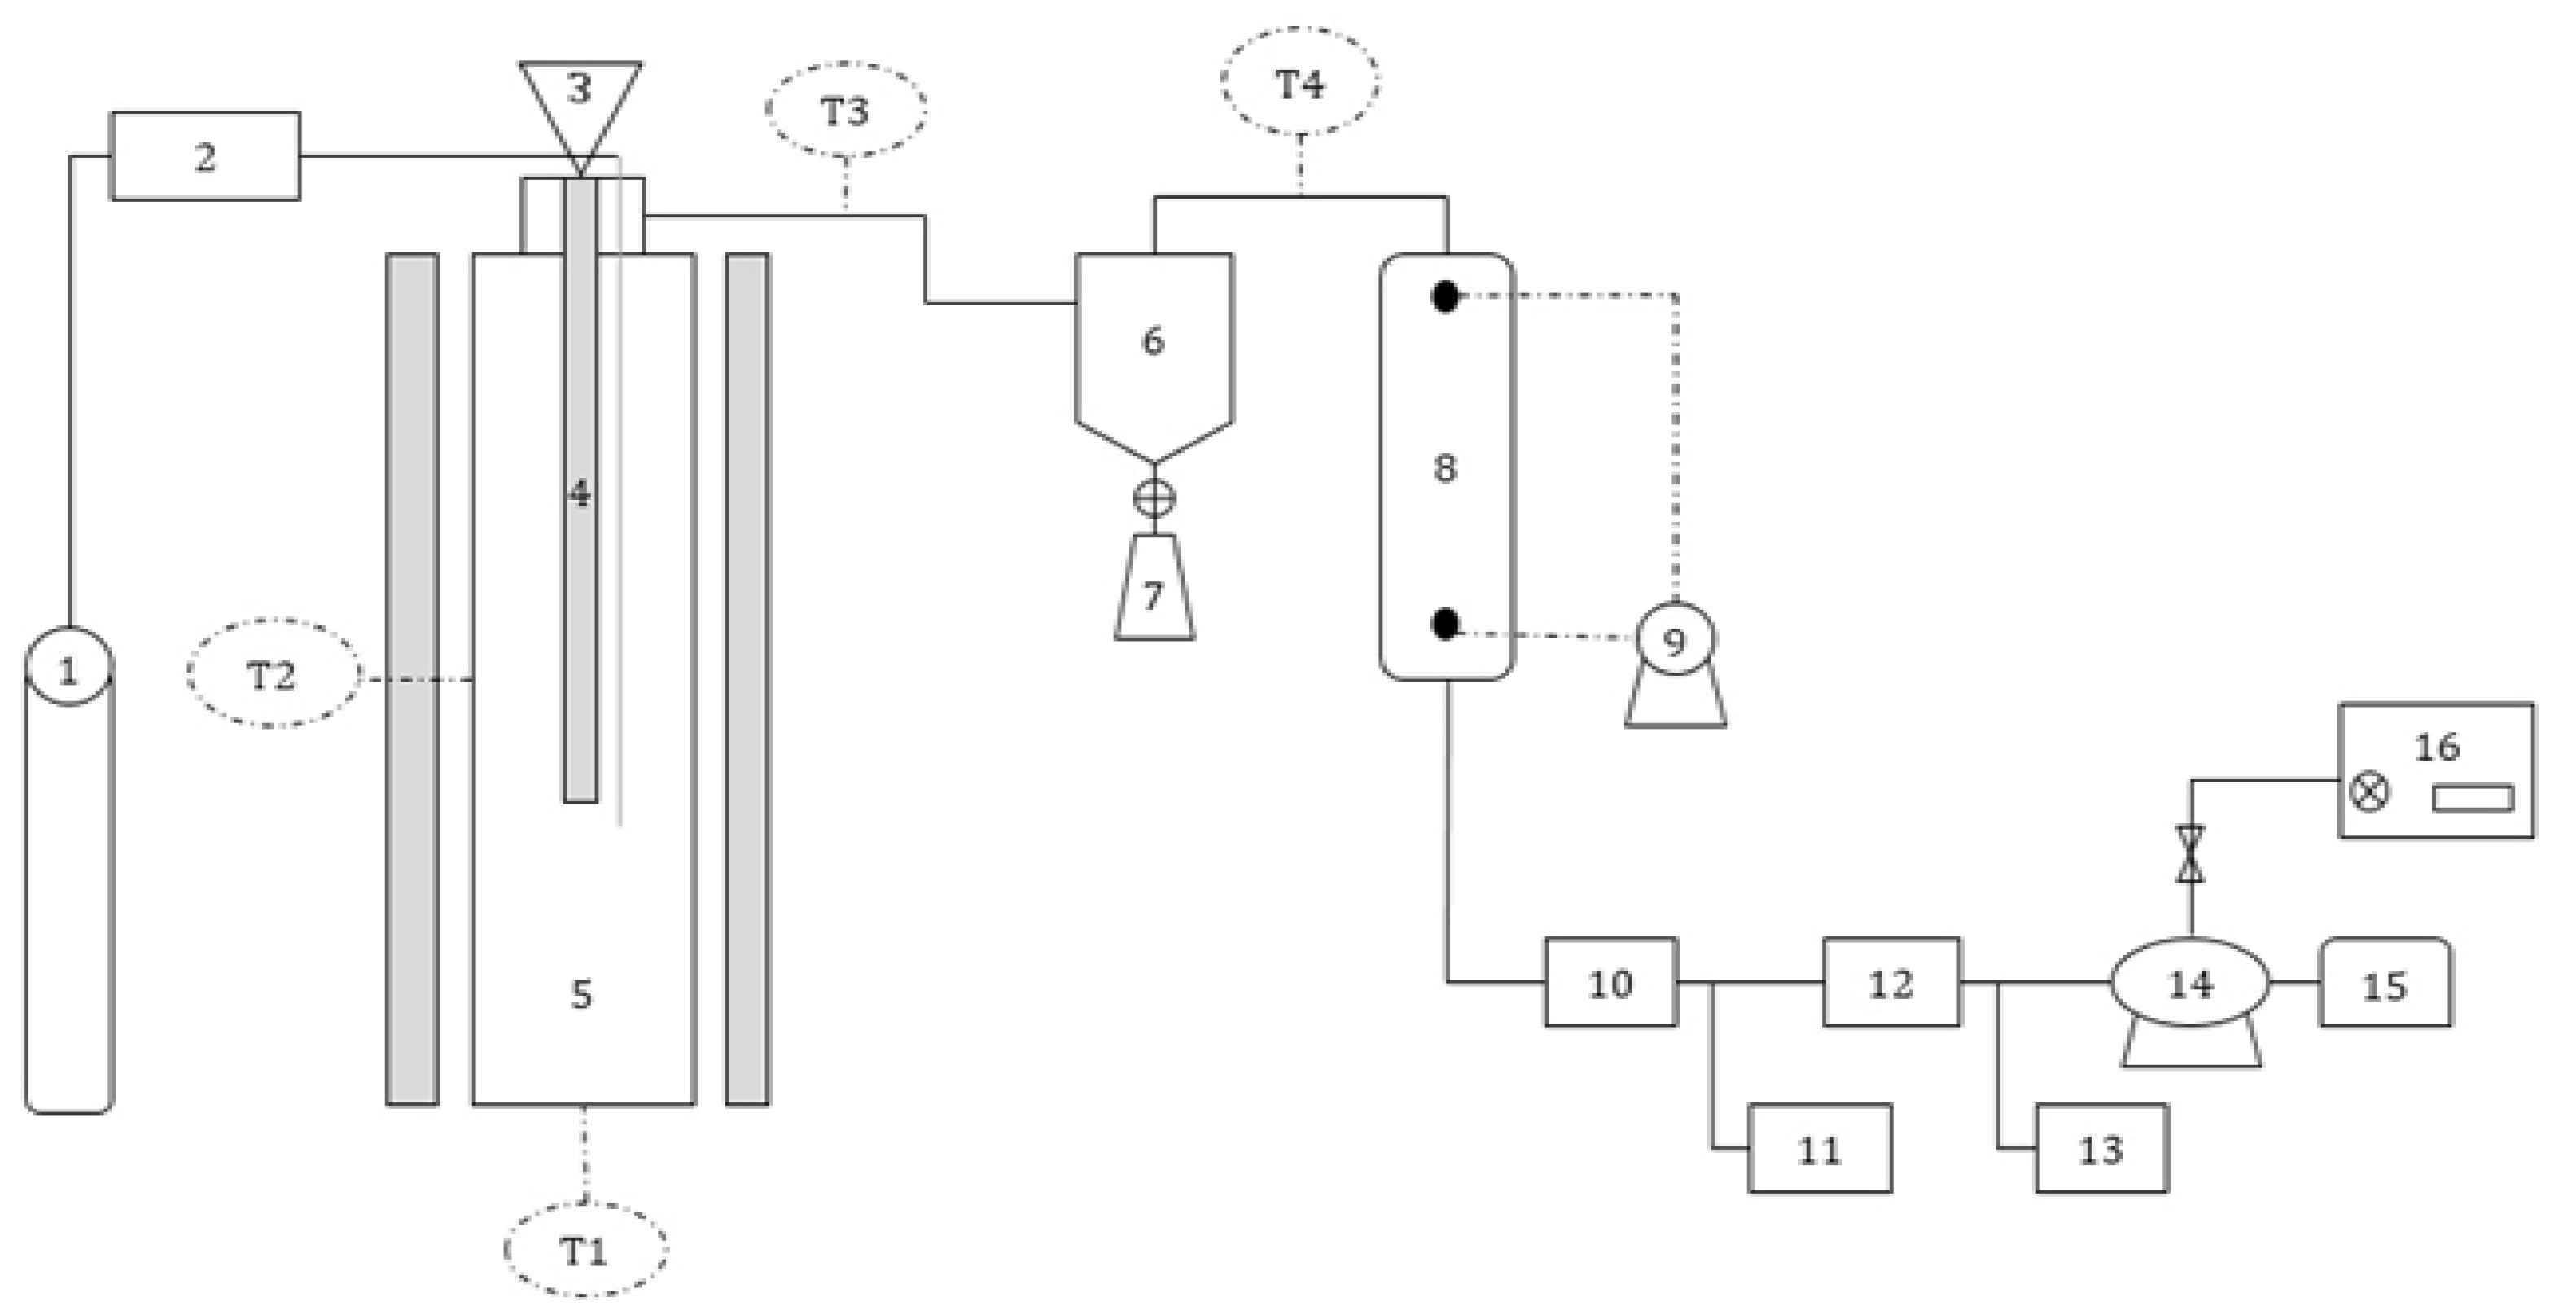
Figure 5 shows a schematic diagram of the gasification process used in the experiment. The process consisted of a feeder, a downdraft gasifier, a cyclone, a bag filter, and a scrubber. The feeder was a semi-batch type and 5 g of sample was fed per minute. The experiments were conducted at 900 °C. To clean the product gas, a cyclone, a filter, and a wet-scrubber were used in the process. Gas analysis was performed using micro-GC (Agilent 3000 A). Analyses of by-products including tar and gaseous pollutants, which are a problem in the gasification process, were also performed. Gaseous pollutant analyses were performed for HCl, HCN, and NH3. HCl and HCN were analyzed using an ion chromatograph (IC) and NH3 was analyzed using air pollution test standards in Korea.
Tar analysis was performed by removing dust through a thimble filter using a cold solvent trapping (CST) method with isopropyl solution. Among the tar analysis methods, the European Tar Protocol can measure organic contaminants and particles in the product gas from gasifiers. Figure 6 depicts the schematic diagram of the tar sampling method. The sampling train consisted of six impingers, the first of which had an empty bottle for condensation of water, while the second to fifth impingers had 50 mL of isopropyl alcohol (IPA). Impingers 1, 2, and 3 were installed in a heated bath at 35 °C, and impingers 4, 5 and 6 were installed in a cold bath using ice. Each sampling was conducted for at least 1 h at a flowrate of 1 L/min and the qualitative analysis was done using GC–MS (Shimadzu 2010 plus).
The efficiency of the gasification process was calculated using Equations (1)–(4) for the Ygas, LHVgas, ηCCR, and ηCGE. ηCGE is an index indicating the efficiency of converting thermal energy from a sample to a gas by gasification, and it can evaluate the energy recovery rate. In the case of ηCCR, it is an index indicating the ratio of the carbon converted to gas to the carbon contained in the fuel, allowing the reactivity of the sample to be calculated; Ygas is an index for determining the amount of gas generation [39,40].
ηCGE = ((LHV of Product) × Ygas) ÷ (LHV of feedstock)) × 100,
where Ygas is the product gas yield (Nm3/kg), LHVgas is the lower heating value (MJ/Nm3) of the product gas, and LHV is the lower heating value of the feedstock (MJ/kg).
ηCCR = 12 × Ygas × (CO + CO2 + CH4 + 2 × C2H6 + 2 × C3H8) ÷ (22.4 × C),
where Ygas is the gas yield of the feedstock; CO, CO2, CH4, C2H6, and C3H8 are presented as v/v (%) and C is presented as wt.% of the feedstock.
Ygas (Nm3/kg) = Product gas flow rate (Nm3/h) ÷ Input feedstock mass rate (kg/h),
where the volume of the product gas is on an N2-free basis (Nm3), while the quantity of sludge is given in kg.
LHVgas (kcal/Nm3) = CO × 30.35 + H2 × 24.70 + CH4 × 85.70 + C2H6 × 153.80 + C3H8 × 223.50,
where CO, H2, CH4, and CnHm (including C2H6, C3H8) are gas concentrations in vol.%.

3. Results and Discussion

3.1. Hydrothermal Carbonization Efficiency

3.1.1. Characteristics of Hydrothermally Treated Sludge Cake

Table 3 shows the results of the physicochemical analysis of raw sludge cake and sludge cake after HTC. Compared to other investigations on the thermal treatments of sludge, the carbon and volatile components and the heating value were high, which is good as a fuel for gasification [39,41]. In the case of proximate analysis, upon increasing the HTC temperature, fixed carbon increased due to carbonization, but volatile matter decreased due to thermal decomposition. The elemental analysis results depict that, as the temperature increased, the carbon component increased, while the hydrogen and oxygen components decreased. This appeared to decrease the H/C and O/C atomic ratios due to the change in H2O and CO2 levels due to the dehydration reaction. Dehydration is generally explained by the removal of hard siloxanes, and decarboxylation is the thermal cracking of long-chain carboxylic acids to carbonize the biomass by lowering the H/C and O/C ratios. As a result, the unit calorific value of the solid product is considered to be increased [42]. In addition, the decrease in sulfur and nitrogen components in feedstock, which are precursors of gaseous contaminants as the reaction temperature rises, is associated with the conversion to the gas or liquid phase as the volatile components decrease. This can reduce the potential risk for air pollutants such as H2S, HCl, HCN, NH3, SOx, and NOx.

3.1.2. Natural Drying Efficiency

The moisture content of sewage sludge cake not only requires a lot of energy to treat, but it also has the problem of reducing fuel quality and increasing transportation costs. Therefore, after mechanical dehydration, in order to show the drying efficiency with minimum energy, it was confirmed how much drying efficiency was shown in the natural drying state. To compare the drying efficiency over time, a graph was plotted (Figure 7). The figure depicts the moisture content over time before and after the HTC. Before HTC refers to raw sewage sludge and after HTC refers to the optimum conditions for hydrothermal carbonization. The optimum conditions involved a temperature of 200 °C for 1 h. In this experiment, 100 g of the sample was placed in a container and measured 10 times every 6 h at 30 °C. The sludge cake moisture content after 60 h was 23.3 wt.% after HTC and 42.8 wt.% before HTC. Before HTC, the standard error of measurement was 1.02, and, after HTC, the standard error of measurement was 0.89.
When the water content was set to 100.0 wt.% of the sample after the mechanical treatment, it can be seen that the curve was not only 19.5 wt.% lower than before HTC but it also decreased rapidly with time. In the hydrothermal reaction above 190 °C, the binding water present in the protein and carbohydrate was destroyed, and the cell wall was changed to free water. The heat transfer area was increased due to the increase in surface area due to cell-wall destruction, and the heat conductivity was increased; thus, the drying efficiency was increased upon increasing the temperature of the dry matter [43]. High hydrothermal reaction temperatures seemed to reduce the oxygen-containing functional groups during the increase in the carbon aromatic structure, thus making the hydrochar hydrophobic [42].

3.1.3. Change in Structure with Respect to Temperature

Fourier transform infrared spectroscopy (FTIR) analysis was conducted to confirm the structural change with temperature. As shown in Figure 8, strong absorption peaks were found at 3450 cm−1, 2920 cm−1, 1656 cm−1, and 1050 cm−1. Among them, the largest peak of 3400 cm−1 at the center of the 3700–2800 cm−1 range was due to the hydrogen oscillation and the amide hydrogen oscillation of alcohol, phenol, or carboxylic acid [44]. The peak of 2922 cm−1 was due to the CH oscillation of aliphatic groups, the peak of 1650 cm−1 was due to the COO and C = O of aminoids and ketones, and the 1030 cm−1 peak was due to C – O oscillation [45].
Looking at the overall picture, it can be seen that, as the temperature increased, the bands of organic groups, including methylene groups, hydroxyl groups, carboxyl groups, esters, and amides, significantly decreased. In addition, it can be seen that the violent decomposition and hydrolysis of organic components occurred due to the relatively large interval between the graphs of 180° and 200° [46,47,48].

3.2. Gasification Performance

3.2.1. Syngas Efficiency

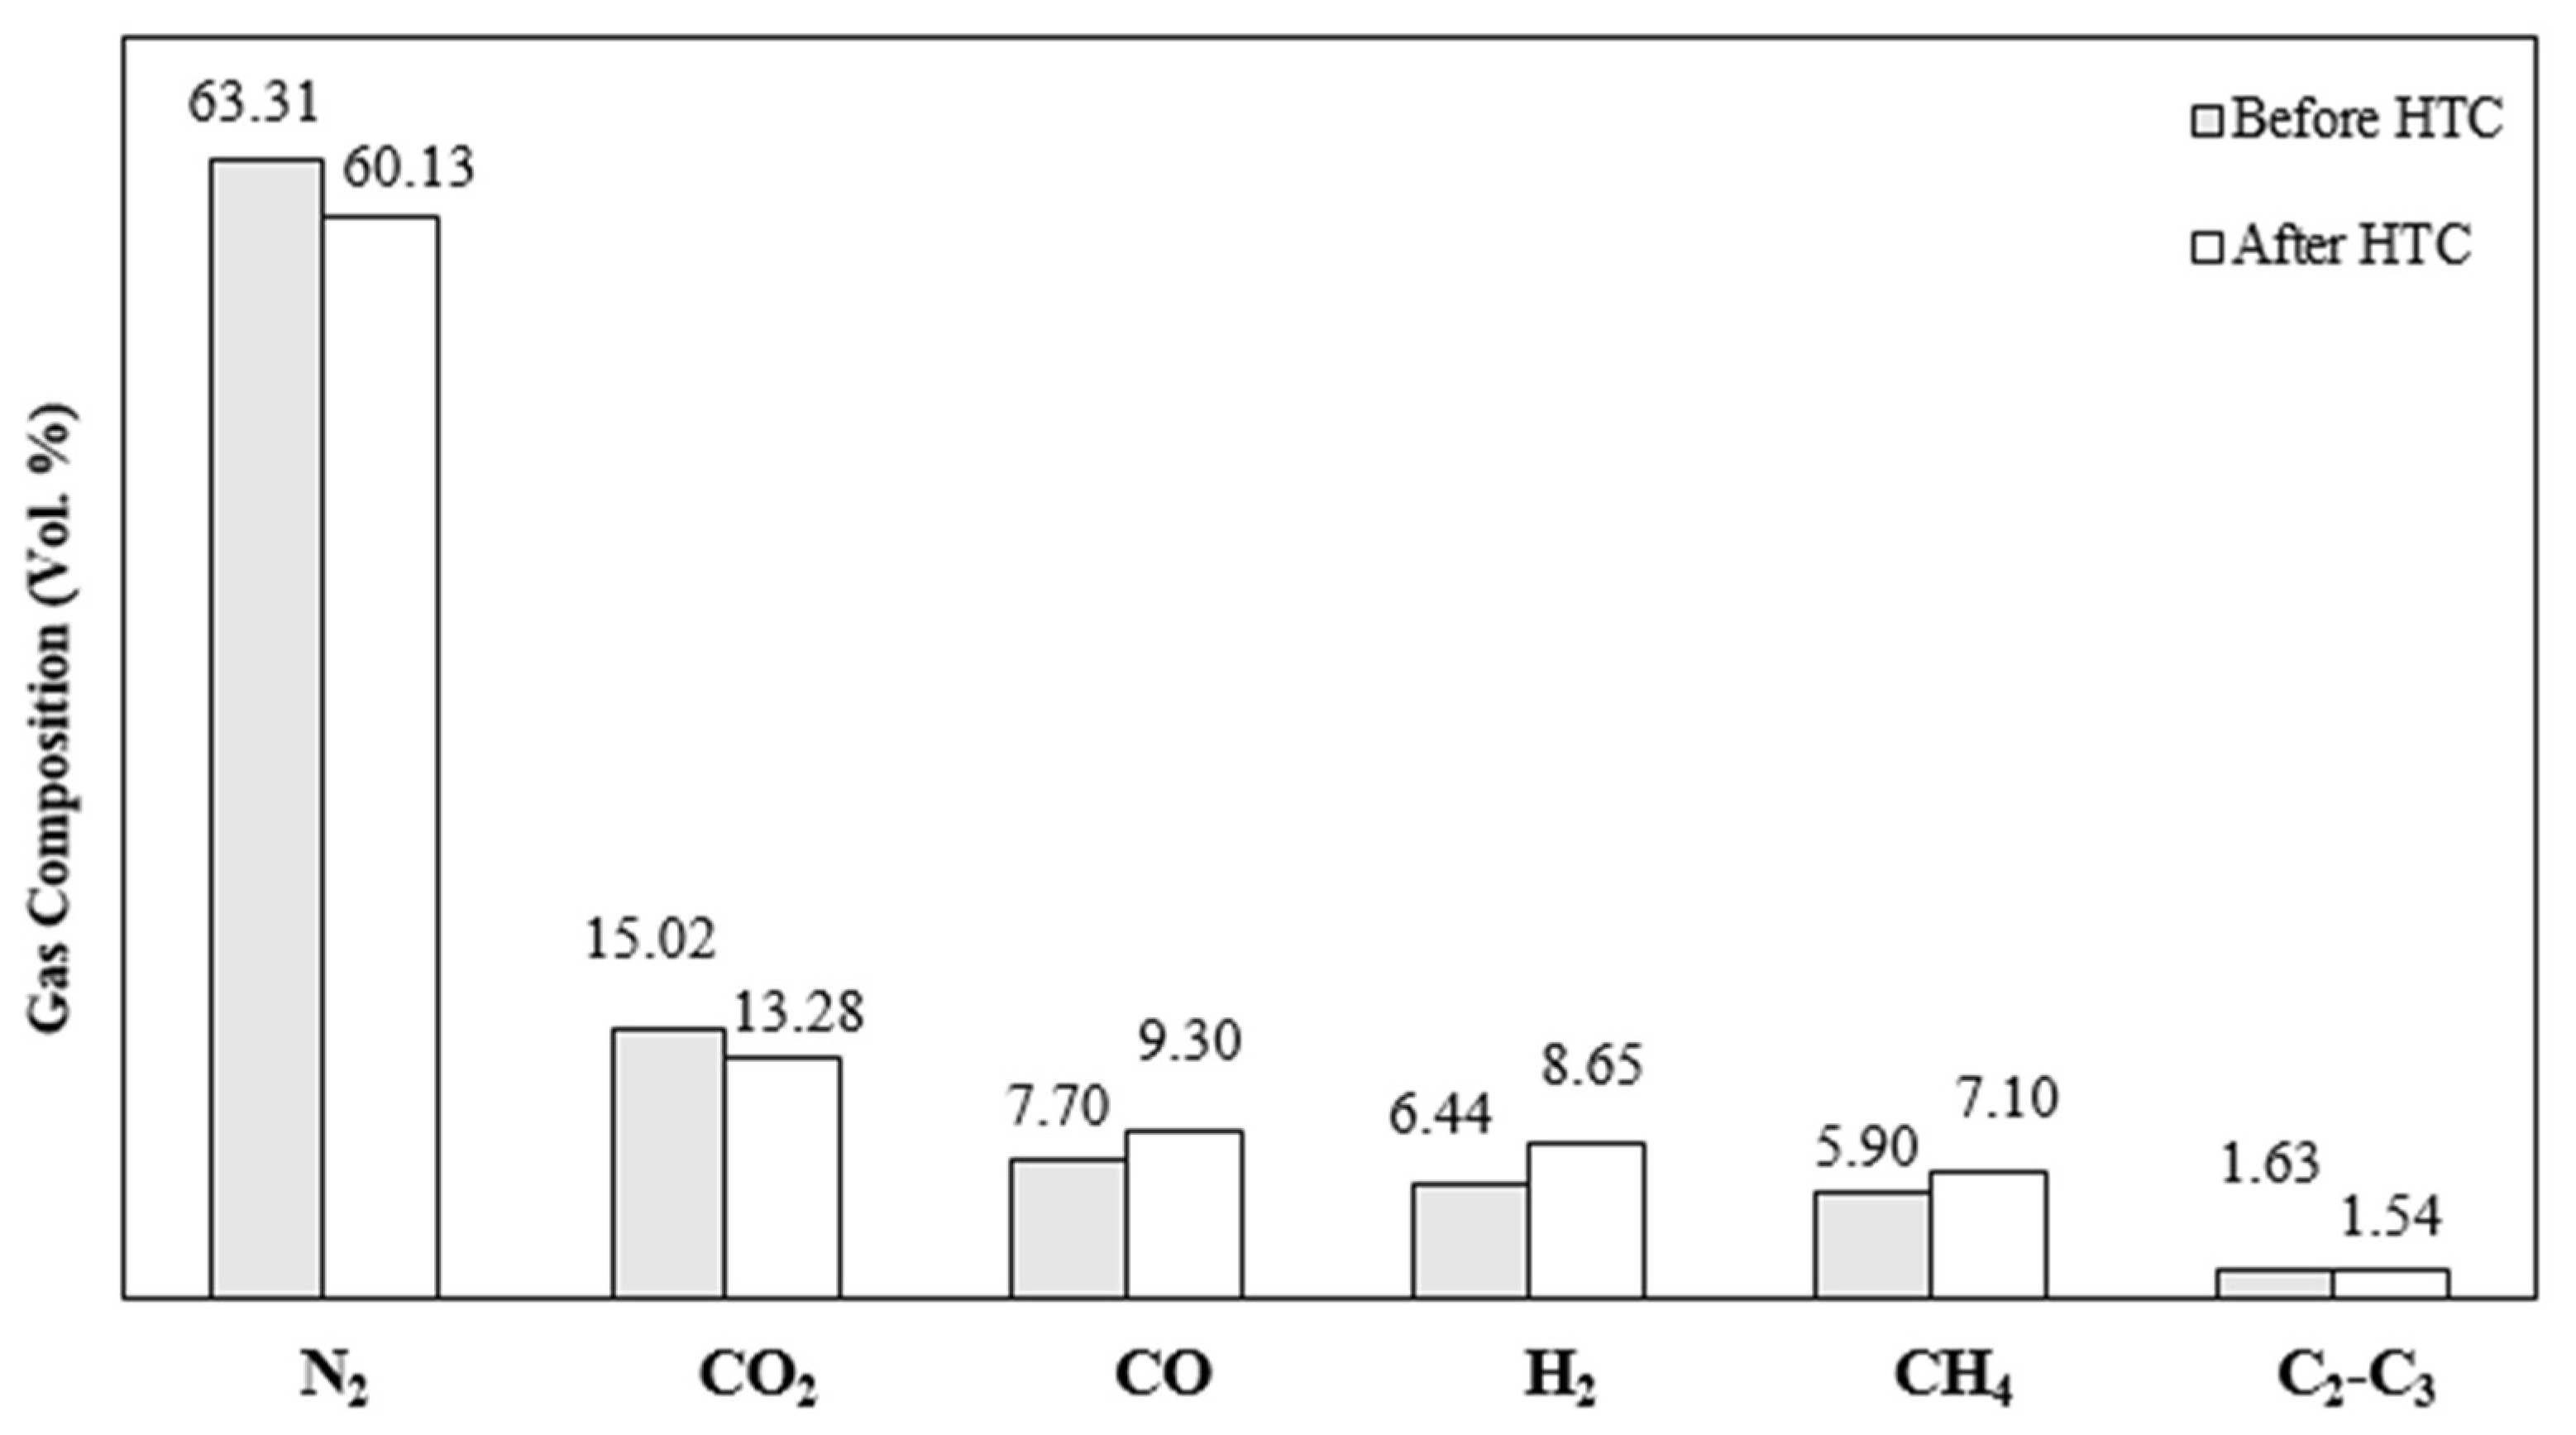
In order to inject the same amount of oxidant under the same conditions, the amount of oxidant was calculated according to the results of the elemental analysis (can be found in Table 3). The oxidizing agent was injected at the equivalence ratio (ER) of 0.3, which was 3.05 L/min for the raw sludge cake and 3.07 L/min for the hydrothermal treated sludge cake. Figure 9 illustrates the composition of product gas (N2, H2, CH4, CO, and CO2) from raw sludge cake and hydrothermally treated sludge cake at 200 °C. The gas composition shows that, after the HTC, the composition ratio of CO was relatively high, and the composition of CO2 was comparatively low. The reactions of formulas R1 (Bououard) and R2 (water—gas or steam) seemed to be dominant. It was determined that the reaction between formulas R1 and R2 was an endothermic reaction, and the reaction was more active, whereby H2 and CO tended to increase. In addition, it can be seen that hydrocarbon gases such as C2H4, C2H6, and C3H8 after HTC were reduced because the conversion to low molecules was more actively performed at high temperature by thermal decomposition of hydrocarbon gases.
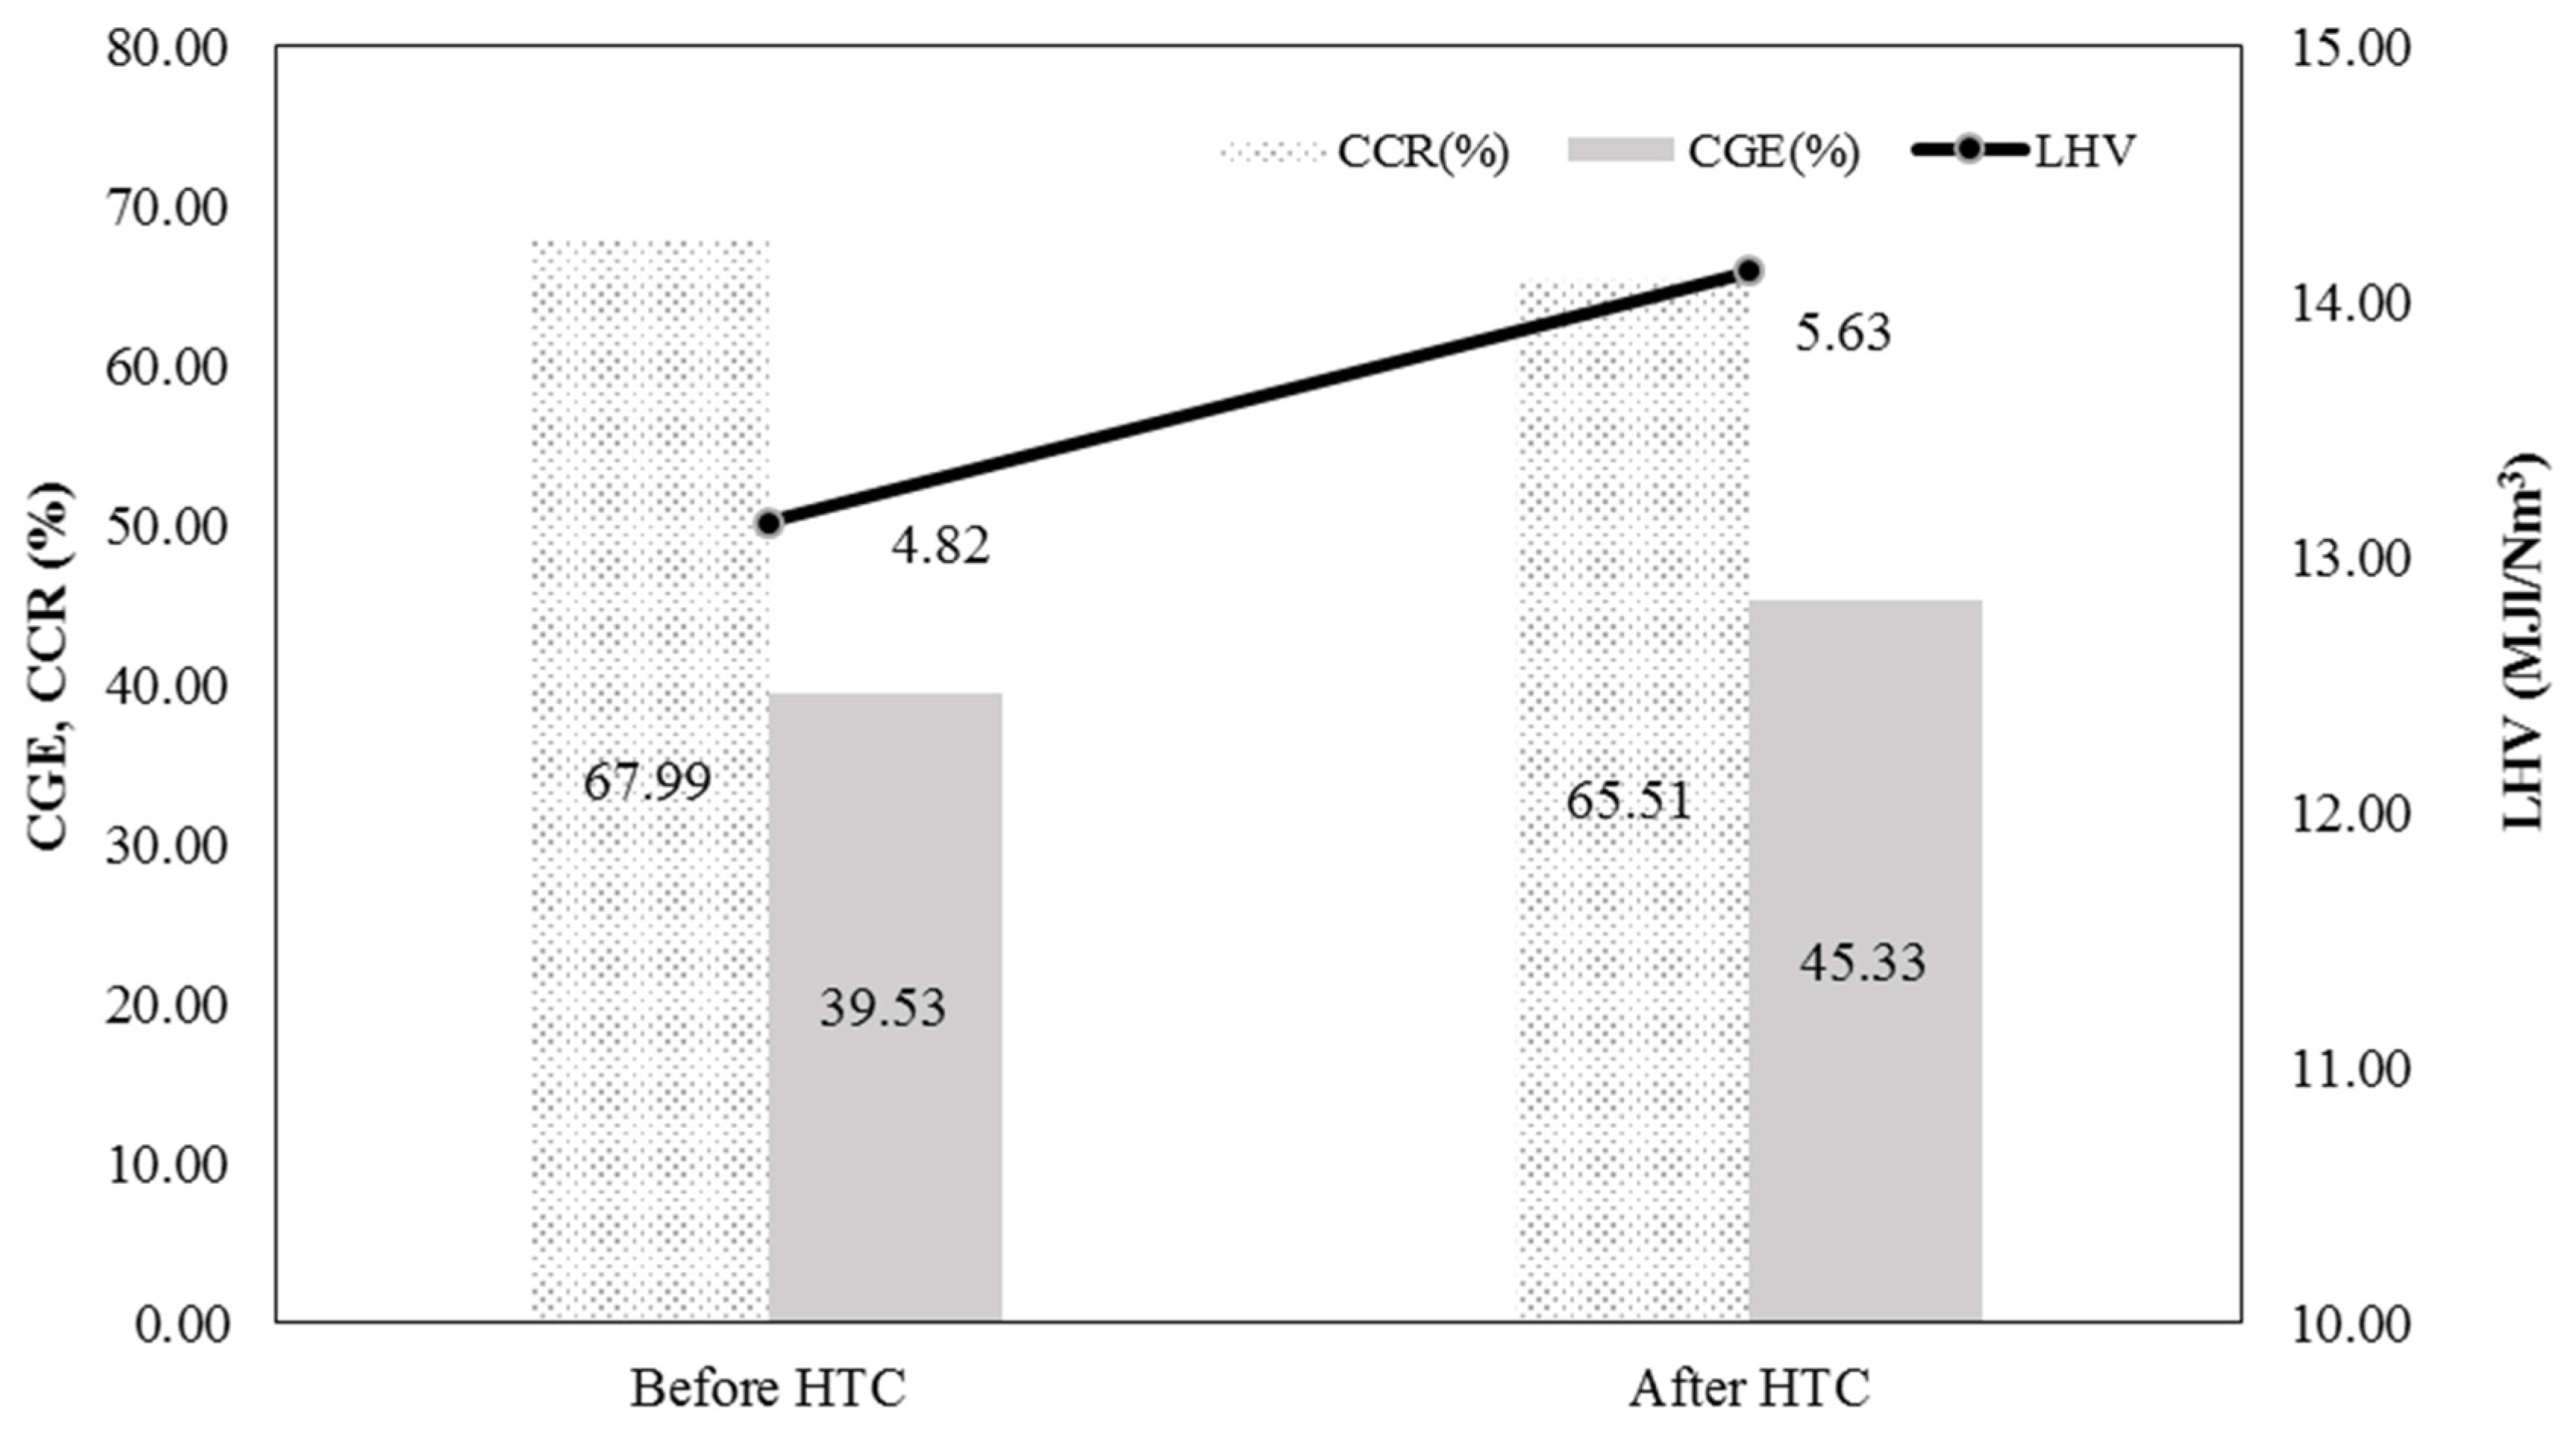
Figure 10 shows the results of different gasification efficiency parameters. The gas yield for raw sludge cake was slightly higher compared to hydrothermally treated sludge. For raw sludge cake, gas yield was 1.76 m3/kg, whereas, for hydrothermally treated sludge, the gas yield was 1.74 m3/kg. The value of ηCCR was 67.99% for raw sludge cake and 65.51% for hydrothermally treated sludge, which indicates a higher ηCCR for raw sludge cake. After HTC, it seems that the amount of gas was reduced due to high ash content. In the case of ηCCR, the composition of CO2 and hydrocarbons was relatively low and, thus, the ηCCR tended to decrease. However, the value of ηCGE was 39.53% for raw sludge cake and 45.33% for sludge after HTC. This result indicates that the sludge syngas LHV after HTC was higher than that of raw sludge cake and, thus, was higher in terms of energy recovery. Seggiani et al. reported gas compositions with similar data values. However, their value for sewage sludge CGE was 28.9% and LHVgas was 3.37 MJ/Nm3. The reason why this experiment’s values were lower is because the amount of volatile components and the heating value were higher in the feedstock [49].

3.2.2. Gas Pollutant and Tar Characteristics

Generally, the product gas generated in the gasification process contains gaseous contaminants such as HCl, NH3, and HCN. These materials need to be refined to limit the concentrations required by each process to link methanol synthesis processes, gas engine generation, and gas turbines. For the raw sludge cake gasification process, the HCl concentration was 15.36 ppm, the NH3 concentration was 26.90 ppm, and the HCN concentration was 13.67 ppm. For the hydrothermally treated sludge gasification process, the concentration of HCl was 3.50 ppm, the concentration of NH3 was 19.50 ppm, and the concentration of HCN was 5.08 ppm. Compared to the raw sludge cake, it can be seen that the amount of gas pollutants was significantly reduced in the hydrothermally treated sludge gasification process. Because the nitrogen, sulfur, and chlorine components of the raw sludge cake were reduced by HTC, this eventually helped to significantly reduce the gaseous contaminants.
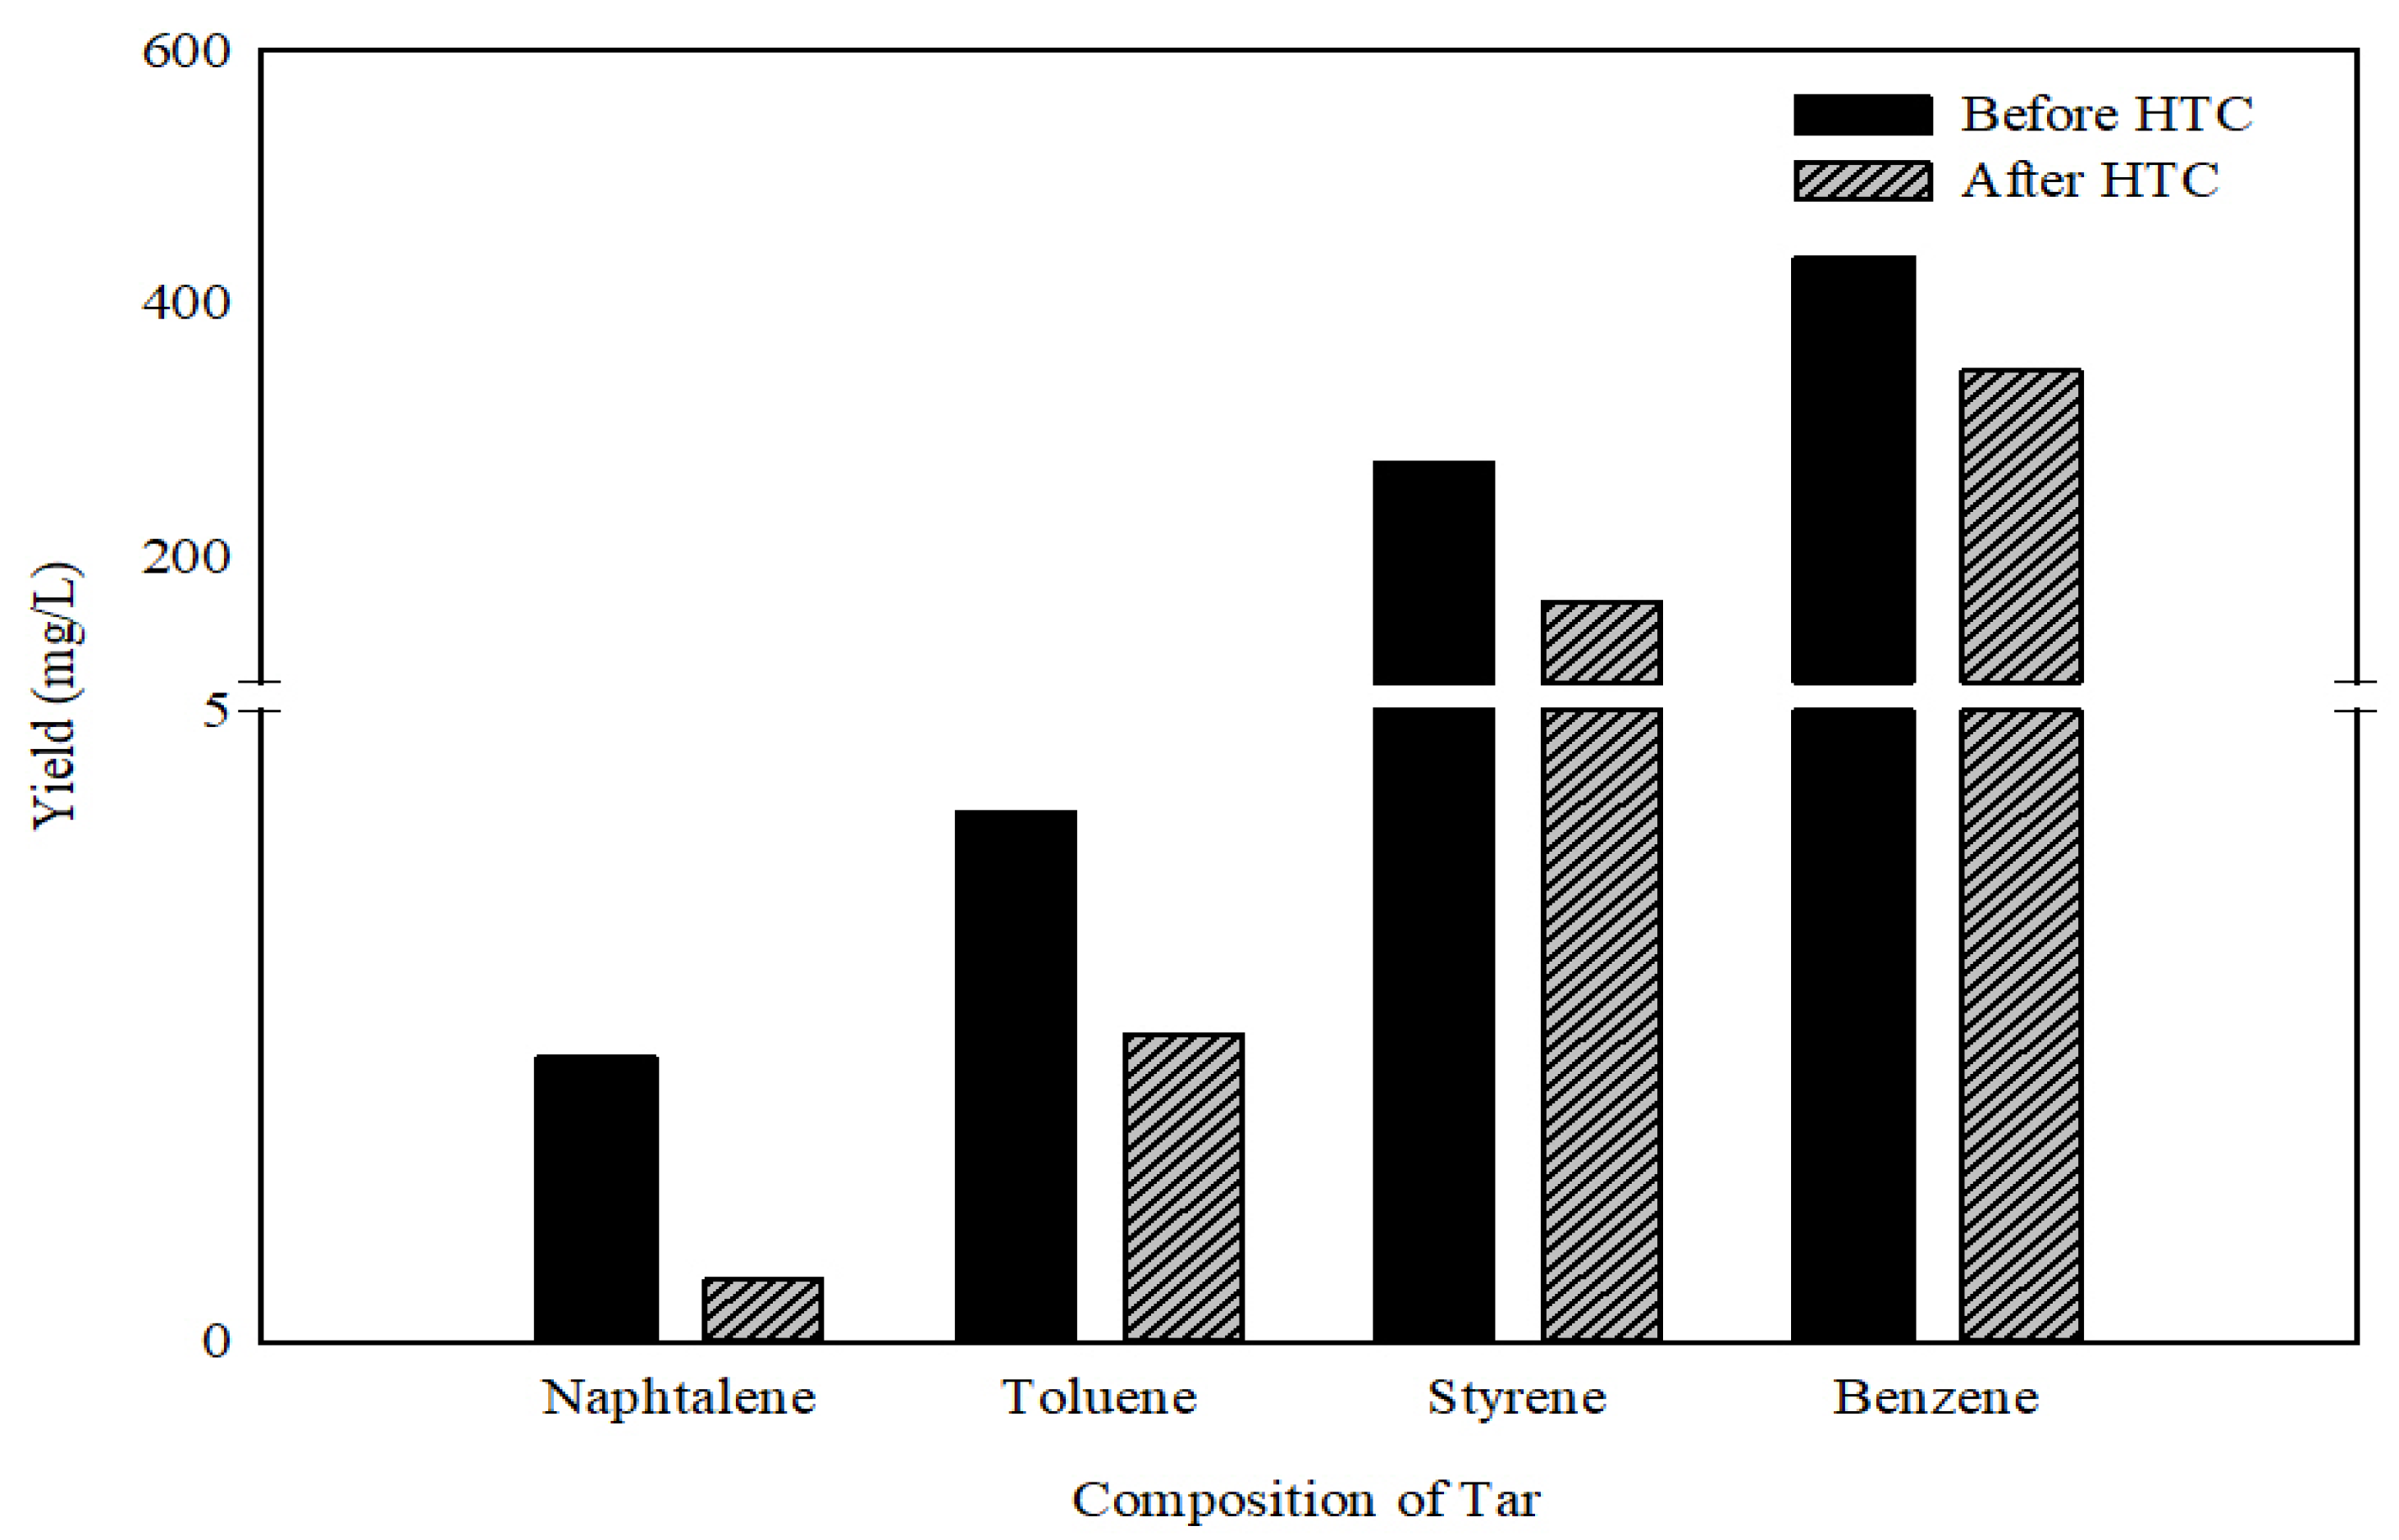
Tar is a substance that condenses in a region (at the rear end) where the temperature is low due to gasification, and it prevents the flow of gas or blocks the gasification process. Figure 11 illustrates the results of tar qualitative analysis. Benzene, toluene, styrene, and naphthalene species were found in the tar. In this experiment, the amount of tar generated can be seen to decrease for hydrothermally treated sludge as the high-molecular-weight material converted into low-molecular-weight material due to the hydrothermal reaction. Compared to raw sludge cake gasification, the amount of benzene decreased from 436 ppm to 347 ppm (by 20%), styrene decreased from 273 ppm to 164 ppm, toluene decreased from 4.19 ppm to 2.43 ppm, and naphthalene decreased from 2.25 to 0.49 ppm for hydrothermally treated sludge.

4. Conclusions

In this study, hydrothermal carbonization and gasification technologies were applied as a combined process for high-efficiency energy production (not as a single technology). Available reports on sewage sludge treatments showed segregated treatment process only. To the best of our knowledge, this is the first time that a combined HTC and gasification technology was applied to reduce contaminant and moisture contents in natural conditions. Another key aspect of this research was a detailed study on tar, which is one of the greatest concerns in the gasification process. The major outcomes from this study are described below.
In the case of the sludge cake undergoing HTC, after the hydrothermal treatment, the caloric value of the treated sewage sludge cake increased by 10% and the moisture content removed was 20 wt.%. In addition, the carbon content increased with increasing temperature, and the remaining components showed a decreasing tendency, as the carbon content increased. The results of HTC further depicted that this process more hygienic, environmentally friendly, and economical compared to the conventional treatment of sewage sludge cake, as no worm production takes place during this process and odor generation is relatively low. The gasification experimentation results showed that, compared to raw sludge cake, hydrothermally treated sewage sludge cake had higher syngas yield with a high content of CO, H2, and CH4, although the dry gas yield and ηCCR showed similar values. However, gaseous contaminants and tar generation, which plays a crucial role in the gasification process, were less compared to the raw sludge cake gasification process, since the N, S, and Cl components, which are the pollutant precursors, were reduced in the HTC method. In summary, the moisture content in the hydrothermally treated sludge cake was reduced and the amount of heat generated during the process helped to improve the quality of the sewage sludge cake. However, since the value of moisture and ash is higher than that of solid fuel, it is necessary to provide a reasonable standard by mixing it with low-moisture and low-ash biomass, such as sawdust. The HTC method produced lower tar and gaseous contaminants that can cause operational problems when the gasification technology is applied as HTC. If the technology is implemented in the future, the sewage sludge cake can be used as a solid fuel for energy recovery without a separate drying device.

Author Contributions

All authors contributed substantially to the work reported. The project was designed by S.Y.L. Experimentation was done by S.Y.L., Y.O.J. and S.W.P. The initial manuscript was prepared by S.Y.L. and M.T.A. The manuscript was reviewed and edited by S.Y.L., M.T.A., Y.-C.S. and H.S.C. The project was supervised by Y.-C.S. and H.S.C. All authors were equally responsible for finalizing the manuscript for submission. All authors have read and agreed to the published version of the manuscript.

Funding

This work was supported by the Korea Institute of Energy technology Evaluation and Planning (KETEP) and the Ministry of Trade, Industry, and Energy (MOTIE) of the Republic of Korea (No.20184030202240; 20173010092430).

Conflicts of Interest

The authors declare no conflicts of interest.

Nomenclature

ASTMAmerican Society for Testing and Materials
BTXBenzene, toluene, and xylene
ηCCRCarbon conversion ratio
ηCGECold gas efficiency
CSTCold solvent trapping
DGMDry gas meter
FCFixed carbon
FTIRFourier-transform infrared spectroscopy
HCHydro-char
HClHydrochloric acid
HCNHydrogen cyanide
HHVHigher heating value
HTCHydrothermal carbonization
IPAIsopropyl alcohol
ID FANInduced draft fan
ICIon chromatography
LHVLower heating value
LHVgasLower heating value of product gas
NH3Ammonia
MCMoisture content
PAHsPolycyclic aromatic hydrocarbons
PCBPolychlorinated biphenyl
TCThermocouple
VMVolatile matter
XOCsXenobiotic organic compounds
YgasYield of product gas

References

  1. Kim, D.; Park, J.; Lee, J.; Lee, M. The Case Study on Performance Measurement Weighting for Efficient Value Engineering Study of Sewage Treatment Facliity. Korean J. Constr. Eng. Manag. 2016, 17, 40–47. [Google Scholar] [CrossRef]
  2. Capodaglio, A.G.; Callegari, A. Feedstock and process influence on biodiesel produced from waste sewage sludge. J. Environ. Manag. 2018, 216, 176–182. [Google Scholar] [CrossRef] [PubMed]
  3. Samolada, M.; Zabaniotou, A. Comparative assessment of municipal sewage sludge incineration, gasification and pyrolysis for a sustainable sludge-to-energy management in Greece. Waste Manag. 2014, 34, 411–420. [Google Scholar] [CrossRef]
  4. Dinko, D.; Paolo, B.; Zeljko, J. Energy Recovery from Sewage Sludge: The Case Study of Croatia. Energies 2019, 12, 1927. [Google Scholar]
  5. Hong, S.G.B.; You, Y.J.; Lee, S.K.; Hong, T.K. Monthly Characteristics of Dewatered Sludge from Sewage Treatment Plant. J. Korean Soc. Environ. Anal. 2018, 21, 95–102. [Google Scholar]
  6. Park, J.-H.; Jin, M.-H.; Lee, Y.-J.; Song, G.-S.; Choi, J.W.; Lee, D.-W.; Choi, Y.-C.; Park, S.-J.; Song, K.H.; Kim, J.-G. Two-in-one fuel synthetic bioethanol-lignin from lignocellulose with sewage sludge and its air pollutants reduction effects. Energies 2019, 12, 3072. [Google Scholar] [CrossRef] [Green Version]
  7. Park, J.; Kim, J.-K.; Im, H.-S. A Review on Fuel Properties and Liquid Biofuels Production Technologies from Sewage Sludge. J. Korean Appl. Sci. Technol. 2018, 35, 540–559. [Google Scholar]
  8. Eriksson, E.; Christensen, N.; Schmidt, J.E.; Ledin, A. Potential priority pollutants in sewage sludge. Desalination 2008, 226, 371–388. [Google Scholar] [CrossRef]
  9. Rulkens, W. Sewage sludge as a biomass resource for the production of energy: Overview and assessment of the various options. Energy Fuels 2007, 22, 9–15. [Google Scholar] [CrossRef]
  10. Song, U.; Lee, E.J. Environmental and economical assessment of sewage sludge compost application on soil and plants in a landfill. Resour. Conserv. Recycl. 2010, 54, 1109–1116. [Google Scholar] [CrossRef]
  11. Giuliano, A.; Gioiella, F.; Sofia, D.; Lotrecchiano, N. A novel methodology and technology to promote the social acceptance of biomass power plants avoiding nimby syndrome. Chem. Eng. Trans. 2018, 67, 307–312. [Google Scholar]
  12. Chun, Y.N.; Kim, S.C.; Yoshikawa, K. Pyrolysis gasification of dried sewage sludge in a combined screw and rotary kiln gasifier. Appl. Energy 2011, 88, 1105–1112. [Google Scholar] [CrossRef]
  13. Alam, M.T.; Lee, J.-S.; Lee, S.-Y.; Bhatta, D.; Yoshikawa, K.; Seo, Y.-C. Low Chlorine Fuel Pellets Production from the Mixture of Hydrothermally Treated Hospital Solid Waste, Pyrolytic Plastic Waste Residue and Biomass. Energies 2019, 12, 4390. [Google Scholar] [CrossRef] [Green Version]
  14. Sun, X.; Sumida, H.; Yoshikawa, K.; Sumida, H.; Yoshikawa, K. Effects of hydrothermal process on the nutrient release of sewage sludge. Int. J. Waste Resour. 2013, 3, 124. [Google Scholar]
  15. Tuan, P.-A.; Mika, S.; Pirjo, I. Sewage sludge electro-dewatering treatment—A review. Dry. Technol. 2012, 30, 691–706. [Google Scholar] [CrossRef]
  16. He, C.; Giannis, A.; Wang, J.Y. Conversion of sewage sludge to clean solid fuel using hydrothermal carbonization: Hydrochar fuel characteristics and combustion behavior. Appl. Energy 2013, 111, 257–266. [Google Scholar] [CrossRef]
  17. Reza, M.T.; Wirth, B.; Lueder, U.; Werner, M. Behavior of selected hydrolyzed and dehydrated products during hydrothermal carbonization of biomass. Bioresour. Technol. 2014, 169, 352–361. [Google Scholar] [CrossRef]
  18. Escala, M.; Zumbuhl, T.; Koller, C.; Junge, R.; Krebs, R. Hydrothermal Carbonization as an Energy-Efficient Alternative to Established Drying Technologies for Sewage Sludge: A Feasibility Study on a Laboratory Scale. Energy Fuels 2013, 27, 454–460. [Google Scholar] [CrossRef]
  19. Da Silva, A.R.G.; Giuliano, A.; Errico, M.; Rong, B.G.; Barletta, D. Economic value and environmental impact analysis of lignocellulosic ethanol production: Assessment of different pretreatment processes. Clean Technol. Environ. Policy 2019, 21, 637–654. [Google Scholar] [CrossRef]
  20. Seo, Y.-C.; Alam, M.T.; Yang, W.-S. Gasification of Municipal Solid Waste. Gasif. Low-Grade Feedstock 2018. [Google Scholar]
  21. Giuliano, A.; Catizzone, E.; Barisano, D.; Nanna, F.; Villone, A.; Bari, I.D.; Cornacchia, G.; Braccio, G. Towards Methanol Economy: A Techno-environmental Assessment for a Bio-methanol OFMSW/Biomass/Carbon Capture-based Integrated Plant. Int. J. Heat Technol. 2019, 37, 665–674. [Google Scholar] [CrossRef]
  22. Giuliano, A.; Poletto, M.; Barletta, D. Pure hydrogen co-production by membrane technology in an IGCC power plant with carbon capture. Int. J. Hydrog. Energy 2018, 43, 19279–19292. [Google Scholar] [CrossRef]
  23. Park, S.-W.; Lee, J.-S.; Yang, W.-S.; Alam, M.T.; Seo, Y.-C.; Lee, S.-Y. Gasification characteristics of biomass for tar removal by secondary oxidant injection. J. Mater. Cycles Waste Manag. 2018, 20, 823–831. [Google Scholar] [CrossRef]
  24. Rezaiyan, J.; Cheremisinoff, N.P. Gasification Technologies: A Primer for Engineers and Scientists; CRC Press: Boca Raton, FL, USA, 2005. [Google Scholar]
  25. Park, S.-W.; Lee, J.-S.; Yang, W.-S.; Kang, J.-J.; Alam, M.T.; Seo, Y.-C.; Oh, J.-H.; Gu, J.-H.; Chennamaneni, S.; Kandasamy, V. Emission Characteristics of Gaseous Pollutants from Pilot-Scale SRF Gasification Process. Waste Manag. Resour. Effic. 2019, 51–58. [Google Scholar]
  26. Park, S.-W.; Seo, Y.-C.; Lee, J.-S.; Yang, W.-S.; Alam, M.-T.; Lee, S.-Y. A Study on Application of Gasification and Emission Characteristics of Gaseous Pollutants for Producing Syngas Using High Calorific Waste. J. Korea Soc. Waste Manag. 2017, 34, 234–244. [Google Scholar] [CrossRef]
  27. Bourtsalas, A.T.; Seo, Y.; Alam, M.T.; Seo, Y.-C. The status of waste management and waste to energy for district heating in South Korea. Waste Manag. 2019, 85, 304–316. [Google Scholar] [CrossRef]
  28. Midilli, A.; Dogru, M.; Howarth, C.R.; Ling, M.J.; Ayhan, T. Combustible gas production from sewage sludge with a downdraft gasifier. Energy Convers. Manag. 2001, 42, 157–172. [Google Scholar] [CrossRef]
  29. Uemura, Y.; Sellappah, V.; Trinh, T.H.; Hassan, S.; Tanoue, K.-I. Torrefaction of empty fruit bunches under biomass combustion gas atmosphere. Bioresour. Technol. 2017, 243, 107–117. [Google Scholar] [CrossRef]
  30. Asses, N.; Farhat, A.; Cherif, S.; Hamdi, M.; Bouallagui, H. Comparative study of sewage sludge co-composting with olive mill wastes or green residues: Process monitoring and agriculture value of the resulting composts. Process. Saf. Environ. Prot. 2018, 114, 25–35. [Google Scholar] [CrossRef]
  31. Park, S.-W.; Lee, J.; Yang, W.; Kang, J.; Sung, J.; Alam, M.T.; Seo, Y.; Rao, C.S.; Saravanakumar, A.; Kumar, K.V. For Waste to Energy, Assessment of Fluff Type Solid Refuse Fuel by Thermal Characteristics Analyses. Procedia Environ. Sci. 2016, 35, 498–505. [Google Scholar] [CrossRef]
  32. Yang, W.-S.; Lee, J.-S.; Park, S.-W.; Kang, J.-J.; Alam, M.T.; Seo, Y.-C. Gasification applicability study of polyurethane solid refuse fuel fabricated from electric waste by measuring syngas and nitrogenous pollutant gases. J. Mater. Cycles Waste Manag. 2016, 18, 509–516. [Google Scholar] [CrossRef]
  33. Zhao, P.; Shen, Y.; Ge, S.; Chen, Z.; Yoshikawa, K. Clean solid biofuel production from high moisture content waste biomass employing hydrothermal treatment. Appl. Energy 2014, 131, 345–367. [Google Scholar] [CrossRef] [Green Version]
  34. Kang, J.; Lee, J.; Yang, W.; Park, S.; Alam, M.T.; Back, S.; Choi, H.; Seo, Y.; Yun, Y.; Gu, J. A study on environmental assessment of residue from gasification of polyurethane waste in e-waste recycling process. Procedia Environ. Sci. 2016, 35, 639–642. [Google Scholar] [CrossRef]
  35. Kuo, P.-C.; Wu, W.; Chen, W.-H. Gasification performances of raw and torrefied biomass in a downdraft fixed bed gasifier using thermodynamic analysis. Fuel 2014, 117, 1231–1241. [Google Scholar] [CrossRef]
  36. Ma, Z.; Ye, J.; Zhao, C.; Zhang, Q. Gasification of rice husk in a downdraft gasifier: The effect of equivalence ratio on the gasification performance, properties, and utilization analysis of byproducts of char and tar. Bioresources 2015, 10, 2888–2902. [Google Scholar] [CrossRef] [Green Version]
  37. Ma, J.; Chen, M.; Yang, T.; Liu, Z.; Jiao, W.; Li, D.; Gai, C. Gasification performance of the hydrochar derived from co-hydrothermal carbonization of sewage sludge and sawdust. Energy 2019, 173, 732–739. [Google Scholar] [CrossRef]
  38. Zainal, Z.; Rifau, A.; Quadir, G.; Seetharamu, K. Experimental investigation of a downdraft biomass gasifier. Biomass Bioenergy 2002, 23, 283–289. [Google Scholar] [CrossRef]
  39. Tamosiunas, A.; Gimzauskaite, D.; Aikas, M.; Uscila, R.; Praspaliauskas, M.; Eimontas, J. Gasification of waste cooking oil to synagas by thermal arc plasma. Energies 2019, 12, 2612. [Google Scholar] [CrossRef] [Green Version]
  40. Meng, Q.M.; Chen, X.P.; Zhuang, Y.M.; Liang, C. Effect of temperature on controlled air oxidation of plastic and biomass in a packed-bed reactor. Chem. Eng. Technol. 2013, 36, 220–227. [Google Scholar] [CrossRef]
  41. Gai, C.; Chen, M.; Liu, T.; Peng, N.; Liu, Z. Gasification characteristics of hydrochar and pyrochar derived from sewage sludge. Energy 2016, 113, 957–965. [Google Scholar] [CrossRef]
  42. Park, S.-W.; Lee, J.-S.; Yang, W.-S.; Alam, M.T.; Seo, Y.-C. A Comparative Study of the Gasification of Solid Refuse Fuel in Downdraft Fixed Bed and Bubbling Fluidized Bed Reactors. Waste Biomass Valorization 2018, 1–12. [Google Scholar] [CrossRef]
  43. Shin, M.-S.; Lee, H.-D.; Jeon, Y.-W. Evaluation of drying performances by hydrothermal reaction of sewage sludge and food wastes. J. Korea Org. Resour. Recycl. Assoc. 2017, 25, 47–55. [Google Scholar]
  44. Fonts, I.; Azuara, M.; Gea, G.; Murillo, M. Study of the pyrolysis liquids obtained from different sewage sludge. J. Anal. Appl. Pyrolysis 2009, 85, 184–191. [Google Scholar] [CrossRef]
  45. Jouraiphy, A.; Amir, S.; El Gharous, M.; Revel, J.-C.; Hafidi, M. Chemical and spectroscopic analysis of organic matter transformation during composting of sewage sludge and green plant waste. Int. Biodeterior. Biodegrad. 2005, 56, 101–108. [Google Scholar] [CrossRef]
  46. ZHANG, J.-H.; LIN, Q.-M.; ZHAO, X.-R. The hydrochar characters of municipal sewage sludge under different hydrothermal temperatures and durations. J. Integr. Agric. 2014, 13, 471–482. [Google Scholar] [CrossRef]
  47. Wang, L.; Li, A. Hydrothermal treatment coupled with mechanical expression at increased temperature for excess sludge dewatering: The dewatering performance and the characteristics of products. Water Res. 2015, 68, 291–303. [Google Scholar] [CrossRef]
  48. Feng, Y.; Yu, T.; Ma, K.; Xu, G.; Hu, Y.; Chen, D. Effect of hydrothermal temperature on the steam gasification performance of sewage sludge: Syngas quality and tar formation. Energy Fuels 2018, 32, 6834–6838. [Google Scholar] [CrossRef]
  49. Seggiani, M.; Vitolo, S.; Puccini, M.; Bellini, A. Cogasification of sewage sludge in an updraft gasifier. Fuel 2012, 93, 486–491. [Google Scholar] [CrossRef]
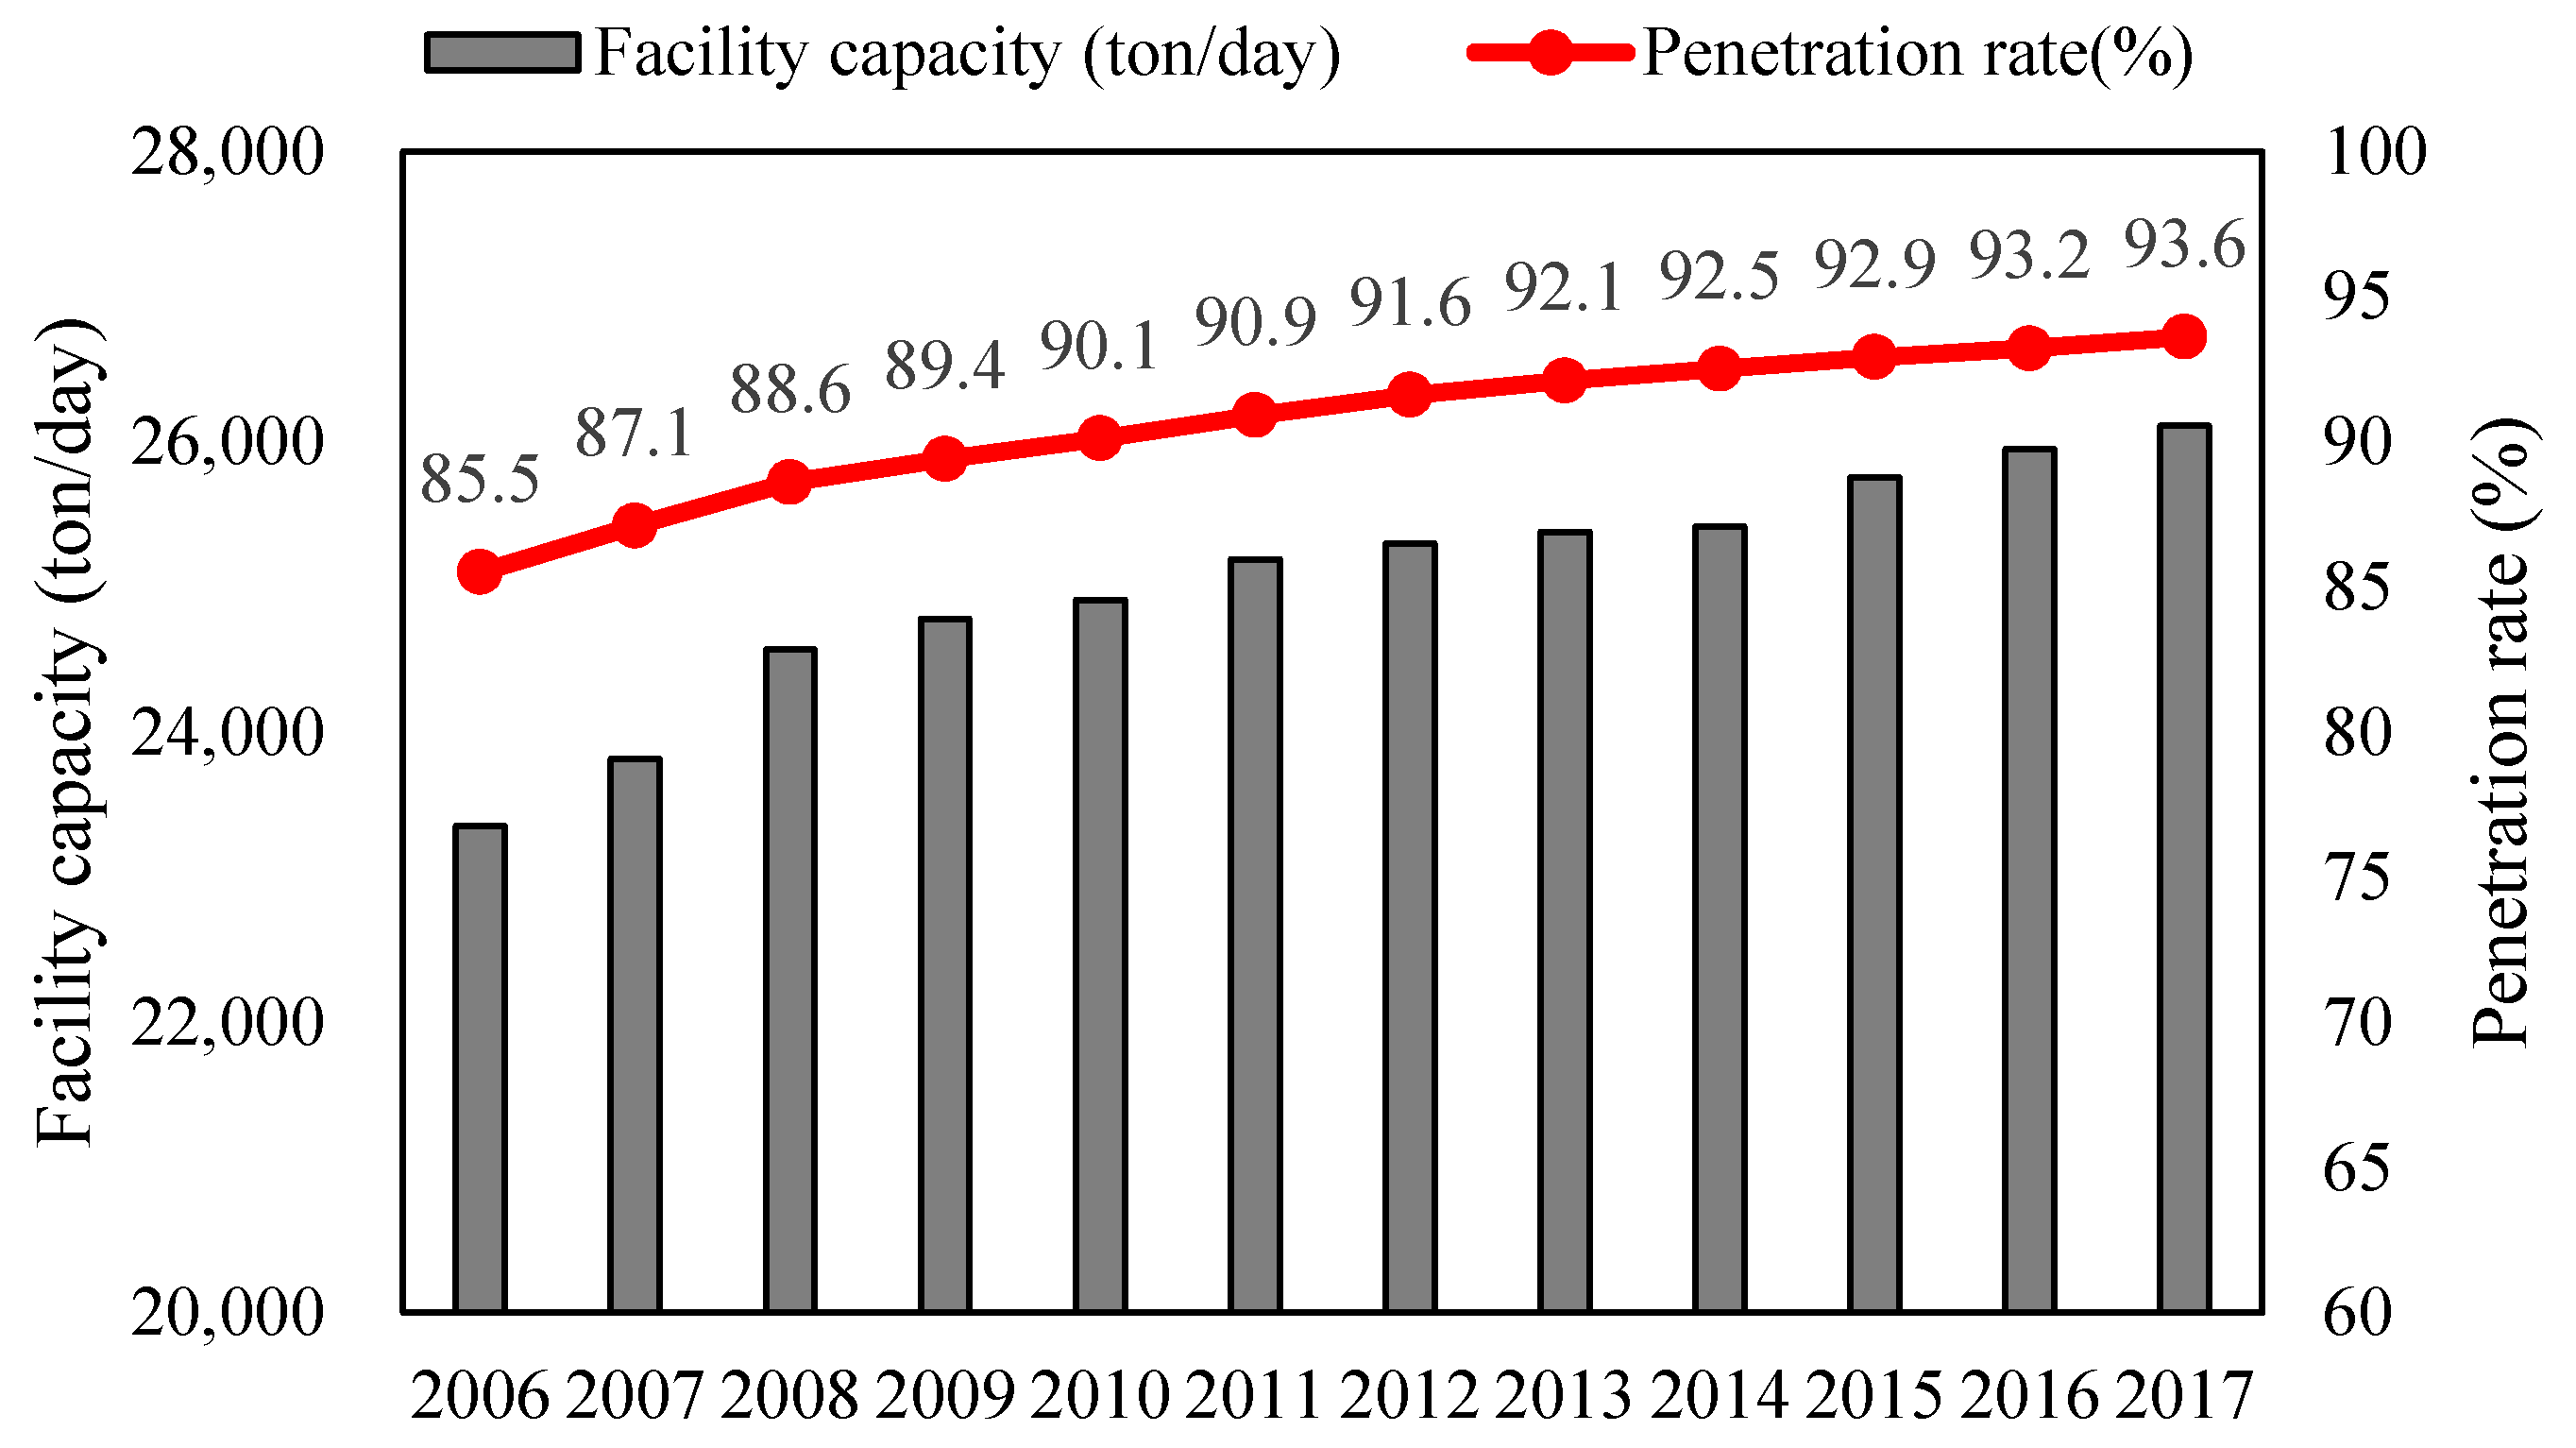
Figure 1. Facility capacity and penetration of sewage sludge in Korea.
Energies 13 01442 g001
Figure 2. Sewage sludge disposal methods and throughputs.
Energies 13 01442 g002
Figure 3. Hydrothermal carbonization processes.
Energies 13 01442 g003
Figure 4. Schematic diagram of hydrothermal reactor. 1—motor; 2—water line; 3—nitrogen; 4—heating jacket; 5—stirrer; 6—reaction zone; 7—pressure gauge; 8—temperature sensor; 9—steam condenser; 10—decompression valves.
Energies 13 01442 g004
Figure 5. Schematic diagram of gasification process: 1—air supply unit; 2—mass flow controller; 3—feeder; 4—feeding pipe; 5—furnace; 6—cyclone; 7—residue box; 8—scrubber; 9—water circulation; 10—fabric filter; 11—activated carbon; 12—filtering system; 13—gas pollutant sampling; 14—gas vacuum pump; 15—dry gas meter; 16—micro-GC.
Energies 13 01442 g005
Figure 6. Sampling train of tar.
Energies 13 01442 g006
Figure 7. Moisture content of sewage sludge cake before and after hydrothermal treatment: (a) moisture weight ratio; (b) derivative moisture weight.
Energies 13 01442 g007
Figure 8. FTIR spectra of raw sludge cake and hydrothermally treated sludge cake.
Energies 13 01442 g008
Figure 9. Composition of product gas before and after hydrothermal treatment.
Energies 13 01442 g009
Figure 10. Carbon conversion ratio (CCR) and cold gas efficiency (CGE) of raw sludge cake and hydrothermally treated sludge cake.
Energies 13 01442 g010
Figure 11. Tar components before and after hydrothermal treatment.
Energies 13 01442 g011
Table 1. Typical gasification reactions [22].
Reaction TypeChemical Reaction
Carbon reactions
R1C + CO2 ↔ 2CO +172.0 kJ/mol
R2C + H2O ↔ CO + H2 +131.0 kJ/mol
R3C + 2H2 ↔ CH4 −74.8 kJ/mol
R4C + 0.5O2 ↔ CO −11.0 kJ/mol
Oxidation reactions
R5C + O2 ↔ CO2 −394.0 kJ/mol
R6CO + 0.5O2 ↔ CO2 −284.0 kJ/mol
R7CH4 + 2O2 ↔ CO2 + 2H2O −803.0 kJ/mol
R8H2 + 0.5O2 ↔ H2O −242.0 kJ/mol
Shift reaction
R9CO + H2O ↔ CO2 + H2 −41.2 kJ/mol
Methanation reactions
R102CO + 2H2 ↔ CH4 + CO −247.0 kJ/mol
R11CO + 3H2 ↔ CH4 + H2O −206.0 kJ/mol
R14CO2 + 4H2 ↔ CH4 + 2H2O −165.0 kJ/mol
Steam-reforming reactions
R12CH4 + H2O ↔ CO +3H2 +206.0 kJ/mol
R13CH4 + 0.5O2 ↔ CO + 2H2 −36.0 kJ/mol
Table 2. Sludge cake characteristics analysis methodology.
AnalysisTargetEquipmentMethod
Elemental analysisC, H, O, N, SEA 1112 - Thermo Fisher Scientific
(Waltham, Massachusetts, USA)
EA 1110 - CE Instrument
(Wigan, Greater Manchester, England)
ASTM D 5373
ASTM D 7359-08
Proximate analysisMoisture
volatiles,
fixed carbon, ash
TGA-701 - LECO
(St. Joseph, Michigan, USA)
ASTM D 3172
Heating value analysisHigher heating valueAC-600 - LECO
(St. Joseph, Michigan, USA)
ASTM D 4809
Table 3. Characteristics of sewage sludge cake (dry basis).
AnalysisComponentSample
Sludge CakeHTC-180HTC-200HTC-220
Proximate
(wt.%)
FC7.548.308.678.96
VC70.3068.6066.3265.12
AC22.1623.1025.0125.92
Elementary
(wt.%)
C42.5443.9145.0345.58
H7.627.347.006.68
N3.892.592.011.84
S0.360.200.170.15
O23.4322.8620.7819.83
Heating value (MJ/kg)HHV21.3321.4821.7421.64
LHV19.5919.8020.1520.12