Article

The Integrated Energy Consumption Index for Energy Biomass Grinding Technology Assessment

by
Weronika Kruszelnicka
*,
Robert Kasner
,
Patrycja Bałdowska-Witos
,
Józef Flizikowski
and
Andrzej Tomporowski
Faculty of Mechanical Engineering, University of Science and Technology in Bydgoszcz, Al. Prof. S. Kaliskiego 7, 85-796 Bydgoszcz, Poland
*
Author to whom correspondence should be addressed.
Energies 2020, 13(6), 1417; https://doi.org/10.3390/en13061417
Submission received: 2 March 2020 / Revised: 9 March 2020 / Accepted: 15 March 2020 / Published: 18 March 2020
(This article belongs to the Special Issue Alternative Energy Sources)

Abstract

:
The assessment of engineering objects in terms of energy consumption is an important part of sustainable development. Many materials, including those from the energy sector, need to undergo earlier processing, e.g., grinding. Grinding processes still demand a significant amount of energy, whereas current energy assessment methods do not take into account important parameters of the process, which makes it difficult to choose their optimal values. The study presents the analysis, testing, and assessment of mechanical engineering systems in terms of the energy consumption involved in the grinding of biomass intended for energy production purposes. A testing methodology was developed to improve the parameters of multi-disc grinding, including the reduction of energy consumption, power input, product quality improvement, and process efficiency. An original model of integrated energy consumption was developed. Tests were carried out on a five-disc grinder for five programs to assess the programmable angular speeds of the grinder discs. Output values, including specific energy demand, fragmentation degree, and integrated energy consumption, were assigned to each testing program. The test results were subjected to statistical analysis. Based on the authors’ own research, it was found that the angular speed of the discs and, consequently, the linear speed of the grinding blades, have a significant influence on the values of the integrated energy consumption of the preliminary process.

Graphical Abstract

1. Introduction

The simplest and the most common method of biomass utilization is its combustion, e.g., in the boilers of a power station [1]. There are also other forms of energy production that are increasing in popularity, including: gasification, biomethane production, esterification, the acquisition of bioethanol, etc. [2,3]. Depending on the energy purpose and type of biomass, the comminution process will vary—in particular, in terms of the desired final dimension of the comminution product [4,5]. In the case of anaerobic digestion, biomass is comminuted to several millimeter fractions [4]. Pellets are usually made of fibrous biomass ground to 2–4 mm or smaller, depending on the briquetting machine design, while briquettes, from particles smaller than 10 mm [6]. In the production of biofuels, in turn, biomass particles should be in the range of 100–500 μm, and for gasification and direct combustion processes, below 100 μm [4]. Previous research has shown that the smaller the biomass particles are used for energy purposes, the greater the efficiency and easier control of biomass thermochemical transformation processes [5].
Acquiring energy from biomass requires its earlier preparation: drying, grinding, palletizing, etc. [7]. These procedures require certain energy inputs (costs) which significantly decrease the energy and environmental balance in the entire lifecycle of the energy material (wood, grain biomass, etc.) [8,9,10,11,12,13]. According to the idea of sustainable development concerning the design of systems, devices, and processes, in three areas—the environment, society, and economy—the biomass processing lines should be characterized by the lowest possible energy consumption and environmental impact [14,15]. It also aims to improve the competitiveness of biomass fuels in relation to conventional fossil fuels [16,17].
Before being used for energy purposes, energy media need to be properly prepared, e.g., their dimensions need to be reduced by means of grinding [2]. Roller, drum, ball, hammer, and disc mills are used to grind granular biomaterials (biomass grains) [7,18]. Tests have shown that the best relations between product quality, yield, and grinding energy consumption occur for hammer and disc mills [2,7]. The quality of the grinding product is most often determined by the grinding degree, which is defined as the ratio of the characteristic dimensions of the particles before and after size reduction [19,20]. Other indicators, e.g., bulk density, grain size distribution, specific surface area, energy value, and their relationship with the comminution process, are also important from the point of view of the final product quality [4,21,22,23,24]. Previous studies conducted by other researchers have shown that the reduction of biomass particles’ sizes result in improved flowability and movement properties; the material moves better, e.g., on feeders [25]. Grinding processes also increase the bulk density of the product, which allows, among others, to reduce storage space [5]. In the case of biomass, there was also a trend of increasing energy demand along with an increase in the particle size of the grinding input material [26]. It has also been shown that the energy demand increases as the particle size of the comminution product decreases; i.e., the smaller the particles we want to achieve, the greater the energy input [5,27]. The conducted analyzes have shown that the smaller the particles after comminution, the easier they are conducted; e.g., anaerobic digestion processes and the efficiency of biomass conversion into biofuels increases, due to the increase in the specific surface area of the particles in grinding processes [4,28,29].
Current legislation imposes requirements which are supposed to reduce the energy consumption of technological lines, including energy material grinding. Unfortunately, currently used grinding machines and devices consume much energy and are inefficient [2,30,31,32], which motivates researchers to take up research in order to reduce the energy consumption of grinders and mills. Thus, upon implementing innovative structural solutions, a multi-criteria analysis needs to be used. It should take into consideration such parameters as efficiency, energy consumption, fragmentation degree, and power consumption. The design of structural solutions should meet the criteria of sustainable development. Criteria to be used for the structure assessment should be matched in such a way that the choice of an optimal solution is possible.
Biomaterial grinding (e.g., granular biomass) is accompanied by many phenomena caused by the impact of the material, the machine elements, the internal structure of biomaterials, and their strength parameters [33]. Strength properties vary depending on the material and depend on, among others, internal structure, humidity, and biological features [34], and in the case of biomass, a significant diversification of properties is observed even within one species [35,36,37]. The increases in strength and hardness increase the energy demand for fragmentation [38,39,40]. The increase in the humidity of the input material also contributes to the increase in energy demand during the size reduction process. The internal structure of biomass grains is not without significance—materials with greater glassiness are characterized by increased energy demands in size reduction processes; however, the fragmentation efficiency is greater, resulting in smaller particles [36,38,41,42]. Wiercioch et al. [35] showed proportionality of the grinding energy demand and mass of material. Other studies, conducted for single grains, have shown that the amount of grinding energy demand increases as grain thickness increases [37]. Thus, the criteria for the assessment of the structure and process need to be formulated. They must be adjusted both to the material and the grinding machine, as well as to the specificity of the company. Hence, the identification of variables and factors affecting the process assessment in terms of energy consumption, efficiency, and product quality seems to be of key importance [7,31].
Research on energy-related aspects involved in grinding has been ongoing since the end of the 20th century. Since that time, many theories link energy consumption with product quality and the efficiency of the grinding process. These include the hypotheses of Rittinger, Kick, Holmes, Charles, Rebinder, Mielnikow, and Bond, as well as the statistical hypothesis. They, however, are based on certain simplifications regarding the similarity of particles and the failure to consider the forces of grinding. In addition, there are restrictions involved in their applicability [30,43,44,45,46]. Polish experiences in research on energy consumption include experiments conducted by: J. Flizikowski, Malewski, Tomporowski, Zawada, Brach, and Sidor [47,48,49,50,51,52,53,54,55], who have been involved in modeling the grinding process [56].
The literature provides but only a few studies, including a comprehensive energy assessment of grinding machines and devices with a focus on the process parameters. A number of studies indicate energy consumption and the degree of grinding as basic assessment criteria [57,58].
The criteria for energy assessment provided in the literature (Table 1) represent a machine-oriented approach to the grinding process. They can be considered to belong to the group of efficiency criteria proposed by M. Bielski [59], presenting the ratio of profits to expenditures [60]. Dependences (1)–(8) indicate the energy “productivity” of the process; that is, they define the amount of energy needed to grind the material unit (unit of mass, volume). The function of adaptation (Equation (9)) proposed by J. Flizikowski [49] views many grinding factors as a machine process and is designed for global assessment of the process in terms of biomass-processing for the needs of feeding animals. It combines the effects of material grinding—an increase in the processed grain assimilability by living organisms and the amount of energy used by the machine elements and power transmission system. Effectiveness understood in terms of the energy exchange efficiency (Equation (10)) has been discussed in paper [30].
A criterion of a unit demand for energy is often used as an energy measure (dependence (6)). Depending on the material properties and the required grain dimensions, energy demands can be: from 20 kWh·Mg−1 to 130 kWh·Mg−1 for rough and medium grinding and up to 800 kWh·Mg−1 for micro and nanogrinding.
For brittle materials such as glass, cement, and clinker, the energy required for very fine grinding is much lower than for polymer and biological fibrous materials. The energy demand for these materials is nearly two times higher, whereas the final particles are from 10 to 100 times larger. Hence, the grinding efficiency of fibrous materials is lower than that of brittle materials [61].
An insufficient number and quality of grinding-process descriptions, ineffective technological solutions, and unsatisfying attempts to improve grinding system efficiency means major problems remain unsolved, such as the high energy costs of grinding, poor yield, and insufficient quality of the product represented by granulometric parameters. These problems should be solved by monitoring and supervising grinding parameters such as linear speed, the angular speed of discs, energy consumption, power input, etc. In view of the above, taking up research on this subject can bring numerous benefits.
There is an urgent need to provide an explanation of the essence of engineering and the control of granular biomass quasi-shearing by means of a multi-hole grinding unit with a focus on the process of energy consumption.
Hence, the following research goals were established:
The development of a mathematical model of energy consumption and granular biomass grinding for the needs of the integrated design of multi-hole (disc) grinding units. Experimental determination of the impact of selected parameters of the multi-disc grinding process on the sustainable energy consumption of granular biomass.
Research problems were formulated in the form of questions in relation to the research goals established herein:
  • Will the development of an adequate mathematical model of energy consumption considering basic parameters of the process such as the yield, fineness degree, unit energy consumption, and power input enable the integrated design of the structure, disc parameters, and hole movement in shearing culvert discs?
  • What is the impact of deliberately changed characteristics and relations of the unit motion on the yield, fineness degree, power input, unit energy consumption, and integrated index of sustainable granular biomass grinding energy consumption in a multi-hole grinding unit?

2. Materials and Methods

2.1. Integrated Energy Consumption Index

The introduction of energy and pro-environment-based assessment into the construction–optimization process of the technology of energy biomass grinding leads to the creation of new, better structural and process solutions. In a sense, it is a driving force for biomass-processing competitiveness and innovativeness [66,67]. Paper [68] indicates that energy efficiency assessments make it possible to improve the grinder process motion parameters and indicates technologies which are the best for a given product. It has also been proven that the developed efficiency models can be used not only for process verification but also for verification of the whole structure of grinding, particularly the working unit.
Developing an adequate mathematical model and finding functional dependences between the variables are important elements of each assessment (structural-optimization efficiency) [69]. The first step should involve the identification of the assessed processes and subprocesses and the determination of criteria [68].
The assumption of the model of integrated energy consumption for grinding takes into account the most important grinding indexes, which are indirectly or directly connected with power and energy demand. First of all, the criteria for power consumption assessment, unambiguously characterizing the grinding device, were established. The following criteria were accepted as components of the model of integrated energy consumption, in accordance with the desired states of the grinding process [70,71]:
  • Yield of grinding KQr:
    KQr = Qr,
  • Power demand KP:
    KP = 1/Pr,
  • Unit energy demand KEj:
    KEj = 1/Ej,
  • Fragmentation degree Ki:
    Ki = i80,
    where Qr—yield of grinding, kg·h−1; Pr—average power consumption of grinding, kW; Ej—unit of energy consumption, kWh·kg−1; and i80—80% fragmentation degree.
The yield of grinding is indirectly related to the power and energy consumption of grinding. Increasing the yield is usually associated with an increase in the grinder dimensions and, subsequently, an increase in the power of the drive unit, which involves a change of energy parameters. In the machine conditions, grinding yield Qr can be determined on the basis of a dependence of grinding product mass change Δm in the intake hopper during the time of observation Δt [19]:
Qr = Δmt,
which can further be written:
Qr = dm/dt,
Q r   =   0 t   m   d t .
Power consumption for grinding changes in time, which is caused by an irregularity in the operation of the machine [72]. In the simplest way, it can be defined as a periodical occurrence of rises and falls in power consumption as a result of variable amounts of materials between the working elements, which causes momentary periods of the machine running idle during grinding (with no feed). In connection with this, the overall power consumption in time t Ptoti can be defined as [7,73]:
Ptoti = Pui + Pii,
where Pui—power consumption for the medium grinding in a given moment t, kW and Pii—power consumption of the idle gear in a given moment t, kW.
Then, the total grinding power consumption Pr in a certain time interval T is an average of the momentary power consumption, according to the equation:
Q r   =   Σ i   =   0 T   P t o t i / T .
Grinding processes are characterized by the parameters of the unit energy demand; therefore, they were accepted to be a component of the integrated energy consumption index model. Generally, a unit energy demand is defined as the amount of energy per mass unit of the material (volume) [2,7,20,63,64]. For the grinding machine unit, demand Ej is expressed as a ratio of average power consumed by the grinder Pr to yield Qr [19,63,73]:
Ej = Pr/Qr
The last criterion of the model of integrated energy consumption was accepted to be the fragmentation degree, being a determiner of the product quality and effectiveness of the grinding process [20,74]. Most generally, the fragmentation degree is defined as a ratio of the material mean dimensions before grinding to its mean dimensions after grinding [21,75]. So far, it has been proven that increasing the frequency of the machine element contact (by increasing the rotational, angular, and linear speeds of the grinding elements) and repetitions of grinding provides an output product with smaller dimensions—that is, with a higher fragmentation degree [72,76]. Unfortunately, it causes higher energy consumption [27,77,78]. The energy consumption model assumes a fragmentation degree of 80% i80, defined as [19]:
i80 = D80/d80
where D80—dimension of the sieve hole through which 80% of the feed material passes and d80—dimension of the sieve hole through which 80% of the grinding product passes.
The model of integrated energy consumption was constructed in the same way as the model of efficiency described in paper [68]. This made it possible to establish a quantitative relation between the most important grinding indexes in terms of energy consumption. Integrated energy consumption was described in the criteria-based approach proposed by J. Zawada in the following way [79]:
Ezint = KQr· KP · KEj · Ki
Bearing in mind dependences (11)–(14) and (22), integrated energy consumption depends, in direct proportion, on the yield and fragmentation degree and, in an inverse proportion, to the power consumption and unit energy demand. Assuming that the state to be desired is that in which Q→ ∞, i80→ ∞, Pr→ 0, and Ej→ 0, then Ezint→ ∞. In the sustainable approach, a better process will be the one with a higher integrated energy consumption index value (22).

2.2. Raw Materials

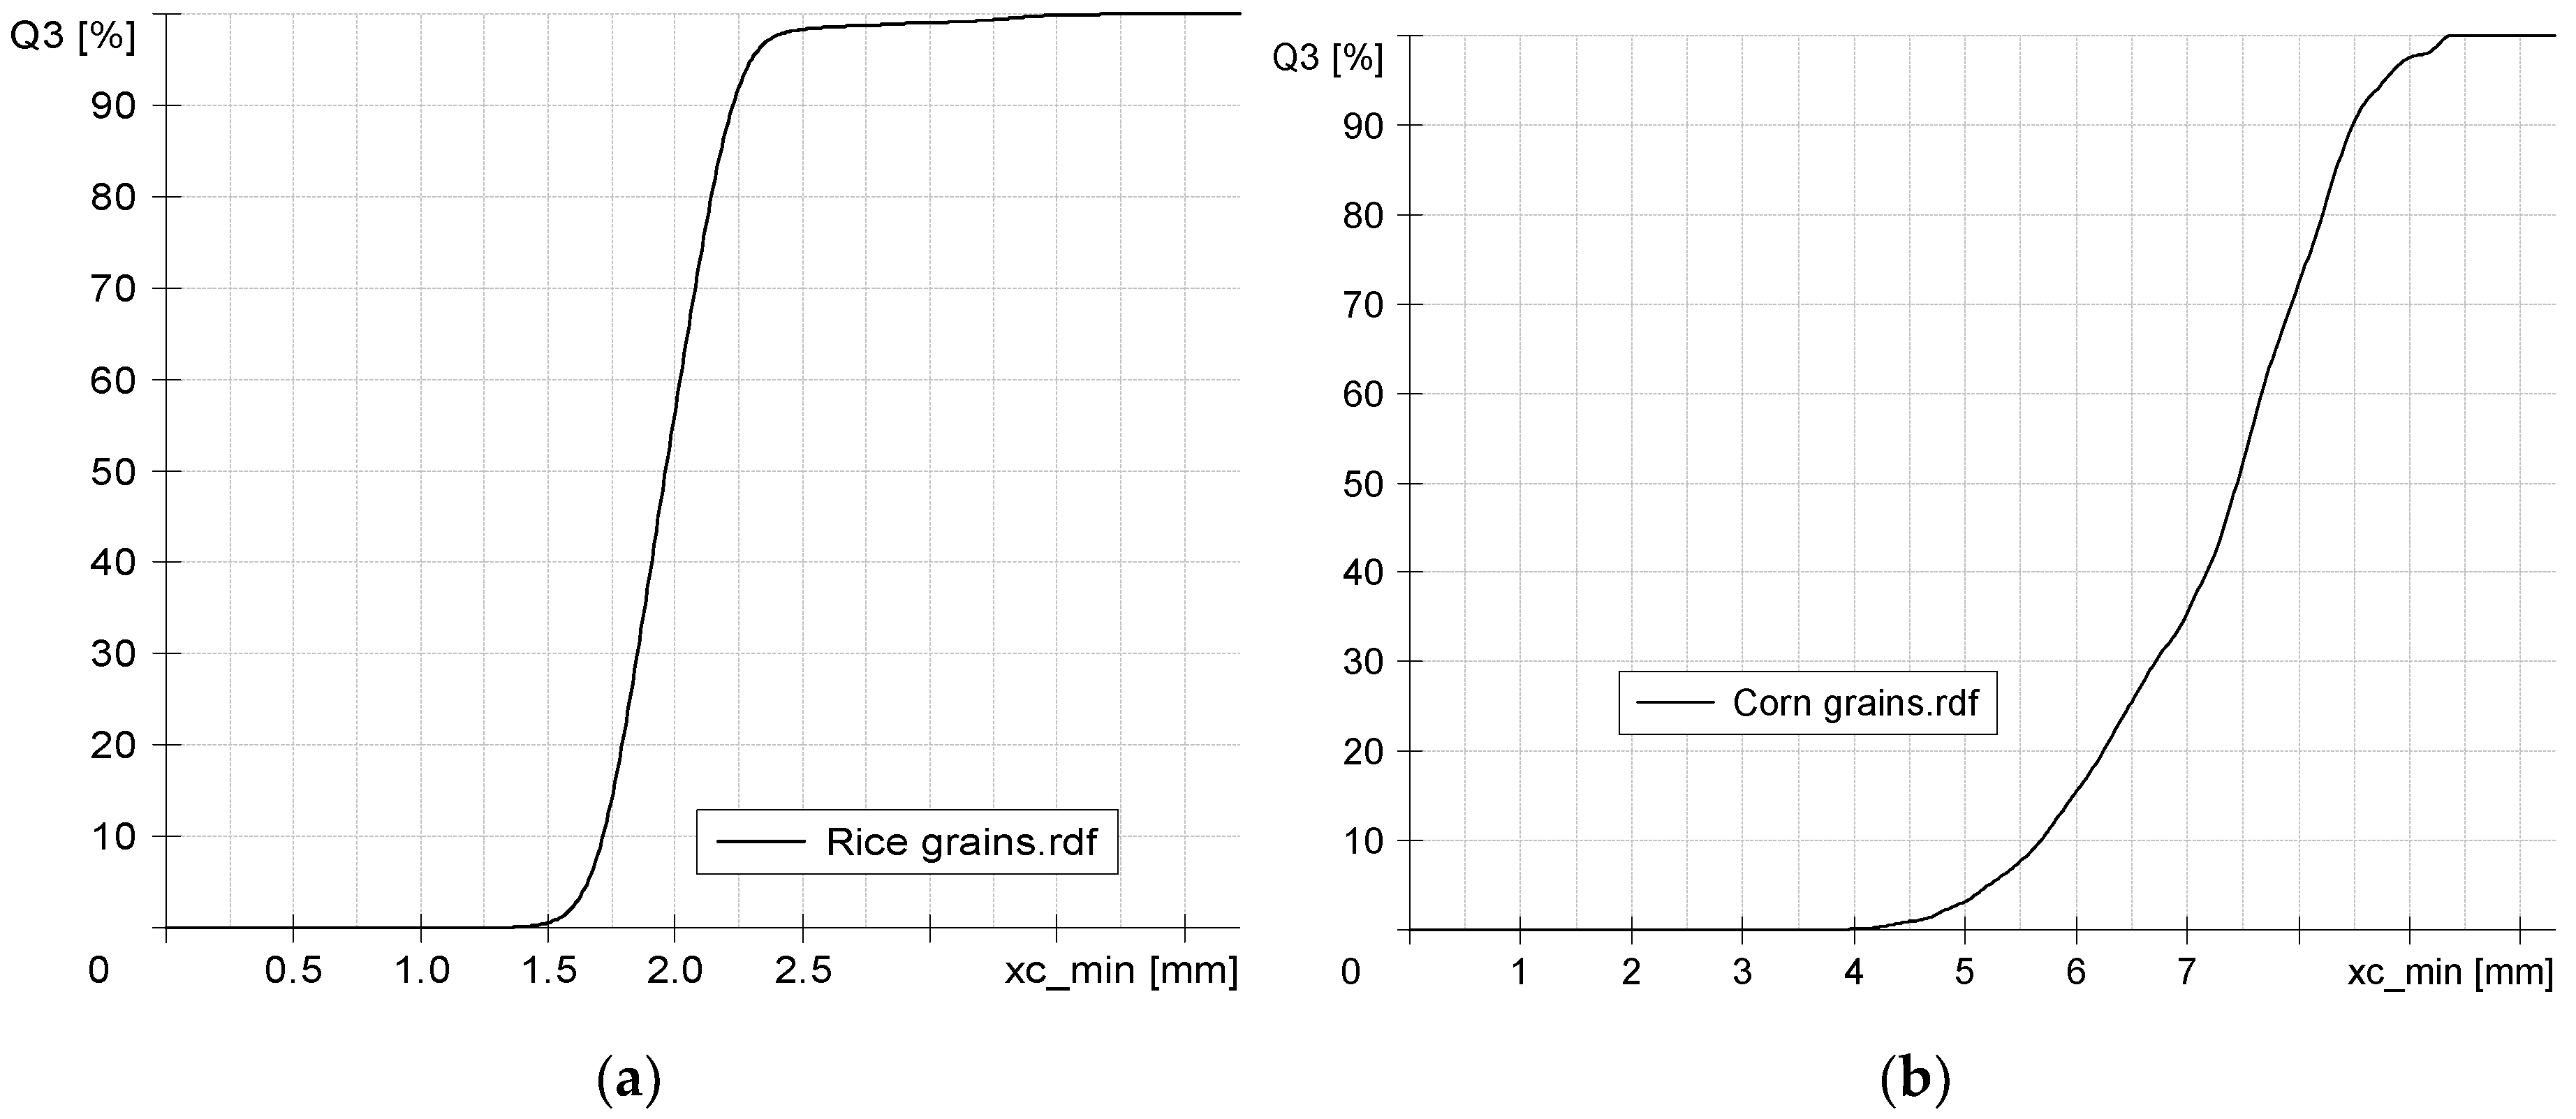
Rice and corn grains that are unsuitable for food purposes due to having been stored in inappropriate conditions that were used for the production of pellets underwent grinding in the experimental tests, verifying the correctness of the integrated energy consumption model. Both crops are extensively grown, and both of them have found applications in the energy sector due to their good energy characteristics, which make them suitable for the production of pellets whose calorific value is similar to that of a wooden biomass [80]. Grain moisture was determined on a moisture balance MAC 210/NP (RADWAG, Radom, Poland) by means of the weight method. Rice grains were characterized by moisture at the level of 13.47% ± 0.02%, whereas corn was at the level of 12.68% ± 0.02%. The characteristic dimension of grain D80 for corn was 8.15 mm and, for rice, 2.14 mm (Figure 1). These values were obtained on the basis of a granulometric analysis carried out on a Camsizer (Retsch Technology GmbH, Haan, Germany) design according to the ISO norm 13322-2:2006 [81].

2.3. Test Stand

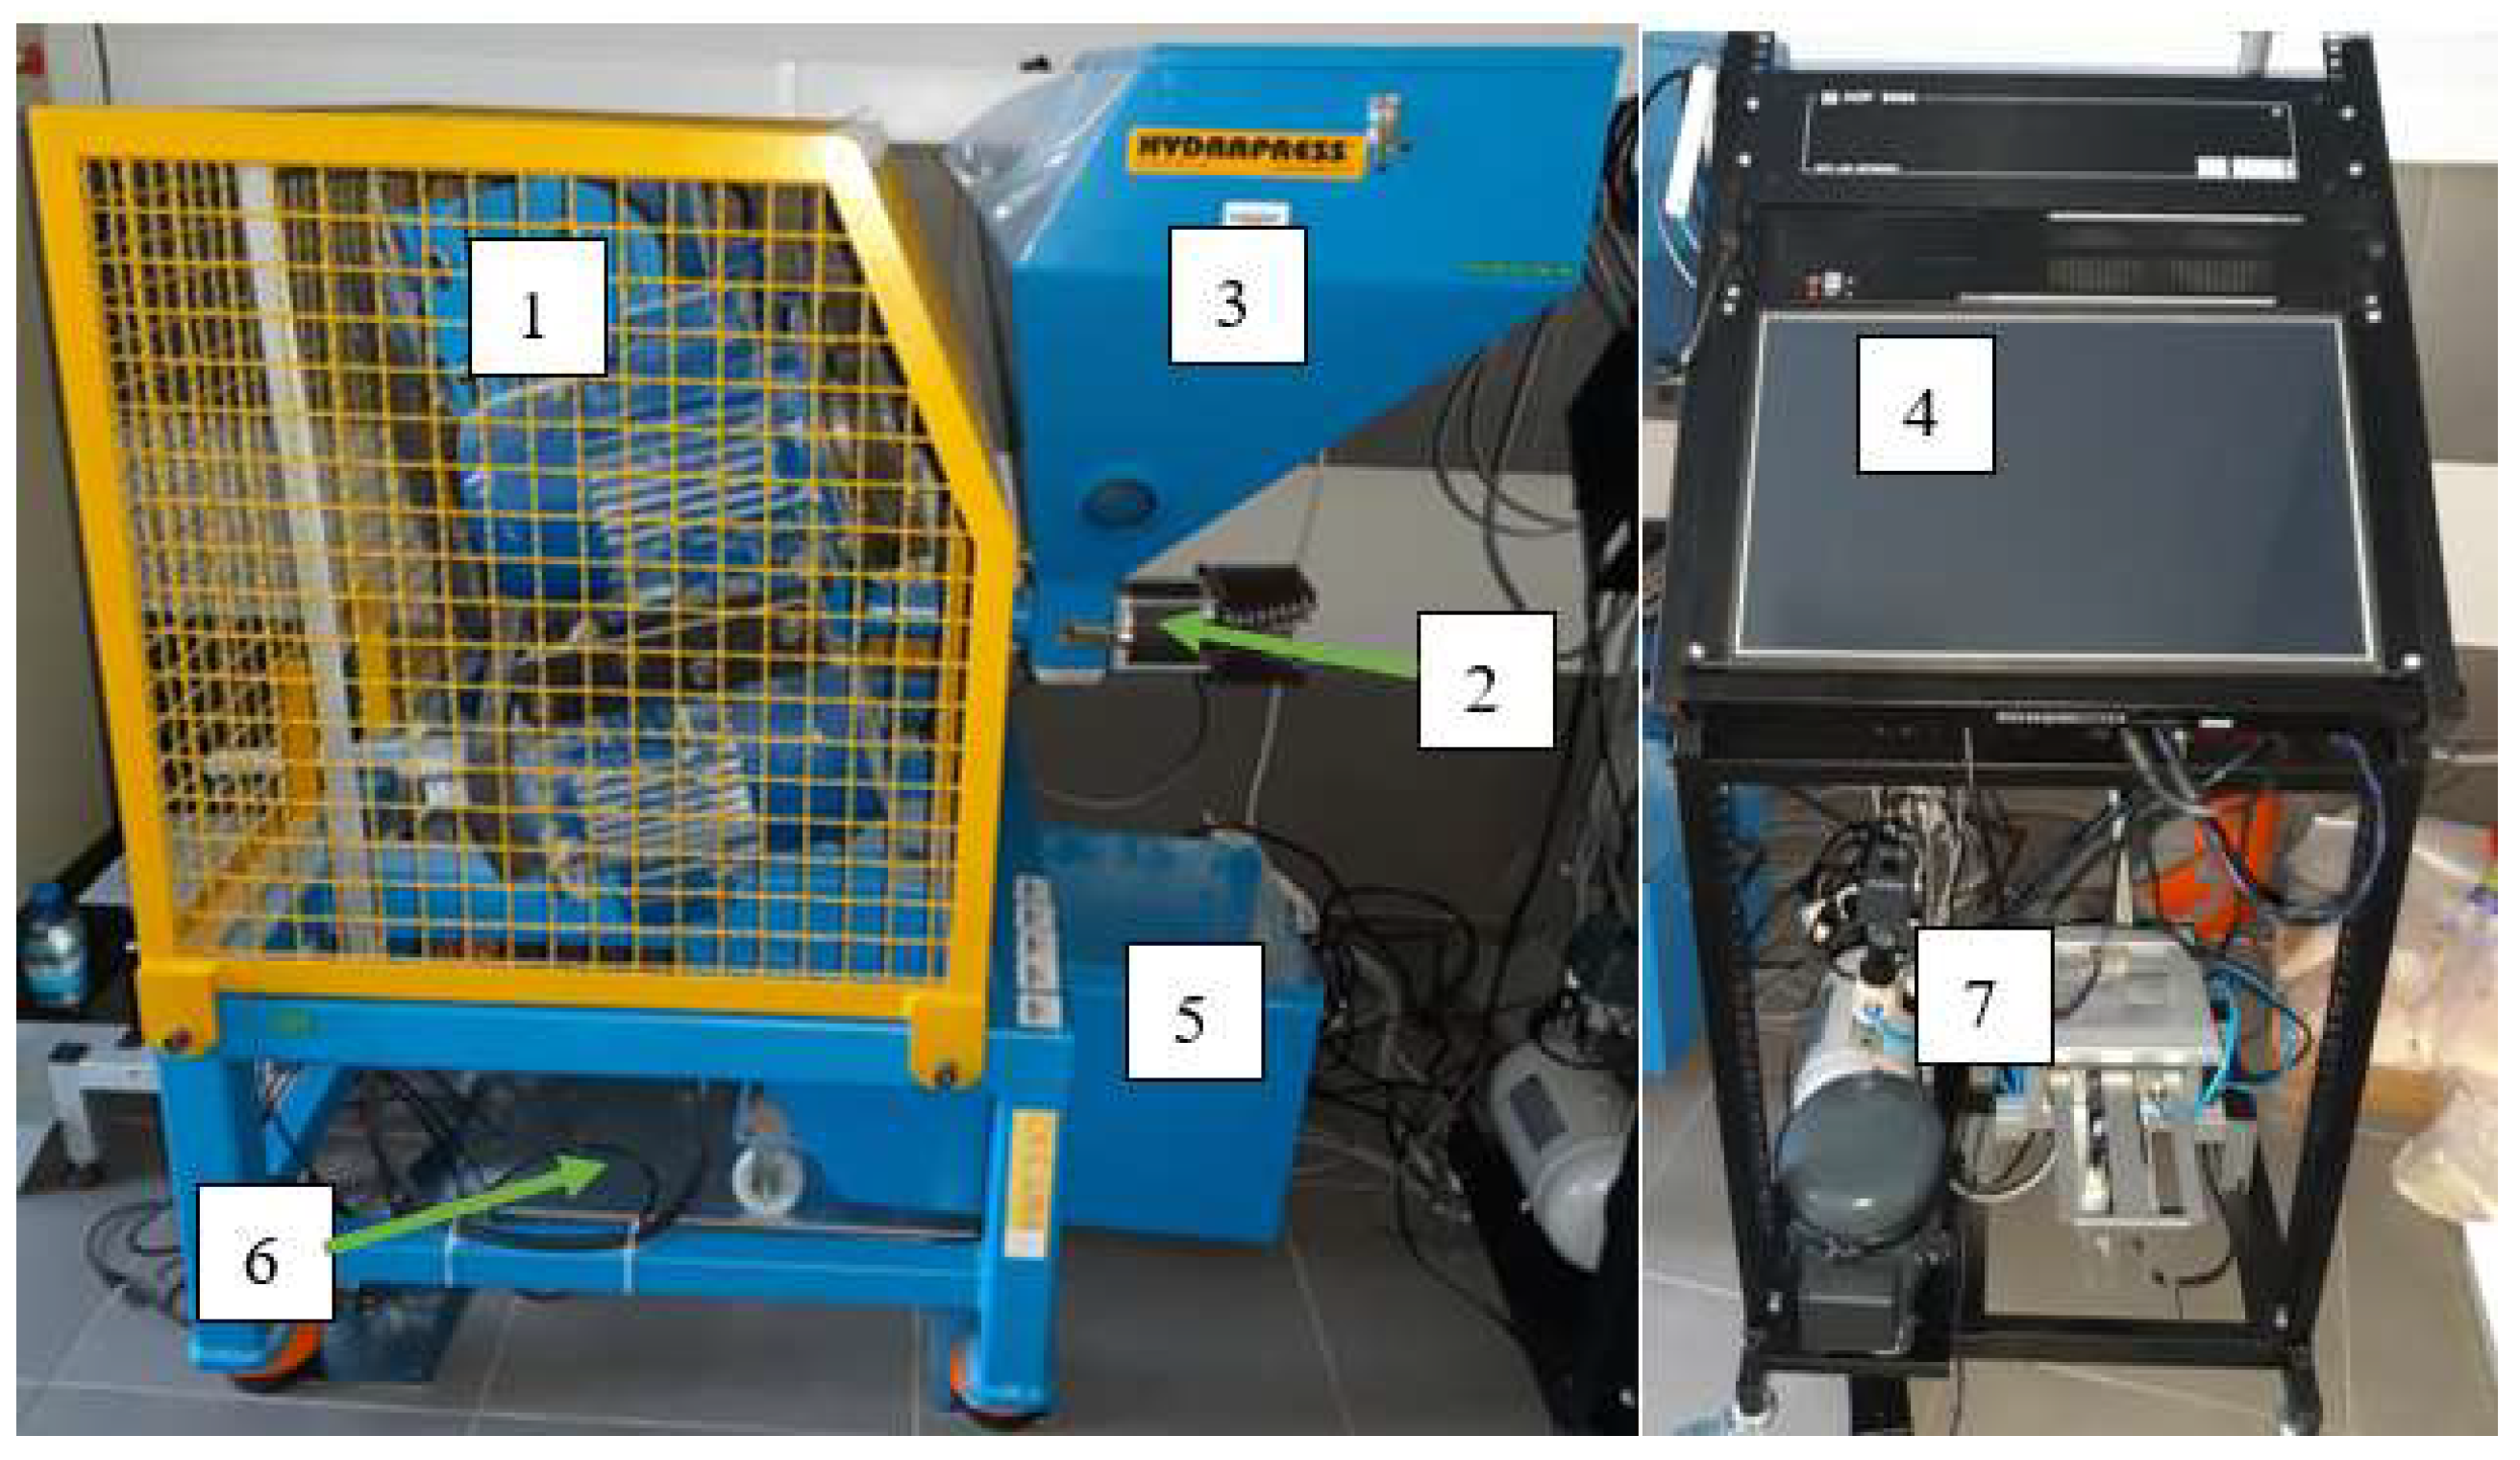
Verification of the model of integrated energy consumption was performed on a test stand for the intelligent monitoring of performance characteristics of a multi-disc grinder. The test stand was composed of: a five-disc mill, a control panel with a performance monitoring system, and an integrated system for analysis of the grinding product’s particle size (Figure 2).
A five-disc mill was equipped with a special integrated system for feed-dosing with a screw conveyor feeder, which makes it possible to control the feeding of the grain material into the grinding chamber. The grinding unit consists of five multi-hole discs fixed on the grinder shaft (Table 2). Each disc is powered individually by means of a dedicated motor which enables precise control of the angular speed of each disc. The final product is collected in the intake hopper with a scale fixed underneath, by means of which, the mass of the fragmented material is weighed. This makes it possible to determine the actual yield of the process. The integrated system of the particle size analysis makes it possible to assess the grinding product’s granulometric composition and to determine the degree of fragmentation. The whole system is equipped with a set of sensors and archive modules. Control of the grinder and data reading is included in the control panel by means of the authors’ own application (MŁYN, 2019).

2.4. Research Methodology

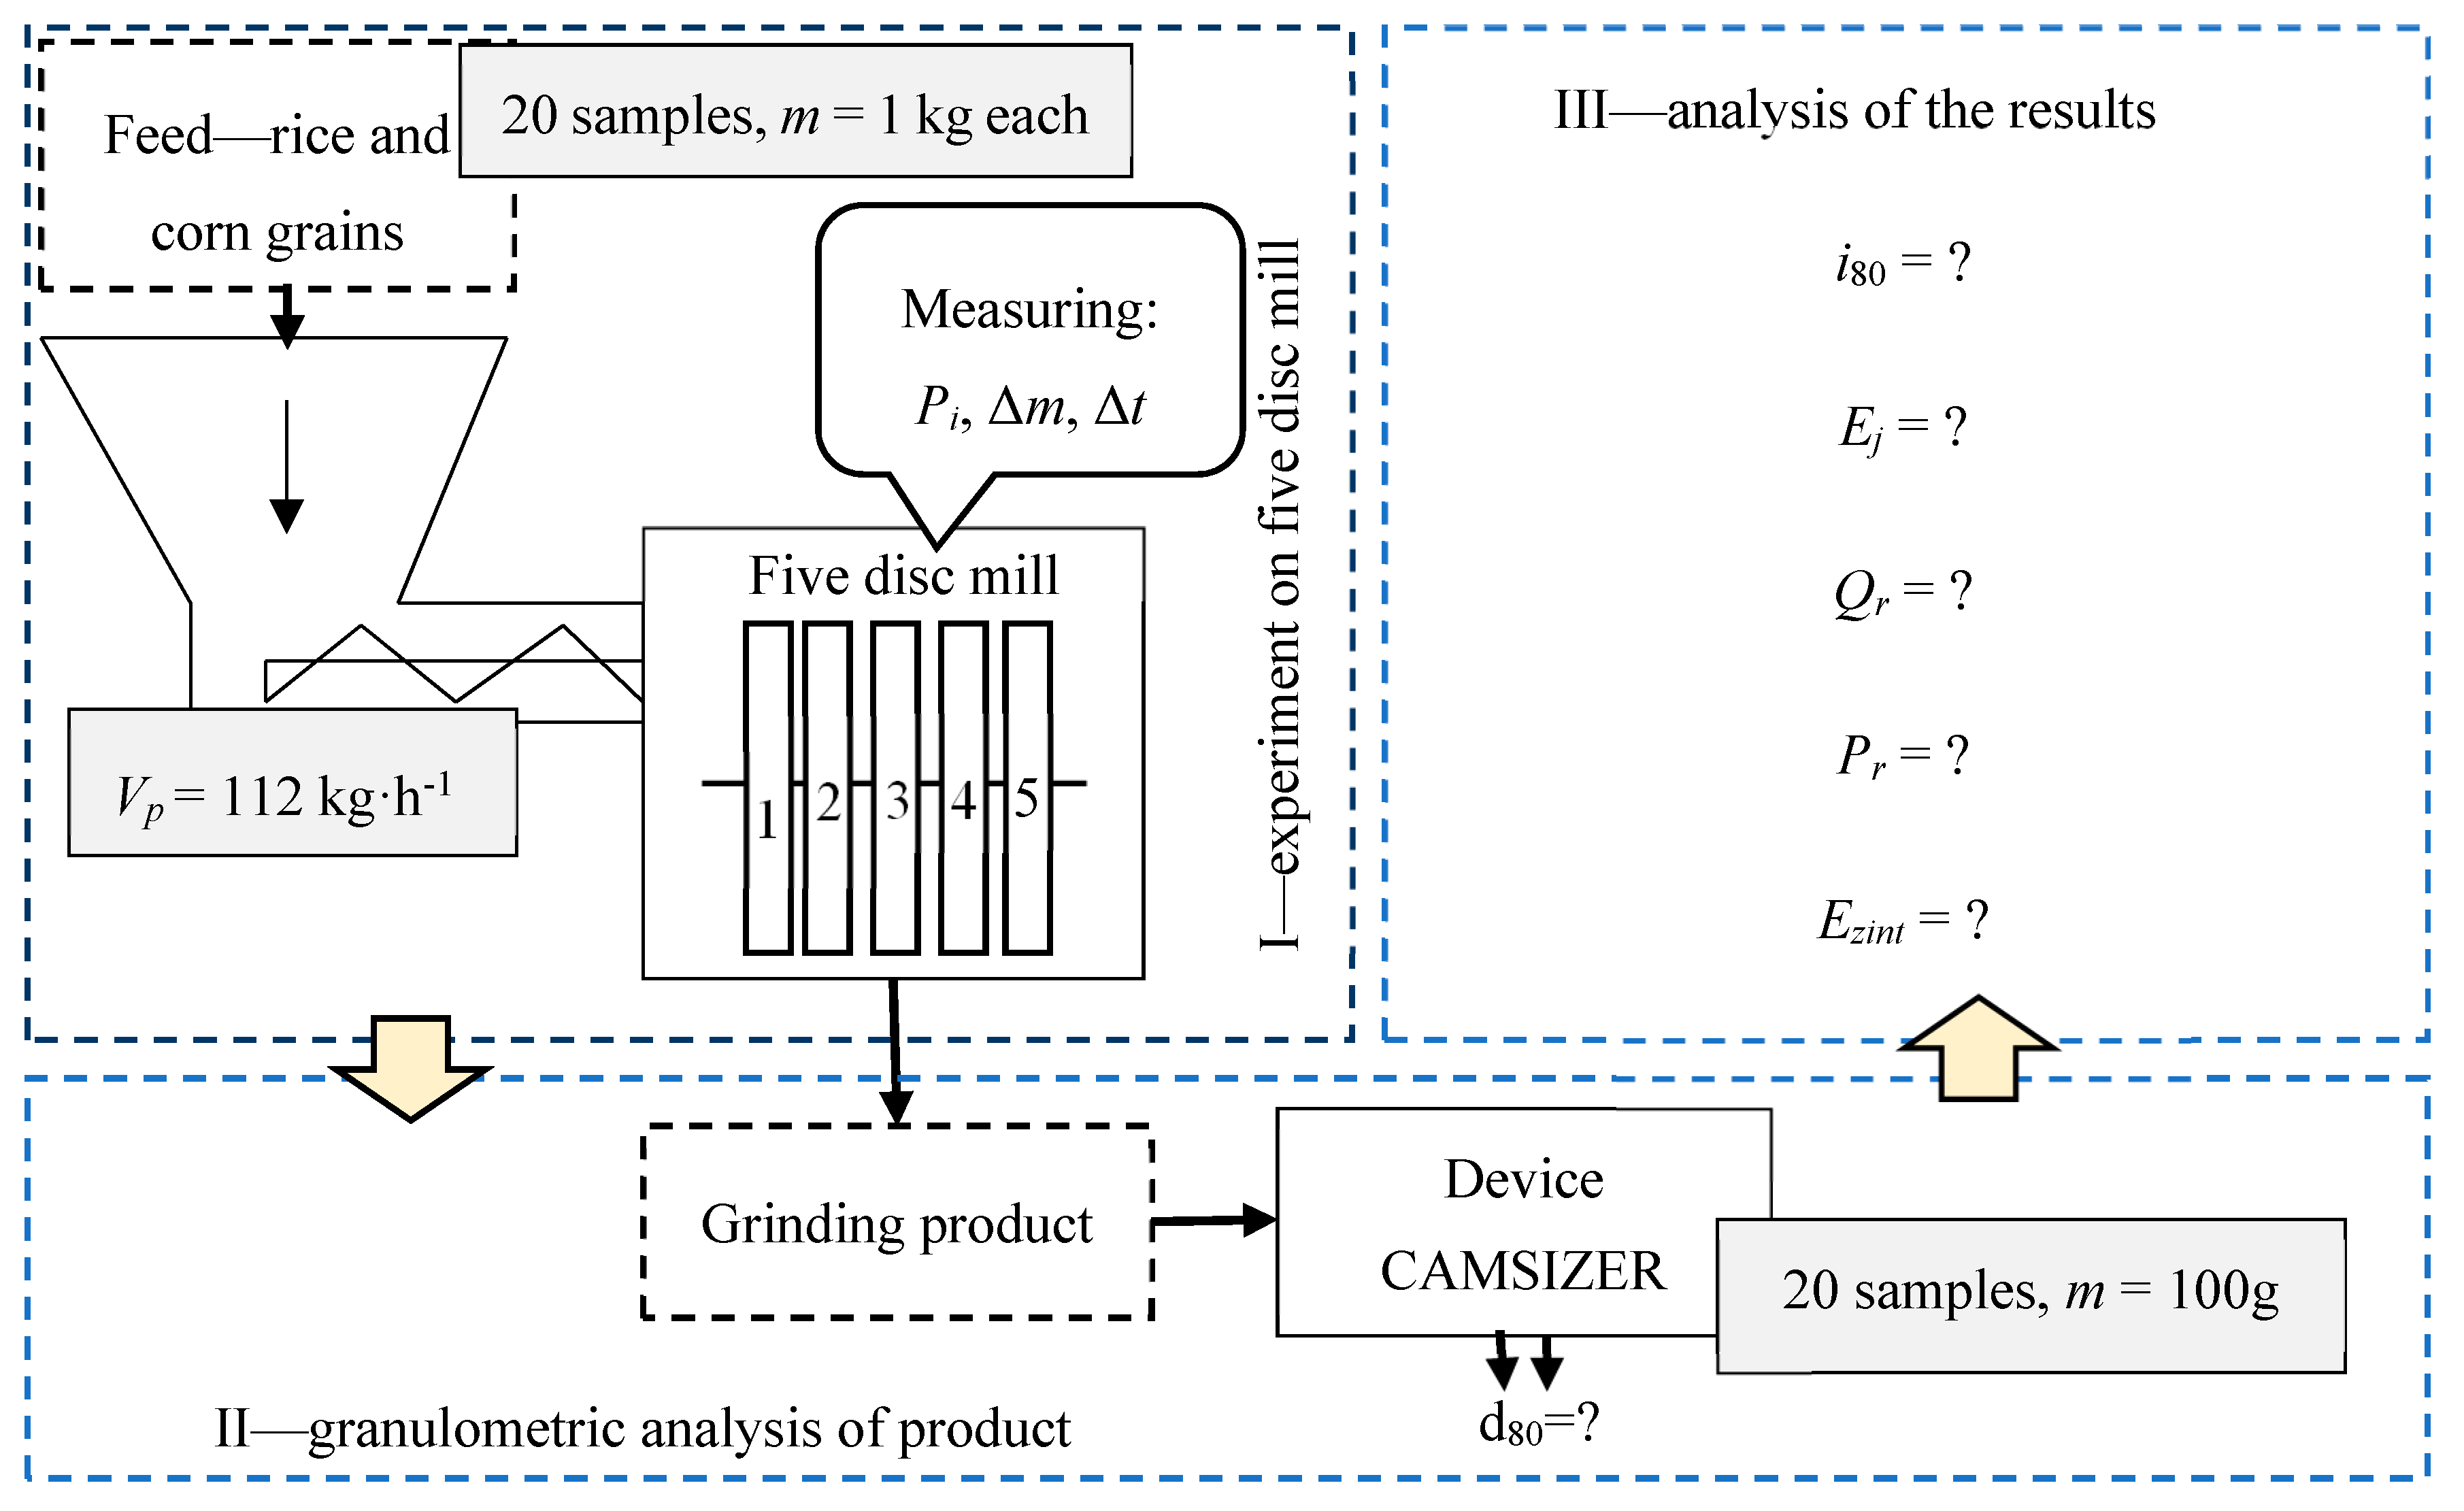
Verification of the integrated energy consumption index model was carried out consistently with the plan presented in Figure 3.
First, 20 one-kilogram samples of rice and corn were prepared. The moisture level was determined for each of them on a moisture balance MAC 210/NP (RADWAG, Radom, Poland) in accordance with ISO norm 1446 [82], and, additionally, average grain size before grinding on a CAMSIZER (Retsch Technology GmbH, Haan, Germany) device was also determined in accordance with ISO norm 13322-2:2006 [81]. Next, the prepared material was subjected to grinding on a five-disc grinder for 20 different grinding disc angular speed settings in accordance with the accepted test program [28,79] in order to investigate the dependence of the integrated energy consumption index on the total increase in the grinder disc angular speed Sω (Table 3). The minimal speed of the grinder discs accepted to be the point of reference was 20 rad∙s−1. The accepted settings of the disc angular speed were different in terms of the angular speed gradient ∆ω. The feed was delivered by means of a screw conveyor feeder with the speed of 112 kg∙h−1. Changes in the time of parameters such as power consumption, product mass in the intake hopper, angular speeds of the grinder discs, torques, and size of the product particles were recorded (with a sampling frequency every 0.5 s) in order to determine the values of the integrated energy consumption model criteria (components)—that is, power consumption, yield, fragmentation degree, and unit energy consumption.
The next step involved both statistical and substantive analyses. The values of the integrated energy consumption were determined for each setting of the grinder disc according to dependence (22). Statistical analysis of the results was carried out by means of MS EXCEL (Microsoft, Redmond, WA, USA) and Statistica software (TIBCO Software Inc., Palo Alto, CA, USA). A general statistical analysis of the results, including the determination of the characteristics of the integrated energy consumption distribution and its variable components, was performed. Tests of the distribution of the normality of the variables were conducted by means of a Shapiro-Wilk test. This test is used to assess the distribution of the results. The null hypothesis of this test is that the population is normally distributed [83]. Thus, if the p-value is less than the chosen alpha level (in this study, p > 0.05), then the null hypothesis is rejected, and it can be assumed that the data are not characterized by normal distribution. When the p-value is greater than the chosen alpha level, it cannot be rejected that the data are characterized by normal distribution [83]. A correlation analysis using the Pearson method was performed for variables whose distribution was close to normal, while a Spearman correlation analysis was applied for the remaining ones. Next, a regression analysis was used. The results of the statistical analyses were found to be significant for p < 0.05.

3. Results and Discussion

In this part of the study, the test results of the integrated energy consumption index variables are described along with an analysis of their relations with the independent variable: the increase in the grinder disc angular speed Sω. The results of the tests performed for the settings of the accepted grinder disc angular speed configurations for rice grinding are presented in Table S1 and, for corn, in Table S2.

3.1. Test Results of the Integrated Energy Consumption Model Variables and Their Analysis

The analysis included general descriptive characteristics of the resultant variables of power consumption, fragmentation degree, unit energy consumption, yield, the Shapiro-Wilk test for the normality of distribution, and correlation analysis with the Pearson method.

3.1.1. Power Consumption

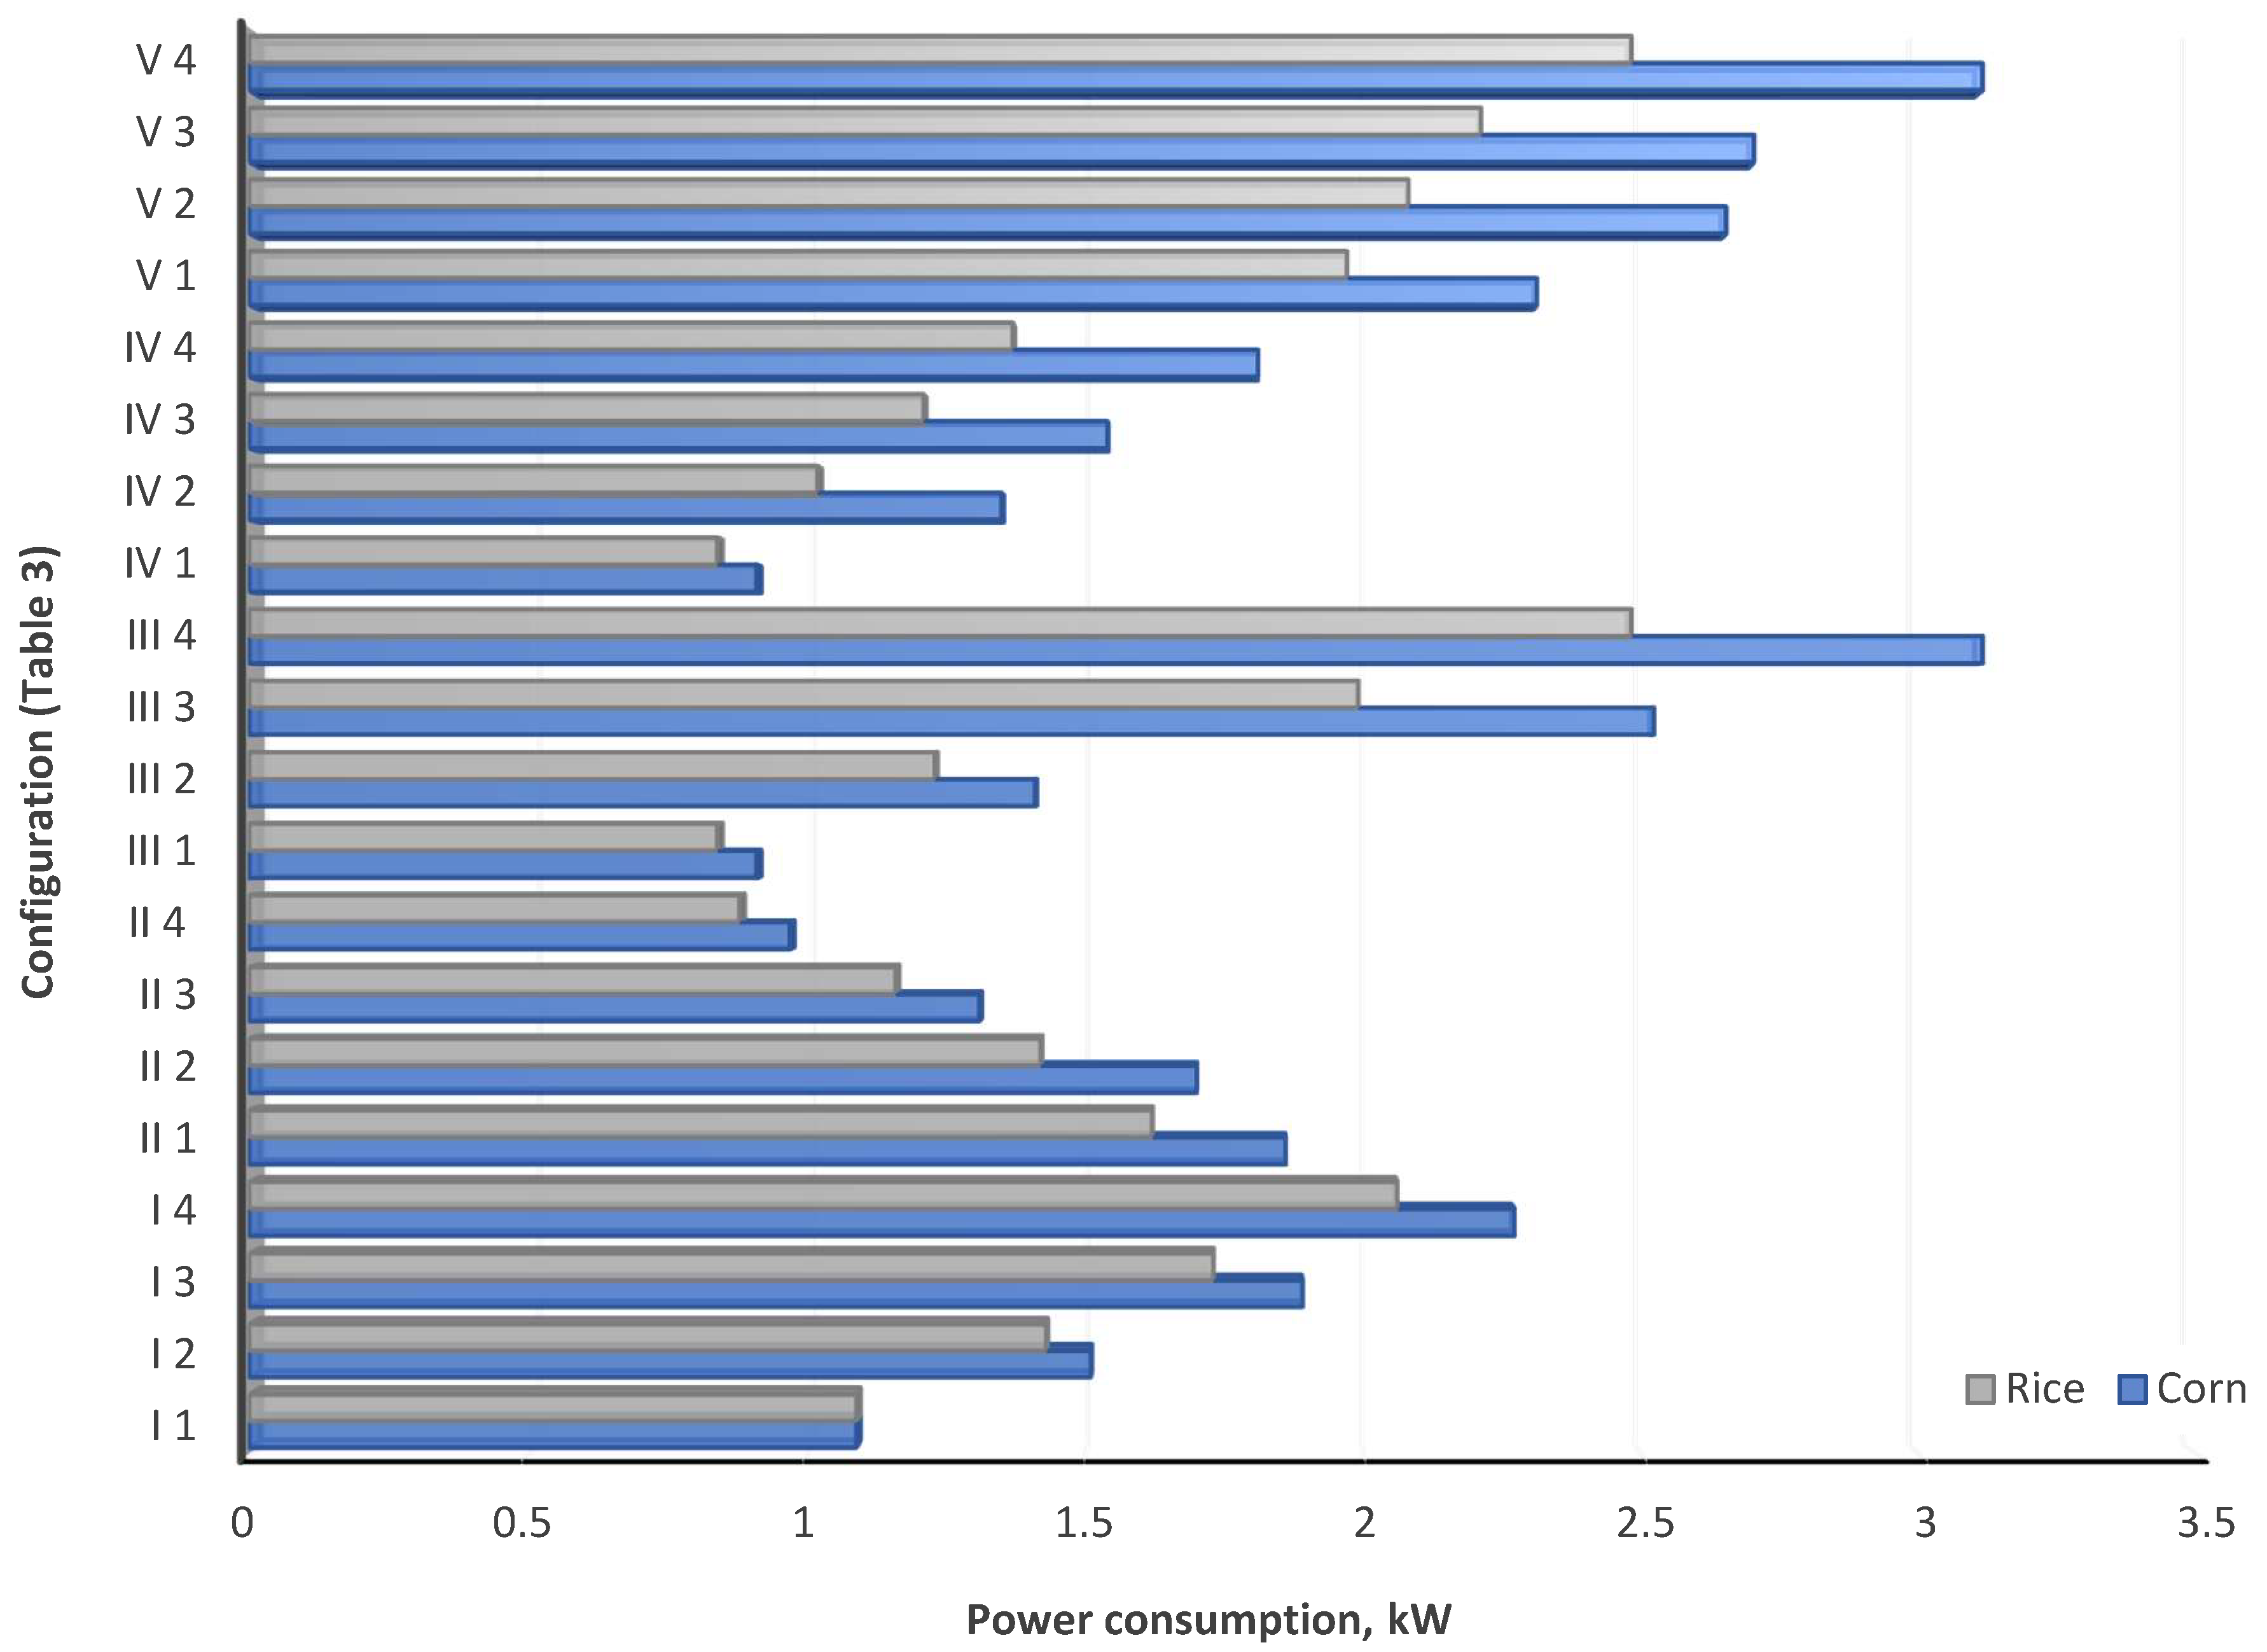
Figure 4 shows the test results of the power consumption for rice and corn grinding on a five-disc grinder. The results indicate that the disc angular speed changes do affect power consumption. An increase in power consumption along with an increase in the grinder disc angular speed was observed. It can also be noticed that the power consumption for each disc setting was different depending on the material used (Figure 4). The power consumption for rice grinding was lower than the power consumption for corn grinding for all cases, which is mostly connected with the differing properties and internal structures of these materials [34].
Earlier analyses of rice and corn strength indicated that higher forces are needed to grind corn grains, which is reflected by the power demand of grinding machines, due to the necessity of overcoming the higher resistance of moving elements [37]. An increased demand for power and energy in the case of a higher-strength grinding material was confirmed by [38,39,40], among others. An increased demand for power for corn grinding is also the effect of differences in the internal structure thereof [38,39,40]. Rice grains deprived of husks were used in the tests, whereas corn grains had the seed coat. Moreover, corn grains differ from rice grains in terms of endosperm structure. Grains with higher endosperm glassiness have been observed to need more energy and power in the process of grinding [36,41,42].
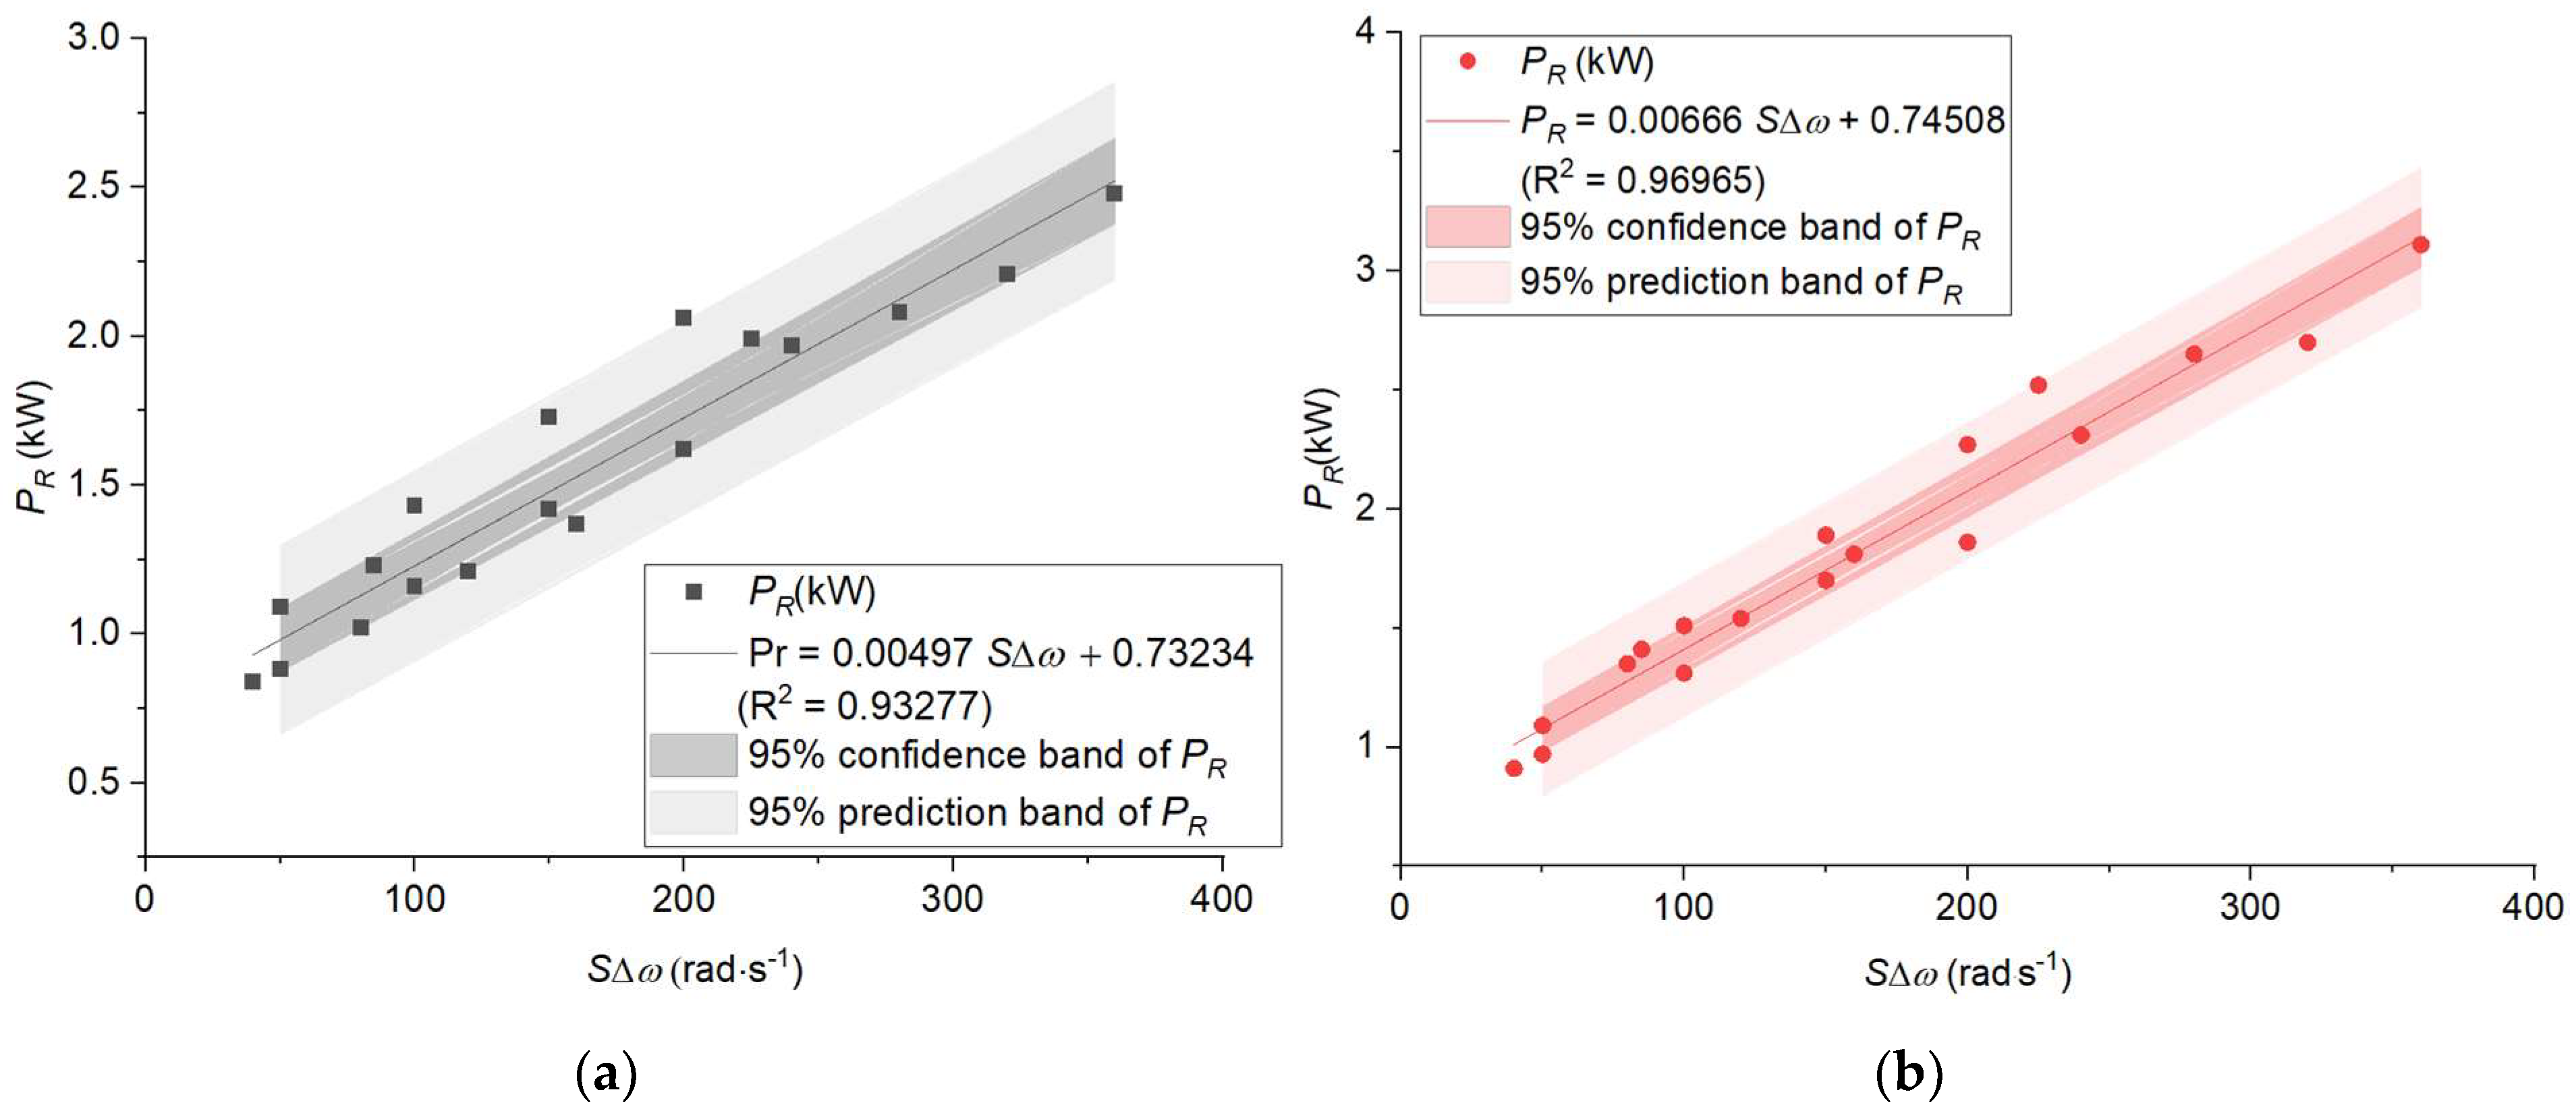
On the basis of the Shapiro-Wilk test (Appendix A, Table A1 and Table A2) and the values of skewness and kurtosis (Appendix A, Table A3 and Table A4) of the distribution of the power consumption test results, it was found that this distribution is approximately normal. Subsequently, the Pearson method was used for the analysis of correlation between the power consumption of grinding PR and total speed increase S∆ω. Correlation analysis revealed that there was a strong relation between the power consumption in grinding PR and a total speed increase S∆ω during both rice grinding (R = 0.9658, Appendix A, Table A5) and corn grinding (R = 0.9847, Appendix A, Table A6).
On the basis of the linear regression analysis, equations describing the dependence of power consumption as a function of total speed increase were determined. It was found that power consumption for grinding can be described by means of a linear model with a high match (Figure 5). Both the coefficient in the equations and the regression models themselves were statistically significant (Table 4 and Table 5).

3.1.2. Yield

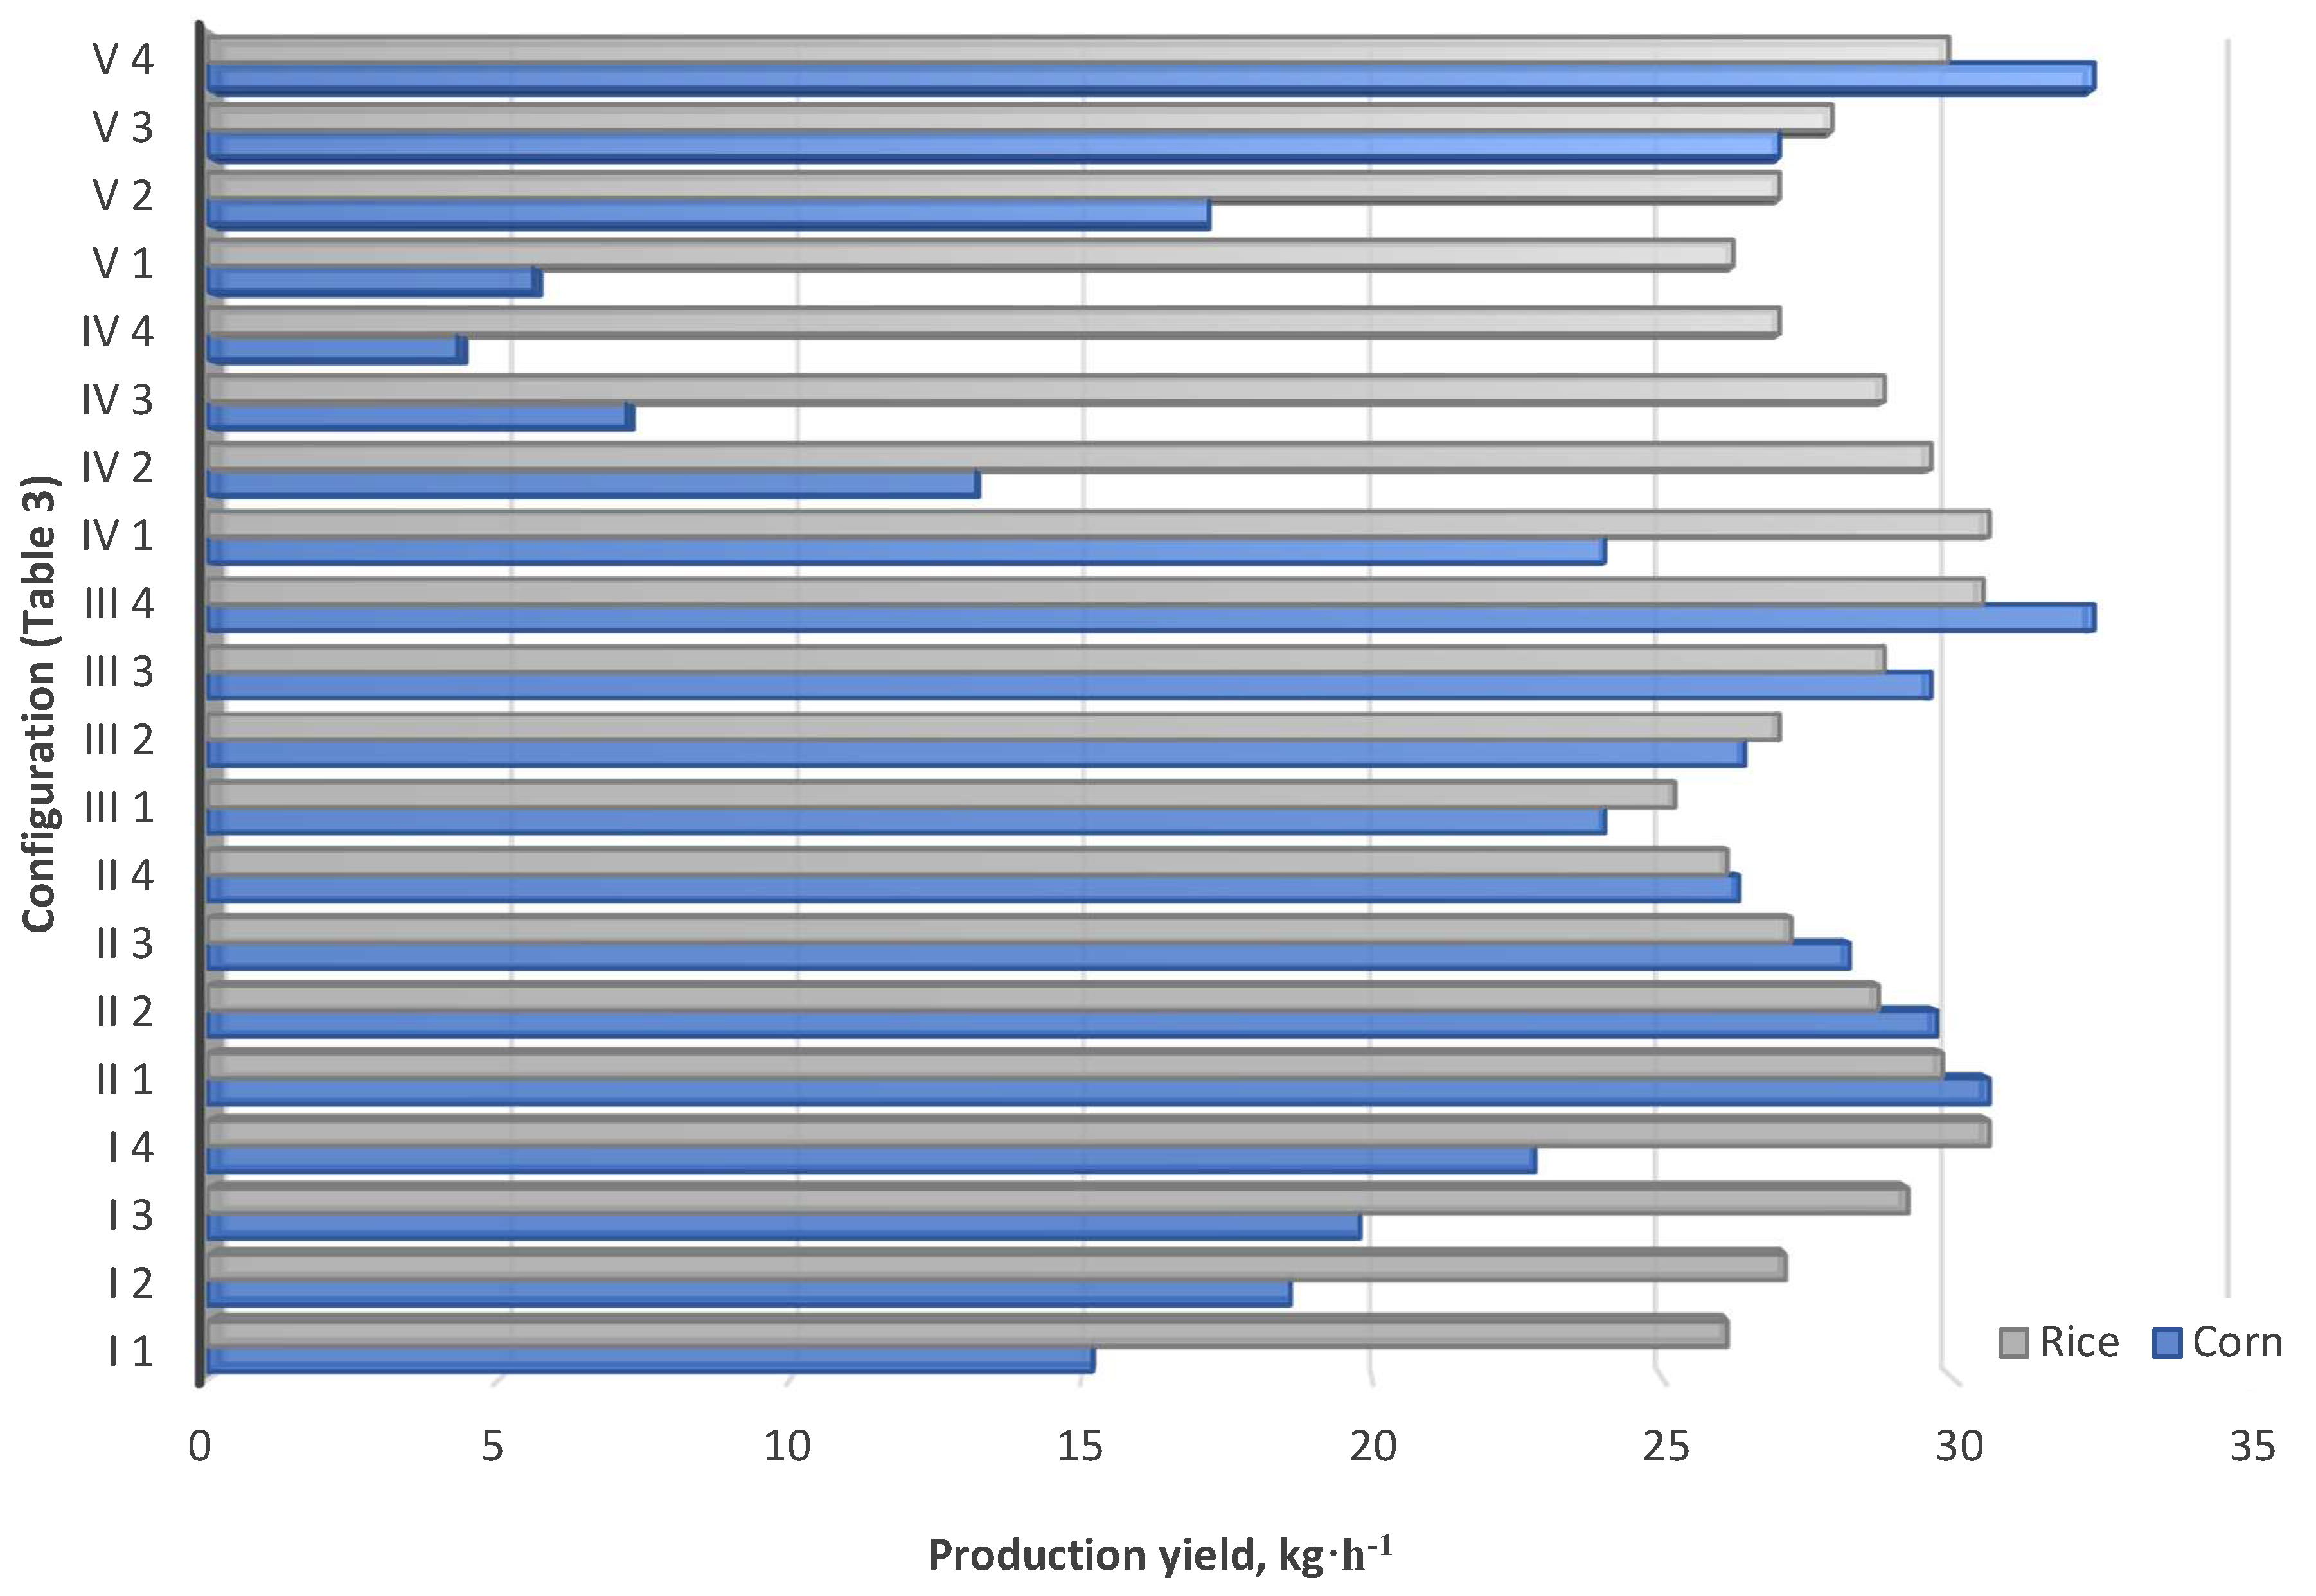
Figure 6 shows the results of rice and corn grinding yield tests performed on a five-disc grinder. The results indicate that the disc angular speed changes have an impact on this parameter change. As in the case of power consumption, it was observed that grinding yields increased along with an increase in the disc angular speeds. It could also be observed that, for the settings of the grinder disc angular speeds at which the first disc speed was the lowest, the rice grinding yield was significantly higher than that of the corn (Figure 6). For the remaining settings, the yield was similar though slightly higher for corn. This might result from the relations between the structural characteristics of working discs, speed, and the size of the grain used. The average size of rice grains was definitely lower than that of corn; hence, more of them can be introduced into the open space of the grinding discs.
On the basis of the Shapiro-Wilk test (Appendix A, Table A1 and Table A2) and the values of skewness and kurtosis (Appendix A, Table A3 and Table A4) of the distribution of the performance test results, it was found that this distribution is approximately normal. Subsequently, the Pearson method was used in the analysis of correlation between grinding yield Qr and the total speed increase. A correlation analysis showed that the correlation between the yield of grinding Qr and the total speed increase S∆ω during both rice grinding (Appendix A, Table A5) and corn grinding was poor (Appendix A, Table A6).
Poor correlations between the disc total angular speed increased, and the yield might be the result of the grain strength properties and their relations and interactions with the grinding unit. The phenomena accompanying the flow of granular materials through the grinding chamber, the inter-hole space, and inter-disc space of the quasi-shearing unit are not without importance. There can occur, among other things, periods when the material lingers in the grinding chamber due to the adhesion of wet grains, which can be observed, e.g., in the case of corn and the poor results in the fourth test program.

3.1.3. Unit Energy Consumption

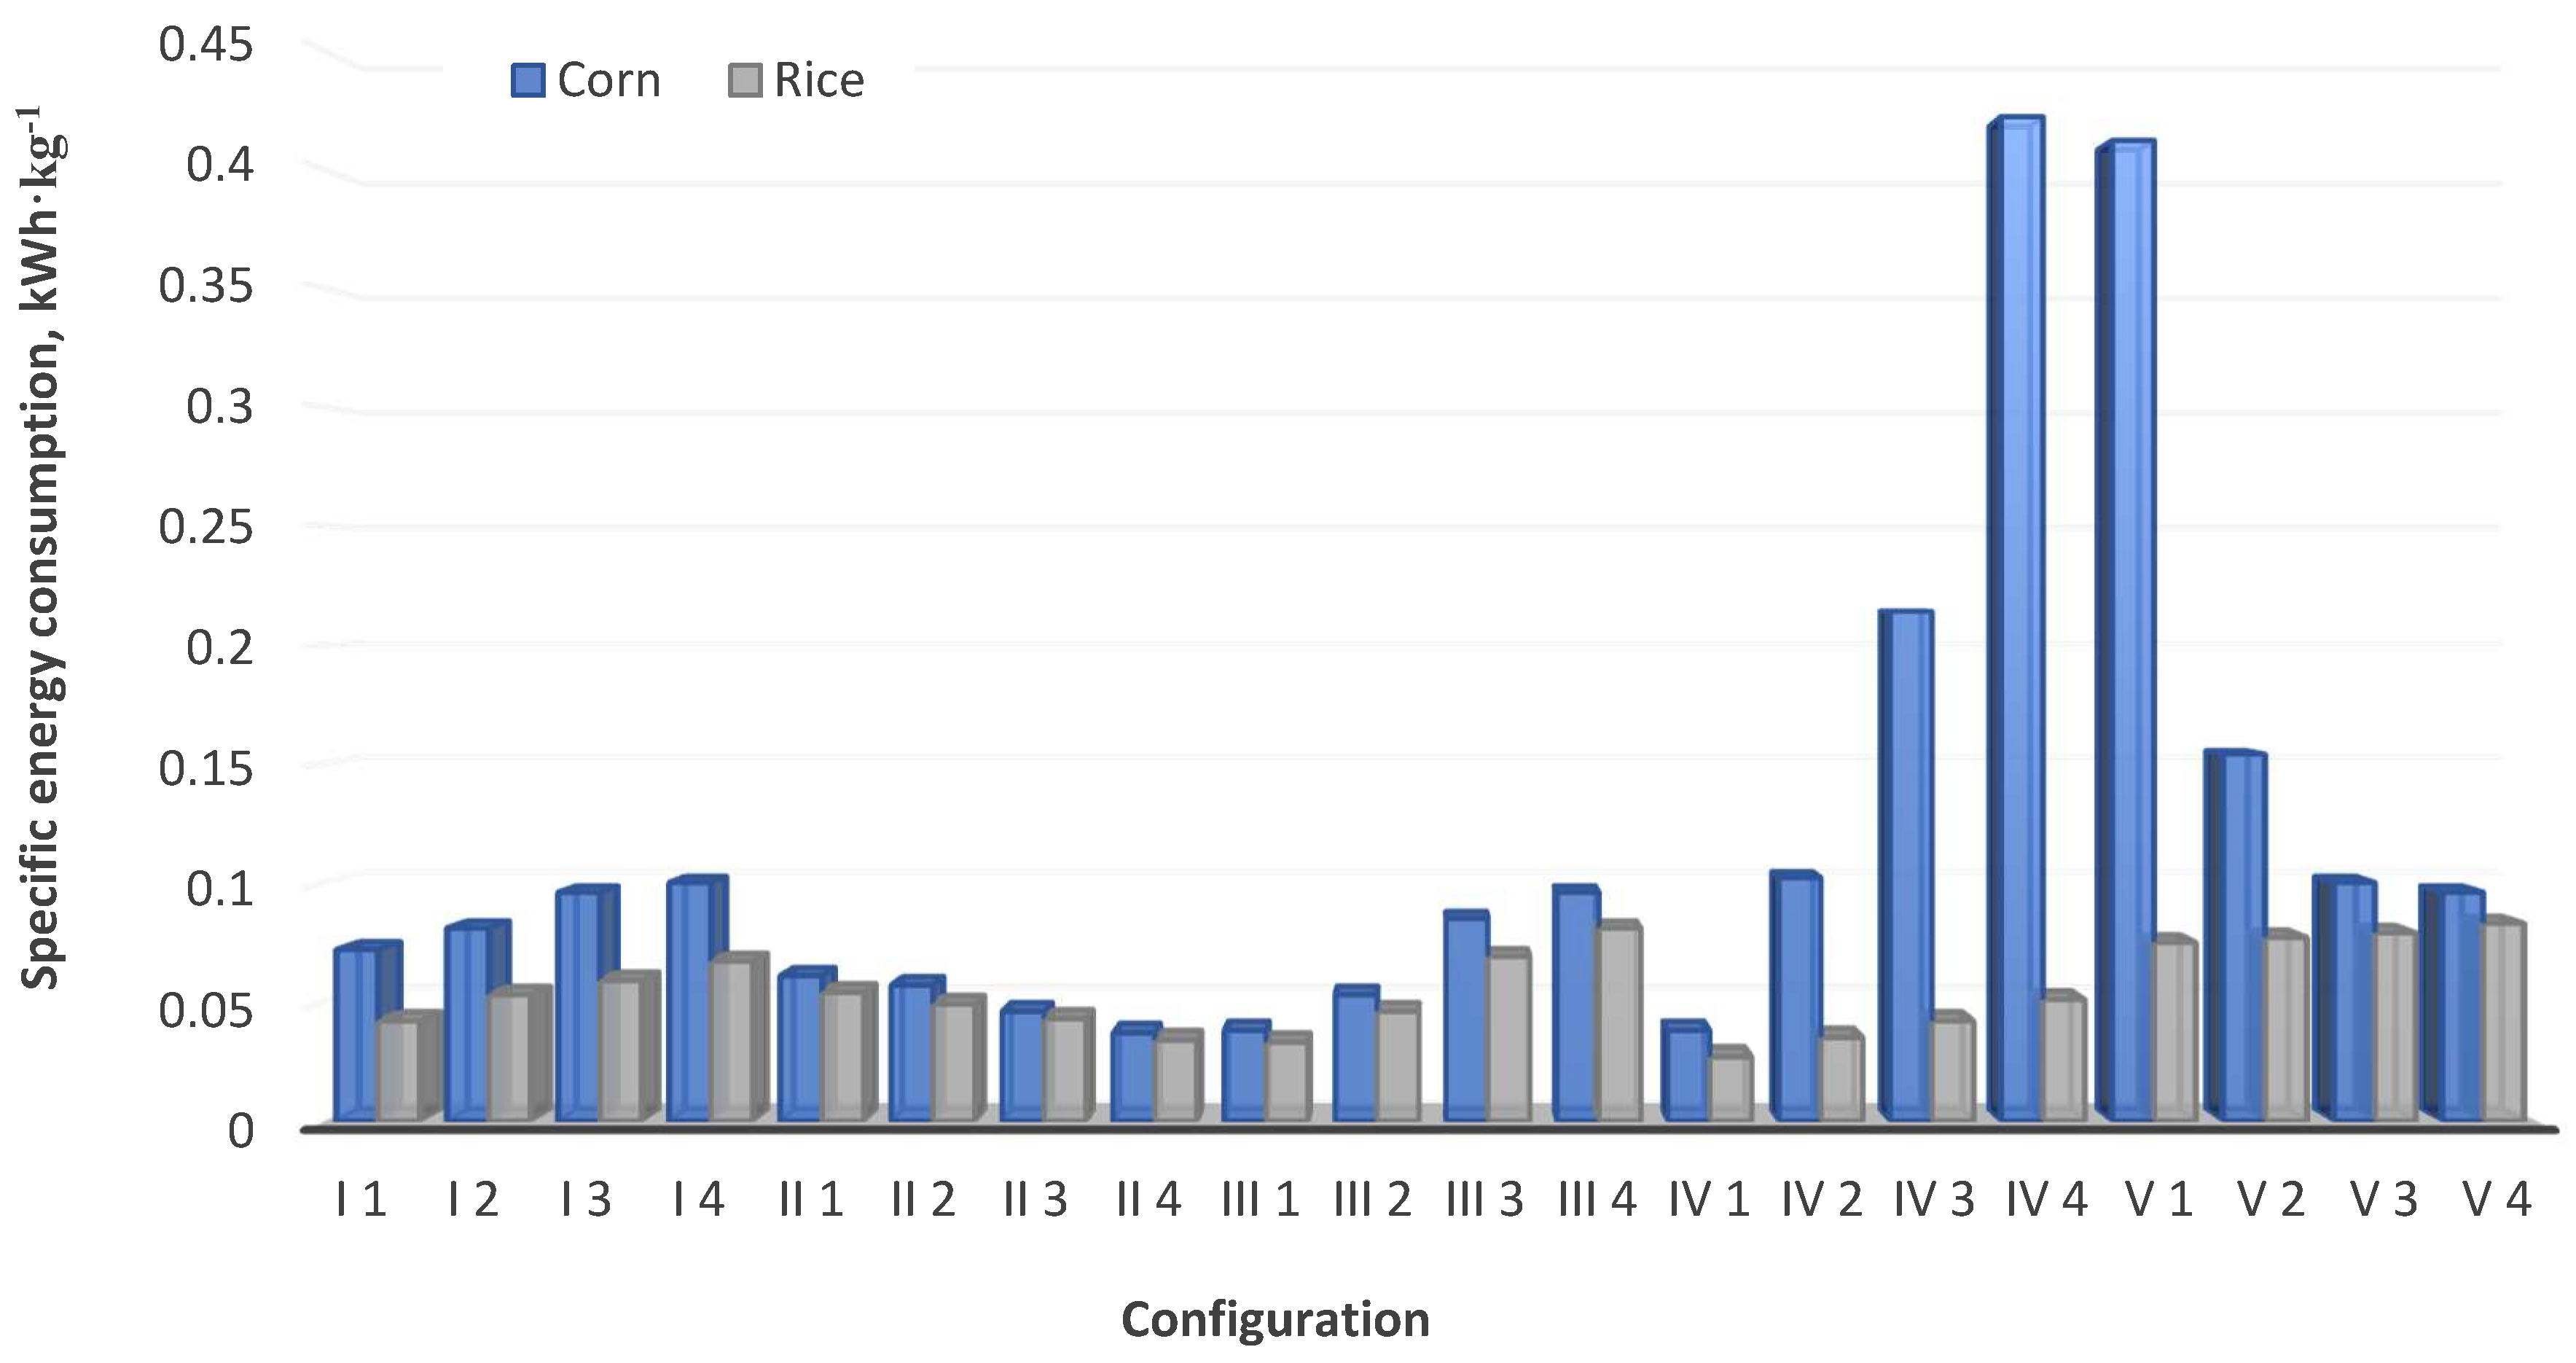
Figure 7 shows the test results of the unit energy consumptions for rice and corn grain grinding. For all the considered settings of the five-disc grinder angular speeds, the unit energy demand was higher for corn grinding (Figure 7), which was mostly connected with a higher power consumption during corn grinding, which, in turn, results from the grain strength properties which are discussed in Section 3.1.1. Earlier research also indicated a higher unit energy consumption for corn grinding [19]. The results indicate that an increase in the angular speed of discs caused an increase in energy consumption (Figure 7).
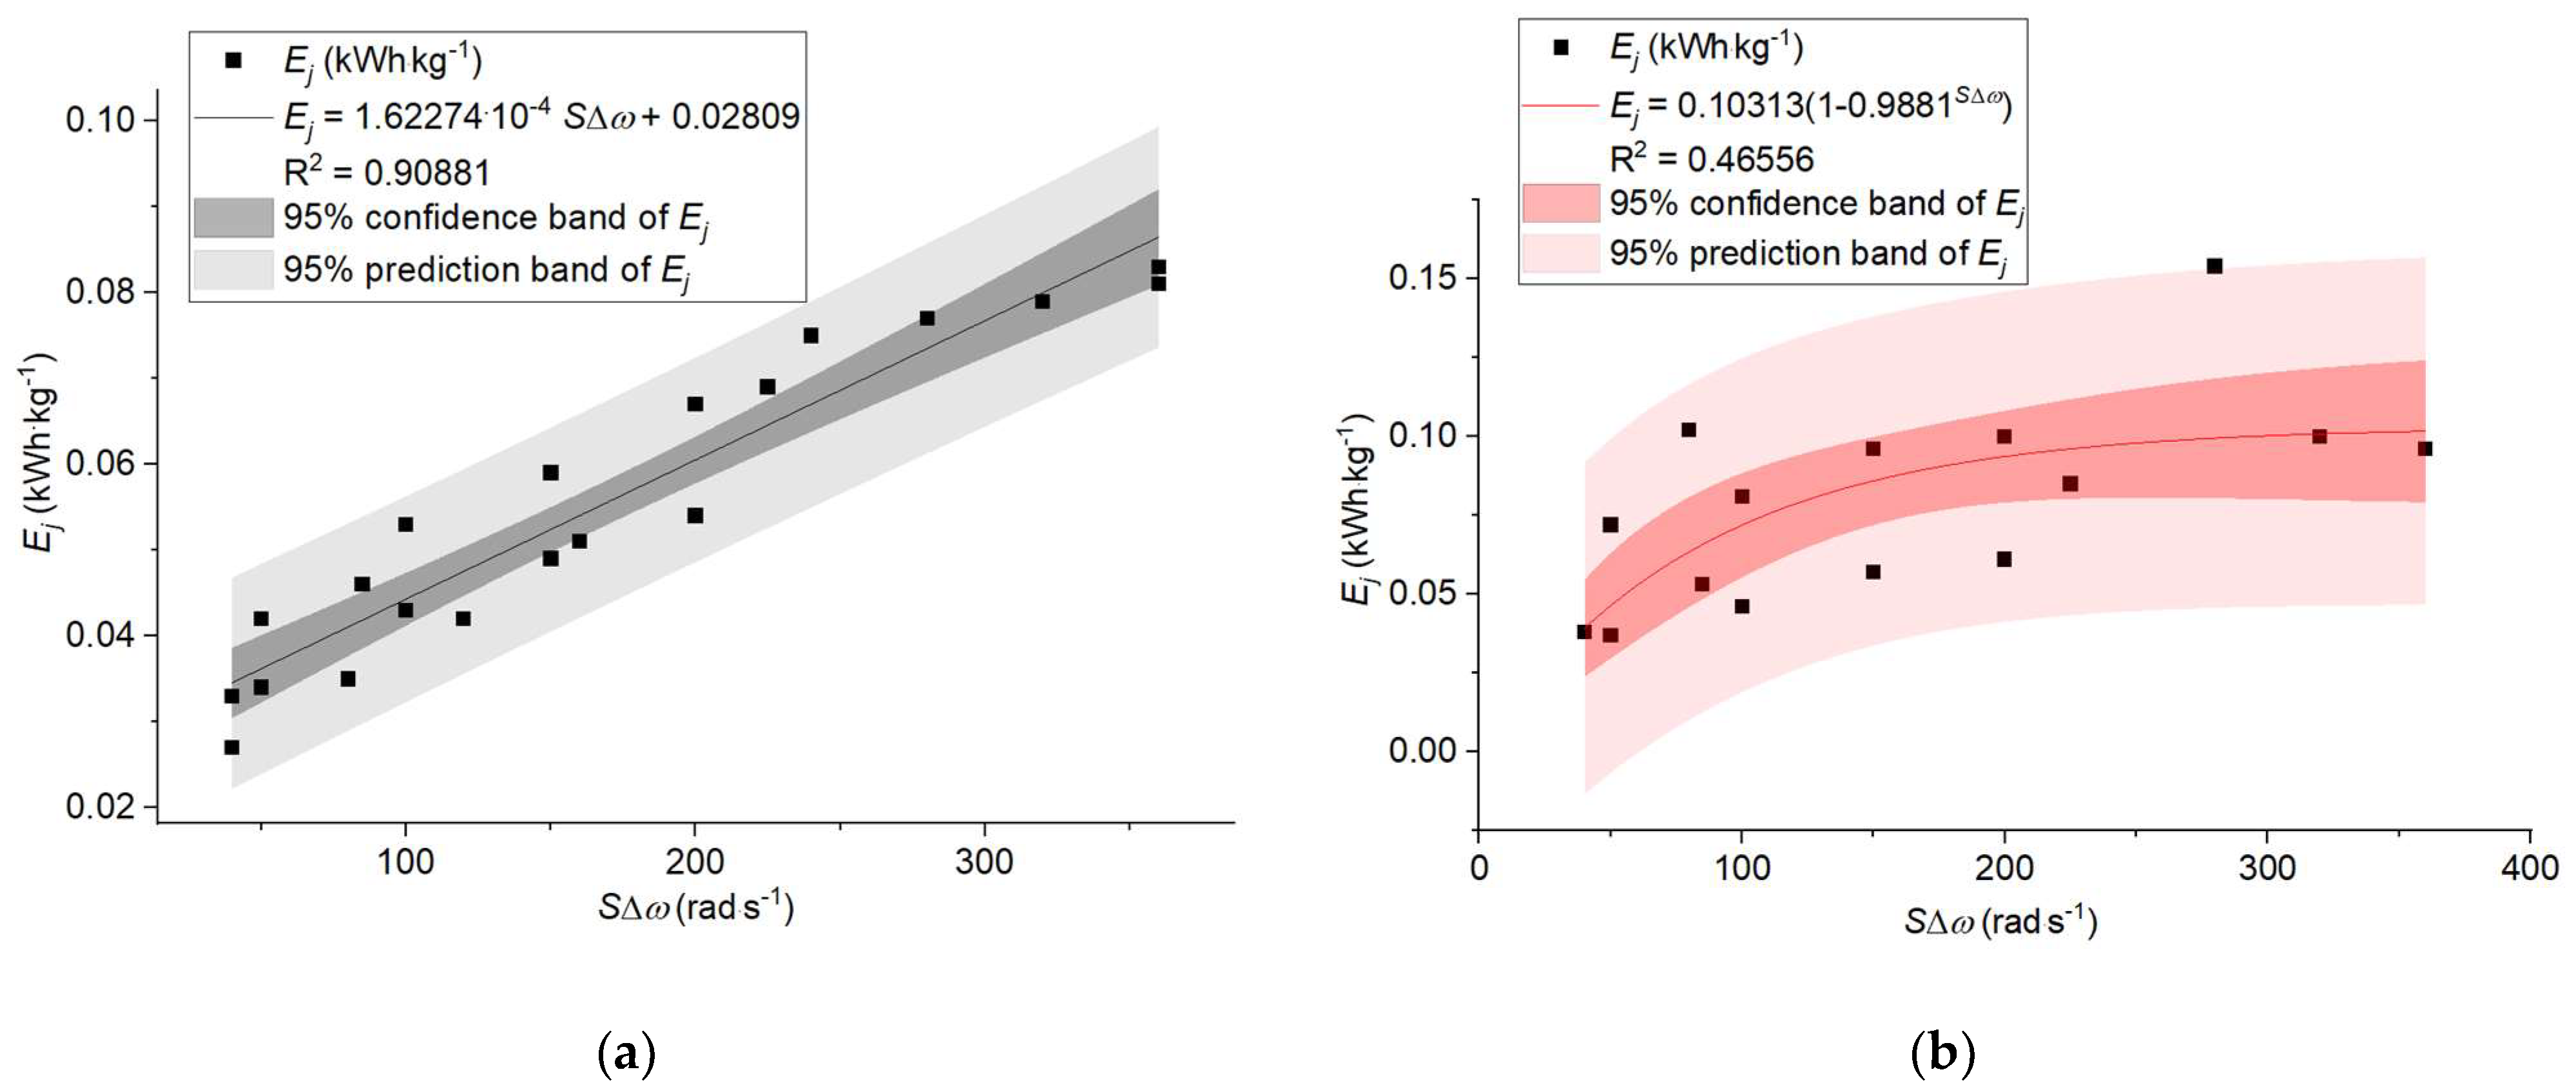
On the basis of the Shapiro-Wilk test (Appendix A, Table A1 and Table A2) and the values of skewness and kurtosis (Appendix A, Table A3 and Table A4) of the distribution of the results of the unit energy consumption tests, it was found that this distribution is approximately normal for the grinding of rice, while for the grinding of corn, it deviated from normal. Subsequently, the Pearson method was used in an analysis of correlation between unit energy consumption Ej for rice grinding and total speed increase S∆ω; whereas, in the case of corn, the Spearman method was used to assess these relations. Correlation analysis showed that there was a very strong positive correlation between the unit energy consumption Ej and total speed increase S∆ω for rice grinding (R = 0.95332, Appendix A, Table A5). In the case of corn grinding, the correlation of these two variables was moderate (R = 0.5963, Appendix A, Table A8).
An equation describing the dependence of the unit energy consumption for rice grinding as a function of the total speed increase was determined based on a linear regression analysis. It was found that the unit energy demand can be described by means of a linear model with a high match (Figure 8a).
In the case of the unit energy consumption involved in corn grinding, after the removal of outstanding values (results for settings IV3, IV4, and V1), it was the exponential model that provided the best match (Figure 8b) when compared to the others. This model was chosen on the basis of a ranking of the different nonlinear models. As a selection criterion, the value of the model match coefficient R2 (the higher the value, the better the model) and the value of the standard error of the model coefficients (the lower the error, the better the model) were used. Unfortunately, the chosen model explained the variability of the unit energy consumption as a function of the total speed increase merely partially—slightly over 46% of the variability was explained by means of the chosen function. Both the coefficients in the equations and the regression models were statistically significant (Table 6 and Table 7). The standard error of the coefficients in the equations did not exceed 12%.
The unit (specific) energy consumption depend on two factors: the energy consumed for the grinding process and the mass of grinded material, and it described the amount of energy needed for grinding one kg of material. According to [19], the unit energy consumption can be expressed as the ratio of power demand and grinding yield. For grinded materials, the dependence between the yield and discs’ total speed increase was not specified, and as it is one of the unit energy components, it influences the dependence between the unit energy consumption and the discs’ total speed increase. For corn, the yield values spread was significant; that is why the fitting is very low. The problems with the yield in the case of corn grinding was presented in Section 3.1.2 and was also reported in the previous study [28].

3.1.4. Fragmentation Degree

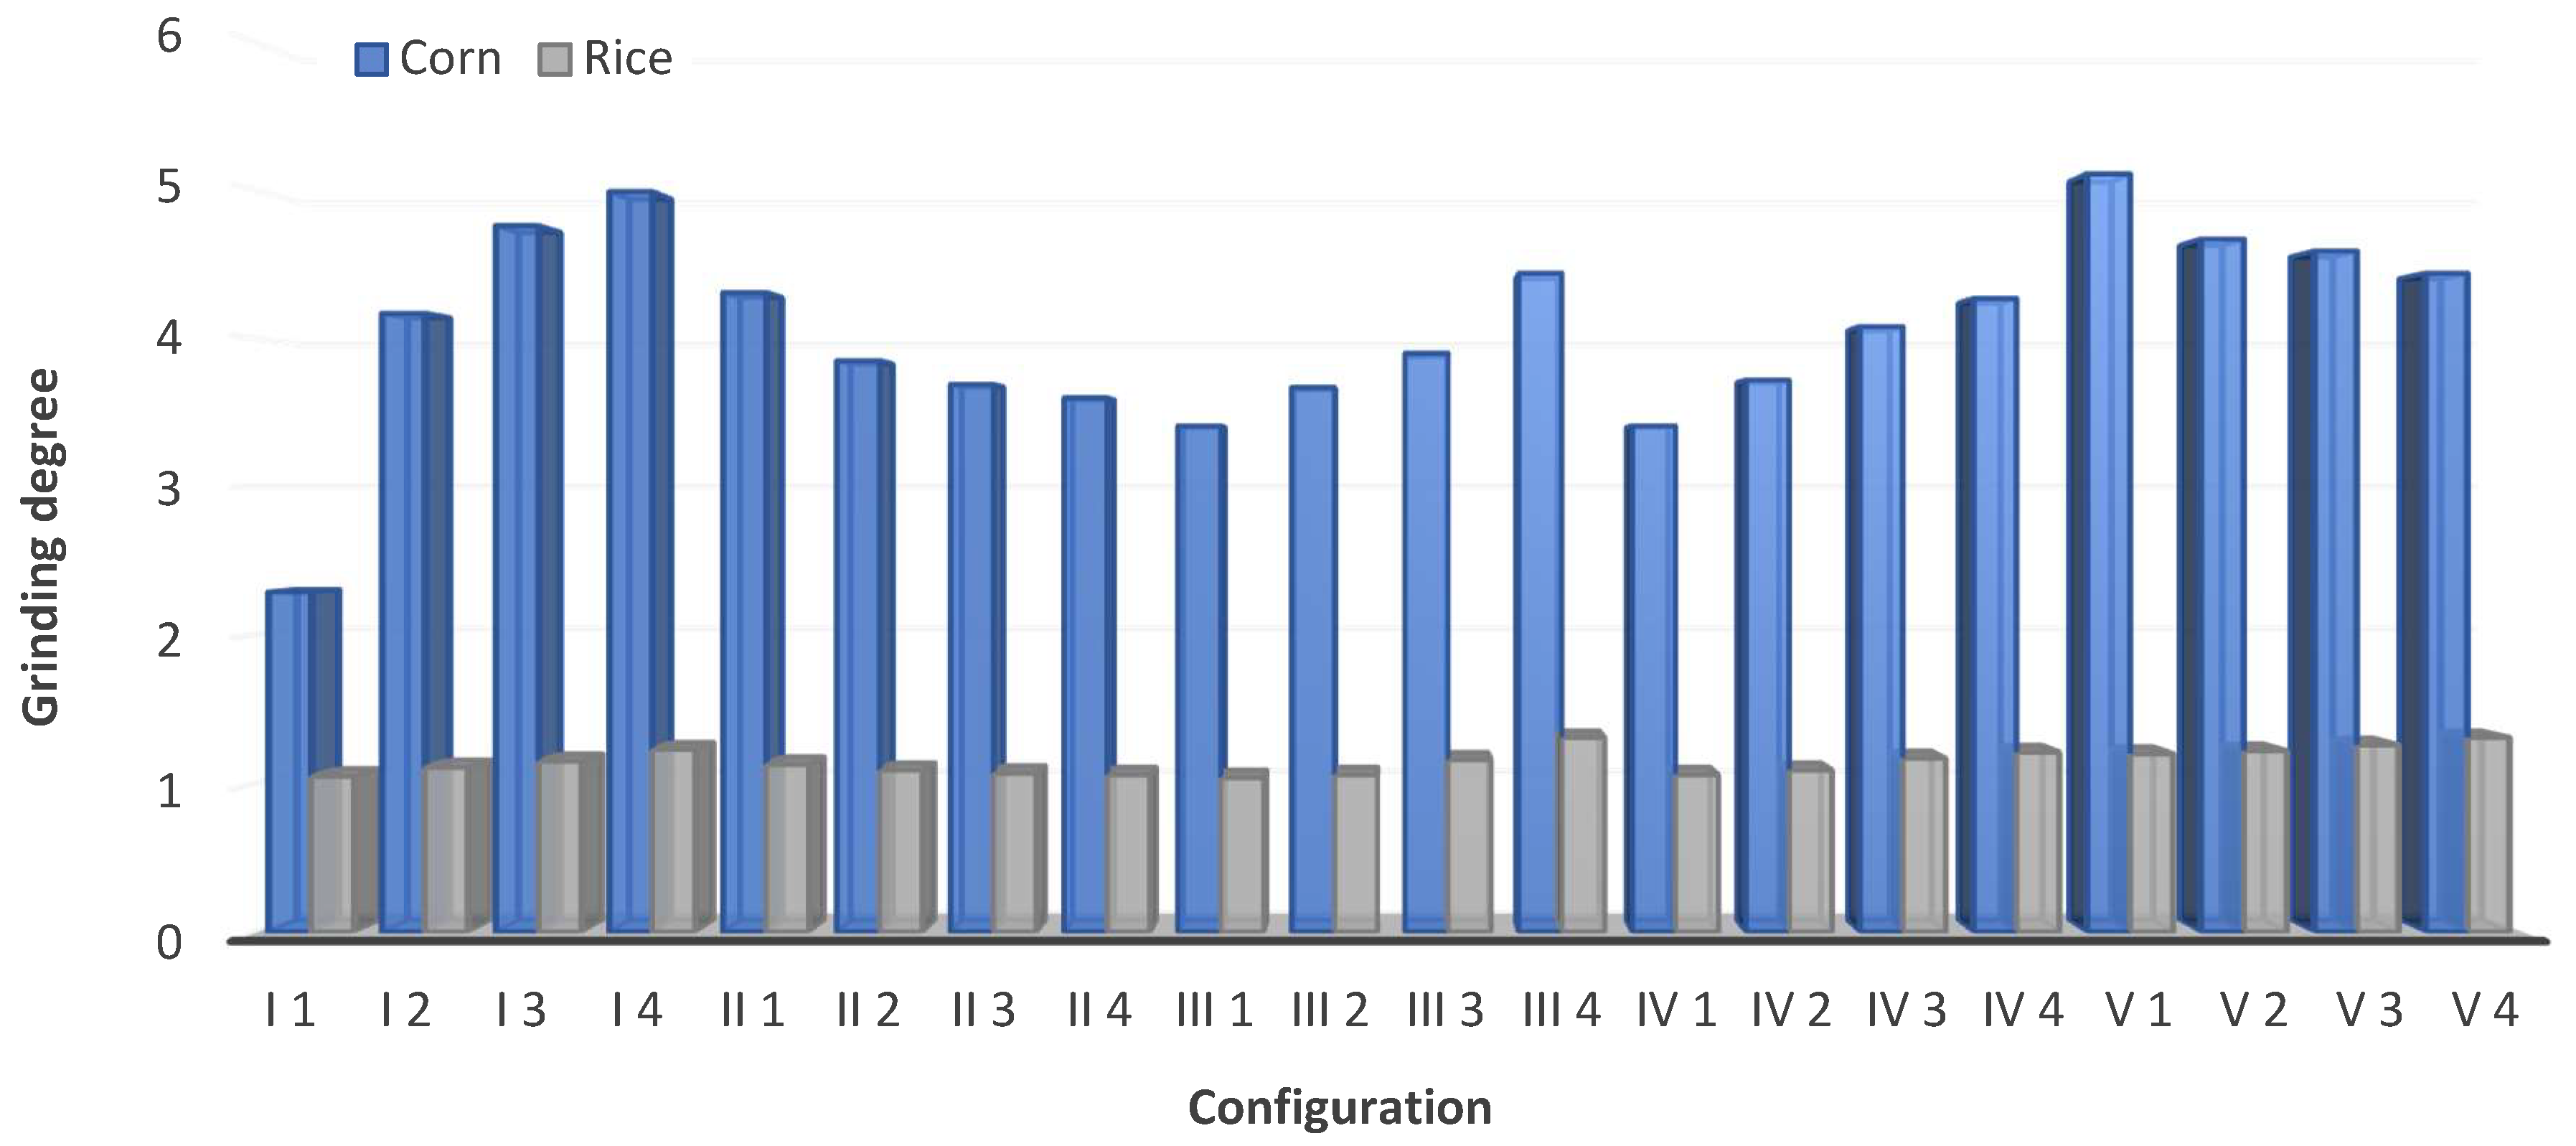
Figure 9 shows the test results of rice and corn grain fragmentations at 80% after grinding on a five-disc mill. A higher fragmentation degree was found for corn grain grinding for all analyzed disc angular speed settings (Figure 9), which was connected with the ratio of the grain dimension and the inter-disc gap. The grains of rice and corn had similar average dimensions in all tests, and this value depended on the value of the inter-disc gap—the size of a particle after grinding will always be smaller than the gap. Due to the fact that the characteristic size of corn grains was bigger before grinding than the size of rice grains (Table S1 and Table S2 in the Supplementary Materials) and their dimensions decreased down to those comparable to rice grains, the fragmentation degree of the corn grains was higher. It was observed, like in other studies [5,26], that for grinding bigger particles (corn has bigger particles than rice), the energy consumption is higher. It was also reported that the higher the disc speed (so the contacts between materials and cutting edges are more intensive), the grinding product has smaller particles [4,84]. On the basis of the Shapiro-Wilk test (Appendix A, Table A1 and Table A2) and the values of the skewness and kurtosis (Appendix A, Table A3 and Table A4) of the distribution of the grinding results, it was found that this distribution is approximately normal for both rice and corn grinding. Subsequently, the Pearson method was used in an analysis of the correlation between the grain fragmentation degree i80 and summary speed increase S∆ω. Correlation analysis showed that there was a very strong positive relation between the rice fragmentation degree i80 and the total speed increase S∆ω (R = 0.93237, Appendix A, Table A5). In the case of corn grinding, the positive correlation between these two variables was moderate (R = 0.6893, Appendix A, Table A6).
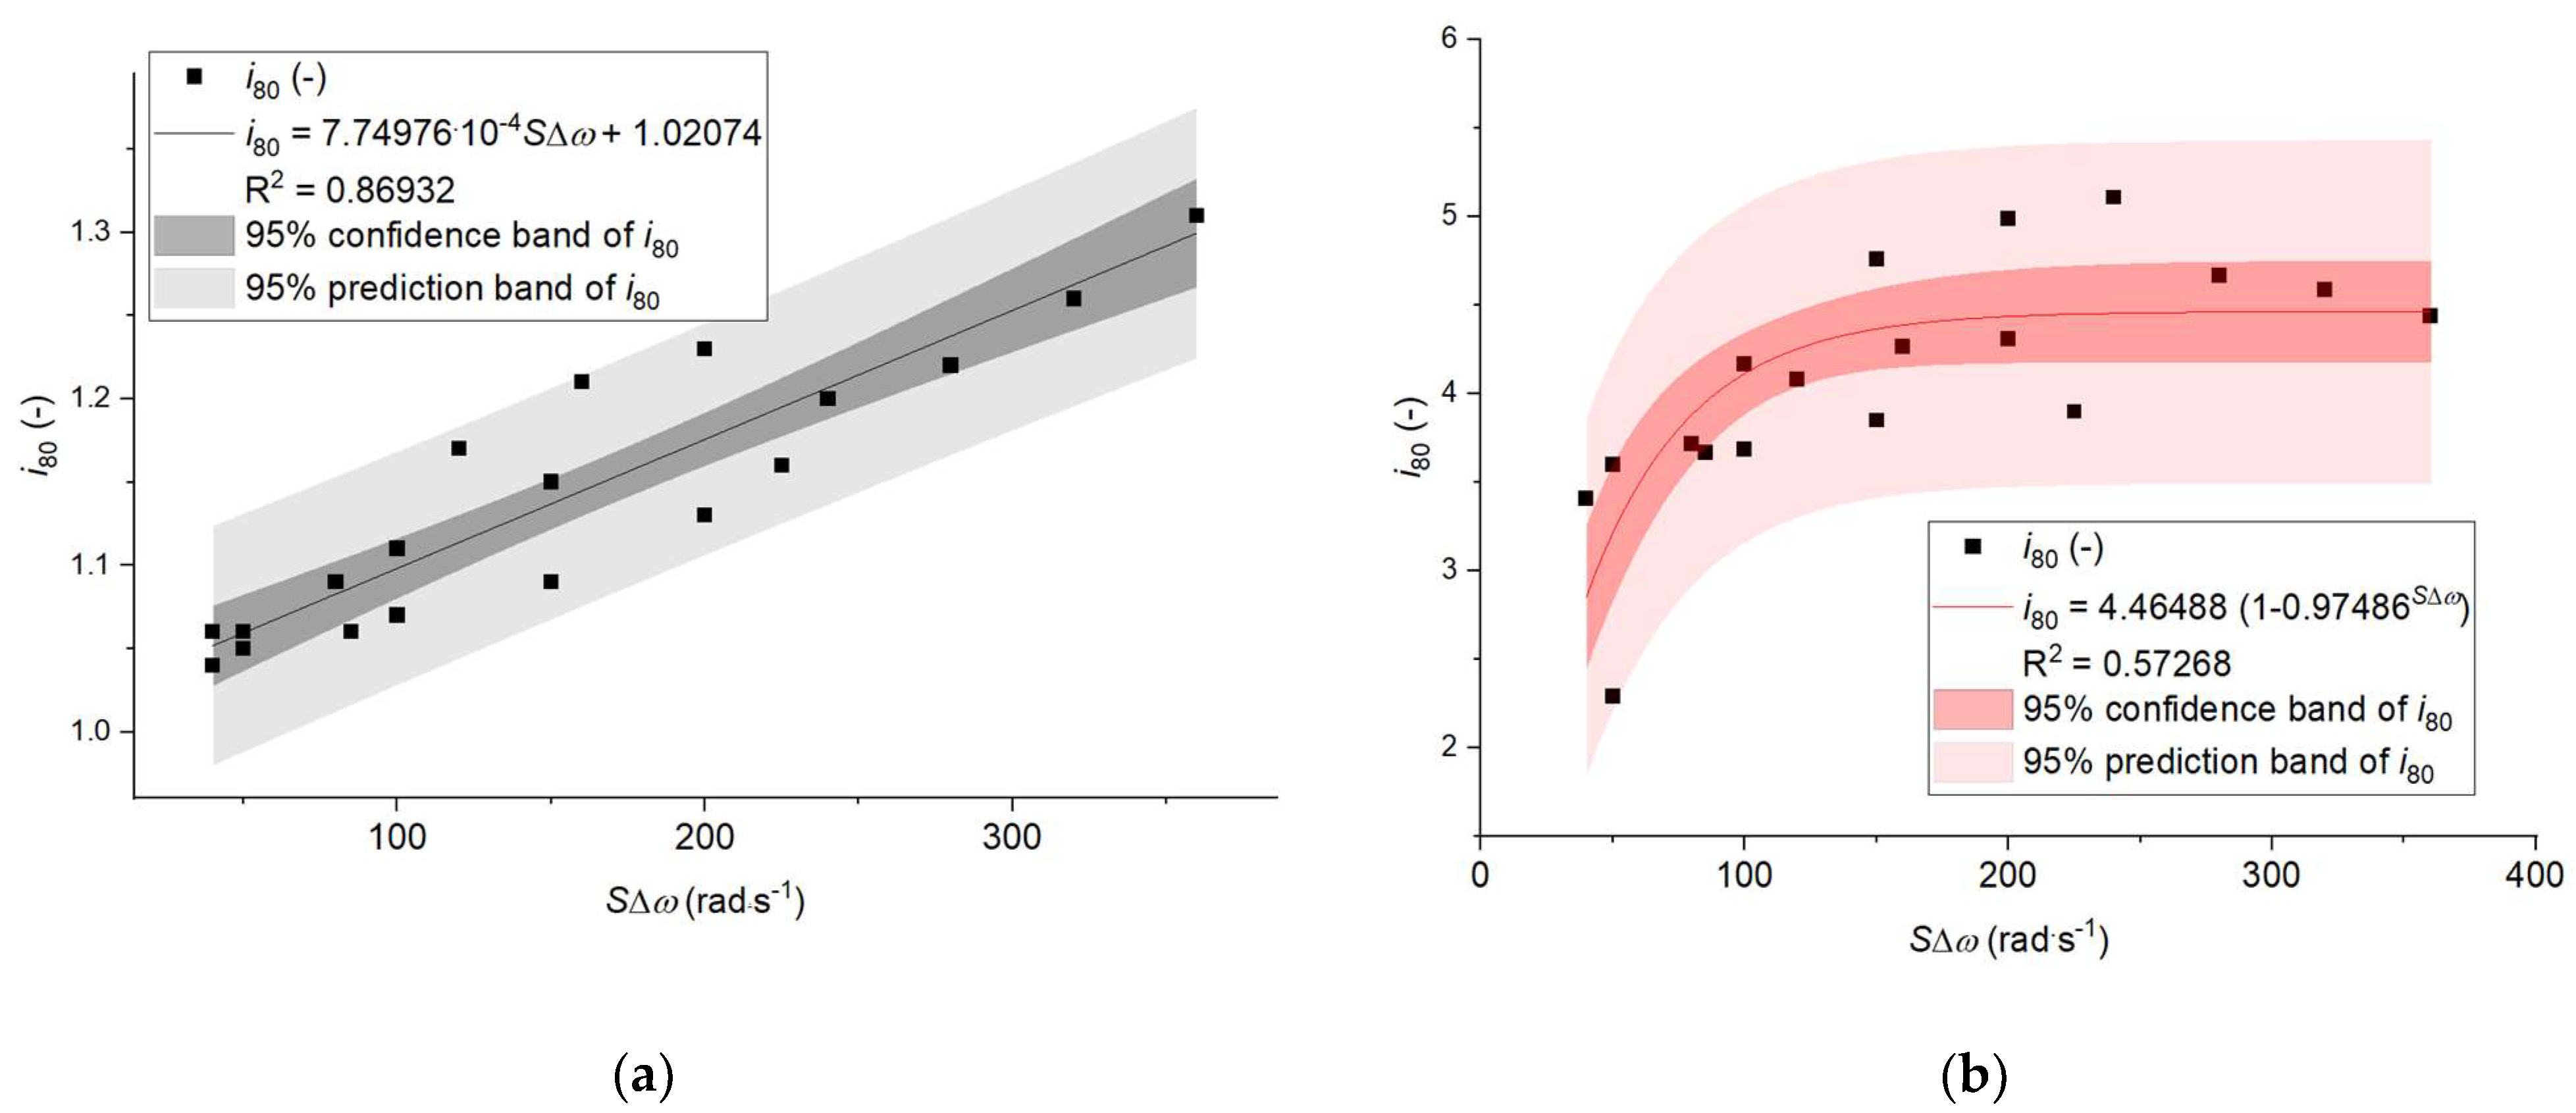
The equation describing the dependence of an 80% degree of rice fragmentation as a function of the total speed increase was determined based on an analysis of linear regression. It was found that an 80% fragmentation degree can be described with a high match by means of a linear model (Figure 10a). The obtained linear model was able to provide a 90% explanation of the fragmentation degree as a function of the total angular speed increase S∆ω.
For the case of the 80% fragmentation degree of corn, the linear model explained the fragmentation degree changes as a function of the total speed increase S∆ω only to a small extent (R2 = 0.47513). Thus, the decision was made to check nonlinear models. As in the case of the unit energy demand, a ranking of models which took into account the value of the match coefficient R2 and the value of the standard error of the model coefficients was used. It was the exponential model which best explained the highest percent of the 80% corn fragmentation degree variability as compared to the other models (Figure 10b). Unfortunately, the chosen model did not sufficiently explain the variability of the 80% fragmentation degree as a function of the total speed increase. Both the coefficients in the equations and the regression models themselves were statistically significant (Table 8 and Table 9). The standard error of the coefficients in the equations did not exceed 10%.

3.2. Analysis of the Integrated Energy Consumption Results

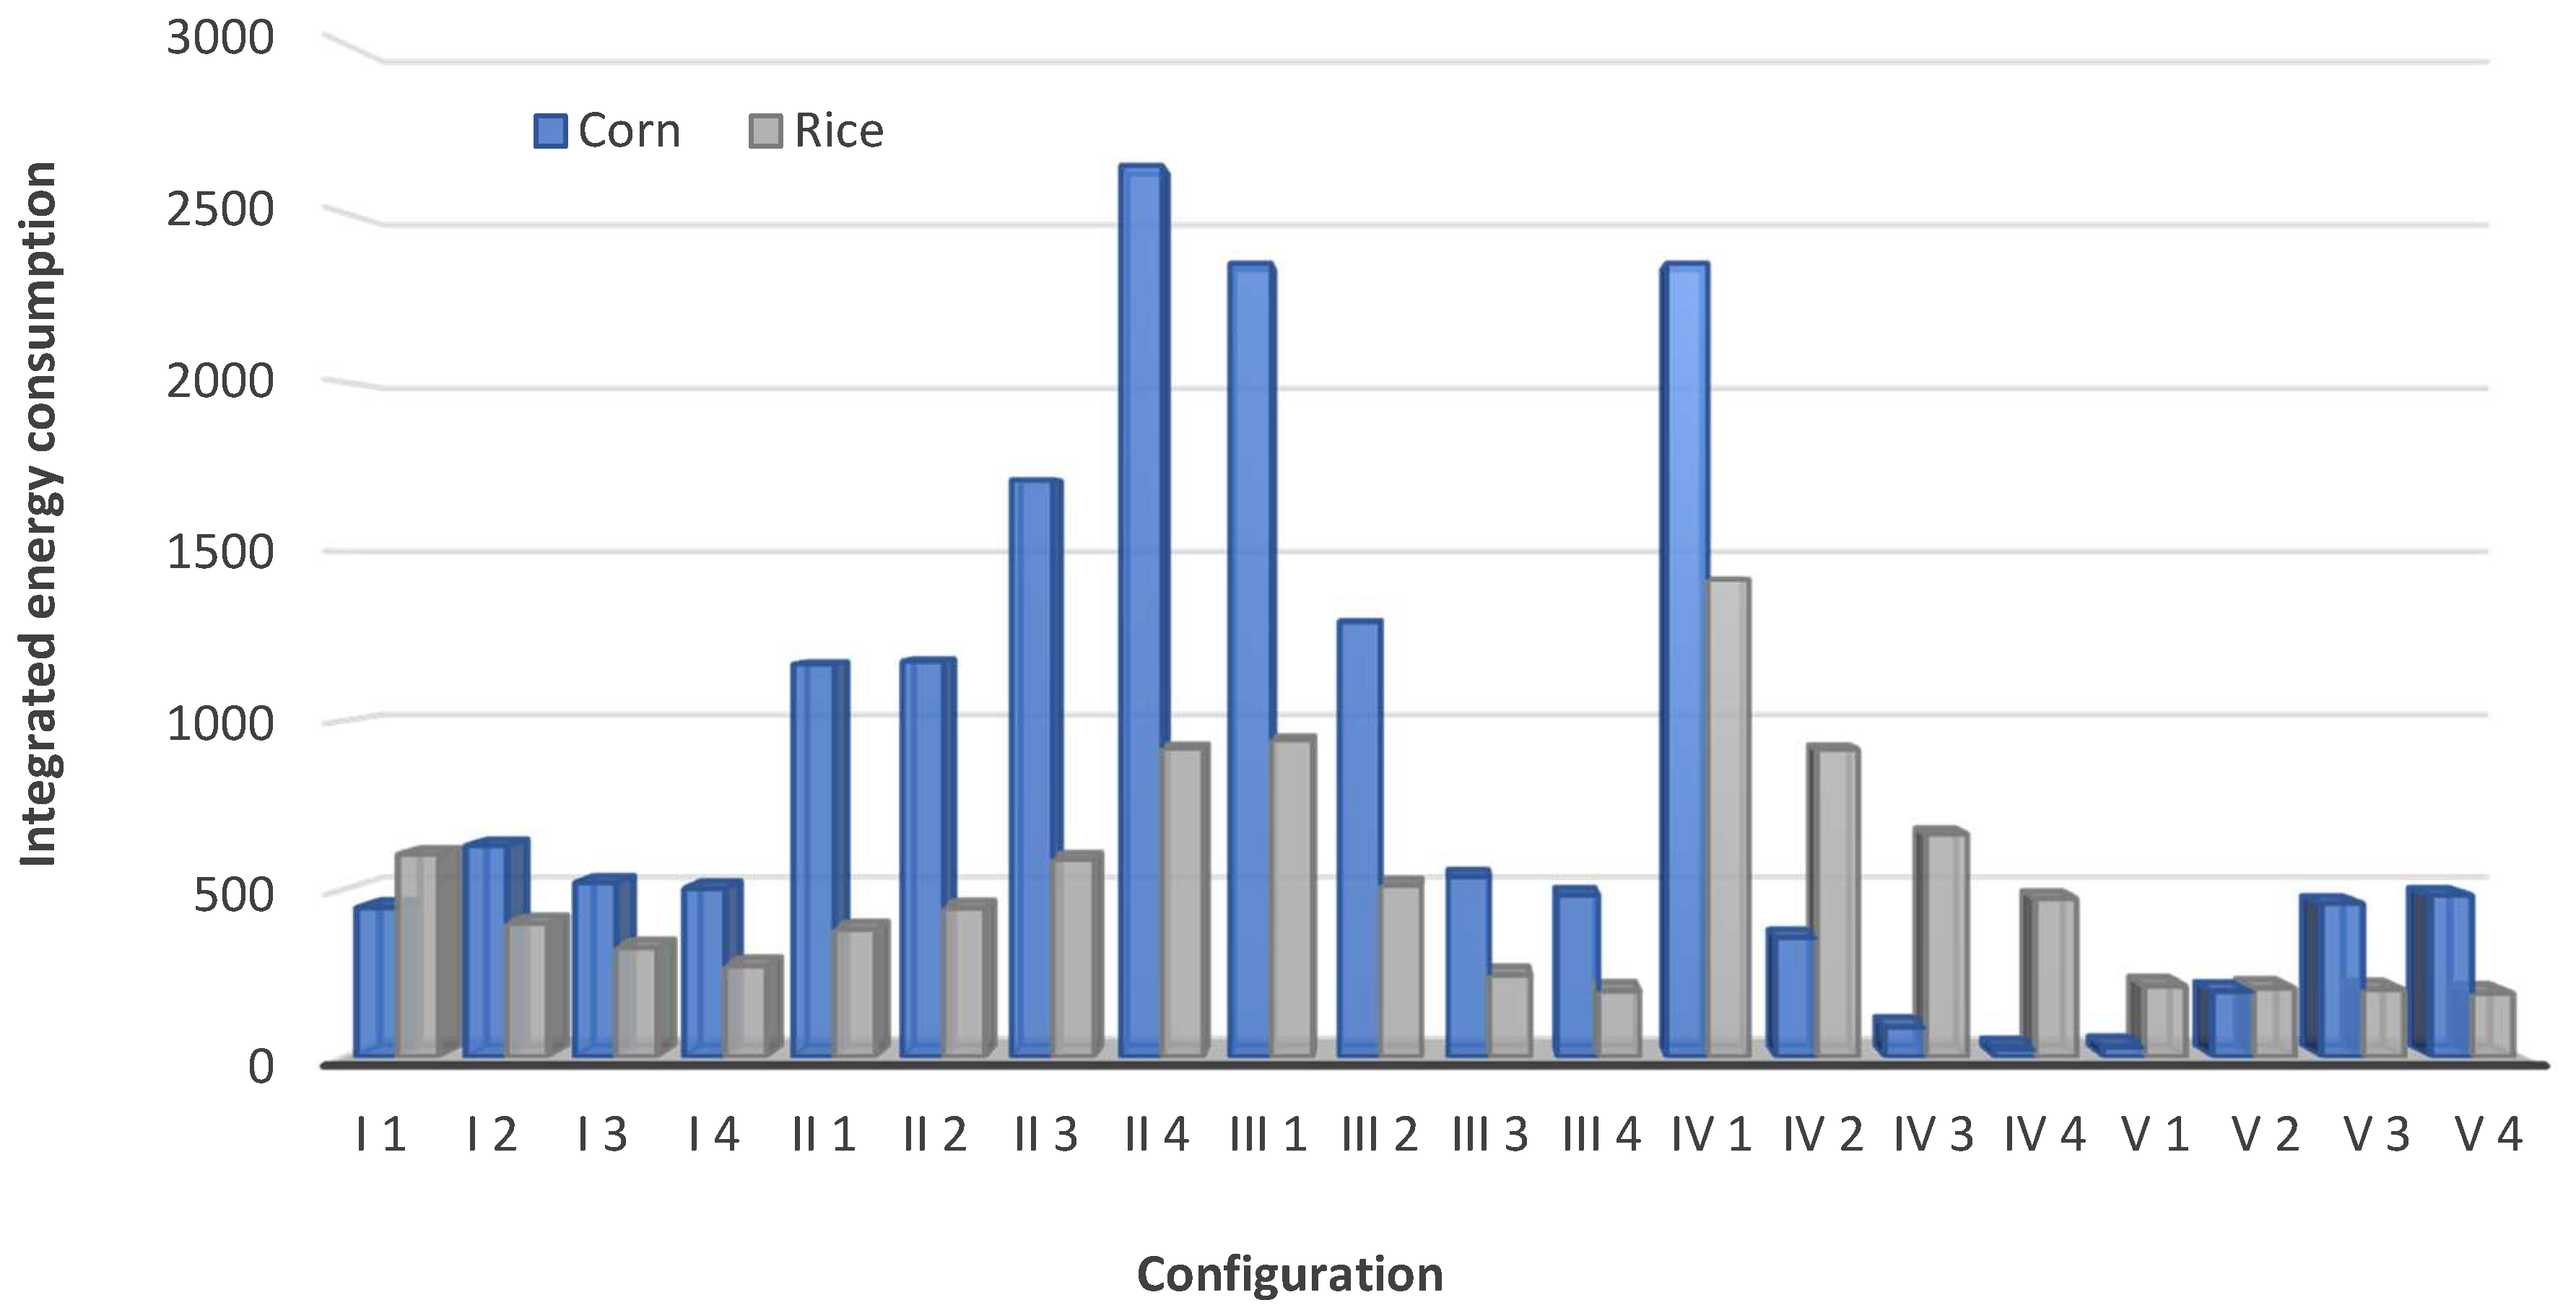
The next step of the tests involved an analysis of the integrated energy consumption for rice and corn grain comminution. Figure 11 shows the results of the integrated energy consumption tests for both grains. In the case of corn, the highest values of the integrated energy consumption were found for setting no. 4 with RP II and, next, for setting no. 1 with RP III and setting no. 1 with RP IV. For rice grinding, the highest values of the integrated energy consumption were found for setting no. 1 in RP IV and, next, for setting no. 1 in RP III, setting no. 4 in RP II, and setting no. 2 in RP IV.
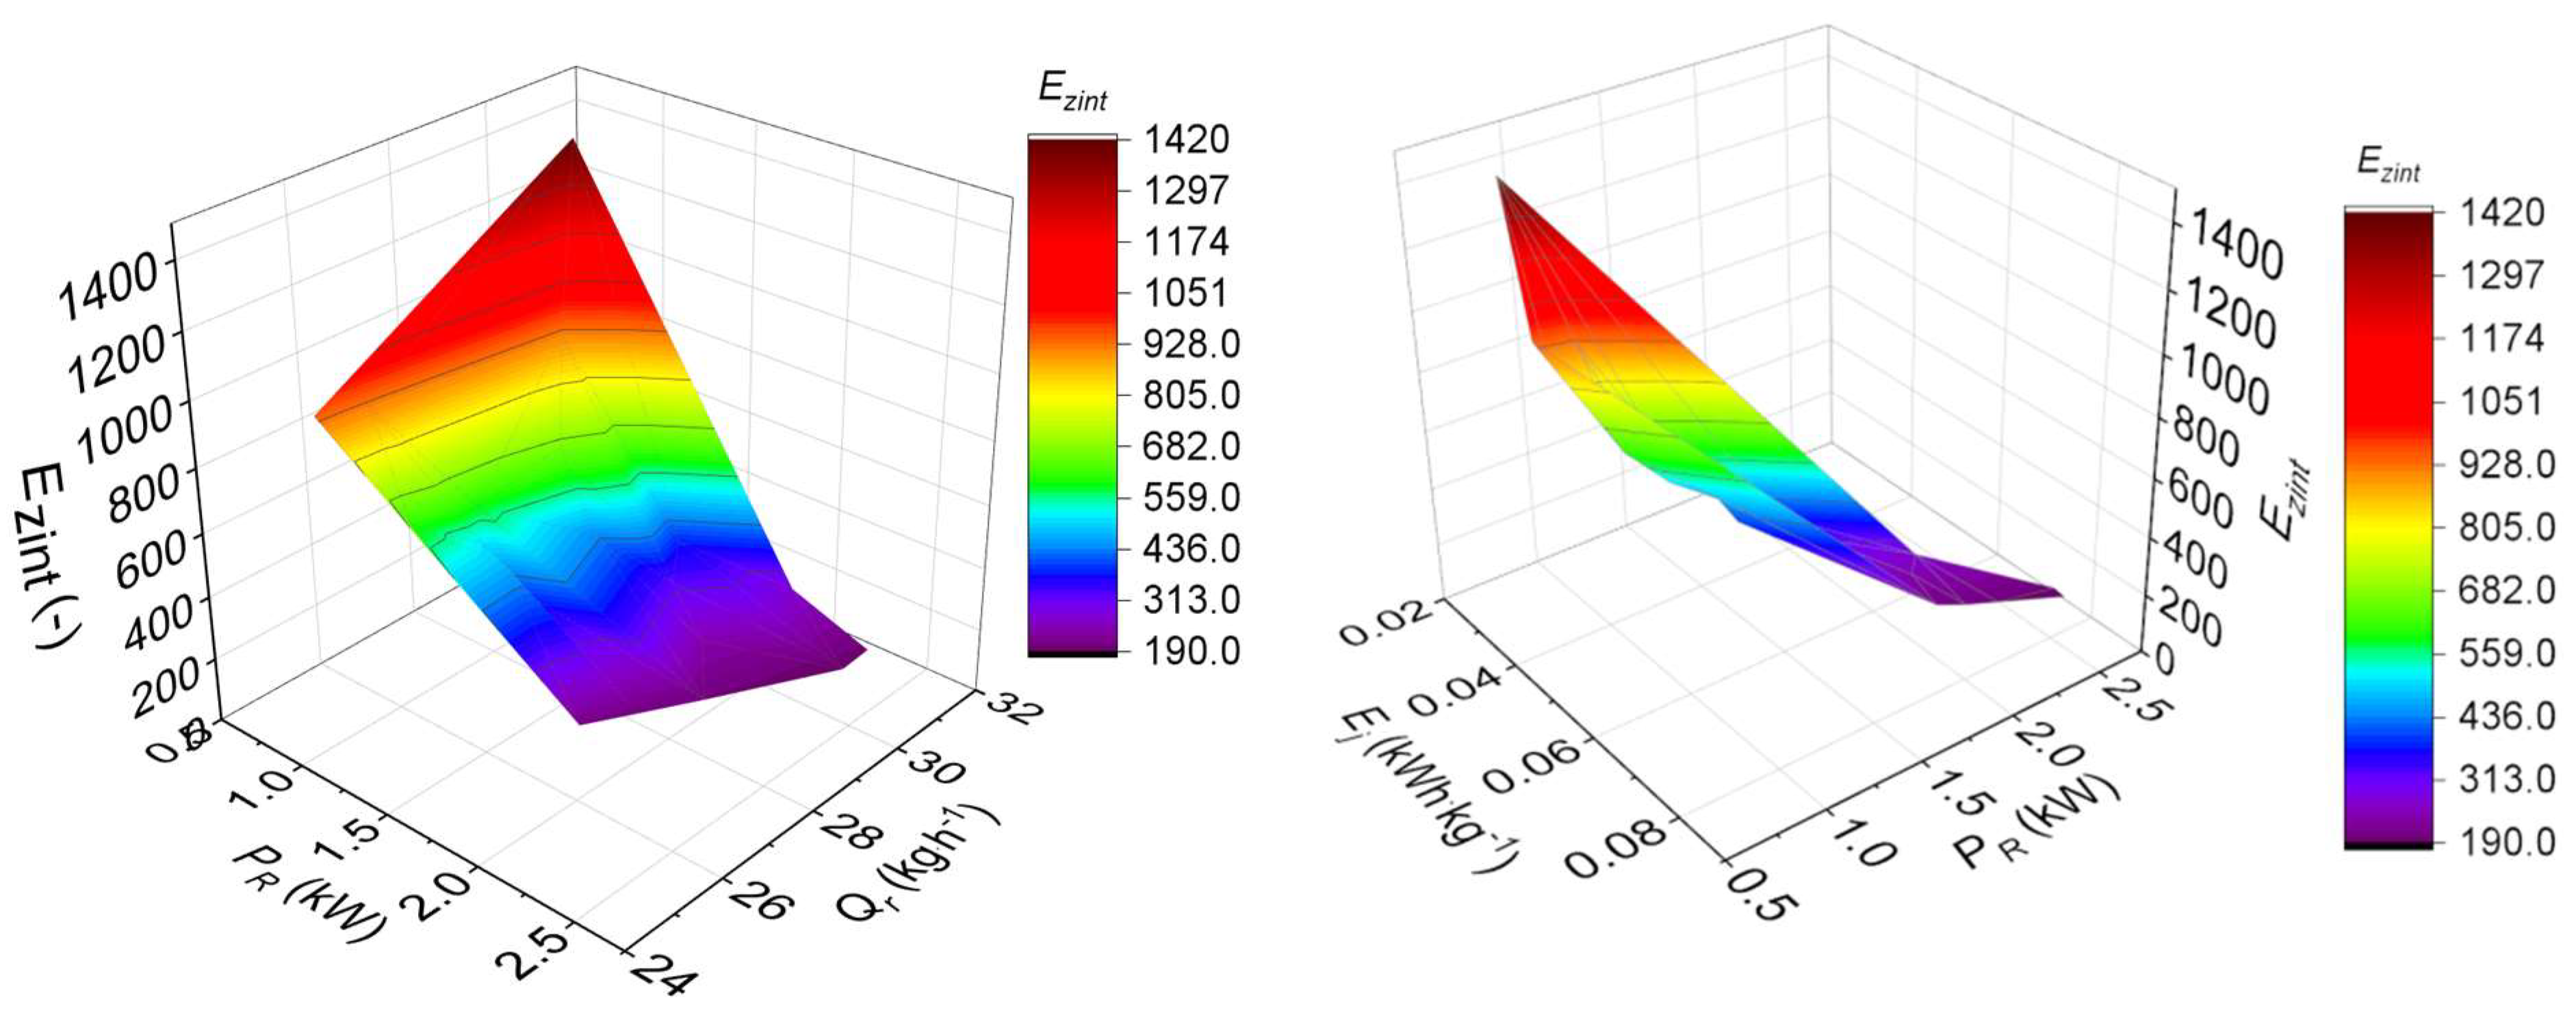
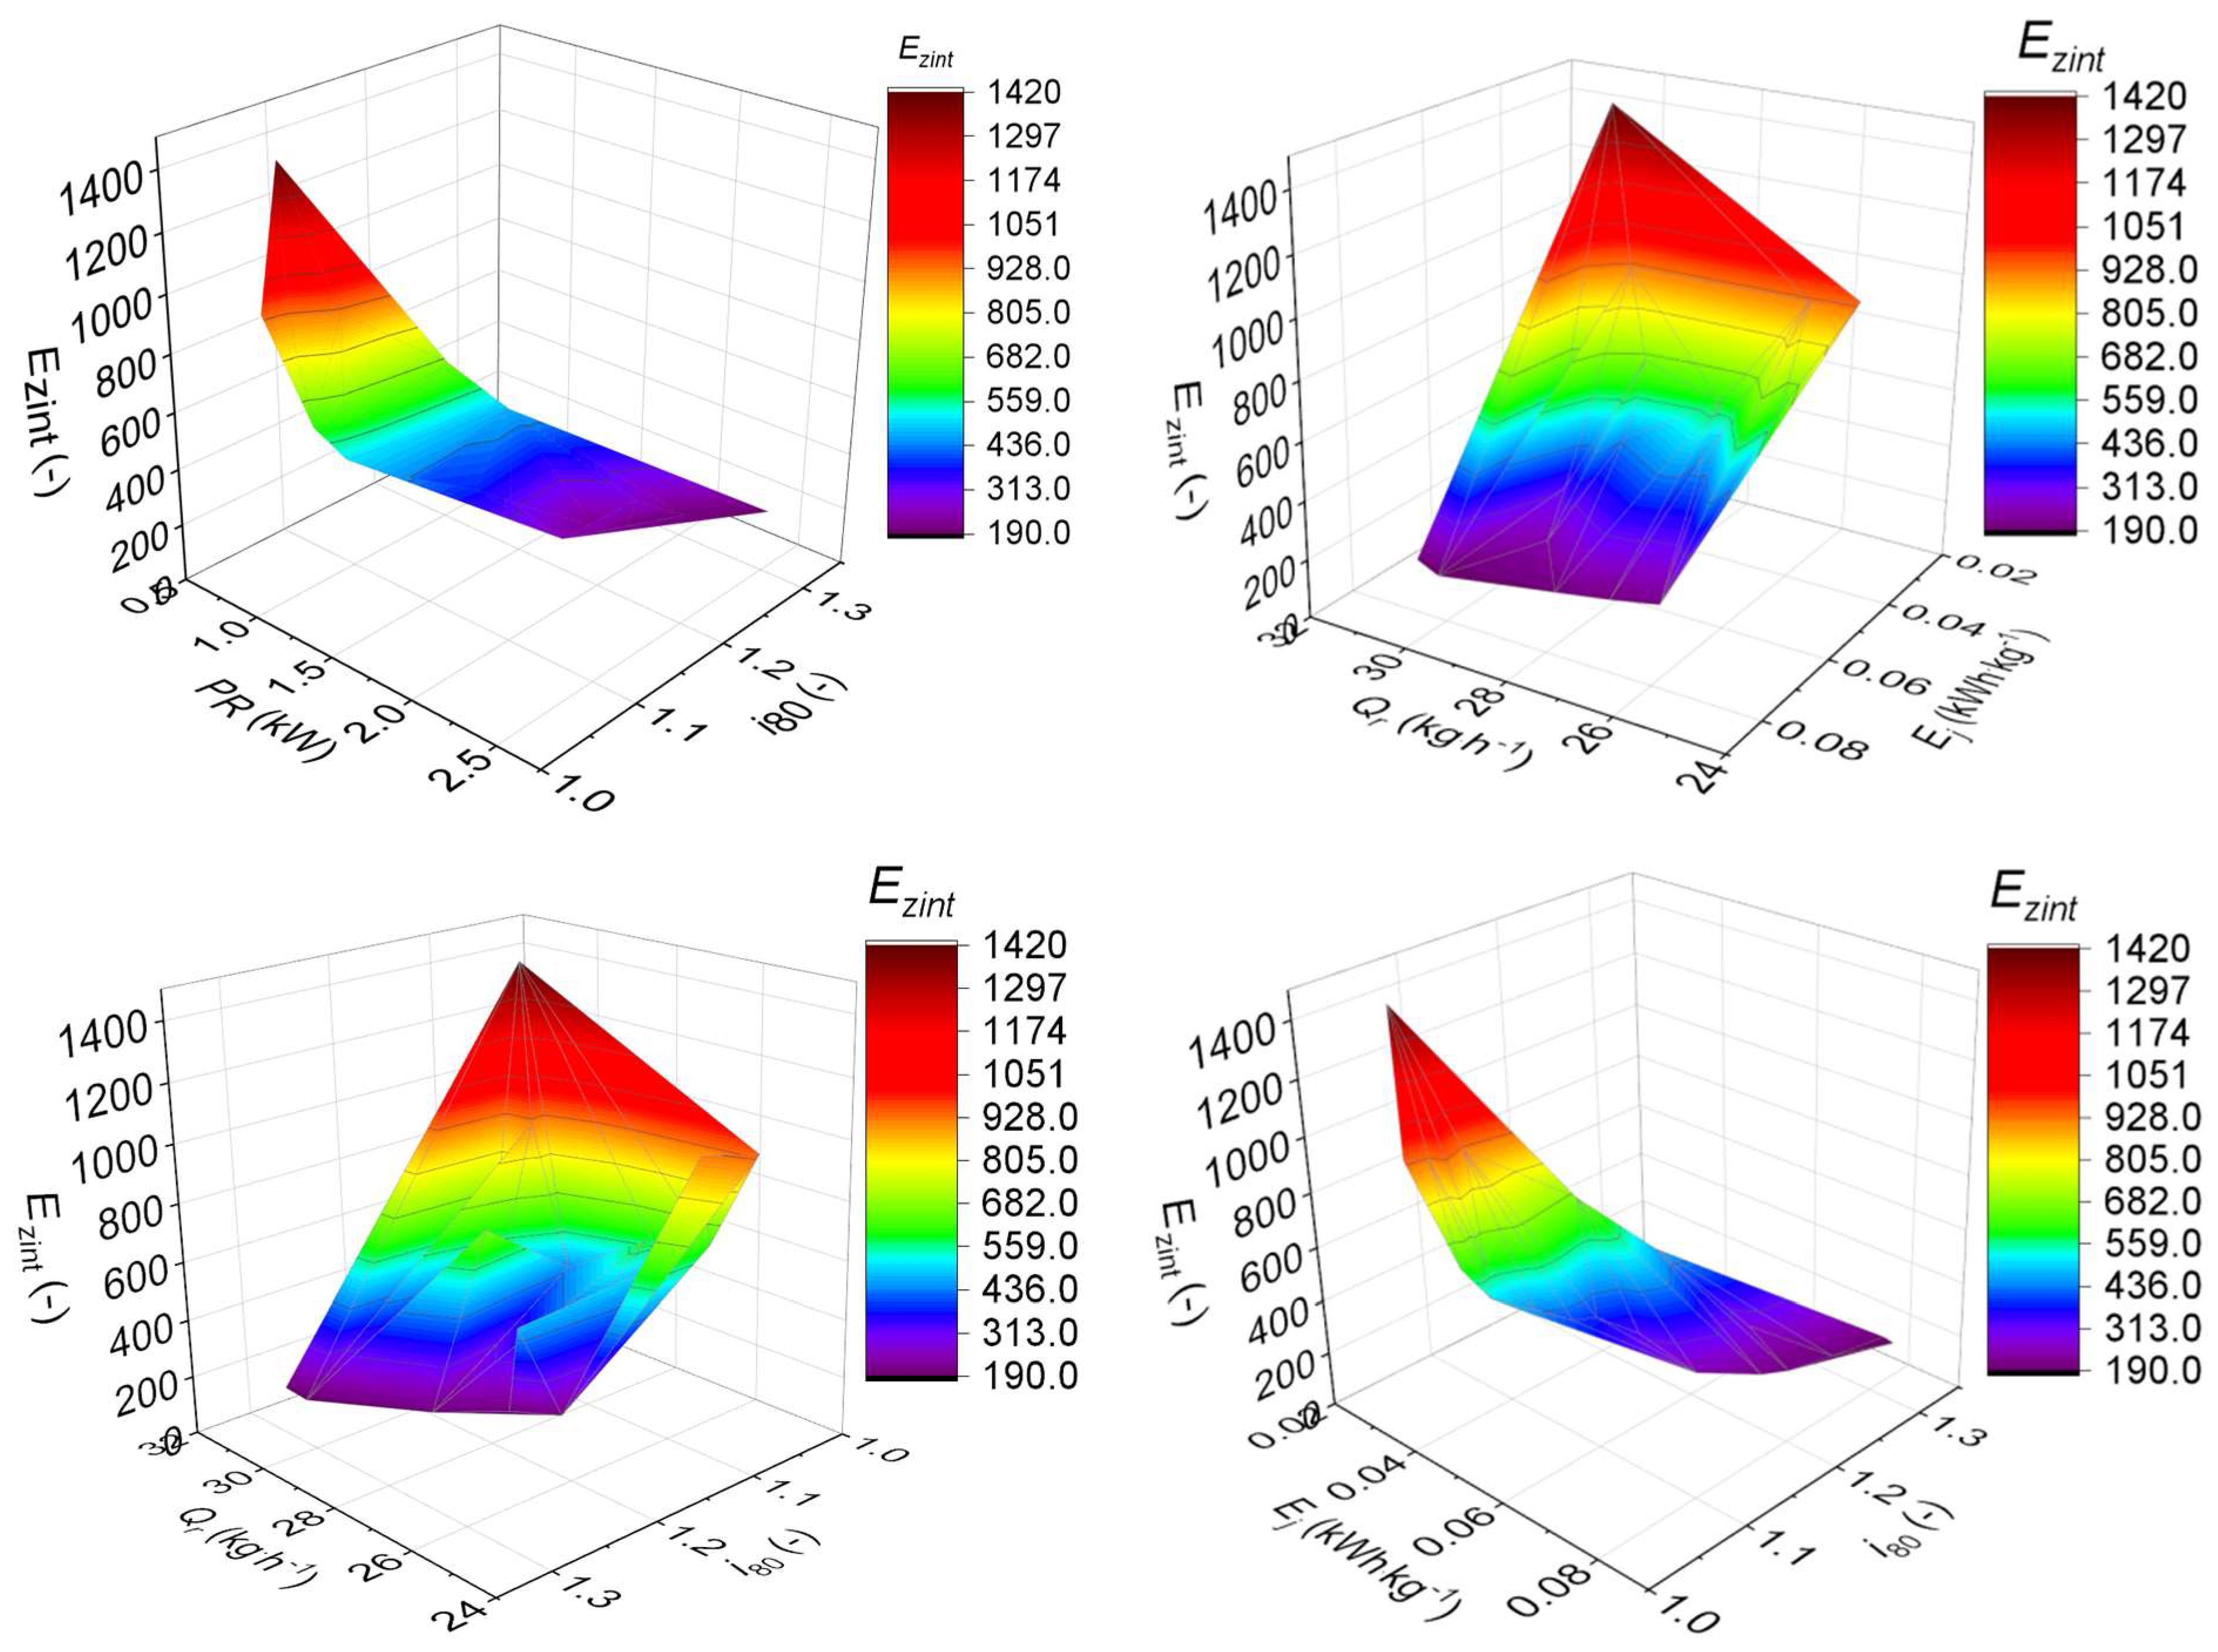
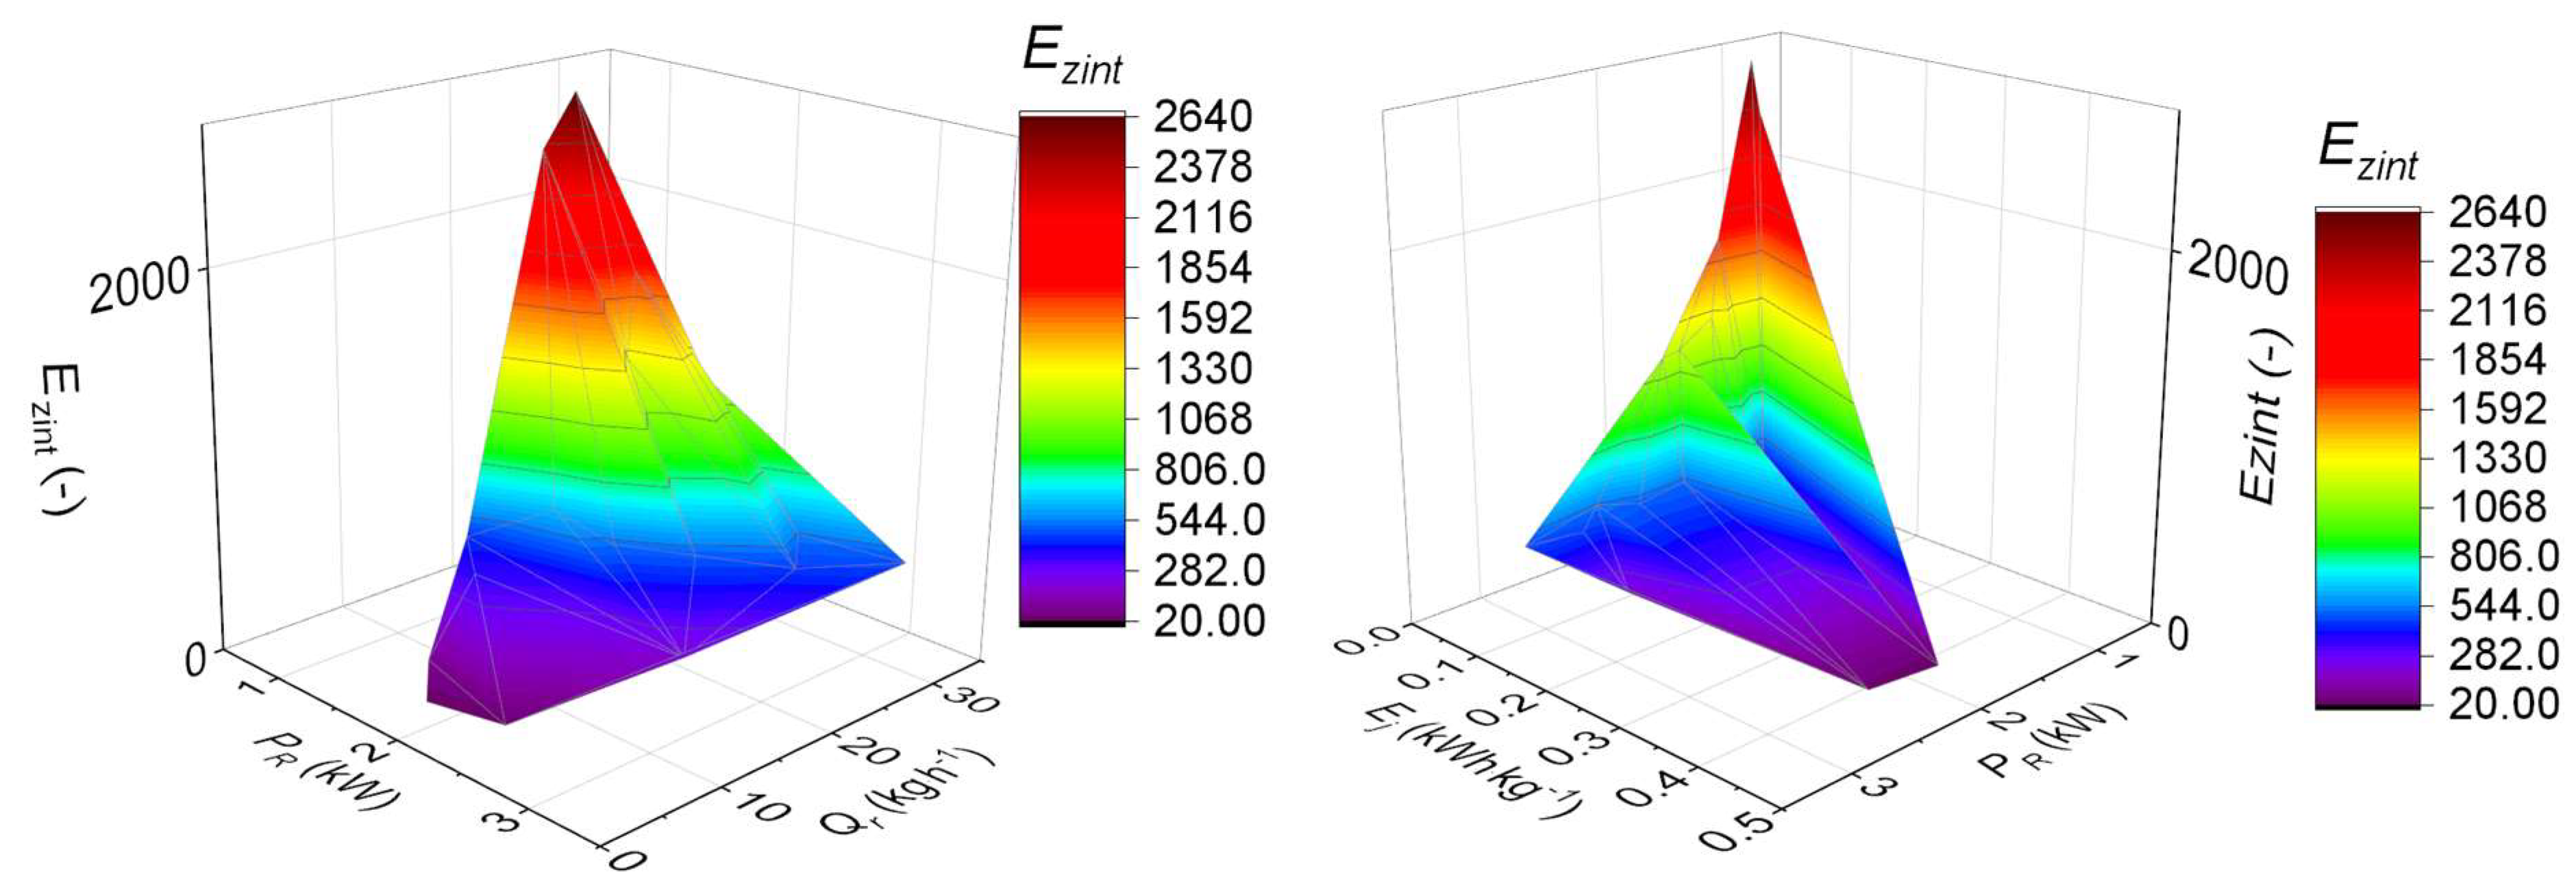
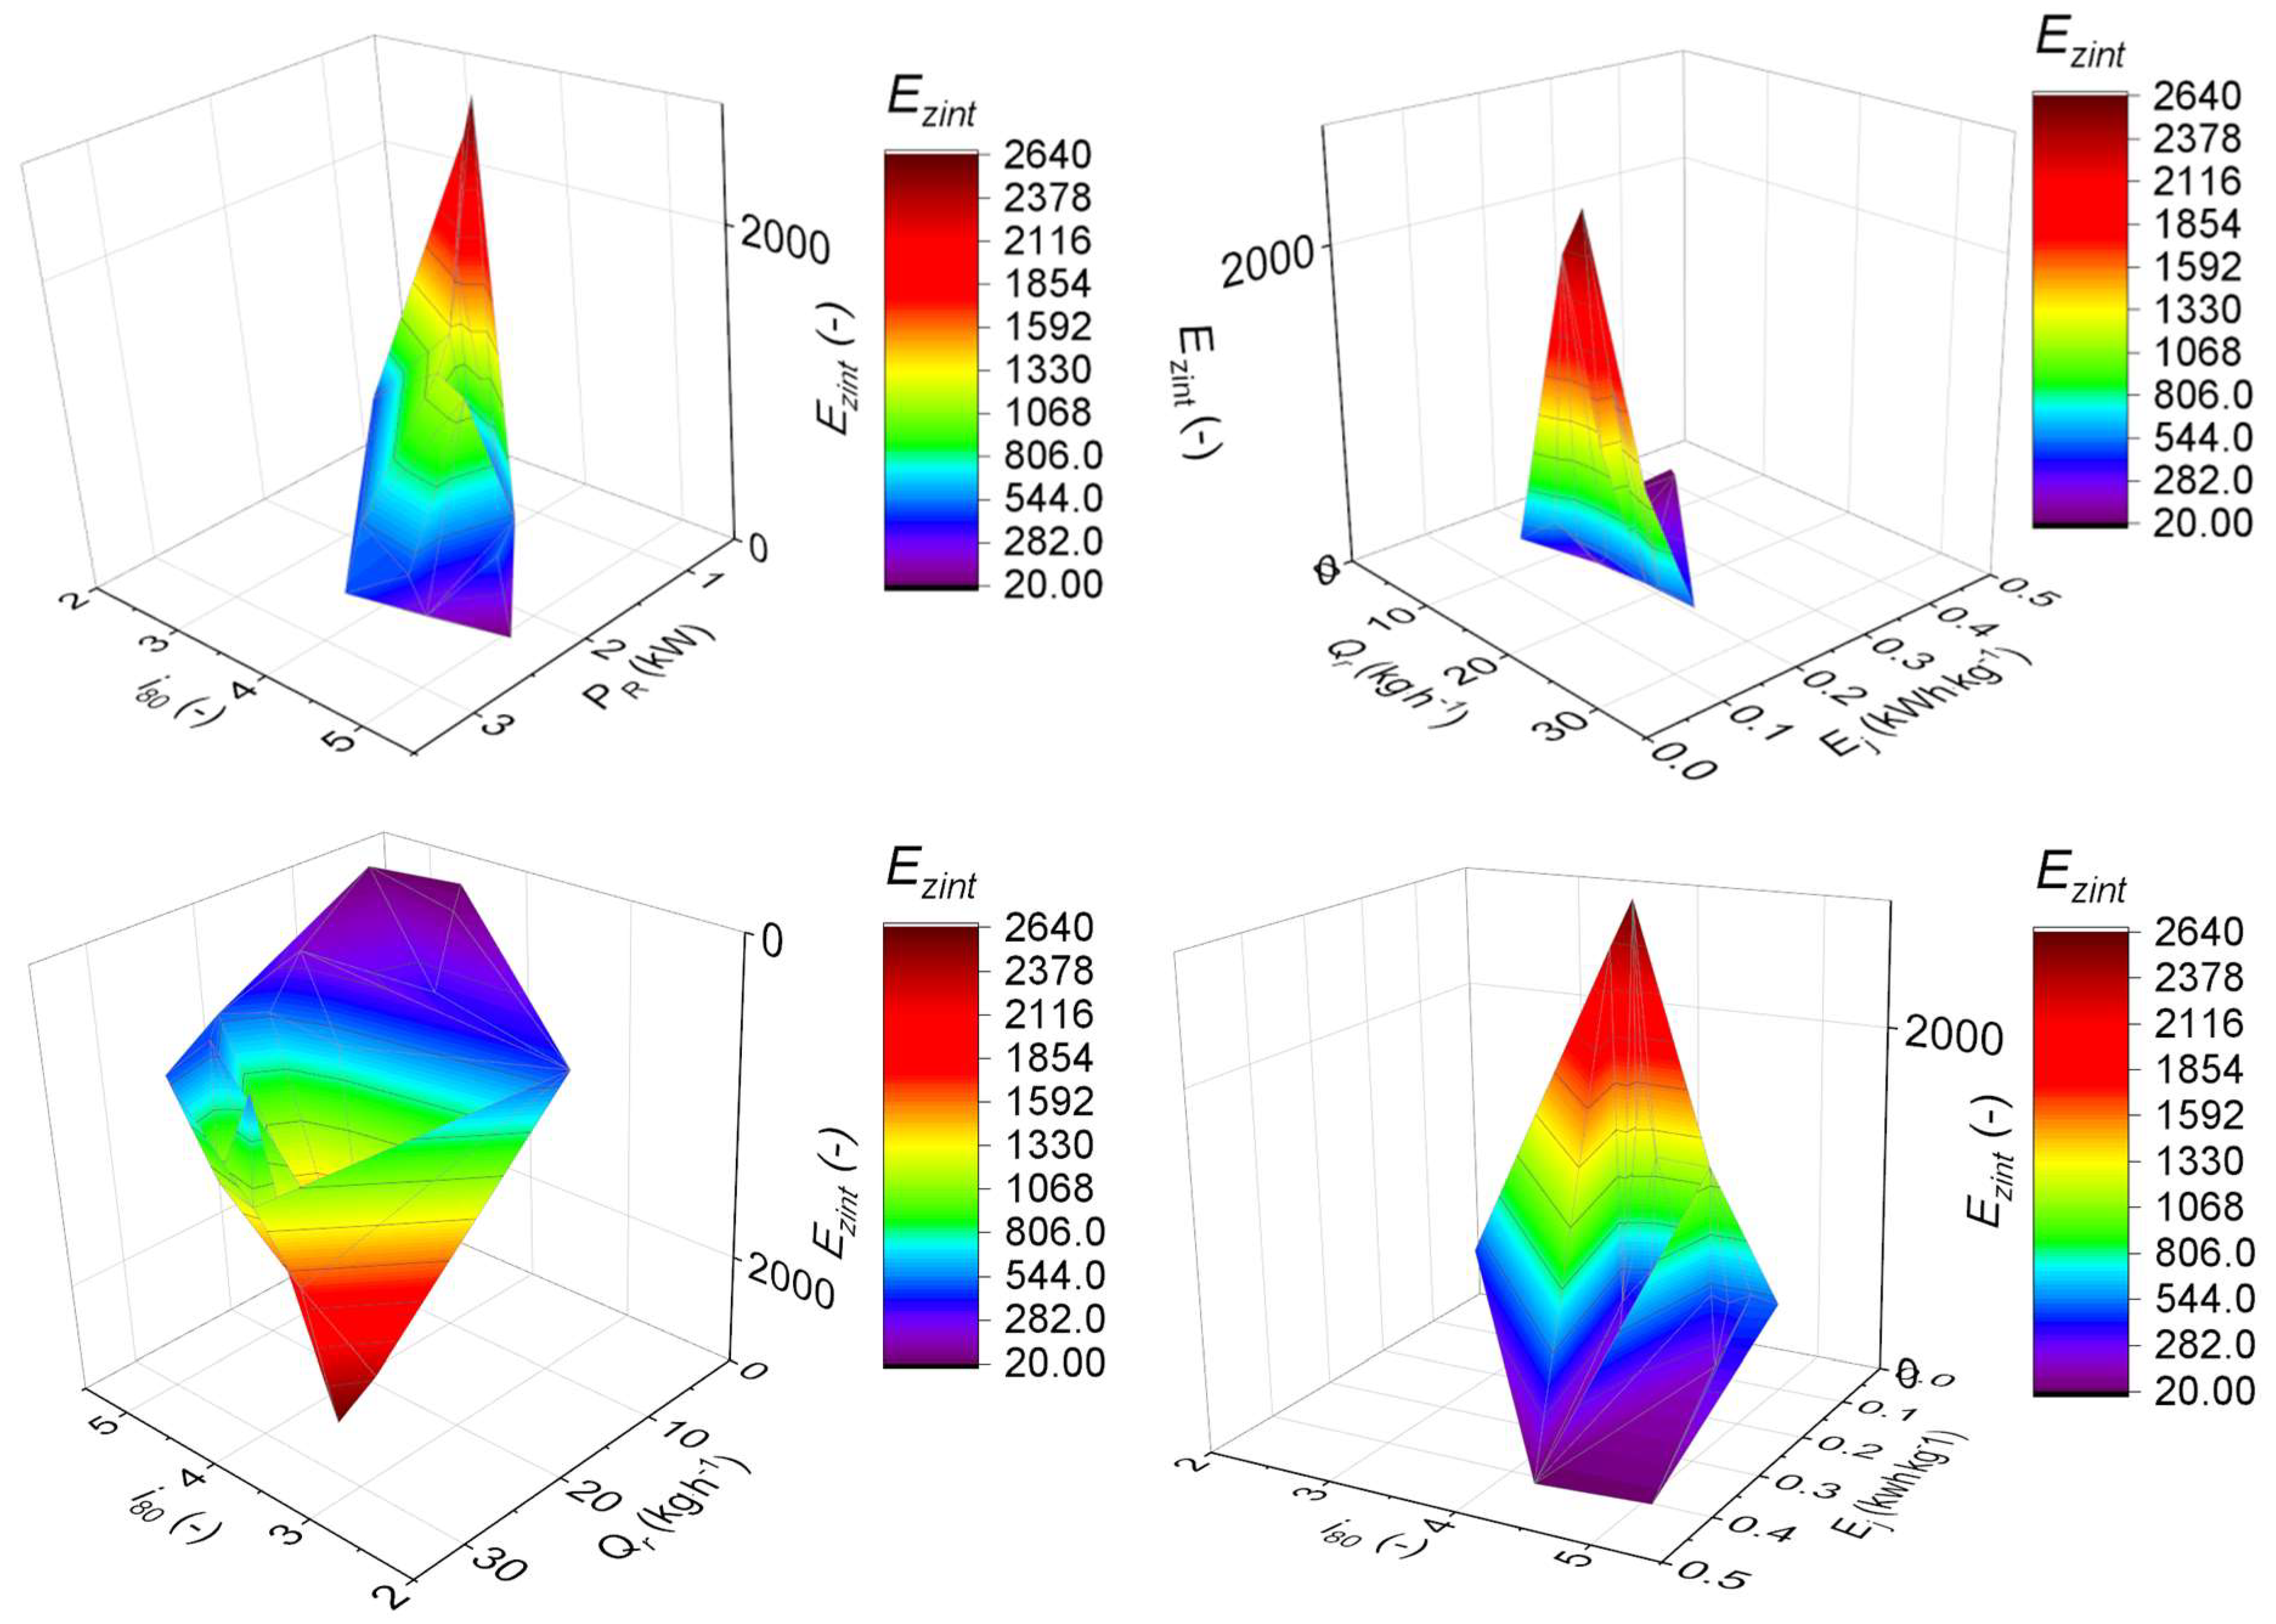
An analysis of the relations between the integrated energy consumption made it possible to determine the yield ranges, power consumption, unit energy consumption, and fragmentation degree for which the integrated efficiency is the highest (Figure 12 and Figure 13, red color). The integrated energy consumption for rice grinding on a five-disc grinder assumes values within the interval (928–1420) when the grinding yield is included in the range (25.2–30.6) kg·h−1, unit energy consumption in the range (0.027–0.049) kWh·kg−1, power consumption in the range (0.88–1.02) kW, and fragmentation degree in the range (1.04–1.13) (Figure 12). The integrated energy consumption of corn grinding on a five-disc grinder assumes values in the range (1592–2640) when the grinding yield is within (19.8–32.4) kg·h−1, unit energy consumption within (0.037–0.061) kWh·kg−1, power consumption within (0.91–1.31) kW, and fragmentation degree in the range (2.75–4.21) (Figure 13).
The results of the integrated energy consumption tests are characterized by a higher value scatter for corn grinding, and the scatter of results for power consumption, yield, fragmentation degree, and unit energy consumption were also higher for corn grinding than for rice grinding (Figure 12 and Figure 13). Thus, by knowing the components of the integrated energy consumption, its values can be predicted with a higher accuracy for rice grinding than for corn grinding.
Next, a basic statistical analysis of the variable was performed. On the basis of the Shapiro-Wilk test (Appendix A, Table A1 and Table A2) and the values of the skewness and kurtosis (Appendix A, Table A3 and Table A4) of the distribution of the results, it was found that the distribution of the integrated energy consumption deviated from normal; therefore, in the correlation analysis, the Spearman coefficient was used to describe the monotonic relationships between the variables. Correlation analysis showed that there is a very strong negative correlation between the integrated energy consumption of rice grinding and total speed increase S∆ω (R = −0.95554, Appendix A, Table A7). In the case of corn grinding, the negative correlation of these two variables was moderate (R = −0.51131, Appendix A, Table A8).
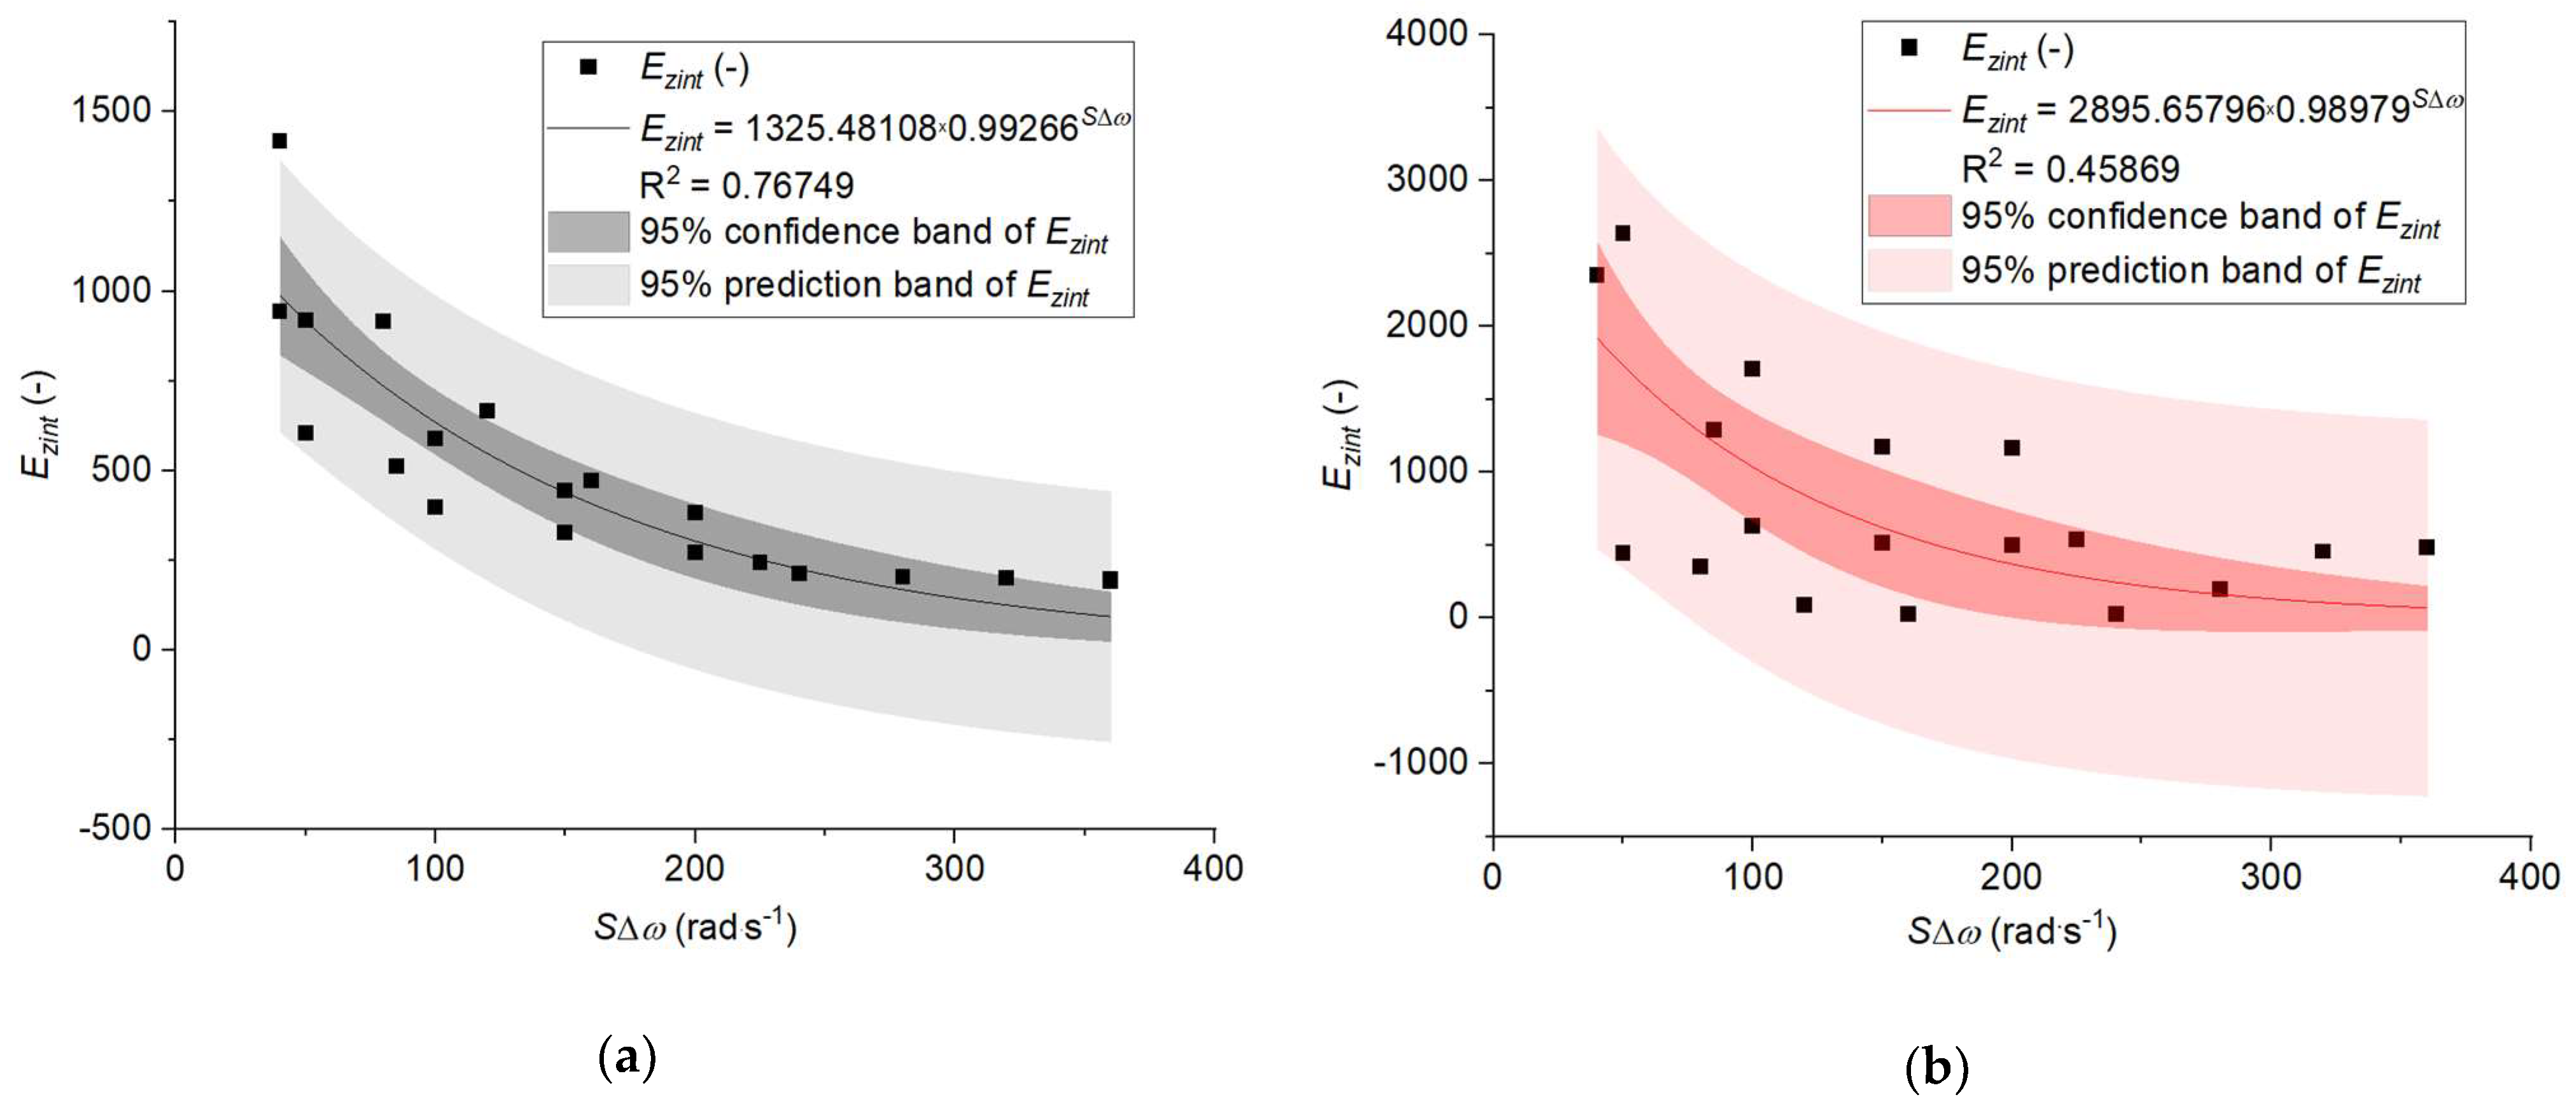
Nonlinear regression analysis was used to determine the equations describing the dependence of the rice and corn grinding’s integrated energy consumption as a function of the total speed increase. In this case, the best-matched model was determined on the basis of the value of matching coefficient R2 and the error values of the standard coefficients of the determined dependencies. It was found that the integrated energy consumption of rice grinding is best explained, nearly 77%, by an exponential model (Figure 14a). As regards corn, the best match was an exponential model, though it accounted for only 46% of the integrated energy consumption variability (Figure 14b). Both coefficients in the equations and the regression models themselves were statistically significant (Table 10 and Table 11). The standard error of coefficients did not exceed 11% in the rice grinding’s integrated energy consumption equations, and, in the case of corn, it did not exceed 26%.
The results of the analyses indicate that the rice and corn grinding processes differ in terms of yield, power consumption, fragmentation degree, unit energy consumption, and integrated energy consumption. In the case of corn, the process of grinding has more of a random character, which is mostly the result of the large differentiation of the grains of one species, which was also observed in other tests [20,28,85]. Hence, the match of models of unit energy consumption, yield, and fragmentation degree as a function of corn grinding speed increases, and subsequently, the models of the integrated energy consumption, which include the above-listed components, is rather poor.
Analyzing the values of the integrated energy consumption for the two grain species considered herein, it can be said that, from the point of view of the accepted criterion, a smaller increase in the angular speeds in relation to the reference speed on each disc (20 rad·s−1) provides higher values of integrated energy consumption; e.g., the process of grinding is characterized by a low power consumption while maintaining the remaining parameters of grinding at a satisfactory level.
Verification of the integrated energy consumption model was performed for granular materials. It should be expected that, for a different type of biomass, e.g., wooden biomass, the value of the energy consumption index and its relations with the grinder disc total angular speeds would be different from the materials used in the study.
The proposed index of the integrated energy consumption can successfully be used to assess the grinding process and to select the grinder angular speeds to provide a low energy consumption, high yield, and a high fragmentation degree of the product. This index can find applications in automatic and control systems for industrial lines grinding energy materials, e.g., biomass, coal, and post-use polymer materials.

4. Summary and Conclusions

The aim of the study was achieved by developing and verifying the model of integrated energy consumption for grinding a biomass, which takes into account the fundamental parameters of the process: power consumption, unit energy consumption, yield, and the determination of the impact of changes in the grinding unit motion parameters on the values of the index developed herein.
The analyses of this study have proven that the index developed herein can be used successfully to assess a biomass grinding’s energy consumption in an integrated approach—that is, one which includes not only energy consumption but also other parameters important from the point of view of the grinding process (yield, fragmentation degree, power consumption, and unit energy consumption). The verification of the model on a real object—a five-disc grinder—made it possible to determine the dependencies of the integrated energy consumption index and the motion parameters of the grinder discs for the total increase in disc annular speeds. Based on the analyses, it was found that the total speed increased, and thus, the increase in the disc angular speeds causes an increase in power consumption, in the fragmentation degree, and the unit energy consumption for both rice and corn grinding. In the case of rice grinding, these dependencies can be described with a high match by means of linear models. In the case of corn, a linear dependence was found only for power consumption. Nonlinear models were used for the unit energy consumption and fragmentation degree, though they accounted for only 60% of the studied parameter variability. The yield did not correlate with the total increase in angular disc speeds for either rice or corn grinding. This results mainly from physical mechanical properties of the grains and grain-grinding unit relations and confirms the variety and variability of grains observed so far within one type of grain and, in addition, confirms the randomness of the grinding process.
The test results prove that integrated energy consumption is negatively correlated with a total increase in the grinder angular speeds. The models which best represent the variability of the integrated energy consumption were exponential models; though, in the case of corn, this model was characterized by a lower matching coefficient (R2 = 0.45896) than the energy consumption model for rice grinding (R2 = 0.76749). Upon analyzing the values of the integrated energy consumption for two grain species, it can be observed that, in terms of the criterion accepted herein, a smaller angular speed increase in relation to the reference speed on each disc of the grinder (20 rad·s−1) causes higher values of integrated energy consumption; that is, the process of grinding is characterized by a low power consumption while sustaining the remaining parameters of grinding at a satisfactory level.
The model of integrated energy consumption considered in this study can be a useful tool for integrated design and to select structural and process grinding parameters in preimplementation tests for grinders. Moreover, it can find an application in the automation and control systems of industrial lines’ grinding energy materials, such as biomass, coal, and post-use polymers.
Further research on the structures and operations of biomass grinders in terms of their energy consumptions should be focused on finding the relations between selected structural characteristics of the grinding unit and negative environmental factors such as CO2 emissions and natural resource depletion, as well as operation potentials.
Supplementary Materials

The following are available online at https://www.mdpi.com/1996-1073/13/6/1417/s1: Table S1: The test results of rice grinding’s integrated energy consumption and particular components of the model. Table S2: Test results of the integrated energy consumption for rice grinding and particular components of the model

Author Contributions

Conceptualization: W.K.; methodology, W.K. and J.F.; software, W.K.; validation, A.T. and J.F.; formal analysis, R.K. and P.B.-W.; investigation, W.K. and A.T.; resources, W.K.; data curation, W.K.; writing—original draft preparation, W.K.; writing—review and editing, W.K., A.T., J.F., R.K., and P.B.-W.; visualization, W.K.; supervision, J.F. and A.T.; project administration, W.K.; and funding acquisition, W.K. All authors have read and agreed to the published version of the manuscript.

Funding

This scientific work was financed by the budget resource for science in 2017-2021 as a research project under the “Diamentowy Grant” Program. This research was funded by the MINISTRY OF SCIENCE AND HIGHER EDUCATION OF POLAND, grant number DI2016 001646.

Conflicts of Interest

The authors declare no conflicts of interest. The funders had no role in the design of the study; in the collection, analyses, or interpretation of data; in the writing of the manuscript; or in the decision to publish the results.

Appendix A

Table A1. Tests results of the normality of the Shapiro-Wilk distribution of variables for the process of rice comminution.
-DFStatisticp-ValueDecision at Level (5%)
PR200.931510.1651Cannot reject normality
Qr200.934260.18646Cannot reject normality
Ej200.936210.20316Cannot reject normality
i80200.920060.09935Cannot reject normality
Ezint200.857280.00708Reject normality
Sω200.917360.08817Cannot reject normality
Pr—grinding power consumption, kW; Qr—grinding yield, kg·h−1; Ej—unit energy consumption, kWh·h−1; i80—80% fragmentation degree; Ezint —integrated energy consumption; and S∆ω—total increase in angular speeds, rad·s−1.
Table A2. Test results of the normality of the Shapiro-Wilk distribution of variables for the process of corn grinding.
DFStatisticp-ValueDecision at Level (5%)
PR200.936990.21026Cannot reject normality
Qr200.910590.06541Cannot reject normality
Ej200.657311.22879 × 10−5Reject normality
i80200.951110.38428Cannot reject normality
Ezint200.835260.00305Reject normality
Sω200.917360.08817Cannot reject normality
Pr—power consumption for grinding, kW; Qr—grinding yield, kg·h−1; Ej—unit energy consumption, kWh·h−1; i80—80% fragmentation degree; Ezint—integrated energy consumption; and S∆ω—total angular speed increase, rad·s−1.
Table A3. Results of the descriptive statistical analysis of variables for the process of rice grinding.
-MeanStandard DeviationSumSkewnessKurtosisMinimumMedianMaximumRange
(Max.–Min.)
PR1.55550.5378631.110.31892−1.153030.841.4252.481.64
Qr28.1651.69528563.3−0.02646−1.2802425.228.330.65.4
Ej0.054950.017781.0990.2127−1.260790.0270.0520.0830.056
i801.1490.0868122.980.50272−0.898421.041.141.310.27
Ezint505.65328.92877101131.322811.6285519042214171227
Sω165.5104.4396133100.60399−0.7226540150360320
Pr—power consumption for grinding, kW; Qr—yield of grinding, kg·h−1; Ej—unit energy consumption, kWh·h−1; i80—80% fragmentation degree; Ezint—integrated energy consumption; and S∆ω – total increase in angular speeds, rad·s−1.
Table A4. Results of the descriptive statistical analysis of variables for the process of corn grinding.
-MeanStandard DeviationSumSkewnessKurtosisMinimumMedianMaximumRange
(Max.–Min.)
PR1.84650.7058536.930.41186−0.923840.911.7553.112.2
Qr21.7258.82627434.5−0.74904−0.49794.32432.428.1
Ej0.1180.110512.362.235534.356580.0370.09050.4220.385
i804.06850.6561781.37−0.775441.474862.294.1255.112.82
Ezint872.15807.93116174431.124970.1338724511.526392615
Sω165.5104.4396133100.60399−0.7226540150360320
Pr—power consumption for grinding, kW; Qr—yield of grinding, kg·h−1; Ej—unit energy consumption, kWh·h−1; i80—80% fragmentation degree; Ezint—integrated energy consumption; and S∆ω—total increase in angular speeds, rad·s−1.
Table A5. Results of the analysis of variable correlation using the Pearson method for the process of rice grinding.
PRQrEji80
Sωr-Pearson0.9658*0.371530.95332*0.93237*
p-value5.36891 × 10−120.106768.44112 × 10−112.19489 × 10⁻⁹
Two-tailed test of significance is used and * correlation is significant at the 0.05 level. Pr—power consumption for grinding, kW; Qr—yield of grinding, kg·h−1; Ej—unit energy consumption, kWh·h−1; i80—80% fragmentation degree; and S∆ω—total angular speed increase, rad·s−1.
Table A6. Results of the analysis of variable correlation using the Pearson method for the process of corn grinding.
PRQri80
Sωr-Pearson0.98471*0.254950.6893*
p-value4.11081 × 10−150.278017.741 × 10−4
Two-tailed test of significance is used and * correlation is significant at the 0.05 level. Pr—power consumption for grinding, kW; Qr—yield of grinding, kg·h−1; i80—80% fragmentation degree; and S∆ω—total angular speed increase, rad·s−1.
Table A7. Results of the correlation analysis with the Spearman method for the process of rice grinding.
--Ezint
SωSpearman Corr.−0.95554*
p-value5.48274 × 10−11
Two-tailed test of significance is used and * correlation is significant at the 0.05 level. Ezint—integrated energy consumption and S∆ω—total angular speed increase, rad·s−1.
Table A8. Results of the analysis of variable correlation with the Spearman method for corn grinding.
--EjEzint
SωSpearman Corr.0.5963*−0.51131*
p-value0.005520.02121
Two-tailed test of significance is used and * correlation is significant at the 0.05 level. Ej—unit energy consumption, kWh·h−1; Ezint—integrated energy consumption; and S∆ω—total angular speed increase, rad·s−1.

References

  1. Dzikuć, M.; Piwowar, A. Ecological and economic aspects of electric energy production using the biomass co-firing method: The case of Poland. Renew. Sustain. Energy Rev. 2016, 55, 856–862. [Google Scholar] [CrossRef]
  2. Miao, Z.; Grift, T.E.; Hansen, A.C.; Ting, K.C. Energy requirement for comminution of biomass in relation to particle physical properties. Ind. Crops Prod. 2011, 33, 504–513. [Google Scholar] [CrossRef]
  3. Wasiak, A. Technologies of Biofuel Production. In Modeling Energetic Efficiency of Biofuels Production; Green Energy and Technology; Springer: New York, NY, USA, 2019; pp. 29–34. ISBN 978-3-319-98431-5. [Google Scholar]
  4. Mayer-Laigle, C.; Blanc, N.; Rajaonarivony, R.K.; Rouau, X. Comminution of dry lignocellulosic biomass, a review: Part I. from fundamental mechanisms to milling behaviour. Bioengineering 2018, 5, 41. [Google Scholar] [CrossRef] [PubMed] [Green Version]
  5. Tumuluru, J.S.; Heikkila, D.J. Biomass grinding process optimization using response surface methodology and a hybrid genetic algorithm. Bioengineering 2019, 6, 12. [Google Scholar] [CrossRef] [Green Version]
  6. Wróbel, M.; Mudryk, K.; Gąsiorski, A.; Posyłek, Z.; Dróżdż, T. Energy consumption during grinding of biomass for pelletisation [Nakłady energetyczne podczas mielenia biomasy przygotowywanej do procesu peletowania]. Prz. Elektrotech. 2017, 93, 229–232. [Google Scholar]
  7. Eisenlauer, M.; Teipel, U. Comminution of biogenic materials. Can. J. Chem. Eng. 2017, 95, 1236–1244. [Google Scholar] [CrossRef]
  8. Yılmaz, S.; Selim, H. A review on the methods for biomass to energy conversion systems design. Renew. Sustain. Energy Rev. 2013, 25, 420–430. [Google Scholar] [CrossRef]
  9. Nnaemeka, N.; MacManus, N. Measurement of energy requirements for size reduction of palm kernel and groundnut shells for downstream bioenergy generation. J. Eng. Technol. Res. 2016, 8, 47–57. [Google Scholar] [CrossRef] [Green Version]
  10. Hess, J.R.; Wright, C.T.; Kenney, K.L.; Searcy, E.M. Uniform-Format Solid Feedstock Supply System: A Commodity-Scale Design to Produce an Infrastructure-Compatible Bulk Solid from Lignocellulosic Biomass–Executive Summary; Idaho National Laboratory (INL): Idaho Falls, ID, USA, 2009. [Google Scholar]
  11. Cundiff, J.S.; Grisso, R.D. Containerized handling to minimize hauling cost of herbaceous biomass. Biomass Bioenergy 2008, 32, 308–313. [Google Scholar] [CrossRef]
  12. Kruszelnicka, W.; Bałdowska, P.; Tomporowski, A.; Piasecka, I.; Mroziński, A. Analiza korzyści energetycznych rozdrabniania nośników energii. Inż. Apar. Chem. 2018, 57, 7–8. [Google Scholar]
  13. Wasiak, A.L. Effect of Biofuel Production on Sustainability of Agriculture. In Proceedings of the 7TH International Conference on Engineering, Project, and Production Management; Halicka, K., Nazarko, L., Eds.; Elsevier Science Bv: Amsterdam, The Netherlands, 2017; Volume 182, pp. 739–746. [Google Scholar]
  14. Al-Hamamre, Z.; Saidan, M.; Hararah, M.; Rawajfeh, K.; Alkhasawneh, H.E.; Al-Shannag, M. Wastes and biomass materials as sustainable-renewable energy resources for Jordan. Renew. Sustain. Energy Rev. 2017, 67, 295–314. [Google Scholar] [CrossRef]
  15. Buytaert, V.; Muys, B.; Devriendt, N.; Pelkmans, L.; Kretzschmar, J.G.; Samson, R. Towards integrated sustainability assessment for energetic use of biomass: A state of the art evaluation of assessment tools. Renew. Sustain. Energy Rev. 2011, 15, 3918–3933. [Google Scholar] [CrossRef]
  16. Zhu, J.Y.; Pan, X.; Zalesny, R.S. Pretreatment of woody biomass for biofuel production: Energy efficiency, technologies, and recalcitrance. Appl. Microbiol. Biotechnol. 2010, 87, 847–857. [Google Scholar] [CrossRef] [PubMed]
  17. Adapa, P.; Tabil, L.; Schoenau, G. Compaction characteristics of barley, canola, oat and wheat straw. Biosyst. Eng. 2009, 104, 335–344. [Google Scholar] [CrossRef]
  18. Tomporowski, A. Rozdrabnianie Alternatywnych Nośników Energii; Wydawnictwa Uczelniane Uniwersytetu Technologiczno-Przyrodniczego w Bydgoszczy: Bydgoszcz, Poland, 2018. [Google Scholar]
  19. Tomporowski, A.; Flizikowski, J.; Kruszelnicka, W. A new concept of roller-plate mills. Przem. Chem. 2017, 96, 1750–1755. [Google Scholar]
  20. Mi, D.; Bahnasawy, A.; Ali, S.; El-Haddad, Z. Grinding Parameters and their Effects on the Quality of Corn for Feed Processing. J. Food Process. Technol. 2015, 6, 1. [Google Scholar]
  21. Schwechten, D.; Milburn, G.H. Experiences in dry grinding with high compression roller mills for end product quality below 20 microns. Miner. Eng. 1990, 3, 23–34. [Google Scholar] [CrossRef]
  22. Lee, H.-W.; Lee, J.-W.; Gong, S.-H.; Song, Y.-S. Study on the size reduction characteristics of miscanthus sacchariflorus via image processing. J. Korean Wood Sci. Technol. 2018, 46, 309–314. [Google Scholar] [CrossRef] [Green Version]
  23. Lee, H.-W. Size reduction characteristics of yellow poplar in a laboratory knife mill. J. Korean Wood Sci. Technol. 2016, 44, 166–171. [Google Scholar] [CrossRef] [Green Version]
  24. Williams, O.; Lester, E.; Kingman, S.; Giddings, D.; Lormor, S.; Eastwick, C. Benefits of dry comminution of biomass pellets in a knife mill. Biosyst. Eng. 2017, 160, 42–54. [Google Scholar] [CrossRef]
  25. Tannous, K.; Lam, P.S.; Sokhansanj, S.; Grace, J.R. Physical Properties for Flow Characterization of Ground Biomass from Douglas Fir Wood. Part. Sci. Technol. 2013, 31, 291–300. [Google Scholar] [CrossRef]
  26. Lopo, P. The right grinding solution for you: Roll, horizontal or vertical. Food Manag. 2002, 53, 23–26. [Google Scholar]
  27. Mani, S.; Tabil, L.G.; Sokhansanj, S. Grinding performance and physical properties of wheat and barley straws, corn stover and switchgrass. Biomass Bioenergy 2004, 27, 339–352. [Google Scholar] [CrossRef]
  28. Kruszelnicka, W. A New Model for Environmental Assessment of the Comminution Process in the Chain of Biomass Energy Processing. Energies 2020, 13, 330. [Google Scholar] [CrossRef] [Green Version]
  29. Silva, G.G.D.; Couturier, M.; Berrin, J.-G.; Buléon, A.; Rouau, X. Effects of grinding processes on enzymatic degradation of wheat straw. Bioresour. Technol. 2012, 103, 192–200. [Google Scholar] [CrossRef]
  30. Salman, A.D.; Ghadiri, M.; Hounslow, M. Particle Breakage; Elsevier: Amsterdam, The Netherlands, 2007; ISBN 978-0-08-055346-7. [Google Scholar]
  31. Wołosiewicz-Głąb, M.; Foszcz, D.; Saramak, D.; Gawenda, T.; Krawczykowski, D. Analysis of a grinding efficiency in the electromagnetic mill for variable process and feed parameters. In Proceedings of the E3S Web of Conferences; EDP Sciences: Les Ulis, Francja, 2017; Volume 18, p. 01012. [Google Scholar]
  32. Wang, Y.; Forsberg, E. International Overview and Outlook on Comminution Technology; Lulea Tekniska Universitet: Lulea, Sweden, 2014. [Google Scholar]
  33. Pandiselvam, R.; Thirupathi, V.; Mohan, S. Engineering properties of rice. Agric. Eng. 2015, XL, 69–78. [Google Scholar]
  34. Tumuluru, J.S.; Tabil, L.G.; Song, Y.; Iroba, K.L.; Meda, V. Grinding energy and physical properties of chopped and hammer-milled barley, wheat, oat, and canola straws. Biomass Bioenergy 2014, 60, 58–67. [Google Scholar] [CrossRef]
  35. Wiercioch, M.; Niemiec, A.; Roma, L. The Impact Of Wheat Seeds Size On Energy Consumption Of Their Grinding Process. Inz. Rol. 2008, 103, 367–372. [Google Scholar]
  36. Warechowska, M. Some physical properties of cereal grain and energy consumption of grinding. Agric. Eng. 2014, 239–249. [Google Scholar]
  37. Dziki, D.; Laskowski, J. Influence of wheat kernel geometrical properties on the mechanical properties and grinding ability. Acta Agrophys. 2003, 2, 735–742. [Google Scholar]
  38. Warechowska, M.; Warechowski, J.; Skibniewska, K.A.; Siemianowska, E.; Tyburski, J.; Aljewicz, M.A. Environmental Factors Influence Milling And Physical Properties And Flour Size Distribution Of Organic Spelt Wheat. Tech. Sci. 2016, 19, 387–399. [Google Scholar]
  39. Dziki, D. Ocena energochłonności rozdrabniania ziarna pszenicy poddanego uprzednio zgniataniu. Inz. Rol. 2007, 11, 51–58. [Google Scholar]
  40. Dziki, D.; Cacak-Pietrzak, G.; Miś, A.; Jończyk, K.; Gawlik-Dziki, U. Influence of wheat kernel physical properties on the pulverizing process. J. Food Sci. Technol. 2014, 51, 2648–2655. [Google Scholar] [CrossRef] [PubMed] [Green Version]
  41. Greffeuille, V.; Mabille, F.; Rousset, M.; Oury, F.-X.; Abecassis, J.; Lullien-Pellerin, V. Mechanical properties of outer layers from near-isogenic lines of common wheat differing in hardness. J. Cereal Sci. 2007, 45, 227–235. [Google Scholar] [CrossRef]
  42. Greffeuille, V.; Abecassis, J.; Barouh, N.; Villeneuve, P.; Mabille, F.; Bar L’Helgouac’h, C.; Lullien-Pellerin, V. Analysis of the milling reduction of bread wheat farina: Physical and biochemical characterisation. J. Cereal Sci. 2007, 45, 97–105. [Google Scholar] [CrossRef]
  43. Shashidhar, M.G.; Murthy, T.P.K.; Girish, K.G.; Manohar, B. Grinding of Coriander Seeds: Modeling of Particle Size Distribution and Energy Studies. Part. Sci. Technol. 2013, 31, 449–457. [Google Scholar] [CrossRef]
  44. Haffez, G.S.A. Correlation between Bond work index and mechanical properties of some Saudi ores. J. Eng. Sci. 2012, 40, 271–280. [Google Scholar]
  45. Tavares, L.M. Optimum routes for particle breakage by impact. Powder Technol. 2004, 142, 81–91. [Google Scholar] [CrossRef]
  46. Comminution and Laws of Comminution. Available online: http://www.thecementgrindingoffice.com/lawsofcomminution.html (accessed on 6 January 2018).
  47. Sidor, J.; Froszcz, D.; Tomach, P.; Krawczykowski, D. Młyny wysokoenergetyczne do mielenia rud i surowców mineralnych. CUPRUM Czas. Nauk. Tech. Gór. Rud 2015, 75, 71–85. [Google Scholar]
  48. Flizikowski, J.; Sadkiewicz, J. Inżynieria innowacji rozdrabniaczy ziarnistej biomasy. Inż. Apar. Chem. 2013, 52, 36–37. [Google Scholar]
  49. Flizikowski, J. Test methods for the intelligent development of grinding processes. Inż. Apar. Chem. 2016, 55, 90–92. [Google Scholar]
  50. Flizikowski, J.; Bieliński, K.; Bieliński, M. Podwyższanie Energetycznej Efektywności Wielotarczowego Rozdrabniania Nasion Zbóż na Paszę; Wydawnictwa Akademii Techniczno-Rolniczej: Bydgoszcz, Poland, 1994. [Google Scholar]
  51. Zawada, J.; Chochoł, K. Doświadczalne badania energii kruszenia (na przykładzie modelowej kruszarki dźwigniowej Blake’a). Gór. Geoinż. 2009, 33, 317–326. [Google Scholar]
  52. Zawada, J. Wstęp do Mechaniki Procesów Kruszenia; Wydawnictwo Technologii Eksploatacji: Radom, Poland, 1998. [Google Scholar]
  53. Malewski, J. Analiza układu kruszenia rudy w ZWR Lubin. Min. Sci. 2015, 22, 111–118. [Google Scholar]
  54. Krzemińska, M.; Malewski, J. Energochłonność operacji przygotowania rud do wzbogacania w kopalniach LGOM. Prz. Gór. 2011, 67, 143–147. [Google Scholar]
  55. Brach, I. Podstawowe Problemy w Procesach Rozdrabniania Minerałów; Ośrodek Wydawnictw IOMB: Warszawa, Poland, 1963. [Google Scholar]
  56. Sidor, J. Modelowanie procesu rozdrabniania materiału w młynach wibracyjnych. Inż. Apar. Chem. 2006, Nr 4s, 129–130. [Google Scholar]
  57. Kawatra, S.K. Advances in Comminution; Society for Mining, Metallurgy, and Exploration: Littleton, Colorado, 2006; ISBN 978-0-87335-246-8. [Google Scholar]
  58. Fuerstenau, D.W.; Abouzeid, A.-Z.M. The energy efficiency of ball milling in comminution. Int. J. Miner. Process. 2002, 67, 161–185. [Google Scholar] [CrossRef]
  59. Bielski, M. Podstawy Teorii Organizacji i Zarządzania; Wydawnictwo C. H. Beck: Warszawa, Poland, 2002. [Google Scholar]
  60. Kruszelnicka, W. Efektywność wielotarczowego rozdrabniania biomasy ziarnistej. Ekol. Tech. 2018, 28, 24–26. [Google Scholar]
  61. Macko, M. Size reduction by grinding as an important stage in recycling. In Post-Consumer Waste Recycling and Optimal Production; InTechOpen: London, UK, 2012; pp. 273–294. [Google Scholar]
  62. Dziki, D.; Laskowski, J. Influence of selected factors on wheat grinding energy requirements. TEKA Kom. Mot. Energ. Roln 2005, 5, 56–64. [Google Scholar]
  63. Steyn, C.W. Optimisation of a Fully Autogenous Comminution Circuit. Master’s Thesis, University of Pretoria, Pretoria, South Africa, 2013. [Google Scholar]
  64. Tomporowski, A.; Opielak, M.; Kowalik, K.; Sykut, B. Analiza nierównomierności rozdrabniania biomasy. Część I: Podstawy teoretyczne. Inż. Apar. Chem. 2013, 52, 42–43. [Google Scholar]
  65. Kruszelnicka, W. Analiza wskaźników stosowanych do oceny rozdrabniania. Inż. Apar. Chem. 2017, 56, 208–210. [Google Scholar]
  66. Kłos, Z. Classification and measurement of innovations. J. Mech. Transp. Eng. 2016, 68, 27–42. [Google Scholar] [CrossRef]
  67. Kłos, Z. O kształtowaniu proinnowacyjnych i projakościowych postaw. J. Mech. Transp. Eng. 2013, 65, 53–63. [Google Scholar]
  68. Flizikowski, J.; Kamyk, W. Efektywność energetyczna specjalnego systemu rozdrabniania. Teka Kom. Bud. Ekspl. Masz. Elektrotech. Bud. 2008, 2, 17–22. [Google Scholar]
  69. Fuerstenau, D.W.; Kapur, P.C.; Gutsche, O. Comminution of single particles in a rigidly-mounted roll mill part 1: Mill torque model and energy investment. Powder Technol. 1993, 76, 253–262. [Google Scholar] [CrossRef]
  70. Flizikowski, J. Rozdrabnianie Tworzyw Sztucznych; Wydawnictwa Akademii Techniczno-Rolniczej: Bydgoszcz, Poland, 1998. [Google Scholar]
  71. Kruszelnicka, W. Basis of intelligent monitoring system in biomass comminution process. In Actual problems of Modern Science; Khmelnytsky National University: Chmielnicki, Ukraina, 2017; pp. 736–747. [Google Scholar]
  72. Opielak, M.; Tomporowski, A. Structural features versus multi-hole grinding efficiency. Eksploat. Niezawodn. Maint. Reliab. 2012, 14, 222–227. [Google Scholar]
  73. Tomporowski, A. Badanie użyteczności rozdrabniania ziaren ryżu. Część I-model badawczy. Inż. Apar. Chem. 2010, 49, 119–120. [Google Scholar]
  74. Flizikowski, J.; Bielinski, K. Technology and Energy Sources Monitoring: Control, Efficiency, and Optimization; IGI Global: Hershey, PA, USA, 2012; ISBN 978-1-4666-2664-5. [Google Scholar]
  75. Kruszelnicka, W.; Idzikowski, A.; Markowska, K.; Kasner, R. Quality Index of Multi-Disc Grinding Process of Grainy Biomass. QPI 2019, 1, 503–511. [Google Scholar] [CrossRef]
  76. Tomporowski, A. Studium efektywności Napędu i Rozwiązań Innowacyjnych Konstrukcji Wielotarczowych Rozdrabniaczy Ziaren Biomasy; Lubelskie Towarzystwo Naukowe: Lublin, Poland, 2011. [Google Scholar]
  77. Brandt, A.; Erickson, J.K.; Hallett, J.P.; Murphy, R.J.; Potthast, A.; Ray, M.J.; Rosenau, T.; Schrems, M.; Welton, T. Soaking of pine wood chips with ionic liquids for reduced energy input during grinding. Green Chem. 2012, 14, 1079–1085. [Google Scholar] [CrossRef] [Green Version]
  78. Dukes, C.C.; Baker, S.A.; Greene, W.D. In-wood grinding and screening of forest residues for biomass feedstock applications. Biomass Bioenergy 2013, 54, 18–26. [Google Scholar] [CrossRef]
  79. Kruszelnicka, W. Analiza Procesu Wielotarczowego Rozdrabniania Biomasy w Ujęciu Energochlonności i Emisji CO2. Rozprawa Doktorska; Uniwersytet Technologiczno-Przyrodniczy im. J. J. Śniadeckich w Bydgoszczy: Bydgoszcz, Poland, 2019. [Google Scholar]
  80. Kruszelnicka, W. Study of Physical Properties of Rice and Corn Used for Energy Purposes. In Springer Proceedings in Energy, Proceedings of the Renewable Energy Sources: Engineering, Technology, Innovation; Wróbel, M., Jewiarz, M., Szlęk, A., Eds.; Springer International Publishing: Cham, Switzerland, 2020; pp. 149–162. [Google Scholar]
  81. ISO 13322-2:2006. Particle size Analysis—Image Analysis Methods —Part 2: Dynamic Image Analysis Methods; International Organization for Standardization: Geneva, Switzerland, 2006. [Google Scholar]
  82. ISO 1446:2001. Green coffee—Determination of Water Content—Basic Reference Method; International Organization for Standardization: Geneva, Switzerland, 2001. [Google Scholar]
  83. 35406—How do I Interpret the Shapiro-Wilk Test for Normality in JMP®? Available online: https://www.jmp.com/support/notes/35/406.html (accessed on 9 March 2020).
  84. Gutsche, O.; Fuerstenau, D.W. Fracture kinetics of particle bed comminution—Ramifications for fines production and mill optimization. Powder Technol. 1999, 105, 113–118. [Google Scholar] [CrossRef]
  85. Kruszelnicka, W.; Marczuk, A.; Kasner, R.; Bałdowska-Witos, P.; Piotrowska, K.; Flizikowski, J.; Tomporowski, A. Mechanical and Processing Properties of Rice Grains. Sustainability 2020, 12, 552. [Google Scholar] [CrossRef] [Green Version]
Figure 1. Granulometric distribution of (a) rice grains (b) corn grains.
Energies 13 01417 g001
Figure 2. Test stand for the intelligent monitoring of granular mass characteristics: 1—five-disc grinder, 2—worm feeder, 3—hopper, 4—control unit, 5—reception basket of the product of grinding, 6—weight of the product of grinding, and 7—integrated system for the analysis of the grinding product’s particle size [28].
Energies 13 01417 g002
Figure 3. Research plan. Vp—feed dosing capacity, Pi—power consumption on the i-th disc, ∆m—mass increase in the intake hopper, d80—dimension of the sieve hole through which 80% of the grinding product passes, i80—80% fragmentation degree, Ej—unit energy consumption, Qr—yield of grinding, Pr—power consumed by the grinder, and Ezint—integrated energy consumption.
Energies 13 01417 g003
Figure 4. Test results of the power consumption for rice and corn grinding.
Energies 13 01417 g004
Figure 5. Power consumption for grinding as a function of total speed increase; marking the confidence interval and values predicted for (a) rice grinding and (b) corn grinding.
Energies 13 01417 g005
Figure 6. Test results of rice and corn grinding.
Energies 13 01417 g006
Figure 7. Test results of the unit energy consumption for rice and corn grinding.
Energies 13 01417 g007
Figure 8. Unit energy consumption for grinding as a function of the total speed increase with indication of the confidence interval and predicted values for: (a) rice grain grinding and (b) corn grinding.
Energies 13 01417 g008
Figure 9. Test results of an 80% fragmentation degree for rice and corn grinding.
Energies 13 01417 g009
Figure 10. An 80% fragmentation degree as a function of the total speed increase with the markings of the confidence interval and values predicted for: (a) rice grain comminution and (b) corn grain comminution.
Energies 13 01417 g010
Figure 11. Test results of the integrated energy consumption for rice and corn grinding.
Energies 13 01417 g011
Figure 12. The integrated energy consumption of rice grinding as a function of the model components.
Energies 13 01417 g012aEnergies 13 01417 g012b
Figure 13. The integrated energy consumption for corn grinding as a function of the model variable components.
Energies 13 01417 g013aEnergies 13 01417 g013b
Figure 14. The integrated energy consumption as a function of the total speed increase with the indication of the confidence interval and predicted values for: (a) rice grain comminution and (b) corn grain comminution.
Energies 13 01417 g014
Table 1. Energy assessment criteria of the grinding process presented in the literature.
CriterionMathematical Model
Overall net energy for a grinding unit of dry mass [2]
E T   =   0 T   ( P T     P 0 )   d t / m D M   =   0 T Δ P t   d t / m D M
ET—Overall net energy for grinding unit of a dry biomass , kJ kgDM−1; PT—power consumed by the machine in time, t; W,—average power input of the grinder neutral gear , W; ΔPT—net power input for biomass grinding in time t, W; and mDM—mass of the ground dry feed mass, kg.
Specific grinding Energy [7]
E s p e c   =   1 / m   0 T   ( P T     P 1 )   d t
Espec—Specific energy of grinding, J·kg−1; PT—total power consumption, W; and Pl —power consumed by the grinder without being loaded by the feed, W.
Specific energy consumption [20]SEC = Etot/Q    (3)
SEC—Specific energy consumption, kJ·kg−1; Etot—overall energy consumption, kJ; and Q—productivity, kg.
Energy density [20]Ed = SEC·ρ    (4)
Ed—Energy density, kJ·m−3; ρ—bulk energy density of the ground material, kg·m−3; and SEC—specific energy consumption, kJ·kg−1.
Specific energy of grinding [62]Er = (EcEs)/m    (5)
Er—specific energy of grinding, J·kg−1; m—mass of the ground sample of material, kg; Ec—overall energy consumption, J; and Es—neutral gear energy consumption, J.
Unit energy demand [63,64,65]Ej = P/Q    (6)
Ej—unit energy demand, kWh·kg−1; P—power on the grinder shaft, kW; and Q—mass yield, kg·h−1.
Energy efficiency [58]EE = Em(SP)/Em(Mill)·100    (7)
EE—energy efficiency, Em(SP)—specific energy used for grinding a single particle, and Em(Mill) – specific energy net energy used for production of a given product.
Target energy efficiency [58]EE = Em(SP)/Em(Mill)X50·100    (8)
EE—energy efficiency, Em(SP)—specific energy used to generate a product with a given average dimension X50, and Em(Mill)X50—net specific energy used to generate a product with average dimension X50.
Adjustment function quasi-shearing [50]eRP = ((ηq−sηoEbrutto·ηs·ηp)/((kj·vr + τq−s·Fq−s + ε·FR·vr2Mk·vr·t)    (9)
eRP—adjustment function for quasi-shearing; ηq−s—combustion efficiency of ground energy carriers; ηo—efficiency of whole grain combustion of selected energy carriers; Ebrutto—energy of processed grains, kJ·kg−1; ηs·ηp—efficiency of the grinder drive; ηs—engine efficiency; ηp—transmission efficiency; kj—idle motion coefficient, kJ·s−1; vr—speed of quasi-shear, m·s−1; τq−s—stress during quasi-shearing, N·m−2; Fq−s—temporary cross-section of quasi-shearing, m2; FR—cross-section of secondary impacts during quasi-shearing, m2; ε—proportionality coefficient, N·s−2·m−4; and Mk—times indicator.
Energy change efficiency [30]Efze = Eroz/Ew·100    (10)
Efze—energy change efficiency, %; Eroz—grinding energy, J; and Ew—energy input, J.
Table 2. Structural parameters of the five-disc grinder.
ParameterUnitDisc 1Disc 2Disc 3Disc 4Disc 5
Disc diameter Dnmm274274274274274
Number of holes lnpcs.1422273339
Holes diameter dnmm30232117,517,5
Table 3. Settings of the five-disc mill control parameters [28].
Test ProgramNo. of ConfigurationSωωω1ω2ω3ω4ω5
rad·s−1rad·s−1rad·s−1rad·s−1rad·s−1rad·s−1rad·s−1
I15052025303540
2100102030405060
3150152035506580
42002020406080100
II12002010080604020
2150158065503520
3100106050403020
45054035302520
III140202040204020
285204525452545
3225257550755075
4360201008010080100
IV140202040204020
280402060206020
3120602080208020
416080201002010020
V1240801002010020100
2280601004010040100
3320401006010060100
4360201008010080100
RP—research program; ω1, ω2, ω3, ω4, and ω5—angular speeds of discs, rad·s−1; Δω—increase in angular speeds, rad·s−1; and Sω—total increase in angular speeds, rad·s−1.
Table 4. Test results of significance of the coefficients of the linear regression model of power consumption.
--ValueStandard Errort-ValueProb > |t|
RiceIntercept0.732340.0611511.975475.21551 × 10−10
Slope0.004973.14735 × 10−415.803135.36891 × 10−12
CornIntercept0.745080.0539213.81755.05108 × 10−11
Slope0.006662.77525 × 10−423.980184.11081 × 10−15
Table 5. Test results of the significance of the power consumption linear regression equation.
Sum of SquaresMean SquareF-ValueProb > F
Rice5.126975.12697249.73885.36891 × 10−12
Corn9.178949.17894575.049154.11081 × 10−15
Table 6. Test results of the significance of the coefficients of the unit energy consumption regression model.
--ValueStandard Errort-ValueProb > |t|
RiceIntercept0.028090.0023511.933995.5149 × 10−10
Slope1.62274 × 10−41.21157 × 10−513.393678.44112 × 10−11
Corna0.103130.012278.401954.68401 × 10−7
b0.98810.00401246.44280
a, b—coefficients of regression model (Figure 8b).
Table 7. Test results of the significance of the equations of the unit energy consumption regression model.
-Sum of SquaresMean SquareF-ValueProb > F
Rice0.005460.00546179.390498.44112 × 10−11
Corn0.108530.0542797.419272.55003 × 10−9
Table 8. Test results of the regression model coefficient significance for an 80% fragmentation degree.
--ValueStandard Errort-ValueProb > |t|
RiceIntercept1.020740.0137674.177527.73924 × 10−24
Slope7.74976 × 10−47.08224 × 10−510.942542.19489 × 10−9
Corna4.464880.1380432.345760
b0.974860.00357273.128340
a, b—coefficients of regression model (Figure 10b).
Table 9. Test results of the regression equation significance for an 80% fragmentation degree.
-Sum of SquaresMean SquareF-ValueProb > F
Rice0.124470.12447119.739092.19489 × 10−9
Corn335.73877167.86938864.382721.31021 × 10−18
Table 10. Results of significance tests for the coefficients of the integrated energy consumption regression model.
--ValueStandard Errort-ValueProb > |t|
Ricea1325.48108155.502668.523859.81711 × 10−8
b0.992660.00124802.869970
Corna2895.65796776.512223.729060.00154
b0.989790.00339292.348770
a, b—coefficients of regression model (Figure 14a,b).
Table 11. Results of the significance tests for the equations of the integrated energy consumption regression.
Sum of SquaresMean SquareF-ValueProb > F
Rice6,691,362.970973,345,681.48549125.997492.60167 × 10−11
Corn2.09017 × 1071.04509 × 10728.020632.96612 × 10−6