Abstract
This paper presents research on a hybrid photovoltaic-battery energy storage system, declaring its hourly production levels as a member of a balancing group submitting common scheduling unit to the day-ahead market. It also discusses the variability of photovoltaic system generation and energy storage response. The major research questions were whether the operation of a hybrid photovoltaic-battery energy storage system is viable from the technical and economic viewpoint and how to size battery energy storage for that purpose. The DIgSILENT PowerFactory environment was used to develop the simulation model of postulated hybrid system. Then, tests were conducted on real devices installed in the LINTE^2 laboratory at Gdańsk University of Technology, Poland. Firstly, power generation in the photovoltaic system was modeled using hardware in the loop technique and tested in cooperation with emulated photovoltaic and real battery energy storage system (lithium-ion battery, 25 kWh). Secondly, a real photovoltaic power plant (33 kW) and real battery energy storage were applied. The results obtained from laboratory experiments showed that market operation of hybrid photovoltaic-battery energy storage system is feasible. However, developing a control strategy constitutes a great challenge, as the operator is forced to intervene more frequently than the simulation models indicate in order to keep the parameters of battery storage within accepted ranges, especially in view of a sudden weather breakdown. Levelized cost of electricity from photovoltaic-battery energy storage system varied from 314 to 455 $/MWh, which has proven to be from two to three times higher than the current annual average day-ahead market price in Poland.
1. Introduction
Due to the increasing concern over the greenhouse effect and the possible harmful impact of fossil-fuel-based power generation on human health, the European Union (EU) seeks a common long-term energy strategy to decarbonize the power sector [1]. Renewable energy sources, including photovoltaic (PV) systems, are key technologies in the pursuit of carbon-free electricity production [2]. Currently, fossil-fuel-based units can offer electricity on the market at a generally lower production cost as compared to solar PV and wind [3]. However, they are the source of emissions and their generation costs are expected to increase as the emission allowance costs will rise due to the implementation, into the EU Emission Trading Scheme (EU ETS) [4], of a mechanism of Market Stability Reserve [5], which is a tool for achieving long-term decarbonization, as declared in the EU Energy Roadmap 2050. The intermittency of renewable energy generators based on solar and wind energy resources is challenging for effective power system control [6], while their share in the electricity mix is expected to steadily increase over the next decades [7]. To limit the impact of their variability in power generation on the power system, energy storage systems (ESS) are installed to create hybrid PV-ESS systems [8]. Battery energy storage (BES) systems (BESS) are currently developing rapidly and are perceived as a promising solution in power sector [9]. The major barrier for their wide implementation is high BESS cost [10]. Further endeavors to foster the use of variable renewable energy sources (RES) and subsequent development of electric vehicles (EVs) should be the main drivers for BESS technology development, although EVs may be a strong competition for the stationary application of batteries in the power sector, so their specific cost may decrease at a lower rate than desired and the second use of depleted batteries from EVs may become an option for power generators [11].
Renewable energy sources can benefit from feed-in-tariffs. However, promotion mechanisms often have limited time horizon, e.g. 15 years in Poland [12], and some of the renewable installations may not win auctions to get a preferential price and still decide to participate in the electricity market. To be an effective participant of the day-ahead market (DAM), the renewable source owner must be able to predict their hourly generation profile for the next day. Therefore, many intermittent renewable energy generators of different production profiles join their forces to form a balancing group offering a common scheduling unit (CSU). Still, the PV generator position within the balancing group can be strengthened as they decide to install battery energy storage to build hybrid PV-BES systems. The alternative for them would be to operate without BESS and incur the cost of electricity balancing in any case of failure in delivering committed electricity amounts. This is expected to be costly, as the inability to meet hourly commitments can occur frequently e.g. due to incorrect and imprecise weather forecasts. Having the above in mind, the authors raise the question of whether the operation of hybrid PV-BES system within the balancing group to offer electricity within common scheduling unit for the day ahead electricity market is viable from the technical and economic point of view and how to size BESS for that purpose.
The major difficulty in sizing BES for cooperation with the PV system is that the committed energy—a contribution to the CSU—must be delivered at a specific time, whereas the PV power output on a day with partially clouded sky can vary rapidly. While the commitments rely on the weather forecasts from a preceding or earlier day, this puts the operation of PV on an electricity market at risk of not meeting the declared amounts. The most straightforward way is to design a battery able to discharge power equal to the peak power output of the PV system, taking into consideration the battery depth of discharge and ramp rate limitations, and capable of delivering maximum achievable hourly electricity production from PV. However, the high cost of batteries would lead to the unprofitability of the system, since balancing group would not accept increased prices of electricity from PV-BESS in fear of being unable to sell it on the DAM. Instead, the operator of the PV system must seek for a BES that stabilizes their hourly electricity production at minimum cost of electricity offered. Modeling tools can support the sizing of BES and simulations of PV-BESS participation to the DAM. However, they are usually unable to take into account all aspects of real-life PV-BESS cooperation to meet hourly commitments. This requires tests conducted on an existing PV-BESS system. Because of the commercial character of such installations, laboratory-built hybrid systems, featuring a real PV system along with real and emulated BES can be applied instead to conduct analyzes. The biggest challenge is the cost of the experiment, as this requires a laboratory equipped in a manner providing flexibility in building microgeneration systems containing BES and PV.
The research dealing with both the BESS-only and the RES-BESS hybrid system participation in electricity market has been presented to date in the literature. The studies mostly focused on modeling. Gomes et al. [13] used two-stage stochastic programming problem to find optimal bid submission by jointly operated PV and wind farm with energy storage for the DAM in the Iberian Peninsula. The case of wind-BESS participation in the German spot market was presented by Cai et al. [14], who applied a genetic algorithm to optimize battery size, while BESS itself was proposed to use the benefits of price variations in the DAM and intraday market, as well as to minimize the costs of forecasts errors. Ding et al. [15] proposed ESS as a reserve capacity for a wind farm operating on the DAM and maximized expected profits using a mixed integer nonlinear programming model. Yang et al. [16] developed a mixed-integer linear programming model to optimize scheduling of the battery performance to minimize the total cost of a hybrid system also containing PV and a wind power plant. There were also studies of sole operation of BESS on electricity markets and dealing with the optimization of bidding strategies of variable RES. Zhai et al. [17] proposed a model of battery operating on the Australian electricity market and cost estimator to analyze the effects of market participation on the battery life. Pandžić and Kuzle [18] developed a bi-level profit maximization model to evaluate the effects of energy storage on day-ahead market prices and the potential response of conventional plant operators. Fedjaev et al. [19] built an optimization model using linear programming to manage a lithium-ion battery in an industrial microgrid. Mohsenian-Rad [20] proposed a design framework for battery energy storage systems to optimize bidding and scheduling in California’s day-ahead market. Kazemi et al. [21] considered battery energy storage simultaneously participating in the day-ahead, spinning reserve and regulation markets. Krishnamurthy et. al [22] developed a stochastic model to maximize profit being subject to uncertainty, when the storage owner participates in the day-ahead and real-time markets. He et al. [23] studied the optimal bidding strategy of the battery energy storage operating on electricity markets, taking into account performance-based regulation and battery lifespan. Hesse et al. [24] optimized a dispatch strategy for a storage participating in German arbitrage energy market using mixed-integer programming model. Levelized cost of electricity (LCOE) calculations of PV systems were presented by International Energy Agency and Nuclear Energy Agency [3], while more recent report on the subject was published by International Renewable Energy Agency (IRENA) [25]. LCOE computation for energy storage systems was the subject of the paper by Obi et al. [10]. This literature review shows that both the joint operation of the variable RES-BESS hybrid and battery-only participation in the day-ahead market is a widely addressed problem. However, to our best knowledge, there was no past attempt to apply a comprehensive methodology combining simulation models with live tests in the laboratory on real devices and economic analysis methods to assess the techno-economic viability of PV-BESS services offered to the day-ahead electricity market. In addition, the authors have not found any previous works providing detailed characteristics of DAM-participating PV-BES hybrid system parameters measured on real devices to verify simulation models. Finally, published research on levelized cost of electricity (LCOE) focused separately on PV or BES systems, while there was no reports on the LCOE of hybrid PV-BESS operating on the DAM, which involved both balancing costs and battery ageing.
To answer research questions raised in this paper, the simulation model of PV-BESS, using DIgSILENT PowerFactory environment was developed and BESS was sized on that basis. Subsequently, the bidding strategy was proposed and PV-BESS cooperation was simulated in PowerFactory, knowing the weather forecasts and PV generation profiles. To validate simulation models and show differences between the simulations and real life PV-BESS operation, live tests were conducted in LINTE^2—a laboratory for innovative power technologies and integration of renewable energy sources at Gdańsk University of Technology, Poland. Finally, the costs analysis of PV-BESS was conducted and presented in the context of varying DAM prices. The PV power generation hourly profile, covering all year, was developed and applied to reflect market operations during a representative year. Ageing of the battery and PV degradation were taken into account to calculate the annual costs throughout the 25-year PV system lifetime. This served as a basis for levelized cost calculation. The major contributions of the paper are: 1) the methodology of battery sizing and the simulation of its operation in a hybrid system with PV to submit bids to the common scheduling unit offered by the balancing group in a day-ahead market; 2) the methodology of real-life validation of the simulation models using laboratory-scale PV and BES systems, 3) the methodology of hybrid PV-BES cost analysis relying on hourly profile of electricity production, taking into account randomly generated error in the forecasted hourly production and costs of electricity balancing resulting from not meeting committed hourly electricity production. This paper summarizes and advances authors’ past work [26]. Real-live experiments and cost analysis constitute a novelty in relation to previous publications.
2. Rated Power and Capacity Sizing of Battery Energy Storage
In this study, the PV system operates as the member of a balancing group that submits a common scheduling unit to the DAM. The terms balancing group and common scheduling unit were defined in [27]. In a balancing group, each member declares hourly electricity production a day ahead. If there is a negative or positive imbalance, it either incurs the costs of balancing or receives additional income, respectively. Since PV power generation is dependent on the level of insolation and is variable over time, it is proposed that the battery energy storage will be installed alongside. PV-BESS hybrid follows an average power level resulting from the declared hourly electricity production. Because the power generated by a PV system is a subject to stochastic variation, the generation profile of the system was analyzed to select BESS parameters. Therefore, historical insolation and power generation data, both recorded by measurement systems in the LINTE^2 laboratory were used. Collected data are a basis for the forecasting of the electricity generation profile submitted to the common scheduling unit offered by the balancing group participating in the DAM.
A five-step approach to size BESS for electricity market participation was proposed, i.e.: (1) The analysis of PV power generation profile; (2) the model of electricity market participation; (3) preliminary BESS capacity sizing; (4) preliminary BESS power sizing; (5) correction of parameters due to BESS efficiency, charge rate (C-rate) and the state of charge (SOC) requirements. The methodology was presented, in a stepwise manner, in Section 2.1, Section 2.2, Section 2.3, Section 2.4 and Section 2.5.
2.1. The Analysis of PV Power Generation Profile
To select battery parameters, the nature of the daily PV power output profiles was studied. Per-unit generated power curves of PV system are presented in Figure 1. The data were measured with a resolution of one second and recorded in LINTE^2 during three consecutive days of March. Three generation profiles of different shape were obtained. In the “A” profile, minor short-term variations of power generated are observed, while in the “B” profile, obtained on a cloudless day, they are minimal, making the profile optimal for the DAM participation. In the case of a short weather breakdown, BESS is able to balance electricity. Electricity market participation on a very cloudy day, as recorded in the “C” profile, increases the risk of incurring high balancing costs, since the committed hourly electricity production may not be delivered due to hard-to-predict insolation levels. Instead, the PV owner may choose to buy the BESS of higher rated power and energy capacity, increasing system costs.
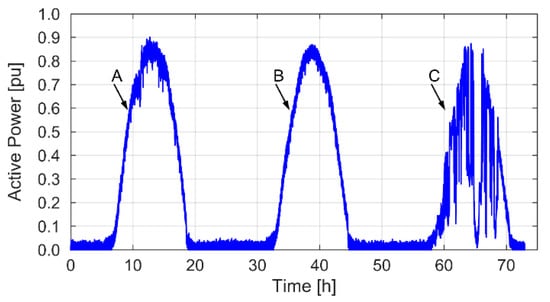
Figure 1.
Example profiles of active power generation of the photovoltaic (PV) system.
2.2. The Model of Electricity Market Participation
The battery power was determined as the maximal difference between PV power output and declared power in a given hour, searched over the entire period of the analysis, and the maximum quantity of stored electricity was used to size battery capacity. The declared power was different for each hour of market participation. Keeping an average power output over the total DAM participation period T was also considered. However, the studies have shown it would result in a three times higher rated power and 30 times higher energy capacity [26]. The hourly changing commitments lead to decreased battery costs and increased risk of failing to deliver the declared energy amounts, which forces the operator to incur the costs of market balancing.
The maximum daily DAM participation T was equal to 12 h (Figure 2). The first hour of market participation (tA) was determined as follows:
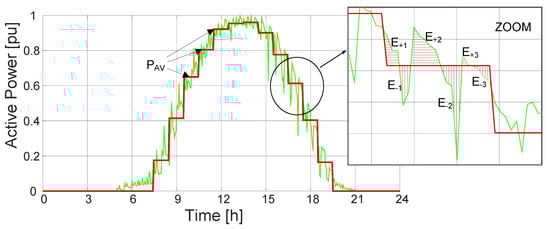
Figure 2.
Graphic illustration of the energy storage capacity computation.
The maximum daily electricity production was searched within the assumed time span (T). The entire time range within the day, with non-zero PV power generation was tested. Subsequently, BESS power and capacity were preliminarily determined within ⟨tA, tA + T⟩.
2.3. Preliminary BESS Capacity Sizing
BESS capacity should be sized to be able to store the excess of PV-generated electricity and return it to meet any shortages in the analyzed time range. It was calculated using a two-step method. Firstly, hourly (Δt = 1) electricity production and corresponding average power were forecasted:
Secondly, the theoretical capacity was determined for each hour i and j when battery discharging and charging should occur, respectively:
where:
and
2.4. Preliminary BESS Power Sizing
Battery power was selected so as to ensure that the contribution of the hybrid PV-BESS system to the common scheduling unit is kept constant over an hour and as close as possible to the scheduled average power level. To comply with this requirement in each analyzed period of time Δt, BESS rated power must be at least equal to the maximum commanded power, i.e., the difference between power generated by the PV system (PPV) and the set hourly average power (Pref). Subsequently, the rated real power of the BESS Pn is determined as:
2.5. Correction of Parameters
Delivering the committed power of the BESS-PV hybrid system requires taking into account both the BESS load level and the ramp-rate limitations of the battery charging and discharging. Groot et al. [28] analyzed the impact of different variables, among others the state of charge (SOC), on BESS ageing. Their outcomes, compared with those obtained by Choi and Lim [29], Diúçi et al. [30], Takahashi et al. [31] Zhang et al. [32], Torres et al. [33], and Zhu et al. [34], led the authors to the conclusion that the battery SOC range should be 0.4–0.8. Therefore, the energy storage capacity should be approximately 70% higher than the one obtained from equation (3). To increase BESS lifetime, ramp-rate limitations are imposed on the charging and discharging current, which requires further capacity oversizing. The active power losses of the converter and other energy-conversion-related BESS system components should also be taken into account. Doubling the battery capacity and power, respectively obtained from Equations (3) and (6), is a common practice.
3. Simulation Modeling
In order to verify BESS parameters, determined on the basis of a five-step methodology and with the use of the assumptions made in Section 2, simulation studies were conducted.
A power grid model with BESS representation, based on work by Kottick et al. [35], Medora and Kusko [36], Barsali and Ceraolo [37] and embedded in the Power Factory software [38], was applied in simulations, and a PV model was added. The power of PV-BESS hybrid system was controlled at the point of common coupling (PCC). The topology of the test power system is presented in Figure 3.
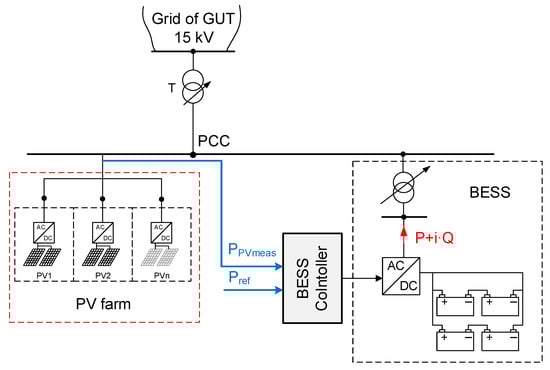
Figure 3.
Test power system topology, T – power transformer 15/0.4 kV/kV, PPVmeas—measured power output of PV system, Pref – set power level for PV system, based on the declarations submitted to the day-ahead market (DAM) through balancing group and weather forecasts.
A detailed description of the experiment was presented in [26], where two methods of participation in the DAM were considered:
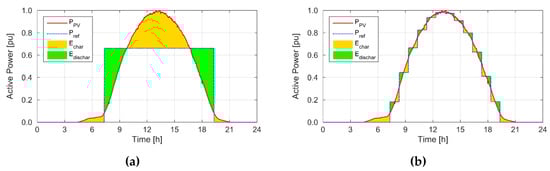 Figure 4. Hybrid power plant operation: (a) where the declared power is constant throughout the period of market participation, (b) where the declared power changes during market participation. Echar: Energy charging the battery, Edischar: energy discharged from the battery.
- Method #2—the committed generation power varied every hour Δt = 1 h (Figure 4b).
Both methods assumed that the PV-BESS hybrid participates in the DAM for T period daily.
Table 1 presents the results of battery sizing for a PV-BESS hybrid example. The required values of energy and real power of the battery, shown in Table 1, were determined for generation profile “B” (Figure 1), maximum PV farm power Pmax(PV) = 4 MW, and the duration of electricity market participation T = 10 h.

Table 1.
Rated battery energy storage system (BESS) power and capacity.
On the basis of conducted analysis, the advantages and disadvantages of both methods were indicated. The advantage of method #1 is the constant production of hybrid system power throughout the entire daily PV generation period. This enables to limit the variability of voltages and power flows in the examined area of the network. The biggest disadvantage of this method is the investment expenditure requirements. Compared with method #2, the energy storage capacity must be several dozen times greater, which practically disqualifies this method. In addition to economic reasons, the use of method #2 enables us to apply a more accurate short-term forecast of weather conditions, which translates into a more precise determination of production. This method allows for periodic (here Δt = 1 h) stabilization of active power flows in the examined area of the network. In addition, the use of converter systems enables to use the solutions that allow the regulation of reactive power flow or voltage level. Thus, it is possible for the analysed hybrid system to provide ancillary services in the scope of reactive power or voltage control at PCC.
To summarize the data gathered in Section 2 and results obtained from simulation tests, the following steps are recommended:
- Knowing the nature of the DAM and taking into account significant difference in capital expenditures, method #2 of bidding varying hourly electricity production should be adopted;
- To size the battery power and energy capacity, the generation profile with the lowest instantaneous power variation, the maximum amplitude, and the maximum effective operation time should be chosen.
Considering the above, method #2 was chosen for the tests using real photovoltaic power plant and batteries.
4. Real-Time Tests
The results of the simulation tests described above were obtained assuming a small momentary variability of generation and 100% correctness of the solar irradiation forecast. For full verification of the proposed solution, two real-time experiments were performed with the use of LINTE^2 research laboratory infrastructure. In each of these tests the Li-ion battery was the subject of control. A scaled-down battery, connected to the low voltage power system, was used in the tests. Battery parameters are presented in Table 2.
Table 2.
Parameters of Li-ion battery installed in the LINTE^2 laboratory.
Tests were performed in two stages:
- Stage #1—the PV generated power variation was emulated by laboratory load model based on power frequency converter. It allows, inter alia, us to freely shape the load / generation curve. Detailed information on the research capabilities of this device was provided in [39,40].
- Stage #2—the experiment using a real PV power plant installed on the roof of the LINTE^2 laboratory (Figure 5) was conducted.
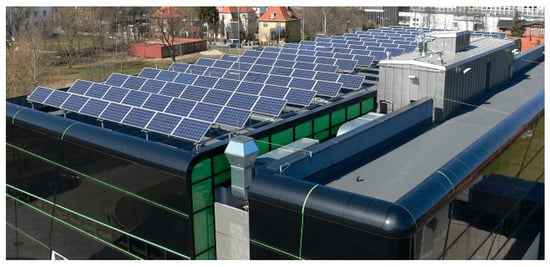 Figure 5. A view of photovoltaic panels installed on the roof of the LINTE^2 laboratory [41].
The tests were carried out on the systems shown in Figure 6, and the states of the switches were as follows:
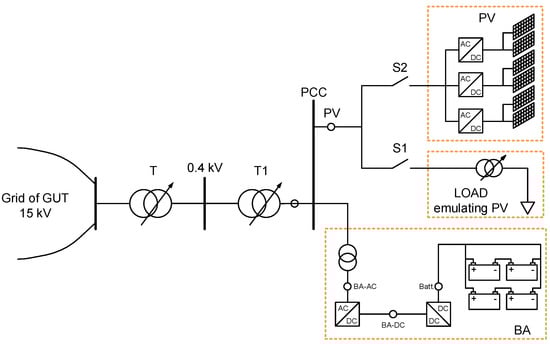
Figure 6.
The schematic diagram of a test system with PV emulator by laboratory load model based on power frequency converter or with PV power plant. T: power transformer 15/0.4 kV/kV, T1: transformer of the hybrid PV-BESS system.
- Stage #1: switch S1 was ON, switch S2 was OFF;
- Stage #2: the switch S1 was OFF and the switch S2 was ON.
The places of measurements were circled in Figure 6 and were given symbols, which were used as indices of measured variables, presented in Figure 10a–d. All values were expressed in relative units (pu, per unit). The active power was referred to the rated power of the PV installation, the values of the battery current were referenced in the C-Rate scale i.e. the current related to the rated battery capacity.
4.1. Stage #1 - Test with Emulated PV and Real Battery Energy Storage
One of the important aspects related to PV operation control is generation predictability. To eliminate the problem of stochasticity of PV power generation in the first stage of research, the PV generation was emulated using a laboratory load model based on power frequency converter [39]. This device modeled the variability of power generation according to the curve PPV(t), presented in Figure 7a. This curve was also used to develop the characteristics of the set power variation Pref(t), also shown in Figure 7a along with the characteristics of the power at the point of common coupling PPCC(t).
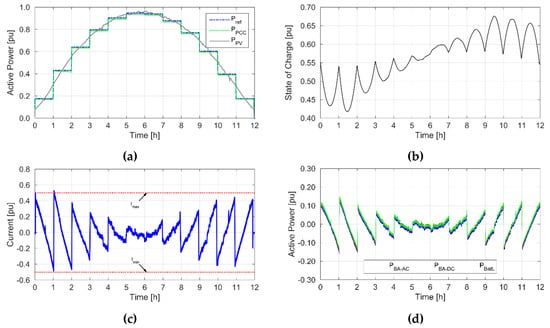
Figure 7.
Selected values obtained during simulation tests: (a) power curves, (b) the state of charge (SOC) curve of the battery energy storage, (c) the current measured at the battery output, (d) power curves. Where Pref is the reference power, the average power over an hour that results from the declared amount of electricity to be supplied at the PCC; PPCC is the power supplied at the PCC; PPV is power output of the PV installation; Imax, Imin are maximal and minimal accepted current levels, PBA-DC is power level at the DC side of the battery energy storage system; PBatt. Is power output at battery terminals; PBA-AC is power level at the AC side of the battery energy storage system.
The control of active power was performed adequately in every hour of the test. The temperature of battery modules did not exceed 30 ℃. Figure 7b depicts the state of charge of the battery energy storage, whereas in Figure 7c the battery current was presented. Measured power levels in selected points of the system (see Figure 6) were shown in Figure 7d.
The smallest generation of hybrid PV-BESS system was registered in the first hour, reaching 0.16 pu, and the largest generation was in the fifth hour i.e. 0.93 pu. As expected, slightly more than half of the battery energy capacity was used, which results from keeping the SOC in the range of 0.4–0.8 pu. Not using the entire range of available stored energy is caused by oversizing battery parameters in relation to the PV power. The battery selected in this way has a much larger capacity than would result from the energy demand in the control process.
In relation to the rated power of the hybrid power plant, the largest share of battery power was 0.15 pu. Figure 8 shows the variability of battery voltage with characteristic sudden voltage changes occurring at full hours of the experiment. This behavior is related to the change in the power setpoint of the hybrid power generation system (Pref) and thus the transition between charging and discharging modes.
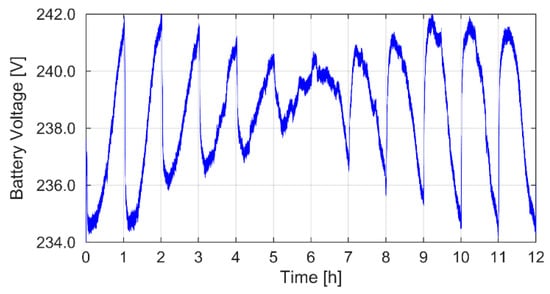
Figure 8.
Battery voltage waveform.
Despite charging and discharging with 0.5C current, the 243 V voltage level, which triggers the maximum battery voltage limitation, was not exceeded.
4.2. Stage #2—The Test with Real PV and Real Battery Energy Storage
4.2.1. Setting the Setpoint Schedule
Commercial implementation of the proposed way of operation of the discussed hybrid system would require the use of advanced generation forecasting methods. The experiment presented in this paper did not cover issues related to one-minute average PV power output forecasting. The battery operation schedule was prepared on the basis of data from several days preceding the day of the experiment and was corrected on-line during the experiment, by the operator, whose decisions relied on the observations of the changing weather conditions and the state of the battery. It means the power setpoint (Pref) may have been different that the value of power declared for each hour of the day (Pdecl) and the PV-BESS hybrid system operator preferred to incur the cost of balancing shortages in delivered power to exposing the battery to a risk of accelerated ageing.
Observing the weather forecasts and the course of solar irradiation from the weather station, a test was planned for 27 July 2018. The course of insolation, registered by the weather station from the 23 to 26 July 2018, was illustrated in Figure 9a, while the corresponding per-unit power output was presented in Figure 9b. In the analyzed period, the insolation level (Figure 9a) was characterized by high variability and the peak value was significant as for Polish conditions. A visible (around 12–1 pm) cyclical decrease in the level of insolation is the effect of shading the weather station by another object on the roof. Using the measurement data (Figure 9a) a schedule of reference power (Pref) values was determined for the mentioned three days and presented in Figure 9b, while the schedule for the day of the test was determined as the average of the three preceding days.
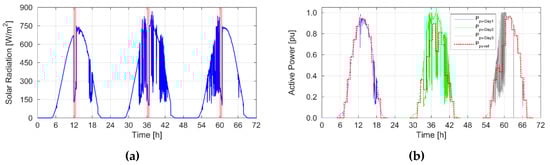
Figure 9.
The curves used to develop a battery operation schedule, registered from 23 to 26 July 2018: (a) solar irradiation (red bar indicates the time of the day, when the insolation measurement system is overshadowed by other objects installed on the roof of the laboratory), (b) per-unit power output of PV system.
4.2.2. Real-Time Test Realization and Results
The real-time test started at 7.15 am. Before starting the test the battery was discharged to the initial SOC value amounting to 0.55 pu. The test duration was 11.5 hours until 7 PM, and the curves were presented in Figure 10.
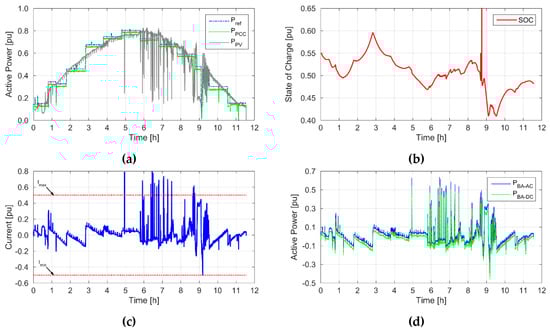
Figure 10.
Selected values obtained during simulation tests: (a) per-unit power curve, (b) per-unit state of charge (SOC) curve, (c) per-unit battery current, (d) per-unit power curves.
The battery power waveforms (Figure 10a) show what power the adjustment required in periods of cloud cover in the afternoon. The highest discharge power was 0.62 pu and the charge power was 0.46 pu. The above forced the battery current flow (Figure 10c) to reach a maximum of 0.8C - a value that is greater than the 0.5C limit. However, this did not cause the battery to be disconnected. In the case of a lithium-ion battery, the operation with currents higher than 0.5C for a long time will not result in surpassing the permissible operating states. The critical moment from the point of view of the test was the occurrence of heavy cloud cover (about ninth hour of the experiment). A significant reduction in PV generation resulted in an increase in battery power transferred to the system. In order to avoid decreasing the SOC to the values below 0.4 pu, a significant adjustment of Pref was introduced. This enabled fast rebuilding of the energy potential of the storage for further regulation.
In the event of sudden long-term cloudiness, in the case of real participation in active power control, an algorithm should be developed that changes the set point in such a way as to minimize losses resulting from failure to meet the declared power. Such an algorithm will be presented in subsequent publications of the authors.
5. Cost Analysis
5.1. Methodology
The aim of this analysis was to determine the costs of the hybrid PV-BESS system cooperating with a balancing group submitting bids to the day-ahead market. Since the measurements described in previous Sections were recorded for three days only, and the cost analysis is performed on the annual basis, the PV power generation profile was determined with the use of PV GIS databases, i.e., COSMO, SARAH, ERA5 and CMSAF [42] for the LINTE^2 laboratory location. Each database recorded the solar irradiation for a different time of the hour, i.e. 00:00; 00:11; 00:30; 00:56, etc. Linear interpolation was used to increase the resolution of the power generation profile, PPV(t,h,i), where: t is the index of years, h is the index of hours and i is the index of minutes. Rated electric power output of the PV system was PPV(max) = 4000 kW, and the total initial power losses of the system were 14%. Then, the hourly electricity production from PV was obtained. The hourly average power level Pref(t,h) declared in the common scheduling unit submitted by the balancing group to the DAM was calculated with the assumption of the randomly generated forecast error, namely:
is forecasted PV power output; is forecast error of ± 10%.
It was assumed that the BESS would operate if PPV(t,h,i) ≠ Pref(t,h), and the BESS power output was calculated using the following function—a modification of the one presented in [43]:
where Crate denotes charging/discharging rate (C–rate): “a measure of the rate at which a battery is charged/discharged relative to its maximum capacity” [44]. Here Crate = 0.5; PESr was the rated power of the BESS, including power converter losses [kW]; SOCt,h,i was the state of charge of the energy storage in year t, hour h and minute i, while SOCmin and SOCmax were minimal and maximal accepted SOC, established at 0.4 and 0.8, respectively. SOC was determined as follows [43]:
the initial value of the SOC was:
and ηES was BESS one-way efficiency determined as follows [43]:
ηES was one-way BESS efficiency when discharging and charging battery, equal to ηESin = 0.85, ηESout = 1.15, respectively.
BESS maximal capacity in each sub-period was determined as follows:
where: Jmax(1) = Jr and Jr was battery rated capacity (kWh), whereas cfade(t) was the capacity (energy) fading rate, tBOL, tEOL were the periods representing the beginning and the end of battery life, respectively, determined as a solution of the following equation:
Battery fading rate was a product of two fading rates, i.e.:
where: cf_cyc(t), cf_cal(t) are capacity fade for cycle conditions and capacity fade for idling, respectively, determined using the models of battery ageing presented in [45].
To assess economic viability of the PV-BESS operation on the electricity markets, the annual costs of PV-BESS operation on electricity markets were determined:
where: t is time period set; Kcap,t are capital costs of PV-BESS, year t [$/a]; KO&M,t are operation and maintenance costs of PV-PBESS, year t [$/a]; KEBMp,t are costs of electricity purchased on balancing market, year t [$/a].
Capital costs were obtained as a sum of depreciation (Kdep,t) and interest on the loan (Kloan,t):
Where: Kinv is discounted investment expenditures [$], n2 is depreciation period [a], n3 is loan period.
The discount rate (p) was obtained using weighted average cost of capital (WACC):
where uequ, uloan, pequ, ploan are the shares of and the interest rates on the equity and the loan, respectively [-]; stax is income tax rate [-].
Investment expenditures were determined as a discounted sum of all investments made within the lifetime of the hybrid system. It was assumed that t = 0 is the period of the system installation:
where N is the technical lifetime of the installation [a]; Kinv,t are annual capital expenditures incurred to install BESS-PV system, determined as follows:
where kinv(P),t are specific investment cost of battery power PESr [$/kW], battery capacity (energy) [$/kWh], and PV system [$/kW], respectively; whereas PESr, Jr are BESS rated power output and rated energy capacity, respectively.
Operation and maintenance costs were obtained as a discounted average of the costs incurred annually:
where kO&M,BESS,t, kO&M,PV,t are specific O&M costs of the BESS and PV.
The costs of balancing assumed that the PV-BESS were computed on the basis of the electricity market prices and the shortfall or excess of electricity in relation to the reference (declared) value:
where c(EBMp),i,t, EEBMp,i,t are the price ($/kWh) and the amount of electricity (kWh) exchanged with the balancing group, hour i of the year t, Eref,i,t is electricity declared for submission in a common scheduling unit [kWh], EPCC,i,t is electricity delivered to the point of common coupling (kWh).
Subsequently, we computed cost of electricity (COE) and levelized cost of electricity (LCOE) of a PV and BESS system. COE was obtained by dividing annual costs Kt by annual electricity delivery to PCC EPCC,t, while levelized cost of electricity (LCOE) [$/kWh] was calculated as follows:
5.2. Datasets
Cost analysis was performed for three different cases so as to deal with data uncertainty. Case 1 was the most pessimistic, while case 3 was the most optimistic, in terms of assumptions.
In Table 3, general data concerning PV-BESS system, acting as a member of a balancing group selling electricity to the DAM, were presented. Table 4 and Table 5 contain data on PV system and BESS, respectively. Battery lifetime was determined on the basis of lifetime model and data, presented in [28,45].
Table 3.
General data for the PV-BESS system operating in the balancing group selling electricity to the DAM.
Table 4.
Data for power generation technology—photovoltaic system. Note: Data sources: (a) [46], (b) [47].
Table 5.
Data for energy storage technology—lithium-ion battery energy storage system. Note: Data sources: (c) [43], (d) [48].
5.3. Results
The yearly profiles (for the first year of the analysis) of PV power output, the power delivered to the point of common coupling and the power exchanged with the electricity balancing market were presented in Figure 11. The results show that there is a need for electricity balancing market participation, despite the BESS being in place. In addition, the declared power was based on weather forecasts and assumed error was only +/- 10%. Increase in the forecast error would result in the higher need for electricity exchange with EBM and higher costs, if the battery parameters remained on the same level.
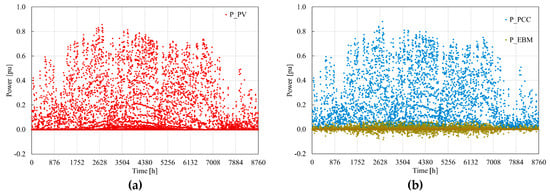
Figure 11.
The yearly profiles of (a) the power generated by PV system PPV, (b) the power at the point of common coupling PPCC and power exchanged with the electricity balancing market PEBM (all related to PV system rated power). Own illustration based on PV GIS data on solar irradiation for LINTE^2 location.
In Figure 12, the battery operation yearly profile was presented along with the characteristics of the state of charge at the beginning of each hour of the analysis first year. One should note that during one hour SOC may vary, increasing the number of both charging and discharging operations the battery should perform. There are instances of trespassing the thresholds of SOCmin and SOCmax, which result from the one-minute resolution of power generation profile that may enable to discharge the battery below minimal SOC and to charge it above the maximal accepted SOC, since the decision is made on the basis of the SOC at the end of the minute preceding charging or discharging operation. Further increase in the resolution of the calculations and application of predictive control would solve this problem. However, it would also lead to the computation time extension.
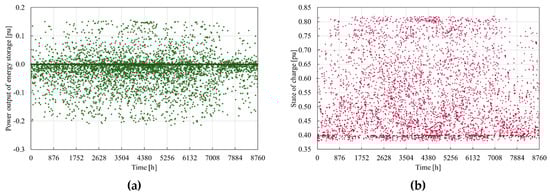
Figure 12.
The yearly profiles of: (a) power charging or discharged from BESS PES (related to battery rated power) in the analysis first year, (b) the BESS state of charge (related to battery capacity) at the beginning of each hour of the analysis first year. Own illustration.
Figure 13a depicts market electricity prices extracted from the DAM transactions reports published by Polish power exchange TGE SA [49]. On this basis, weighted average electricity price was calculated for the first year of the analysis, and given the assumption on the annual growth rate of DAM prices, respectively amounting to 1.5%, 2.0% and 2.5% in cases 1, 2 and 3, the price pathway was drawn and presented in Figure 13b along with the cost of electricity calculations for cases 1 to 3. Levelized cost of electricity for all three cases is presented in Table 6.
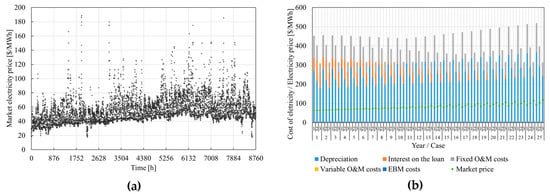
Figure 13.
Selected data presenting the Polish electricity market: (a) the yearly profile of electricity market price (own illustration based on the data from Polish power exchange TGE SA [49]) and (b) cost of electricity generation and weighted average electricity market price.
Table 6.
Results of economic analysis.
The characteristics from Figure 12a suggest that the battery remains idle during most of the time of the year, which may result from reaching SOCmax or SOCmin, more frequently the lower value, as it can be seen from Figure 12b. The other reason for relatively low activity of the battery is that the forecast error is low i.e. +/− 10% and frequent intervention of the battery is not required. Increase in the battery capacity would extend battery capabilities and the number of charging and discharging operations and lead to the system cost increase, whereas lowering SOCmin to 0.2 would shorten battery life. The benefit, i.e. reduced costs of electricity purchased on the balancing market, is not expected to cover the extended costs of battery in current market conditions. Levelized cost of electricity is three to five times higher than the average DAM price.
As shown in Figure 13, the unit cost of electricity generated by PV-BESS hybrid system exceeds the weighted average market price, which is calculated as the annual sales of electricity to the market divided by the amount of the energy sold. The PV-BESS proves to be not profitable in the current market conditions. Currently, renewable energy sources in Poland can sell electricity on the guaranteed-price basis (feed-in tariff), provided that they win an auction. The renewable electricity tariff is two to three times higher than the annual average wholesale market price and is guaranteed for 15 years following the commissioning of the installation. Failure to win the auction means that the renewable source is not promoted, and has to compete on the electricity market. Because the lifetime of PV system is longer than 15 years, installations will face the challenges of being market participants, after the period of guaranteed-price. As presented in Figure 13b, the highest share in specific cost of electricity in PV-BESS system is annualized capital component i.e. depreciation and loan cost. Further development in PV and BESS technologies is expected to cause the reduction of this component and the average market prices of electricity may grow faster than it was assumed in the analysis e.g. due to deep decarbonization of the energy sector and resulting mechanisms combating greenhouse gases, of which EU ETS is the most recognized. In 2015, levelized cost of electricity generated from PV system installations of 4–5 MW installed capacity, built in Germany, Denmark and the United Kingdom ranged from 78 to 166 $/MWh [3]. The global weighed average LCOE for PV in 2018 was 90 $/MWh [25]. LCOE for lithium-ion batteries ranged from 157 to 169 $/MWh [10] and depends on the character of storage operation.
6. Conclusions
The results obtained from the real-time control experiment have shown that energy storage cooperation with PV on a day-ahead market is technically feasible. However, developing a control strategy to follow hourly commitments is a complex problem. The laboratory experiment have proven that the real-life operation with set hourly values of average power requires frequent battery charging and discharging operations and constant control of battery parameters. Operators of the hybrid photovoltaic-battery energy storage system must bear in mind the limitations in the battery power output, capacity, state of charge and temperature to avoid its accelerated ageing. However, this requires their constant involvement in the control process. No less important issue is the development of forecasting mechanisms and behavior in situations of significant weather collapse. Algorithms with an in-built capability of weather forecasting could limit the extent of operator involvement and reduce the cost of market clearance with other members of the balancing group.
The cost of the battery energy storage system (per unit of electricity delivered to the point of common coupling) must be lower than the cost of electricity purchased on the balancing market to guarantee BESS profitability. In a current market situation, using battery is not profitable if a PV system offers electricity to the day-ahead market. The levelized cost of electricity is several times higher than the annual average day-ahead market price. Future changes in market conditions, involving the increase in electricity price, especially in specific times of the day (peak-time) will promote energy storage technologies. However, offering electricity at peak time requires batteries of capacities guaranteeing a storage of energy produced for several hours and would only be possible in a case of further battery-price decrease, since the capital component constitutes the highest share in the cost of electricity generated and offered to the market.
Battery use for voltage control is considered in the future research due to its excellent capabilities in terms of voltage and reactive power control. BESS allows independent control of active power and voltage at the point of common coupling. To make voltage control possible, the DC converter circuit must be supplied with active power, usually amounting to a dozen percent of the inverter rated power [50]. This power either can flow from the grid or can be discharged from the BESS. Currently available converter systems are able to switch with very low power losses between the power consumption from the network and the storage-discharging mode. Bearing in mind the above, research on the method of controlling active and reactive power and voltage levels in hybrid power grids involving, for example, PV, wind farm, biogas plants, energy storage, etc. will be continued by the authors.
Author Contributions
All of the authors have contributed to this research. R.M. proposed the study idea, did simulations, shared in revising the paper and wrote the first part of manuscript. R.M. and W.P. conceived and designed the experiments. W.P. performed the experiments and analyzed the data. M.J. prepared the data and conducted economics analysis and wrote the second part of manuscript and polished the language of the manuscript. All authors have read and agreed to the published version of the manuscript.
Funding
This research received no external funding. The APC was funded by Gdańsk University of Technology.
Conflicts of Interest
The authors declare no conflict of interest.
References
- European Commission. Energy Roadmap 2050 COM(2011) 885 Final of 15 December 2011; European Commission: Luxembourg, 2012. [Google Scholar] [CrossRef]
- European Commission. Directive 2009/28/EC of the European Parliament and of the Council of 23 April 2009 on the Promotion of the Use of Energy from Renewable Sources and Amending and Subsequently Repealing Directives 2001/77/EC and 2003/30/EC.; Official Journal of the European Union L 140/16; Publications Office of the European Union: Luxembourg, 2009. [Google Scholar]
- International Energy Agency; Nuclear Energy Agency. Projected Costs of Generating Electricity 2015 Edition; Organisation for Economic Co-operation and Development/International Energy Agency: Paris, France; Organisation for Economic Co-operation and Development/Nuclear Energy Agency: Issy-les-Moulineaux: Paris, France, 2015. [Google Scholar]
- European Commission. Directive 2009/29/EC of the European Parliament and of the Council of 23 April 2009 amending Directive 2003/87/EC so as to improve and extend the greenhouse gas emission allowance trading scheme of the Community; Official Journal of the European Union L 140/63; Publications Office of the European Union: Luxembourg, 2009. [Google Scholar]
- European Commission. Proposal for a decision of the European Parliament and of the Council concerning the establishment and operation of a market stability reserve for the Union greenhouse gas emission trading scheme and amending Directive 2003/87/EC; {SWD(2014) 17} {SWD(2014) 18}; European Commission: Brussels, Belgium, 2014. [Google Scholar] [CrossRef]
- IRENA. Planning for the Renewable Future: Long-Term Modelling and Tools to Expand Variable Renewable Power in Emerging Economies; International Renewable Energy Agency: Abu Dhabi, UAE, 2017. [Google Scholar]
- Capros, P.; De Vita, A.; Tasios, N.; Papadopoulos, D.; Siskos, P.; Apostolaki, E.; Zampara, M.; Paroussos, L.; Fragiadakis, K.; Kouvartakis, N.; et al. EU Energy, Transport and GHG Emissions. Trends to 2050. Reference Scenario 2013; Publications Office of the European Union: Luxembourg, 2014. [Google Scholar] [CrossRef]
- Subramaniam, U.; Vavilapalli, S.; Padmanaban, S.; Blaabjerg, F.; Holm-Nielsen, J.B.; Almakhles, D. A Hybrid PV-Battery System for ON-Grid and OFF-Grid Applications—Controller-In-Loop Simulation Validation. Energies 2020, 13, 755. [Google Scholar] [CrossRef]
- Dunn, B.; Kamath, H.; Tarascon, J.-M. Electrical Energy Storage for the Grid: A Battery of Choices. Science 2011, 334, 928–935. [Google Scholar] [CrossRef] [PubMed]
- Obi, M.; Jensen, S.M.; Ferris, J.B.; Bass, R.B. Calculation of levelized costs of electricity for various electrical energy storage systems. Renew. Sustain. Energy Rev. 2017, 67, 908–920. [Google Scholar] [CrossRef]
- Han, X.; Liang, Y.; Ai, Y.; Li, J. Economic Evaluation of a PV Combined Energy Storage Charging Station Based on Cost Estimation of Second-Use Batteries. Energy 2018, 165, 326–339. [Google Scholar] [CrossRef]
- Sejm Rzeczypospolitej Polskiej. Ustawa z dnia 20 lutego 2015 r. o Odnawialnych Źródłach Energii; Dz. U. z 2015 r. poz. 478; Elsevier: Amsterdam, The Netherlands, 2015; p. 2365. [Google Scholar]
- Gomes, I.L.R.; Pousinho, H.M.I.; Melício, R.; Mendes, V.M.F. Stochastic coordination of joint wind and photovoltaic systems with energy storage in day-ahead market. Energy 2017, 124, 310–320. [Google Scholar] [CrossRef]
- Cai, Z.; Bussar, C.; Stöcker, P.; Moraes, L.; Magnor, D.; Sauer, D.U. Optimal Dispatch Scheduling of a Wind-battery-System in German Power Market. Energy Procedia 2016, 99, 137–146. [Google Scholar] [CrossRef]
- Ding, H.; Hu, Z.; Song, Y.; Pinson, P. Improving offering strategies for wind farms enhanced with storage capability. In Proceedings of the 2015 IEEE Eindhoven PowerTech, Eindhoven, The Netherlands, 29 June–2 July 2015; pp. 1–6. [Google Scholar] [CrossRef]
- Yang, Y.; Bremner, S.; Menictas, C.; Kay, M. A Mixed Receding Horizon Control Strategy for Battery Energy Storage System Scheduling in a Hybrid PV and Wind Power Plant with Different Forecast Techniques. Energies 2019, 12, 2326. [Google Scholar] [CrossRef]
- Zhai, Q.; Meng, K.; Dong, Z.Y.; Ma, J. Modeling and Analysis of Lithium Battery Operations in Spot and Frequency Regulation Service Markets in Australia Electricity Market. IEEE Trans. Ind. Inform. 2017, 13, 2576–2586. [Google Scholar] [CrossRef]
- Pandzic, H.; Kuzle, I. Energy storage operation in the day-ahead electricity market. In Proceedings of the 2015 12th International Conference on the European Energy Market (EEM), Lisbon, Portugal, 19–22 May 2015; pp. 1–6. [Google Scholar] [CrossRef]
- Fedjaev, J.; Amamra, S.A.; Francois, B. Linear programming based optimization tool for day ahead energy management of a lithium-ion battery for an industrial microgrid. In Proceedings of the 2016 IEEE International Power Electronics and Motion Control Conference (PEMC), Varna, Bulgaria, 25–28 September 2016; pp. 406–411. [Google Scholar] [CrossRef]
- Mohsenian-Rad, H. Optimal bidding, scheduling, and deployment of battery systems in California day-ahead energy market. IEEE Trans. Power Syst. 2016, 31, 442–453. [Google Scholar] [CrossRef]
- Kazemi, M.; Zareipour, H.; Amjady, N.; Rosehart, W.D.; Ehsan, M. Operation Scheduling of Battery Storage Systems in Joint Energy and Ancillary Services Markets. IEEE Trans. Sustain. Energy 2017, 8, 1726–1735. [Google Scholar] [CrossRef]
- Krishnamurthy, D.; Uckun, C.; Zhou, Z.; Thimmapuram, P.; Botterud, A. Energy Storage Arbitrage Under Day-Ahead and Real-Time Price Uncertainty. IEEE Trans. Power Syst. 2017, 33, 84–93. [Google Scholar] [CrossRef]
- He, G.; Chen, Q.; Kang, C.; Pinson, P.; Xia, Q. Optimal Bidding Strategy of Battery Storage in Power Markets Considering Performance-Based Regulation and Battery Cycle Life. IEEE Trans. Smart Grid 2016, 7, 2359–2367. [Google Scholar] [CrossRef]
- Hesse, H.; Kumtepeli, V.; Schimpe, M.; Reniers, J.; Howey, D.; Tripathi, A.; Wang, Y.; Jossen, A. Ageing and Efficiency Aware Battery Dispatch for Arbitrage Markets Using Mixed Integer Linear Programming. Energies 2019, 12, 999. [Google Scholar] [CrossRef]
- IRENA. Renewable Power Generation Costs in 2018; IRENA: Abu Dhabi, UAE, 2019. [Google Scholar]
- Małkowski, R.; Jaskólski, M.; Bućko, P.; Pawlicki, W.; Stoltmann, A. Simulation of the dynamics of renewable energy sources with energy storage systems. In Proceedings of the EEM 2018 15th International Conference on the European Energy Market, Łódź, Poland, 27–29 June 2018. [Google Scholar]
- Bućko, P.; Jaskólski, M.; Lubośny, Z.; Klucznik, J.; Dobrzyński, K. Delivery of ancillary services in distribution power systems. In Proceedings of the EEM 2018 15th International Conference on the European Energy Market, Łódź, Poland, 27–29 June 2018. [Google Scholar]
- Groot, J.; Swierczynski, M.; Stan, A.I.; Kær, S.K. On the complex ageing characteristics of high-power LiFePO4/graphite battery cells cycled with high charge and discharge currents. J. Power Sources 2015, 286, 475–487. [Google Scholar] [CrossRef]
- Choi, S.S.; Lim, H.S. Factors that affect cycle-life and possible degradation mechanisms of a Li-ion cell based on LiCoO2. J. Power Sources 2002, 111, 130–136. [Google Scholar] [CrossRef]
- Diúçi, F.N.; El-kahlout, Y.; Balõkçõ, A. Li-ion Battery Modeling and SOC Estimation Using Extended Kalman Filter. In Proceedings of the 2017 10th International Conference on Electrical and Electronics Engineering (ELECO), Bursa, Turkey, 30 November–2 December 2017; pp. 166–169. [Google Scholar]
- Takahashi, K.; Tsujikawa, T.; Hirose, K.; Hayashi, K. Estimating the life of stationary lithium-ion batteries in use through charge and discharge testing. In Proceedings of the 2014 IEEE 36th International Telecommunications Energy Conference (INTELEC), Vancouver, BC, Canada, 28 September–2 October 2014; pp. 1–4. [Google Scholar] [CrossRef]
- Zhang, Y.J.A.; Zhao, C.; Tang, W.; Low, S.H. Profit-Maximizing Planning and Control of Battery Energy Storage Systems for Primary Frequency Control. IEEE Trans. Smart Grid 2018, 9, 712–723. [Google Scholar] [CrossRef]
- Torres, B.; Quintero, V.; Estevez, C.; Orchard, M.; Azurdia, C. SoC control for improved battery life and throughput performance under VST-TDMA. Electron. Lett. 2017, 53, 183–185. [Google Scholar] [CrossRef]
- Zhu, F.; Liu, G.; Tao, C.; Wang, K.; Jiang, K. Battery management system for Li-ion battery. J. Eng. 2017, 2017, 1437–1440. [Google Scholar] [CrossRef]
- Kottick, D.; Blau, M.; Edelstein, D. Battery energy storage for frequency regulation in an island power system. IEEE Trans. Energy Convers. 1993, 8, 455–459. [Google Scholar] [CrossRef]
- Medora, N.K.; Kusko, A. Dynamic Battery Modeling of Lead-Acid Batteries using Manufacturers’ Data. In Proceedings of the INTELEC 05—Twenty-Seventh International Telecommunications Conference; IEEE, Berlin, Germany, 18–22 September 2005; pp. 227–232. [Google Scholar] [CrossRef]
- Barsali, S.; Ceraolo, M. Dynamical models of lead-acid batteries: Implementation issues. IEEE Trans. Energy Convers. 2002, 17, 16–23. [Google Scholar] [CrossRef]
- DIgSILENT. DIgSILENT PowerFactory Application Example - Battery Energy Storing Systems; DIgSILENT: Gomaringen, Germany, 2010. [Google Scholar]
- Blaabjerg, F.; Kedra, B.; Malkowski, R. Energy storage device based on flywheel, power converters and Simulink real-time. In Proceedings of the 2017 IEEE International Conference on Environment and Electrical Engineering and 2017 IEEE Industrial and Commercial Power Systems Europe (EEEIC/I&CPS Europe), Milan, Italy, 6–9 June 2017; pp. 1–4. [Google Scholar] [CrossRef]
- Małkowski, R.; Kędra, B. Laboratory Load Model Based on 150 kVA Power Frequency Converter and Simulink Real-Time – Concept, Implementation, Experiments. Acta Energ. 2016, 28, 94–101. [Google Scholar] [CrossRef]
- 2sun Recommendations - 2sun.pl. Available online: http://2sun.pl/referencje/ (accessed on 9 March 2020).
- European Commission - Joint Research Centre JRC Photovoltaic Geographical Information System (PVGIS). Available online: http://re.jrc.ec.europa.eu/pvgis.html (accessed on 10 December 2018).
- Brekken, T.K.A.; Yokochi, A.; von Jouanne, A.; Yen, Z.Z.; Hapke, H.M.; Halamay, D.A. Optimal Energy Storage Sizing and Control for Wind Power Applications. IEEE Trans. Sustain. Energy 2010, 2, 69–77. [Google Scholar] [CrossRef]
- MIT. Electric Vehicle Team A Guide to Understanding Battery Specifications; MIT: Cambridge, MA, USA, 2008. [Google Scholar]
- Stroe, D.-I.; Knap, V.; Swierczynski, M.; Stroe, A.-I.; Teodorescu, R. Operation of a Grid-Connected Lithium-Ion Battery Energy Storage System for Primary Frequency Regulation: A Battery Lifetime Perspective. IEEE Trans. Ind. Appl. 2017, 53, 430–438. [Google Scholar] [CrossRef]
- Fu, R.; Feldman, D.; Margolis, R.; Woodhouse, M.; Ardani, K.U.S. Solar Photovoltaic System Cost Benchmark: Q1 2017; National Renewable Energy Laboratory: Golden, CO, USA, 2017. [Google Scholar] [CrossRef]
- International Energy Agency (IEA). Investment Costs. Available online: http://www.worldenergyoutlook.org/weomodel/investmentcosts/ (accessed on 4 April 2016).
- U.S. Energy Information Administration. U.S. Battery Storage Market Trends; U.S. Energy Information Administration: Washington, DC, USA, 2018.
- Towarowa Giełda Energii SA Statistical Data. Available online: https://tge.pl/dane-statystyczne (accessed on 19 February 2020).
- Kundur, P. Power System Stability and Control; McGraw-Hill Education - Europe: New York, NY, USA, 1994. [Google Scholar]
© 2020 by the authors. Licensee MDPI, Basel, Switzerland. This article is an open access article distributed under the terms and conditions of the Creative Commons Attribution (CC BY) license (http://creativecommons.org/licenses/by/4.0/).