Abstract
The automated process of coating catalyst layers on gas diffusion electrodes (GDEs) for high-temperature proton exchange membrane fuel cells results inherently into a number of defects. These defects consist of agglomerates in which the platinum sites cannot be accessed by phosphoric acid and which are the consequence of an inconsistent coating, uncoated regions, scratches, knots, blemishes, folds, or attached fine particles—all ranging from μm to mm size. These electrochemically inactive spots cause a reduction of the effective catalyst area per unit volume (cm2/cm3) and determine a drop in fuel cell performance. A computational fluid dynamics (CFD) model is presented that predicts performance variation caused by manufacturing tolerances and defects of the GDE and which enables the creation of a six-sigma product specification for Advent phosphoric acid (PA)-doped polybenzimidazole (PBI)-based membrane electrode assemblies (MEAs). The model was used to predict the total volume of defects that would cause a 10% drop in performance. It was found that a 10% performance drop at the nominal operating regime would be caused by uniformly distributed defects totaling 39% of the catalyst layer volume (~0.5 defects/μm2). The study provides an upper bound for the estimation of the impact of the defect location on performance drop. It was found that the impact on the local current density is higher when the defect is located closer to the interface with the membrane. The local current density decays less than 2% in the presence of an isolated defect, regardless of its location along the active area of the catalyst layer.
1. Introduction
Advent PBI (type APM) are phosphoric acid (PA)–doped polybenzimidazole (PBI)-based high-temperature membrane electrode assemblies (MEAs) produced and commercialized by Advent Technologies Inc. under license from BASF. They are capable of operating in proton exchange membrane fuel cells (PEMFCs) between 120 °C and 180 °C without external humidification, which renders significant benefits over the low-temperature perfluorosulfonic acid (PFSA) membranes such as Nafion. These benefits include simplified water and thermal management, faster electrode kinetics for both electrode reactions, and considerably improved anode tolerance to CO concentrations up to 3% [1] (compared to less than 10 ppm in low-temperature MEAs). These benefits make Advent’s PBI MEAs particularly suitable for reformate gas-operating PEMFC stationary systems with a simplified design, in which the preferential oxidation stage in the fuel processing line can be eliminated. Alternatively, their high-temperature, low-humidity operating range leads to PEMFC automotive systems with a significant reduction in cost and complexity resulted from a smaller radiator in the cooling loop and from the elimination of the humidifiers in the gas feed loops.
The PA-doped PBI membranes were introduced by Savinell and Litt [2,3,4] as a promising candidate for low-cost, high-performance material for PEMFC MEAs. They were prepared either by imbibing the PBI membrane with PA or casting directly from a solution of PBI with a mixed acid solvent containing PA [5,6,7,8]. The membranes obtained from these methods resulted in 5–15 PA molecules per PBI repeat unit and demonstrated high ionic conductivities (0.08 S/cm at 200 °C and 10% RH), low gas permeability, excellent oxidative and thermal stability, and nearly zero water drag coefficient [5,6,7,8].
Advent PBI membranes are obtained from a sol-gel process [9,10] resulting from the hydrolysis of polyphosphoric acid (PPA) to PA when PBI-PPA solutions are cast into films. The resulting membrane has higher levels of PA in the gel structure (up to 70 PA molecules per PBI repeat unit) exhibiting ionic conductivities up to 0.26 S/cm at 200 °C and better mechanical properties at elevated temperatures. Advent PBI MEAs are produced at Advent Technologies Inc., under license from BASF. These MEAs are fabricated by hot-pressing a gas diffusion electrode (GDE) on each side of the membrane [11]. After hot-pressing, the membrane thickness decreases to 75–120 μm. The membrane ionic conductivity reduces to about 0.11 S/cm.
GDEs in Advent PBI MEAs consist of a carbon fiber cloth macro-porous substrate about 400 μm thick and a catalyst layer about 30–50 μm thick coated on the macro-porous substrate in an automated process. The resulting GDEs have total catalyst loadings of 1.8 mg/cm2 total Pt. Catalyst layers are porous structures with a random composite morphology, consisting of a mixture of Vulcan XC 72 carbon-supported platinum (C/Pt) and polytetrafluoroethylene (PTFE) as binder. The C/Pt matrix consists of carbon grains (20–40 nm) which form agglomerates of 200–400 nm size. Their porous structure is characterized by a bi-modal pore size distribution, with primary pores of 20–40 nm inside the agglomerates and secondary pores of 40–400 nm between the agglomerates. The size of the catalyst particles dispersed on the carbon grains is 2–5 nm. PTFE, due to its molecular size cannot penetrate the intra-agglomerates, but exist only in the inter-agglomerate space [12].
During fabrication of the MEA, some PA is introduced into the adjacent catalyst layers. Catalyst layers thus provide continuous paths for protons to reach the catalyst sites through the PA network, for electroactive species through the porous network, and for electrons through the C/Pt matrix. Since the electrochemical reactions take place at the catalyst sites which are simultaneously accessible by protons, electroactive species, and electrons, only the Pt particles covered with PA are electrochemically active. Experimental results [13] have shown that if a Nafion film less than ~200 nm thick covers the Pt particles, oxygen can diffuse efficiently through it and the reaction rate is not controlled by mass transport limitations in the coating. Since the oxygen permeation in PA is of the same order as in Nafion (3.2 × 10⁻¹² (mol cm−1s−1) in 95 wt.% aqueous solution of PA at 150 °C [14] vs. 1.7 × 10⁻¹²–19.2 × 10⁻¹² (mol cm−1s−1) in Nafion 117 [15]), one may conclude that oxygen can be efficiently transported towards the catalyst particles through the PA film, provided the film is less than ~200 nm thick. This distance coincides with the upper limit of an agglomerate radius. All the catalyst particles in the flooded primary pores and those in the secondary pores not covered by PTFE are therefore electrochemically active.
The automated process of coating the catalyst layer on the macro-porous substrate may result in a number of defects (Figure 1) consisting of agglomerates in which the Pt sites cannot be accessed by PA and which are the consequence of an inconsistent PTFE coating, uncoated regions, scratches, knots, blemishes, folds, or attached fine particles—all ranging from μm to mm size. These electrochemically inactive spots cause a reduction of the effective catalyst area per unit volume (cm2/cm3), determine a drop in fuel cell performance, and are subject to a program of continuous improvement to identify the root cause and to reduce the incidence of these defects.
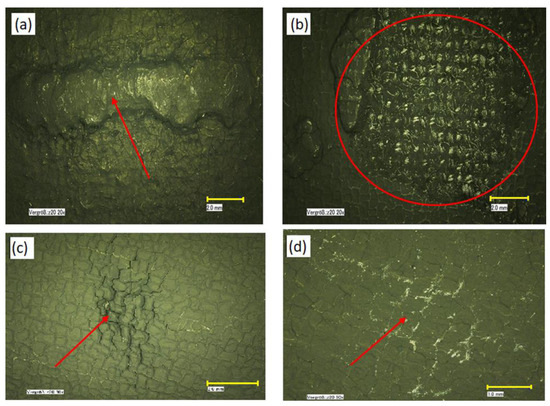
Figure 1.
Optical images of electrode defects: (a,b) catalyst agglomerates; (c) mud cracking; (d) polytetrafluoroethylene (PTFE) separation after sintering. The scale bars represent 2 mm (a–c) and 1 mm (d).
The Computational Fluid Dynamics (CFD) methodology is recognized as an essential tool for the complete engineering analysis of PEMFCs systems. Previous numerical simulations of high-temperature PEMFCs containing PA-doped PBI membranes include the models of Cheddie and Munroe [16], Siegel et al. [17,18], and Hu et al. [19].
An objective of this study is to create a CFD model that predicts performance variation caused by manufacturing tolerances and defects of the GDE and which enables the creation of a six-sigma product specification for Advent PBI MEAs. Another objective is to perform numerical simulations that provide quantitative estimations of the impact that various GDE manufacturing defects have on the fuel cell performance. A third objective of the study is to perform a sensitivity analysis of the defect location along the GDE and on the GDE porosity.
2. Mathematical Model
The 3D computational domain used in the study is shown in Figure 2. It comprises a cathode and an anode gas channel (1 mm × 1 mm cross-section, 3 mm distance between adjacent channels), a cathode and an anode GDE each consisting of a macro-porous gas diffusion layer (0.4 mm thick), a micro-porous catalyst layer (30 μm thick), and a membrane (70 μm thick). The domain extends from the channels’ inlets to the outlets and from the symmetry plane along the channels to the parallel symmetry plane running between two adjacent channels. This domain-size is sufficient to capture the fundamental issues related to fuel cell operation and the computational results may be extended to describe the operation of an entire HT-PEMFC. The CFD model is presented in Appendix A and Appendix B. It consists of transport equations for mass, momentum, and chemical species (hydrogen in the anode channel and GDE, oxygen, nitrogen, and water vapor in the cathode channel and GDE) and for the conservation of the electrical charge in the ionomer (PA)-phase of the GDE and membrane. At normal operating temperatures and pressures of HT-PEMFCs, water produced at cathode can only be as vapor, therefore the model is single-phase. Unlike low-temperature perfluorosulfonic acid (PFSA)-based membranes such as Nafion®, PA-doped PBI membranes do not need to be rehydrated during operation to improve their proton conductivity, therefore the hydrogen and air entering the domain are considered dry gasses. Water in the cathode flow-field is considered at equilibrium with the PA aqueous solution in the membrane, and since the electro-osmotic drag coefficient of water in PA-PBI membranes is nearly zero [6], sorption/desorption of water and electro-osmotic discharge of water [20,21,22,23,24,25] are neglected in the model.
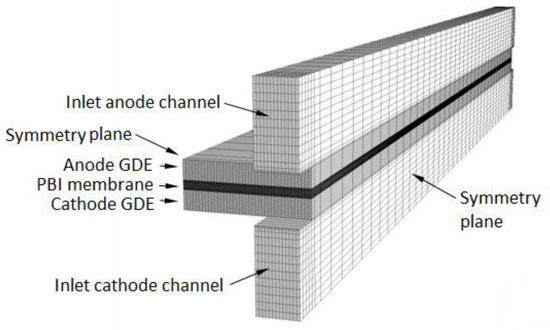
Figure 2.
Computational domain.
3. Results and Discussion
3.1. Baseline Performance of MEAs
The model parameters have been initially fitted to match the baseline [9] of a Celtec® -P1000 MEA in a fuel cell operating at atmospheric pressure and 160 °C with dry hydrogen and air at 1.2 and 2.5 anode and cathode stoichiometric ratios (Figure 3). Celtec-P1000 MEA was the predecessor to the Advent PBI MEA (Celtec-P1100W).
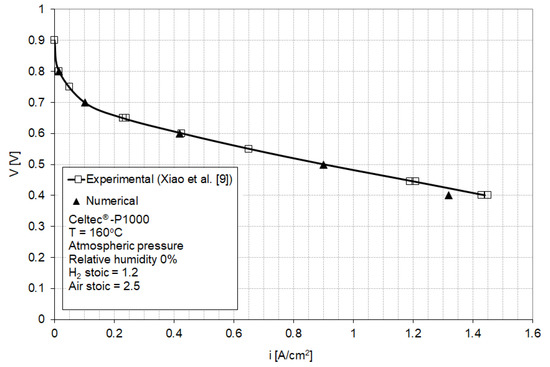
Figure 3.
Numerical (this work) and experimental (Reference [9]) polarization curves for a fuel cell equipped with high-temperature membrane electrode assemblies (HT-MEA) operated at ambient pressure and 160 °C with hydrogen and air at 1.2 and 2.5 stoichiometric ratios. (Adapted with permission from [9], Xiao, L.; Zhang, H.; Scanlon, E.; Ramanathan, L.S.; Choe, E.-W.; Rogers, D.; Apple, T.; Beniecewicz, B.C., Chem. Mater., 2005).
Since this study focuses on the cathode catalyst layer operation, when fitting the model parameters to the experimental baseline, particular consideration was given to the parameters affecting the activation and ohmic regions of the polarization curve (parameters in the Butler–Volmer Equations (A23) and (A25)). The best fit to the experimental baseline was obtained for the model parameters shown in Table 1.

Table 1.
Model parameter corresponding to a pristine MEA (fit values vs. measurement results).
The model values for the Tafel slope and the equilibrium potential in Table 1 represent theoretical values at 160 °C. The model value for the membrane conductivity is significantly lower than the value measured at 160 °C in Reference [9]. The measured value [9] corresponds to a membrane with a doping level of 32 mol PA per PBI repeat unit that results from the sol-gel process before hot-pressing it into the MEA. During hot-pressing some conductivity is lost. Thus, it is reasonable therefore that the fit value for the proton conductivity in the present model is equal to the actual conductivity of a membrane in the MEA.
Figure 3 shows a good agreement between the numerical and experimental polarization curves in the activation and ohmic regions, with a small deviation in the highest current density region. This discrepancy is attributed to the mass transport limitations induced by the particular flow-field used in the model, having dimensions different from the undisclosed flow-field dimensions in [9]. The calculation point for the subsequent analysis was selected at 0.5 V (0.9 A/cm2) which corresponds to a relatively high power density and which exhibits good agreement between model and experimental results.
3.2. Study of Agglomerate Distribution or Uncoated Regions in the Cathode Catalyst Layer That Would Cause a 10% Drop in Performance
During the catalyst layer fabrication process, the carbon supported platinum (C/Pt)-poly(tetra)fluoroethylene (PTFE) mixture organizes itself into clusters with a bimodal pore-size distribution in which the PTFE binder covers a fraction of catalyst sites. Only the Pt sites covered by PA are accessible by proton-bearing complexes and are electrochemically active. The catalyst layer fabrication process results inherently into a number of defects consisting of agglomerates of the order of 1 μm, in which the Pt sites cannot be accessed by PA. To predict performance variation caused by manufacturing tolerances and defects in the cathode catalyst layer that result from agglomerates or uncovered areas, a pristine catalyst layer was compared numerically with a hypothetical one prepared from an identical C/Pt ink (same Pt wt %) with the same catalyst loading (mg Pt/cm2) but exhibiting defects which cause a drop in performance. To achieve this, the effective catalyst area per unit volume (cm2/cm3) was changed in the Butler–Volmer Equation (A23) until a 10% drop in performance was obtained at the calculation point. When the defects are much smaller than the characteristic size of the catalyst layer (30 μm) and when they are uniformly distributed, the total volume of defects that cause the performance decay can be calculated as:
where a (cm2/cm3) is the effective catalyst area per unit volume of the pristine catalyst layer (Table 1), ad is the corresponding value for a catalyst layer with uniformly distributed defects, and V is the catalyst layer volume. Note that while the reference exchange current density, usually cannot be deconvoluted in calculations from the effective catalyst area per unit volume, a, it represents a constant which reduces in Equation (1).
Table 2 compares the effective catalyst area per unit volume for the pristine and defected catalyst layers, the total volume of defects, and the number of defects per unit active area that induce a 10% drop in performance at the calculation point. The total volume of defects that cause a 10% performance drop at 0.5 V would represent 39% of the total catalyst layer volume, being much larger than the volume of defects achievable by Advent Technolgies, Inc., with its automated process capabilities, so it represents a massive and easily detectable defect.
Table 2.
Total volume of defects and number of defects per unit active area that cause a 10% performance drop at 0.5 V.
The number of defects per unit active area in Table 2 was calculated as:
where , , , and represent the number of defects, the catalyst layer active area, the catalyst layer thickness, and the volume of a single defect respectively. The value in Table 2 was calculated based on a 30 μm thick catalyst layer having spherical defects of 1 μm diameter.
3.3. Sensitivity Analysis for the Defect Location
Figure 4 illustrates the current density distribution along the membrane at 0.5 V and 0.9 A/cm2. The current density follows the oxygen reduction reaction (ORR) rate in the cathode catalyst layer, being maximum in the vicinity of the inlet above the channel and minimum in the vicinity of the outlet above the land. Figure 5 and Figure 6 show the current density profiles across the ionomer (PA)-phase of the MEA at locations marked 1 and 2 in Figure 4, for a pristine catalyst at different operating regimes and for a cathode catalyst with defects causing 10% performance decay at 0.5 V. Figure 4 and Figure 5 indicate that the ORR rate depends on the location along the active area and across the cathode catalyst layer thickness. This suggests that the impact of an isolated defect on the performance decay may depend on its location in the catalyst layer.
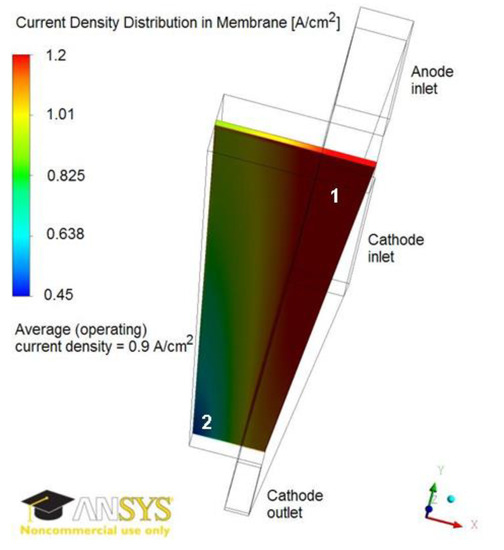
Figure 4.
Current density distribution in membrane at 0.9 A/cm2 and 0.5 V. The current density is maximum in region 1 and minimum in region 2.
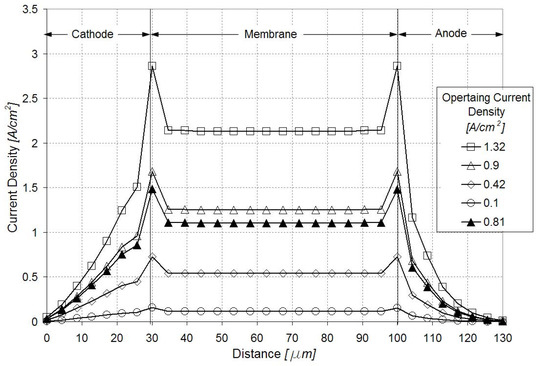
Figure 5.
Current density profiles along the catalyst layers and membrane in region marked 1 in Figure 4. Open figures correspond to the pristine catalyst layer at different operating regimes; dark triangles correspond to a defected catalyst layer causing 10% performance decay at 0.5 V.
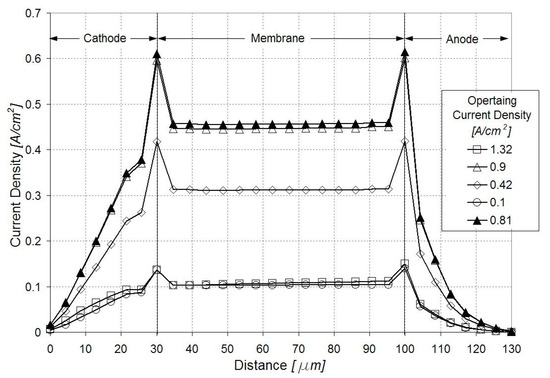
Figure 6.
Current density profiles along the catalyst layers and membrane in region marked 2 in Figure 4. Open figures correspond to the pristine catalyst layer at different operating regimes; dark triangles correspond to a defected catalyst layer causing 10% performance decay at 0.5 V.
The sensitivity analysis for the location of an isolated defect was performed by selectively canceling the ORR rate in control volumes (250 μm × 50 μm × 5 μm) along and across the cathode catalyst layer. Since the selected control volumes are larger than a typical defect resulting in the manufacturing process, this sensitivity analysis offers an upper bound for the estimation of the impact of the defect location. Table 3 summarizes the change in the local current density (expressed as a percentage of the local current density in a pristine GDE) when an isolated defect is located at different distances from the membrane-catalyst layer interface. The local current densities were sampled in the membrane along a line normal to the GDE and passing through the defect. The results indicate that the impact on the local current density is higher when the defect is located closer to the interface with the membrane. The local current density decays less than 2% in the presence of an isolated defect, regardless of whether it is located in a region of higher or lower reaction rates (region 1 or 2 in Figure 4). It was found that the impact of the isolated defect on the operating (average) current density was negligibly small.
Table 3.
Change in local current density for the gas diffusion electrode (GDE) with an isolated defect, expressed as a percentage of the local current density in a pristine GDE, at 0.5 V for different locations of the isolated defect.
3.4. Sensitivity Analysis for GDE Porosity
Figure 7 shows the polarization curve for a PEM fuel cell equipped with the baseline MEA (Figure 2) and for fuel cells equipped with GDEs having a lower porosity (75% and 50% of the baseline porosity). The power loss for the fuel cell equipped with GDEs having 75% of baseline porosity is between 2% at 0.4 A/cm2 to 20% at 1.3 A/cm2, with a power loss of less than 8% at the nominal operating point of 0.9 A/cm2 (Figure 8). The fuel cell equipped with GDEs having 50% of baseline porosity shows increased mass transport losses with a limiting current density at about 1 A/cm2. The power loss induced by the GDE with 50% of baseline porosity is between 5% at 0.4 A/cm2 to 100% at 1.3 A/cm2 (Figure 8).
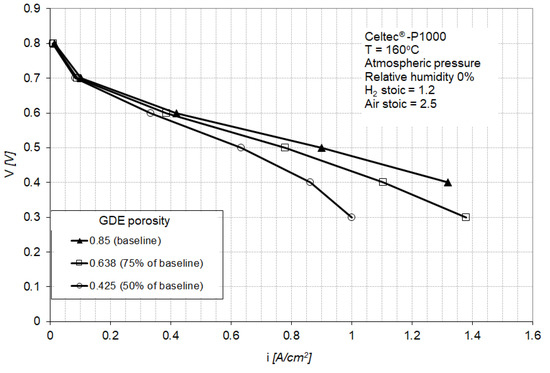
Figure 7.
Polarization curves for the baseline MEA and for MEAs containing GDEs with 75% and 50% porosity of the baseline gas diffusion layer (GDL). The baseline porosity is 0.85.
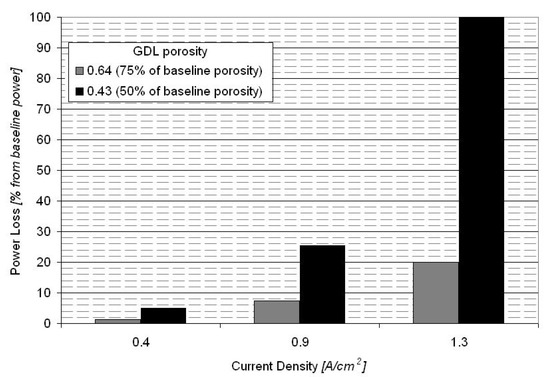
Figure 8.
Power loss at different operating current densities for the fuel cells equipped with GDLs having 75% and 50% of baseline porosity.
4. Conclusions
This work develops a computational fluid dynamics model that predicts performance variation caused by manufacturing tolerances and defects of the cathode GDE of an Advent PBI MEA. The model was used to predict the total volume of defects and the defect distribution that would cause a 10% drop in performance. It was found that a 10% performance drop at the nominal operating regime (0.5 V and 0.9 A/cm2) would be caused by uniformly distributed defects totaling 39% of the catalyst layer volume, or a concentration of more than 46 × 106 defects per square centimeter (~0.5 defects/μm2), much larger than the defect concentration achievable by Advent Technologies Inc. with its automated process capabilities.
The study provides an upper bound for the estimation of the impact of the defect location on performance drop. It was found that the impact on the local current density is higher when the defect is located closer to the interface with the membrane. The local current density decays less than 2% in the presence of an isolated defect, regardless of its location along the active area of the catalyst layer.
Sensitivity analysis for GDE porosity shows that the power loss of a fuel cell equipped with GDEs having 75% of baseline porosity to be between 2% at 0.4 A/cm2 to 20% at 1.3 A/cm2, and for a fuel cell equipped with GDEs having 50% of baseline porosity to be between 5% at 0.4 A/cm2 and 100% at 1.3 A/cm2.
Author Contributions
Conceptualization, V.G. and E.S.D.C.; methodology, V.G. and E.S.D.C.; software, V.G.; formal analysis, V.G. and E.S.D.C.; investigation, V.G. and E.S.D.C.; writing—original draft preparation, V.G.; writing—review and editing, E.S.D.C.; project administration, E.S.D.C. All authors have read and agreed to the published version of the manuscript.
Funding
This research was funded by U.S. Department of Energy, grant number DE-PS36-07GO97012.
Conflicts of Interest
The authors declare no conflict of interest.
Appendix A
Appendix A.1. Transport Equations in the Flow Field
Appendix A.1.1. Mass Transport
In anode and cathode channels:
In anode and cathode GDLs:
In cathode catalyst layer:
In anode catalyst layer:
Appendix A.1.2. Momentum Conservation
In anode and cathode channels:
In anode and cathode GDLs:
In cathode catalyst layer:
In anode catalyst layer:
Appendix A.1.3. Conservation of Chemical Species
Oxygen in cathode channel:
Water vapor in anode and cathode channels:
Oxygen in cathode GDL:
Water vapor in cathode GDL:
Oxygen in cathode catalyst layer:
Water vapor in cathode catalyst layer:
Appendix A.2. Transport Equations in the Ionomer (PA)-Phase
Conservation of Charge
In cathode catalyst layer:
In membrane:
In anode catalyst layer:
Appendix A.3. Constitutive Relations
Appendix B
Appendix B.1. Nomenclature
| Aact | active area of catalyst layer (cm2) |
| effective catalyst surface area per unit volume (cm2/cm3) | |
| ad | catalyst area with defects per unit volume (cm2/cm3) |
| constant in Slattery–Bird correlation (A25) | |
| b | Tafel slope (V/decade) |
| exponent in Slattery–Bird correlation (A25) | |
| D | diffusion coefficient (m2/s) |
| Dij | binary diffusion coefficient (m2/s) |
| equilibrium potential (V) | |
| F | Faraday constant 96487 (C/mols H+) |
| reference exchange current density (A/m2) | |
| current density (A/cm2) | |
| j | charge transfer current (A/cm3) |
| absolute viscous permeability (cm2) | |
| mass source (g/cm3s) | |
| n | number of defects |
| pressure (Pa) | |
| t | time (s) |
| tcl | thickness of catalyst area (mm) |
| temperature (K) | |
| velocity vector (cm/s) | |
| V | volume of catalyst layer (m3) |
| Vd | volume of defects in catalyst layer (m3) |
| V1d | volume of a single defect (mm) |
| molecular weight (g/mols) | |
| mass fraction of chemical species |
Appendix B.2. Greek Symbols
| surface porosity | |
| directional surface permeability of ionomer | |
| volumetric porosity | |
| activation polarization (V) | |
| electrochemical reaction rate at cathode (mols/cm3s) | |
| density (g/cm3) | |
| viscosity (Ns/cm2) | |
| stoichiometric coefficient | |
| ionomer conductivity | |
| potential (V) |
Appendix B.3. Subscripts
| a | anode |
| c | cathode |
| cr | critic |
| i | chemical species i |
| i | ionomer (PA)-phase |
| s | solid (electrically-conductive)-phase |
Appendix B.4. Superscripts
| a | anodic |
| c | cathodic |
References
- Schmidt, T.J. High-Temperature Polymer Electrolyte Fuel Cells: Durability Insights. In Polymer Electrolyte Fuel Cell Durability; Buchi, F.N., Inaba, M., Schmidt, T.J., Eds.; Springer: New York, NY, USA, 2009; pp. 199–221. [Google Scholar]
- Wasmus, S.; Valeriu, A.; Mateescu, G.D.; Tryk, D.A.; Savinell, R.F. Characterization of H3P04-Equilibrated Nafion® 117 Membranes Using 1H and 31p NMR Spectroscopy. Solid State Ion. 1995, 80, 87–92. [Google Scholar] [CrossRef]
- Savinell, R.F.; Litt, M.H. Proton Conducting Polymers Used as Membranes. U.S. Patent 5,525,436, 11 June 1996. [Google Scholar]
- Wang, J.T.; Savinell, R.F.; Wainright, J.S.; Litt, M.H.; Yu, H. A H2/O2 Fuel Cell Using Acid Doped Polybenzimidazole as Polymer Electrolyte. Electrochim. Acta 1996, 41, 193–197. [Google Scholar] [CrossRef]
- Savinell, R.; Yeger, E.; Tryk, D.; Landau, U.; Wainright, J.; Weng, D.; Lux, K.; Litt, M.; Rogers, C. A Polymer Electrolyte for Operation at Temperatures up to 200 °C. J. Electrochem. Soc. 1994, 141, L46–L48. [Google Scholar] [CrossRef]
- Weng, D.; Wainright, J.S.; Landau, U.; Savinell, R.F. Electro-osmotic Drag Coefficient of Water and Methanol in Polymer Electrolytes at Elevated Temperatures. J. Electrochem. Soc. 1996, 143, 1260–1263. [Google Scholar] [CrossRef]
- Sammes, S.R.; Wasmus, S.; Savinell, R.F. Thermal Stability of Proton Conducting Acid Doped Polybenzimidazole in Simulated Fuel Cell Environments. J. Electrochem. Soc. 1996, 143, 1225–1232. [Google Scholar] [CrossRef]
- Wainright, J.S.; Litt, M.H.; Savinell, R.F. High-Temperature Membranes. In Handbook of Fuel Cells. Fundamentals, Technology and Applications; Vielstich, W., Lamm, A., Gasteiger, H.A., Eds.; John Wiley & Sons: New York, NY, USA, 2003; Volume 3, p. 436. [Google Scholar]
- Xiao, L.; Zhang, H.; Scanlon, E.; Ramanathan, L.S.; Choe, E.-W.; Rogers, D.; Apple, T.; Beniecewicz, B.C. High-Temperature Polybenzimidazole Fuel Cell Membranes via a Sol-Gel Process. Chem. Mater. 2005, 17, 5328–5333. [Google Scholar] [CrossRef]
- Xiao, L.; Zhang, H.; Scanlon, E.; Chen, R.; Choe, E.-W.; Ramanathan, L.S.; Yu, S.; Beniecewicz, B.C. Synthesis and Characterization of Pyridine-Based Polybenzimidazoles for High Temperature Polymer Electrolyte Membrane Fuel Cell Applications. Fuel Cells 2005, 5, 287–295. [Google Scholar] [CrossRef]
- Schmidt, T.J.; Baurmeister, J. Properties of High-Temperature PEFC Celtec®-P 1000 MEAs in Start/Stop Operation Mode. J. Power Sourcce 2008, 176, 428–434. [Google Scholar] [CrossRef]
- Uchida, M.; Aoyama, Y.; Eda, N.; Ohta, A. Investigation of the Microstructure in the Catalyst Layer and Effects of Both Perfluorosulfonate Ionomer and PTFE-Loaded Carbon on the Catalyst Layer of Polymer Electrolyte Fuel Cells. J. Electrochem. Soc. 1995, 142, 4143–4149. [Google Scholar] [CrossRef]
- Watanabe, M.; Igarashi, H.; Yosioka, K. An experimental prediction of the preparation conditions of Nafion-coated catalyst layers for PEFCs. Electrochim. Acta 1995, 40, 329–334. [Google Scholar] [CrossRef]
- Scharifker, B.R.; Zelenay, P.; Bockris, J.M. The Kinetics of Oxygen Reduction in Molten Phosphoric Acid at High Temperatures. J. Electrochem. Soc. 1987, 134, 2714–2725. [Google Scholar] [CrossRef]
- Haug, A.T.; White, R.E. Oxygen Diffusion Coefficient and Solubility in a New Proton Exchange Membrane. J. Electrochem. Soc. 2000, 147, 980–983. [Google Scholar] [CrossRef]
- Cheddie, D.F.; Munroe, N.D. A Two-Phase Model of an Intermediate Temperature PEM Fuel Cell. Int. J. Hydrogen Energy 2007, 32, 832–841. [Google Scholar] [CrossRef]
- Siegel, C.; Bandlamudi, G.; Heinzel, A. Numerical Simulation of a High-Temperature PEM (HTPEM) Fuel Cell. In Proceedings of the COMSOL Users Conference 2007, Grenoble, France, 23–24 October 2007. [Google Scholar]
- Siegel, C.; Bandlamudi, G.; Heinzel, A. Modeling Polybenzimidazole/Phosphoric Acid Membrane Behavior in a HTPEM Fuel Cell. In Proceedings of the COMSOL Conference 2008, Hannover, Germany, 4–6 November 2008. [Google Scholar]
- Hu, J.; Zhang, H.; Gang, L. Diffusion-Convection/Electrochemical Model studies on Polybenzimidazole (PBI) Fuel Cell Based on AC Impedance Technique. Energy Convers. Manag. 2008, 49, 1019–1027. [Google Scholar] [CrossRef]
- Gurau, V.; Zawodzinski, T.A.; Mann, J.A. Two-Phase Transport In PEM Fuel Cell Cathodes. J. Fuel Cell Sci. Technol. 2008, 5, 021009. [Google Scholar] [CrossRef]
- Gurau, V.; Edwards, R.V.; Mann, J.A.; Zawodzinski, T.A. A Look at the Multiphase Mixture Model for PEM Fuel Cell Simulations. Electrochem. Solid-State Lett. 2008, 11, B132–B135. [Google Scholar] [CrossRef]
- Gurau, V.; Zawodzinski, T.A.; Mann, J.A. Spatiotemporal Behavior of Water and Two-Phase Transport in the Porous Electrodes for PEM Fuel Cells. Characterization of Porous Materials 2. ECS Trans. 2009, 19, 29–38. [Google Scholar]
- Gurau, V.; Mann, J.A. A Critical Overview of Computational Fluid Dynamics Multiphase Models for Proton Exchange Membrane Fuel Cells. SIAM J. Appl. Math. 2009, 70, 410–454. [Google Scholar] [CrossRef]
- Gurau, V.; Mann, J.A. A Continuum Model for Water Transport in the Ionomer-Phase of Catalyst Coated Membranes for PEMFCs. Adv. Mech. Eng. 2010, 2010, 372795. [Google Scholar] [CrossRef]
- Gurau, V.; Mann, J.A. Effect of Interfacial Phenomena at the Gas Diffusion Layer-Channel Interface on the Water Evolution in a PEM Fuel Cell. J. Electrochem. Soc. 2010, 157, B512–B521. [Google Scholar] [CrossRef]


© 2020 by the authors. Licensee MDPI, Basel, Switzerland. This article is an open access article distributed under the terms and conditions of the Creative Commons Attribution (CC BY) license (http://creativecommons.org/licenses/by/4.0/).