Article

Fractal Characteristics of Micro- and Mesopores in the Longmaxi Shale

1
Key Laboratory of Coalbed Methane Resources and Reservoir Formation on Process, Ministry of Education, China University of Mining and Technology, Xuzhou 221008, China
2
School of Resources and Geosciences, China University of Mining and Technology, Xuzhou 221116, China
3
The EMS Energy Institute and Leone Family Department of Energy and Mineral Engineering, The Pennsylvania State University, University Park, PA 16802, USA
*
Author to whom correspondence should be addressed.
Energies 2020, 13(6), 1349; https://doi.org/10.3390/en13061349
Submission received: 25 January 2020 / Revised: 7 March 2020 / Accepted: 11 March 2020 / Published: 14 March 2020

Abstract

:
To better understand the variability and heterogeneity of pore size distributions (PSDs) in the Longmaxi Shale, twelve shale samples were collected from the Xiaoxi and Fendong section, Sichuan Province, South China. Multifractal analysis was employed to study PSDs of mesopores (2–50 nm) and micropores (<2 nm) based on low-pressure N2/CO2 adsorption (LP-N2/CO2GA). The results show that the PSDs of mesopores and micropores exhibit a multifractal behavior. The multifractal parameters can be divided into the parameters of heterogeneity (D−10–D10, D0–D10 and D−10–D0) and the parameters of singularity (D1 and H). For both the mesopores and micropores, decreasing the singularity of the pore size distribution contributes to larger heterogeneous parameters. However, micropores and mesopores also vary widely in terms of the pore heterogeneity and its controlling factors. Shale with a higher total organic carbon (TOC) content may have a larger volume of micropores and more heterogeneous mesopores. Rough surface and less concentrated pore size distribution hinder the transport of adsorbent in mesopores. The transport properties of micropores are not affected by the pore fractal dimension.

1. Introduction

Black shale, as a nonconventional reservoir, has typical low porosity and low permeability characteristics [1,2,3,4,5]. The nanoscale pores in the shale constitute a complex pore network [6,7,8,9]. In particular, the micropores (pore diameter <2 nm) and mesopores (2–50 nm) have the characteristics of a large specific surface area and high degree of heterogeneity, thereby increasing the complexity of the accumulation and migration mechanism of shale gas [10,11,12,13,14]. The difficulty in the characterization of shale reservoirs is the quantitative description of micropore and mesopore structures. A variety of experiments have been used to study the pore structure, including scanning electron microscopy (SEM) [15,16,17], atomic force microscopy (AFM) [18,19], small-angle X-ray (SAXS) [20,21], small-angle/ultra-small-angle neutron scattering (SANS/USANS) [22,23,24,25,26], nuclear magnetic resonance (NMR) [27,28,29,30], high-pressure mercury intrusion (HMIP) [31,32,33,34] and low-temperature liquid nitrogen/carbon dioxide adsorption (LP-N2/CO2GA) [23,24,25,31,35]. Among these, LP-N2/CO2GA analysis has been proven to be an effective method in characterizing the pore size distribution of micropores and mesopores [23,24,25,31]. Furthermore, nanoscale pores in shale can be regarded as having a complex fractal geometry. Fractal theory provides a new quantitative method for quantitatively characterizing the heterogeneity of nanoscale pores in shale [36,37,38,39,40]. Several methods have been used to measure fractal dimensions, such as image analysis [41,42], the fractal Frenkel–Halsey–Hill (FHH) model [43,44,45], the fractal BET model [46,47,48], small angle X-ray scattering [48] and HMIP [49]. Among these, the fractal FHH model has been widely used to study pore heterogeneity [50,51].
It is noteworthy that the multifractal theory expands the application of fractal geometry and has been widely used in various fields in recent years [52,53,54,55]. In general, fractals are mainly used to describe irregular geometries or geometric sets, and the spatial distribution of measures can be quantitatively represented by multifractal research [52]. It was found that a multifractal approach has been successfully applied to parameterize the spatial heterogeneity of porous materials [55]. Several multifractal studies were conducted based on two-dimensional image analysis, including X-ray computed tomography (CT) data [54], optical microscopy [56] and environmental scanning electron microscopy (ESEM) images [57]. Recently, multifractal analysis of PSDs determined by Hg injection datasets has been performed [55]. However, they are less frequent with the multifractal analysis of marine shales.
In this study, we mainly carried out fractal analyses on the Lower Silurian Longmaxi shale based on the data of LP-N2/CO2GA experiments. The relationships between the fractal parameters and adsorbent transport rate are also discussed.

2. Materials and Methods

For this investigation, twelve shale samples were collected from the Longmaxi Formation in the Xiaoxi and Fendong section, Sichuan Province, South China. The total organic carbon (TOC) content analysis and X-ray diffraction (XRD) were applied to analyze the material composition. In addition, a low-pressure N2/CO2 adsorption experiment (LP-N2/CO2GA) was employed to analyze the pore structure parameters, including the BET-specific surface area (SSA), micropore volume (PV1), mesopore volume (PV2) and pore size distribution (PSD). Furthermore, multifractal analysis was performed based on the PSD data measured from LP-N2/CO2GA experiments. Finally, the Frenkel–Halsey–Hill (FHH) and volume-surface area (V-S) fractal models were used to study their relationship with multifractals.

2.1. Experiments

The total organic carbon content (TOC) analysis was conducted by using a multi EA 4000 elemental analyzer (Analytik Jena AG, Jena, Germany). The highest temperature of this instrument can reach 1500 °C, and accuracy is ±0.01 ppm. X-ray diffraction (XRD) analysis was performed using X’Pert3 Powder. Both analyses were conducted at the Jiangsu Provincial Mineral Design Institute, China.
The LP-N2/CO2GA experiment was conducted using an Autosorb-IQ-MP apparatus at the China University of Mining and Technology. Samples were degassed and dried before the experiments. The LP-N2GA experiment was performed at temperature of 77.35 K, and the LP-CO2GA experiment was conducted at temperature of 273 K. The Brunauer–Emmett–Teller (BET) multilayer adsorption equation was applied to obtain the specific surface area [58]. PSD were calculated using the density functional theory [59].

2.2. Multifractal Analysis

A number of scholars have carried out multifractal analysis based on pore size distribution data of mercury intrusion experiments, and the generalized dimension spectrum is used to characterize the heterogeneity of pore structures [60]. In this study, the generalized dimension spectrum was calculated based on pore size distribution data of N2 and CO2 adsorption experiments. The calculation steps are summarized as follows [55]:
The key to the multifractal analysis of the pore size distribution is to define a pore volume probability on multiple sizes scales. First, the aperture range is taken as interval J. According to the dichotomy principle, the interval J of length r is divided into N(r) boxes with scale r, so that the smallest subinterval contains the measured value. The probability distribution ρi(r) of the pore volume in each box is defined as:
ρ i ( r ) = M i ( r ) / M
where Mi(r) is the total amount of the study volume in lattice i, and M is the total amount of the study volume in the entire study space. Then, the assignment function χq(r) can be defined as:
χ q ( r ) = i = 1 N ( r ) ρ i q ( r )
where N(r) is the total number of lattice units with side length r, and q is the order of the distribution function (−∞ ≤ q ≤ ∞).
If q > 0, the larger ρi(r) interval will have a greater contribution to χq(r), which can reflect the fractal characteristics of the hole-dense region. When q < 0, the region with a small ρi(r) value will have a large contribution to χq(r), which can reflect the fractal characteristics of the sparse region. Thus, a single fractal can be extended to a variety of singular degrees of fractal so that the internal structure of the fractal can be fully presented. If ρi(r) obeys the multifractal pattern, the distribution function has a simple power–law relationship to the grid cell size r:
χ q ( r ) = i = 1 N ( r ) ρ i q ( r )
where τ(q) is the power exponent of the q-order moment. If the studied measure satisfies the multifractal pattern, when a q value is given, a line between χq(r) and r will be formed on a double logarithmic plot. The slope of each line gives a τ(q) value.
When q is not equal to 1, Dq can be obtained from the power exponent τ(q) of the q-order moment:
D q = τ ( q ) 1 q
When q = 1, D1 can be expressed as:
D 1 = lim r 0 i = 1 N ( r ) ρ i ( r ) log ρ i ( r ) log ( r )
The Dq values correspond to the information dimension D1 and the associated dimension D2 respectively, when the q value is equal to 1 or 2. The q-D(q) curve constitutes the generalized dimension spectrum of the pore size distribution. The generalized dimension spectrum has five characteristic parameters (D1, H, D−10–D0, D0–D10 and D−10–D10), which can quantitatively characterize the heterogeneity of the pore size distribution from different angles. The information dimension D1 is a measure of the uniformity of the pore size distribution. The larger the D1, the greater the uniformity of the pore size distribution. The D1 values of mesopores and micropores are abbreviated as D1N and D1C. Most of the pores are distributed in a number of pore ranges [60]. H is the Hurst index, which is calculated as:
H = D 2 + 1 2
H can be used as the characterization parameter of porosity autocorrelation, and its value range is within the interval (0.5,1). When H is closer to 1, it indicates that the autocorrelation of the pore size distribution is stronger [52,53]. The H values of mesopores and micropores are abbreviated as HN and HC. D−10D0, D0D10 and D−10D10 represent the left branch, the right branch and the full spectrum width of the q-D(q) curve, respectively. For the convenience of expression, the above three spectral width parameters were expressed as DNN, DPN and DTN for mesopores and DNC, DPC and DTC for micropores, respectively. In general, pore heterogeneity increases with wider multifractal spectrum [52,53,55,60].

2.3. FHH and V-S Fractal Model

The FHH fractal model can be expressed by [61,62,63]:
ln ( V / V 0 ) = C + A ln ( ln ( p 0 / p ) )
where V is the nitrogen adsorption volume, V0 represent the monolayer adsorption volume, p0 is the saturated vapor pressure and A and C are fitting coefficients. The FHH fractal dimension is A + 3. In this study, the FHH fractal dimension was divided into DN1 (p0/p < 0.5) and DN2 (p0/p > 0.5).
The V-S model can be expressed by [64,65]:
ln ( V ) = 3 D C ln S + k
where V is adsorption volume, cm3/g, S is the cumulative specific surface area, m2/g, and DC is the V-S fractal dimension of the micropores.

3. Results

3.1. TOC and XRD Analysis

The TOC content and mineral composition are presented in Table 1. The TOC content of the two sections ranges from 1.2% to 9.9% (average = 4.4%), and the dominant mineralogical composition are quartz, clay and calcite. Among these, quartz, ranging from 32% to 83% (average = 53%), displays the highest concentration. Clay ranges from 10% to 42% (average = 21%) and calcite ranges from 0% to 26% (average = 15%).

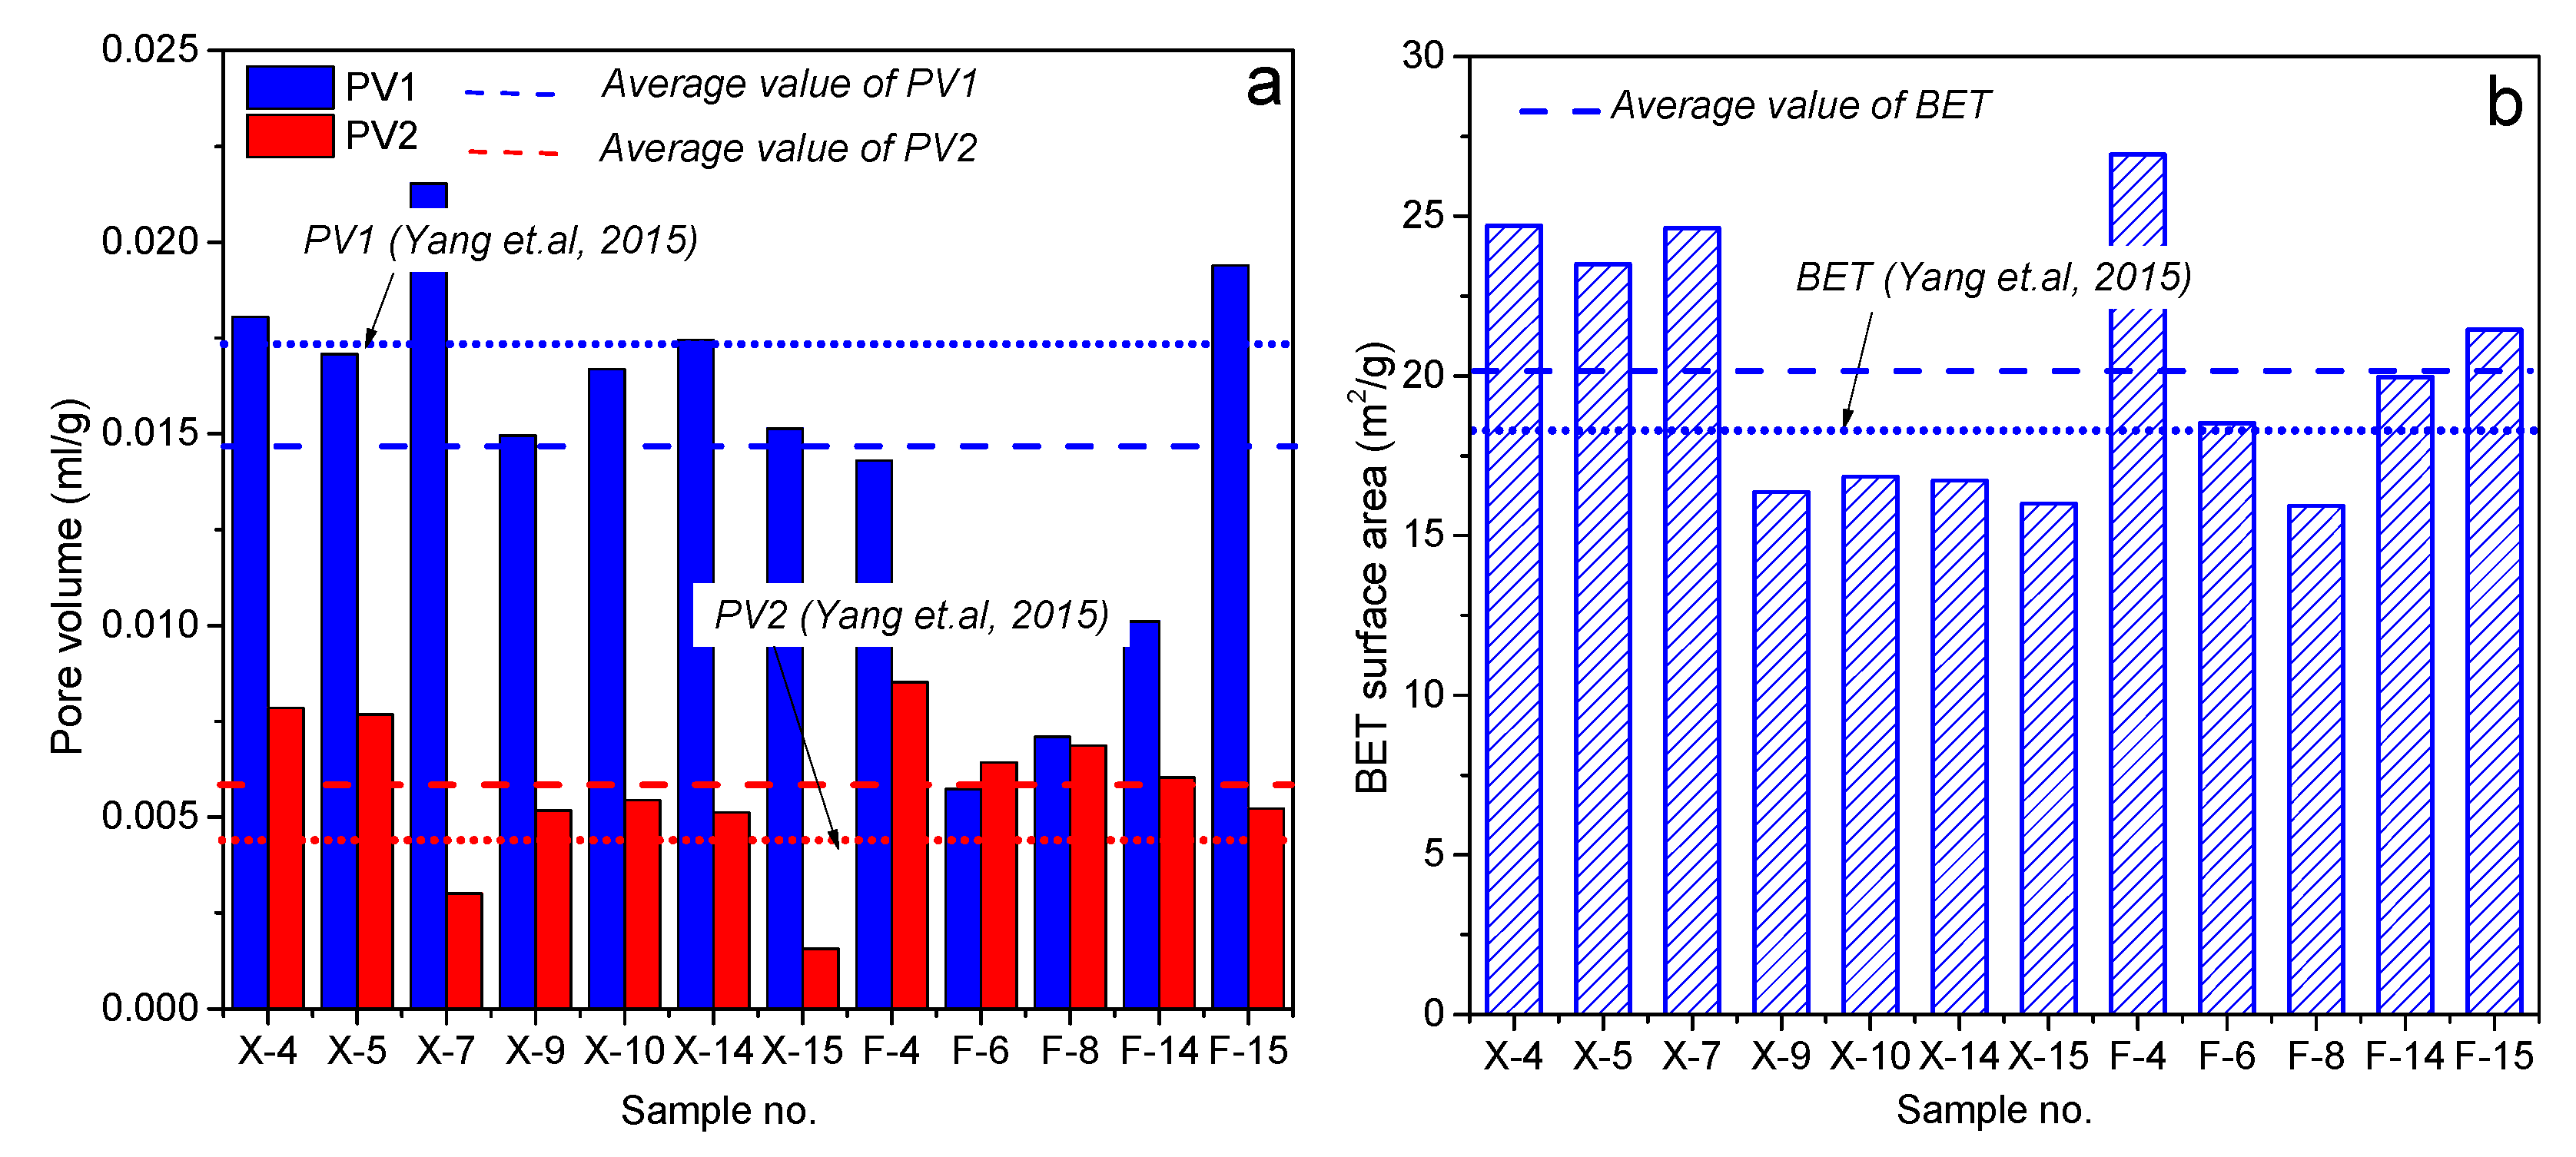
3.2. N2 and CO2 Adsorption

Following the Brunauer, Deming, Deming and Teller classification [27], the adsorption isotherms of N2 and CO2 are type II and type I, respectively (Figure 1 and Figure 2). Samples with a high TOC content tended to have higher N2 and CO2 adsorption capacities. The pore volume of mesopores (PV1) ranged from 0.006 to 0.022 mL/g (average = 0.015 mL/g). Meanwhile, the micropores had a smaller pore volume (PV2) relative to the mesopores, with a range from 0.0016 to 0.0085 mL/g (average = 0.0057 mL/g). Compared to the existing data from the same region [66], the relative error of these two parameters was found to be within 25% (Figure 3). PV1 had no correlation with the shale composition. However, there was a weak positive correlation between PV2 and the content of TOC (R2 = 0.3) and a certain negative correlation with the clay content (R2 = 0.4).
SSA ranged from 15.9 to 26.9 m2/g (average = 20.1 m2/g), and it was substantially consistent with the results of Yang et al. [66]. Meanwhile, the SSA had a positive correlation with the TOC content (R2 = 0.5) and quartz content (R2 = 0.3). The pore volume distributions of the mesopores and macropores are illustrated in Figure 4, suggesting a unimodal PSD in the mesopore range and a multimodal PSD in the micropore range. In general, most samples had a broad peak between 10 and 100 nm and a sharp peak between 0.4 and 0.7 nm.

3.3. Multifractal Parameters

The plot of log[χ(q, ε)] versus log(ε) is often used to determine whether the observed data have multifractal features [67]. Linear relationships could be observed between log[χ(q, ε)] and log(ε) in all the samples (Figure 5 and Figure 6), suggesting that the PSDs of micropores and mesopores in shale had multifractal characteristics. In general, the Dq spectra displayed a monotonically decreasing function of q with an anti-S curve (Figure 7 and Figure 8). Although the shapes of the Dq spectra were roughly similar, there were differences in the parameters of the Dq spectra (Table 2). Thus, it was necessary to analyze the correlation of each characteristic parameter. The correlation coefficients of the shale material composition data, pore parameters and fractal parameters are presented in Figure 9. A better correlation was found between the multifractal parameters of mesopores. Specifically, there was a positive correlation between D1N and DHN, and these two parameters were negatively correlated with DNN, DPN and DTN. However, the correlation between multifractal parameters of the micropores was more complex compared to the mesopores. Similar to the mesopores, D1C was positively correlated with HC, and DNC was also positively related to DTC. However, unlike the mesopores, DPC had no correlation with DTC.

3.4. FHH and V-S Fractal Dimension

The fairly well-fitting results of formula 7 (with correlation coefficients of R2 > 0.97, see Table 3 and Table 4 and Figure 10 and Figure 11) indicated that the mesopores in shale had FHH fractal characteristics. DN1 ranged from 2.66 to 2.77, with a mean of 2.72. DN2 was lower than that of DN1 and ranged from 2.62 to 2.72, with an average of 2.67. There was a positive correlation between DN1 and DN2 (R2 = 0.5). These results were consistent with previous studies [68]. It is noteworthy that both DN1 and DN2 were negatively correlated with D1N and HN but were positively correlated with DTN and DPN (Figure 9).
The V-S fractal dimension of micropores (DC) varied from 2.23 to 2.62, with a mean of 2.72. DC was negatively correlated with D1C and HC (Figure 9). In addition, there was no significant correlation between DC and the other multifractal parameters of micropores. It is noteworthy that DC had a weak positive correlation with DN1 (Figure 9).

4. Discussion

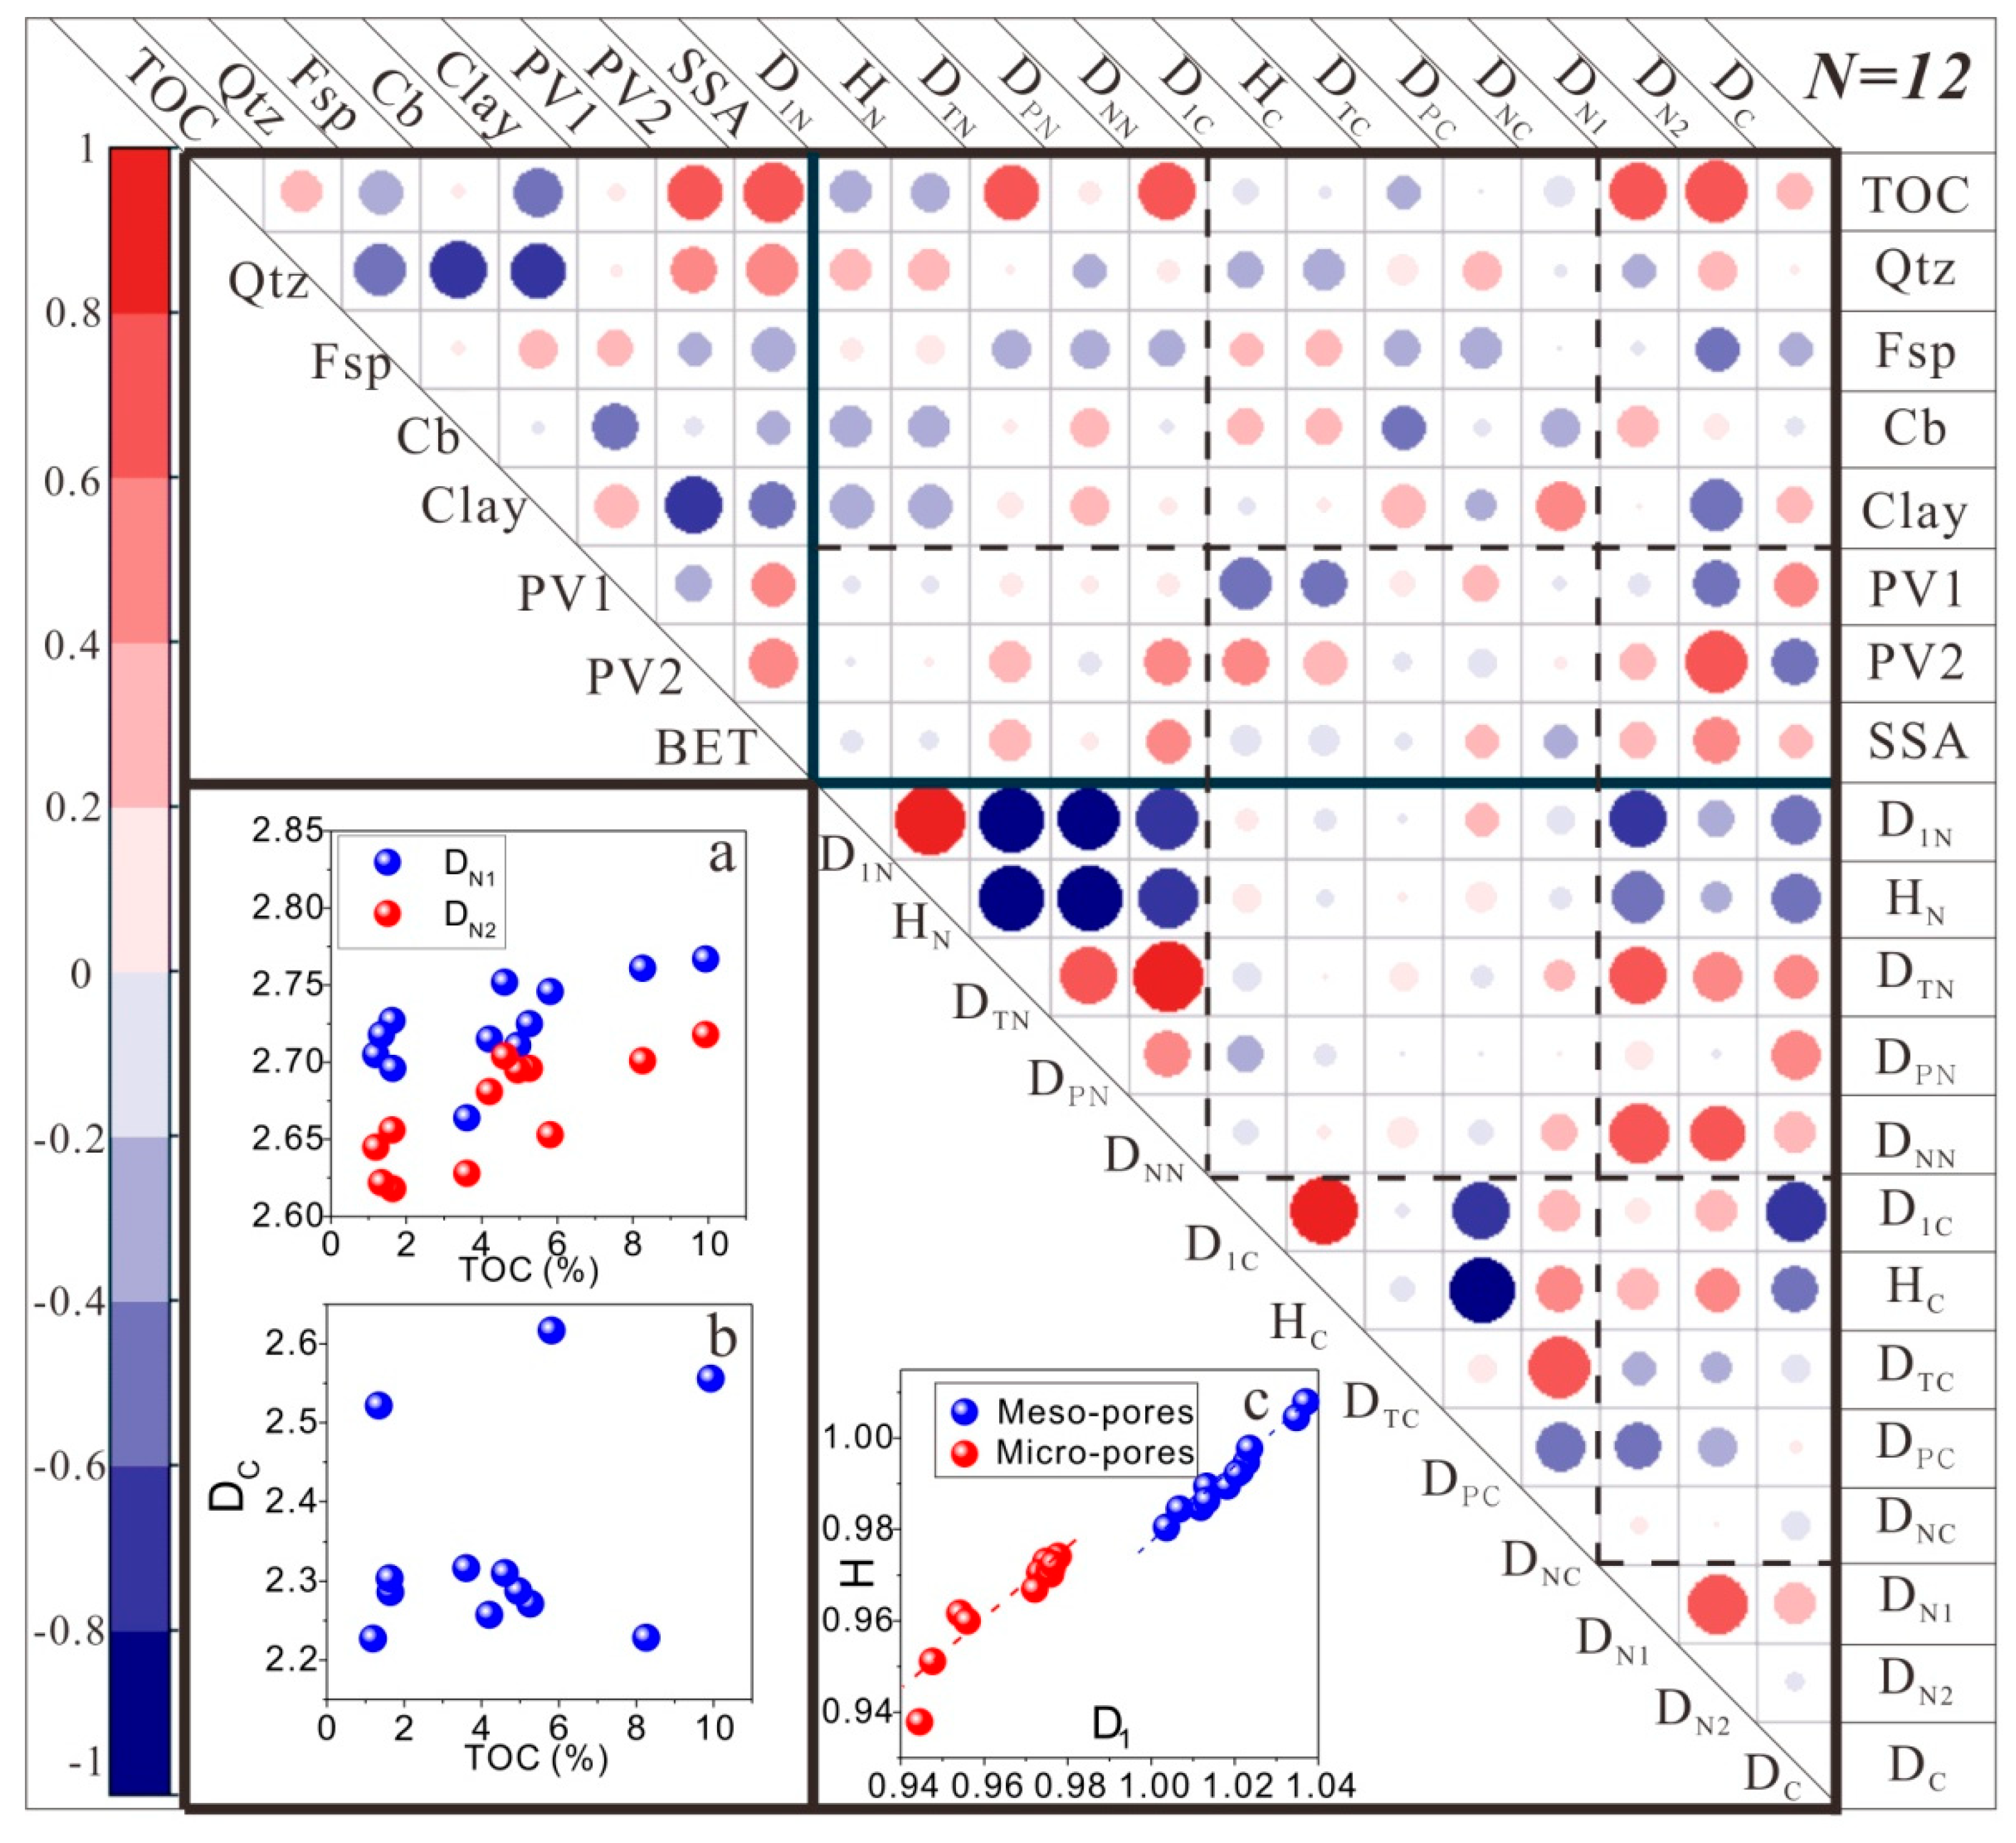
4.1. Pore Structure Parameters and Their Controlling Factors

Previous studies have found that the material composition of shale, including the organic matter and inorganic minerals, is an important factor in controlling the pore structure parameters [69,70]. The difference between the PV1-TOC and PV2-TOC covariance (Figure 12a) was consistent with those described by Wang et al. [66]. Some researchers have found that mesopores consisted of elliptical organic matter pores as well, as there were quite a few inorganic matter pores with various morphologies based on FE-SEM [71,72,73,74]. It is well documented that considerable micropores are formed within the macromolecular structure of organic matter [75]. This may be the reason why the micropore volume had a notable positive correlation with the TOC content.
Overall, the results of this study are consistent with previous research results indicating that organic matter pores had the largest contribution to the specific surface area (Figure 12b) [76,77]. The specific surface area of the mineral pores was smaller than that of the organic pores [78], which may have resulted in the absence of a positive correlation between the mineral composition and SSA. In addition, the weak positive correlation between SSA and PV1 or PV2 reflects that the micropores and mesopores contribute most of the specific surface area in shale. Therefore, organic pores with a pore size of smaller than 50 nm may provide the majority of the specific surface area of the shale.

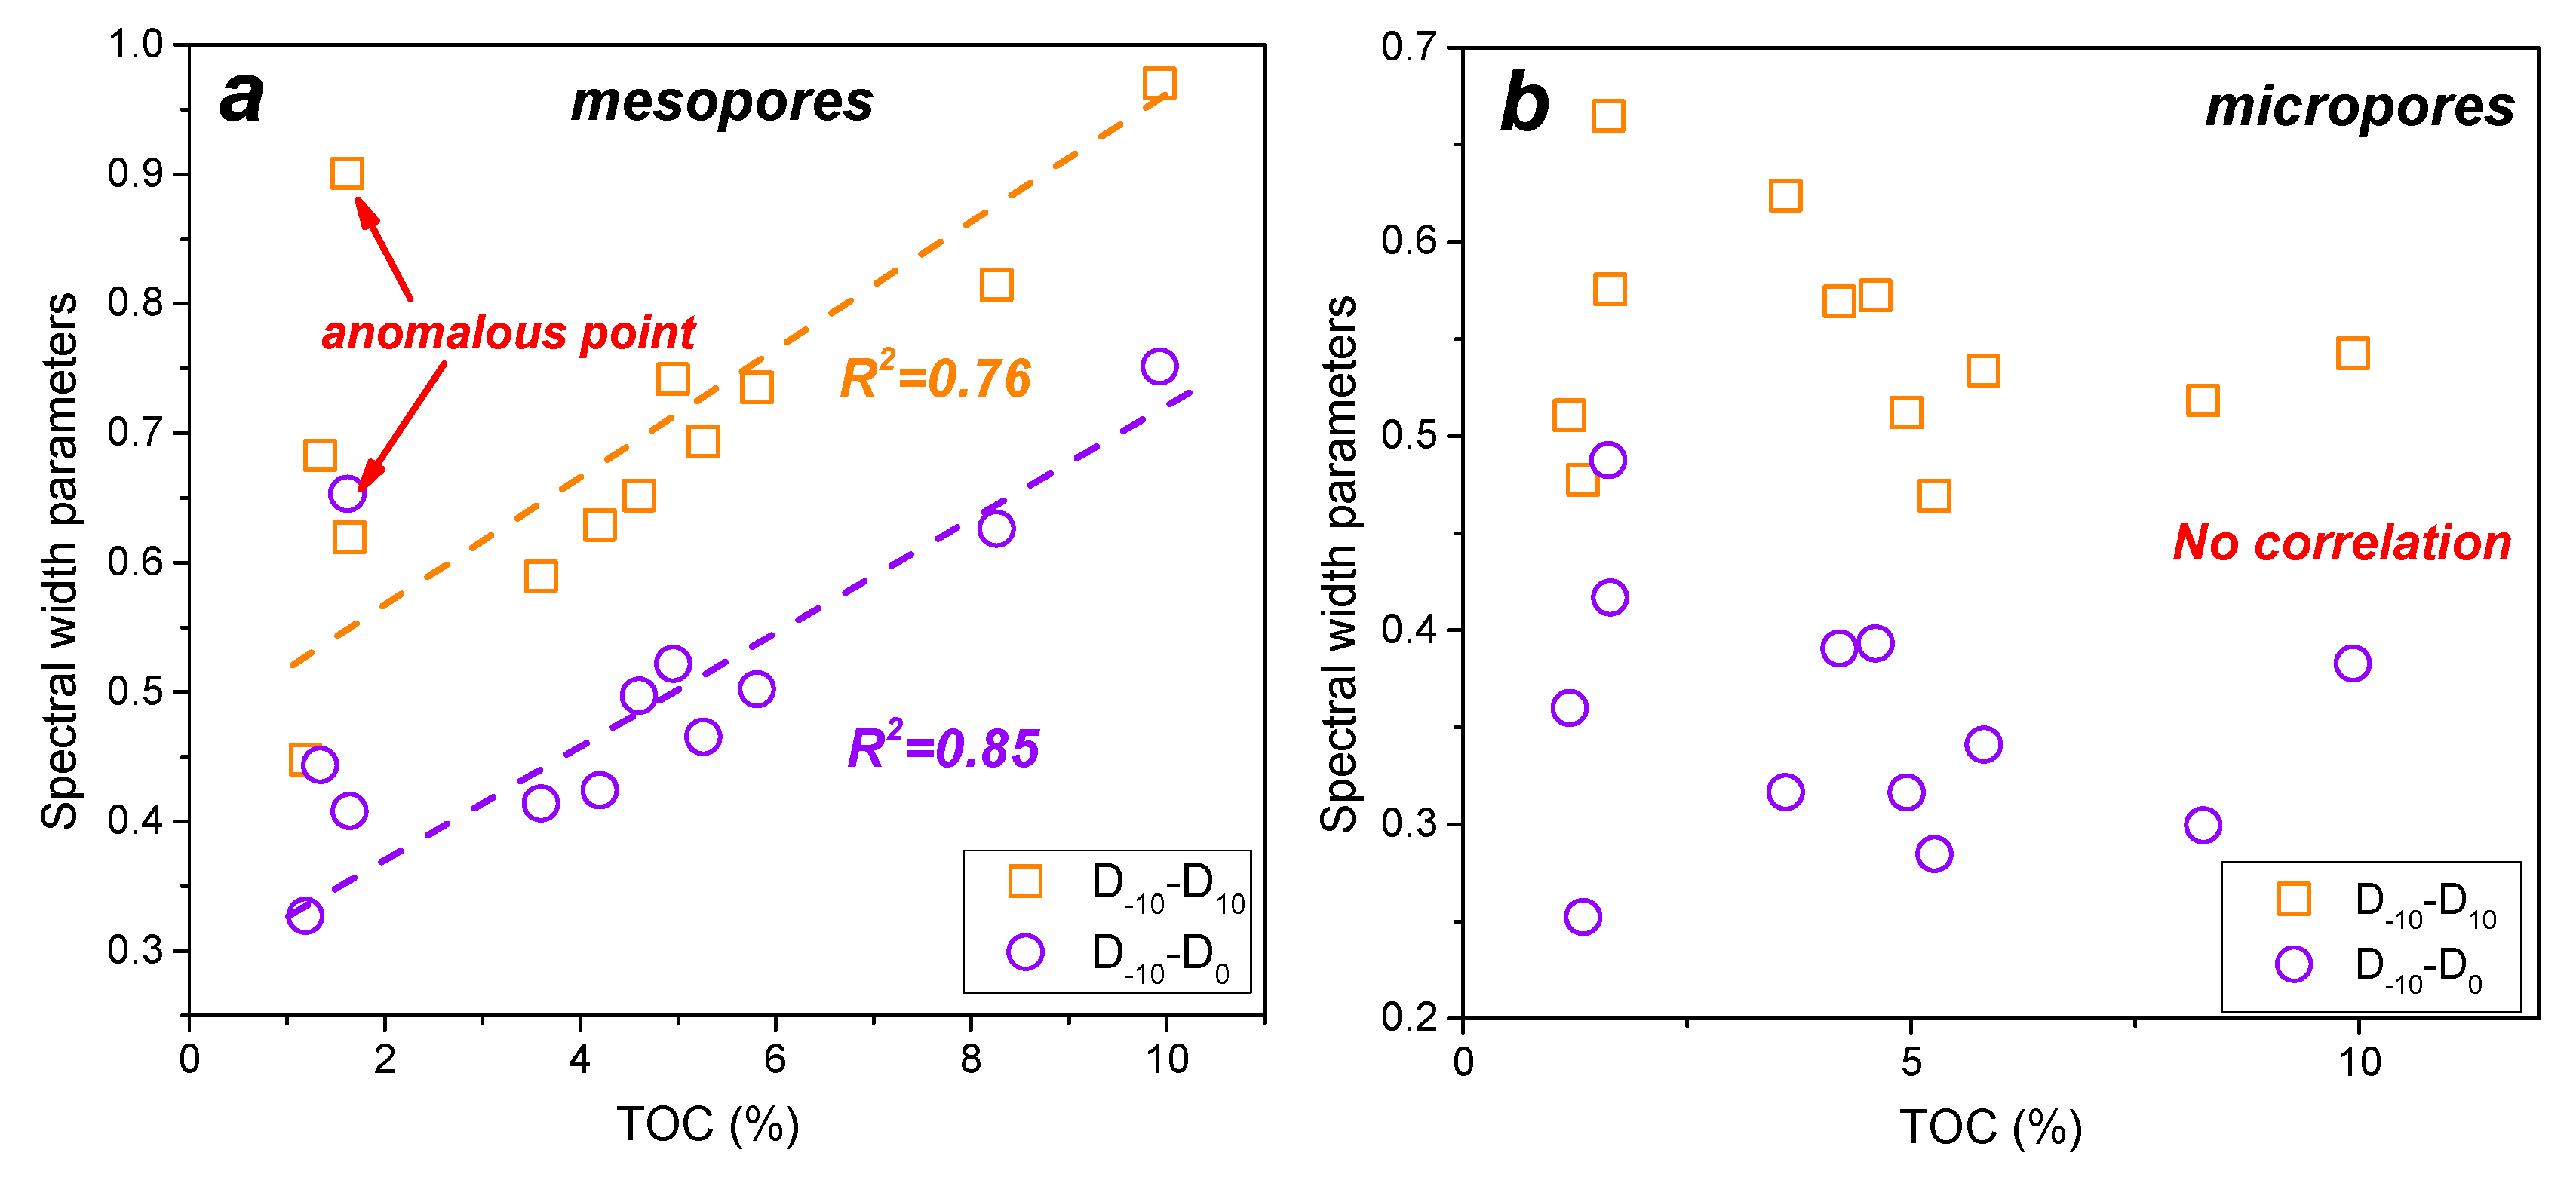
4.2. Multifractal Characteristics of Micropores and Mesopores

The Dq spectrum in the anti-S shaped curve represents a heterogeneous distribution of pore sizes [60]. A larger Dq spectrum width suggests more heterogeneity in the PSDs [52]. The large difference of the multifractal parameters indicates a significant disparity in heterogeneity among the samples. DTN increased with increasing TOC content (Figure 13a). However, there was no correlation between DTC and TOC content (Figure 13b). The thermal evolution degree of the Longmaxi Shale had entered the over-maturation phase, causing the formation of a complex organic pore network [79,80,81,82]. Therefore, shale with a higher TOC content may have more heterogeneous mesopores. In the organic matter with a higher degree of thermal evolution, the molecular structure becomes ordered [83], so the microporous structure, related to the macromolecular structure of organic matter, may not become complicated as the organic matter content increases.
The multifractal parameters for q > 0 corresponded to the dominance of a large concentration of the pore volume, and the parameters for q < 0 could be mainly affected by a small concentration of the pore volume [53,60,74]. As mentioned above, the PSDs of mesopores were unimodal. Consequently, the change in DPN may have been due to various distributions of pore sizes larger than 10 nm, and the value of DNN could be assigned to a pore size smaller than 10 nm. However, the PSDs of micropores have a multimodal distribution. Therefore, the change in both DPC and DNC may have been due to a pore volume distribution over multiple ranges of the pore size. Ultimately, the complexity of the multifractal features of micropores increased. It is noteworthy that DNN was larger than DPN, resulting in a notable positive correlation between DNN and DTN. This result is likely because mesopores with pore sizes smaller than 10 nm have a higher degree of heterogeneity. In addition, the TOC content was positively correlated with DNN and had no correlation with DPN. Accordingly, mesopores in the shale sample with a high TOC content showed a heterogeneous structure in the inner distribution of pores smaller than 10 nm. It is noteworthy that there was no correlation between DPC, DNC and DTC of the micropores. Additionally, only the clay mineral content had a weak positive correlation with DNC of the micropores. Considering that the micropores are mostly distributed in the molecular structure, it is presumed that the pores in the molecular structure of the clay had a greater heterogeneity compared to the pores in the molecules of the organic matter.
The information dimension (D1) and the Hurst exponent (H) are also commonly used multifractal parameters [52,60]. D1 is considered a measure of the concentration degree of PSD [52]. The smaller the values of D1, the more highly concentrated in the distribution of the pore volume [60]. H indicates the autocorrelation of the distribution of pore volume [54]. The nearer H approximates one, the stronger the existing autocorrelation PSD [54]. Whether considering micropores or mesopores, D1 had a notable positive correlation with H, suggesting that the more concentrated the pore size distribution, the greater the autocorrelation of the micropores and mesopores (Figure 9c). It is noteworthy that both D1N and HN were negatively associated with DPN, DNN and DTN for mesopores (Figure 14a), suggesting that as the singularity of the pore size distribution increased, the pore volume was more concentrated in a certain pore size range, and the heterogeneity of the pores decreased. However, only DPC had a negative correlation with D1C and HC for the micropores (Figure 9). It is hypothesized that due to the multimodal distribution of the PSD in the micropores, the correlation between the singularity and the heterogeneity was weakened compared with the mesopores. Therefore, we can divide the multifractal parameters into the parameters of heterogeneity (D−10–D10, D0–D10 and D−10–D0) and the parameters of singularity (D1 and H). The parameters are interrelated and have their own independence, which can be used to characterize the fractal regularity of the pore system [55]. Just as there is no correlation between the mesopore volume and micropore volume, the correlation between the multifractal parameters of the mesopores and micropores is not clear, indicating that there may be a large difference in pore types and heterogeneity of pore structures between the mesopores and micropores.

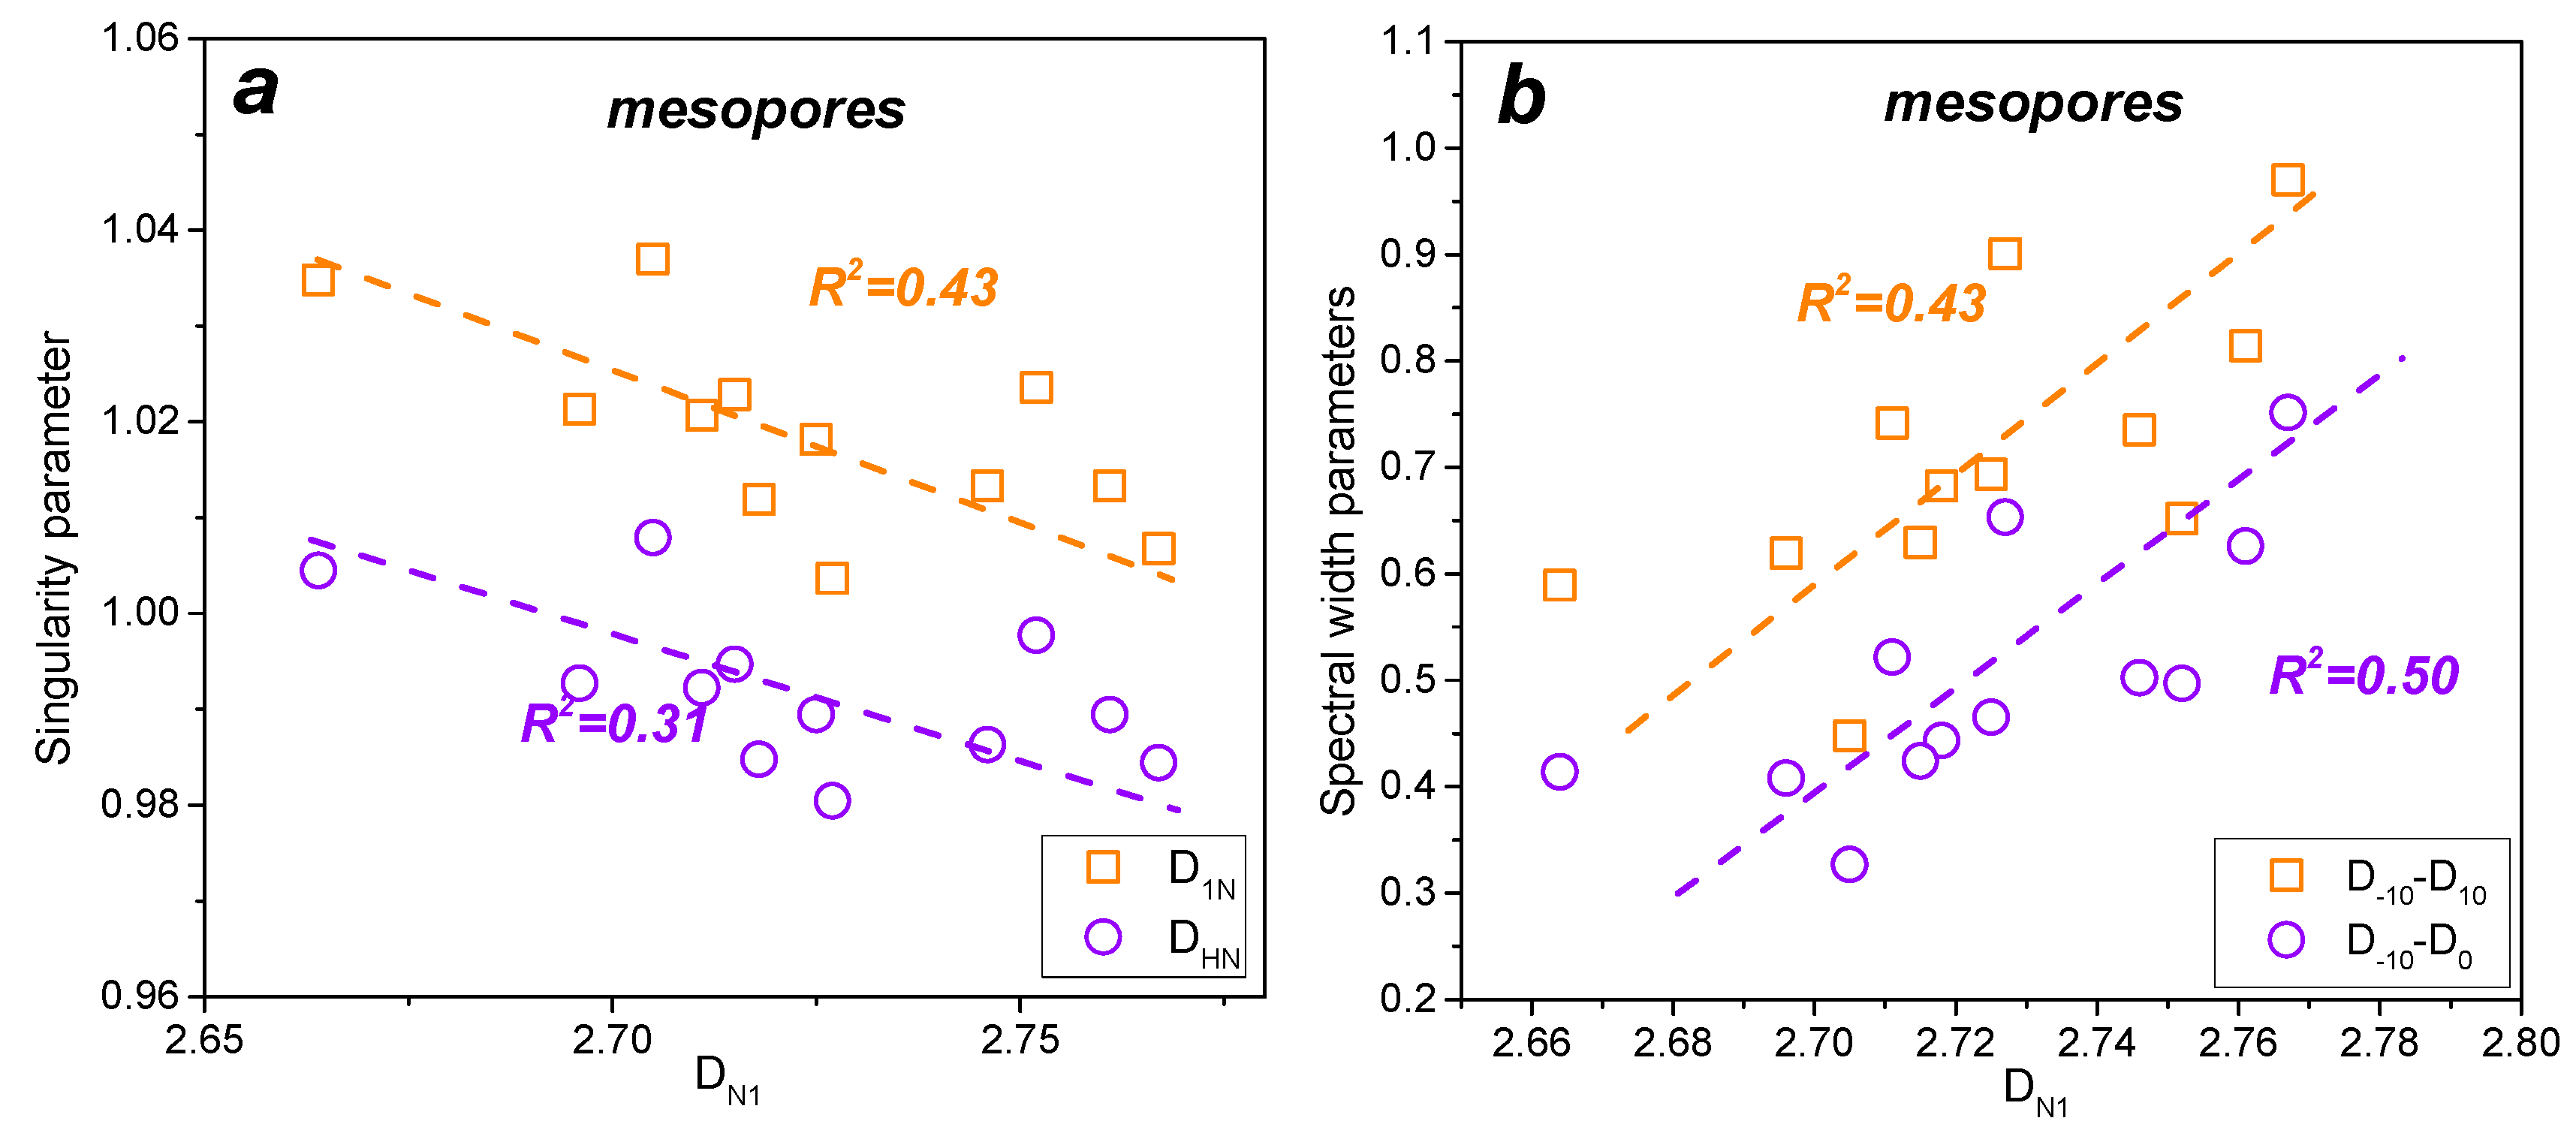
4.3. Association between Fractal Dimensions

A strongly positive correlation was found between the fraction dimension of mesopores (DN1 and DN2) and the TOC content (Figure 9a and Figure 15a), suggesting that a higher TOC content in shale may lead to a more complicated pore structure and result in greater FHH fractal dimensions. This conclusion is consistent with the recent studies concerning marine gas shale [39] and lacustrine shale [61]. However, there was no obvious relationship between the value of Dc and the shale composition (Figure 9b). The controlling factors of the micropore volume fractal dimension require further study.
There was a close relationship between the multifractal parameters and FHH fractal dimensions for mesopores (Figure 14b). In particular, the FHH fractal dimension was consistent with the spectral width parameter of the multifractal parameters, so they are all measures of pore heterogeneity. The FHH fractal dimensions were in disagreement with D1N and HN, indicating that as the singularity of the pore size distribution increased, the pore volume was more concentrated in a certain pore size range, and the heterogeneity of the pores decreased. For the micropores, DC was not related to the spectral width parameter of the multifractal parameters but was negatively correlated with D1C and HC (Figure 15b). This result also suggests the opposite of the singularity and heterogeneity of the pore size distribution. The above studies showed that the fractal features of micropores are more complicated. Thus, more research on this topic needs to be conducted about the association between micropores and shale molecular structures.

4.4. The Relationship between Fractal Parameters and Shale Transport Properties

A previous study found that the multifractal parameters of tectonic coals are closely related to permeability [55]. A negative correlation between fractal dimension (FHH model) and permeability (measure by pulse-decay) was observed in an earlier study [39]. The relationships between permeability (K) and porosity (φ) and fractal dimensions (D) were also acquired based on the Kozeny–Carman equation [84]:
K = r 2 8 φ τ [ 2 φ 3 τ ( 1 φ ) ] 2 D 1
where r is the average radius and τ is tortuosity.
Due to the complex mesopore and micropore features of both tectonic coals and shales [23,25,55,70], shale fractal parameters may be related to the shale permeability or the diffusion coefficient. Here, we characterized the transport properties of shale based on the cumulative adsorption and corresponding equilibrium time measured by low-pressure N2/CO2 adsorption. Since the adsorption process is considered transient, the adsorption time is closely related to the transport rate of the adsorbate molecules in the connected pore system. Therefore, we characterized the transport rate of the adsorbent according to the ratio of the adsorption amount to corresponding equilibrium time (Table 5). The results show that for mesopores, the transport rate has a positive correlation with the information dimension DN1, and a negative correlation with the FHH fractal dimension (D1N) (Figure 16). Therefore, it is suggested that the adsorbent transport rate is higher with the decrease of the pore surface heterogeneity and the increase in the concentration of the pore size distribution inside the connected mesoporous system. There is no obvious correlation between transport rate and the structure parameters (including fractal dimension) of micropores. Controlling factors for fluid transport inside microporous pores need further study. As connectivity, tortuosity and constrictivity are classical parameters used to characterize the pore morphology, it might be possible to find a causal connection between these parameters to fractal characteristics for deepening the understanding of shale transport properties in future investigations.

5. Conclusions

(1) The PSDs of mesopores are unimodal, whereas micropores have a multimodal distribution. Organic matter pores with a pore size smaller than 50 nm may provide the majority of the specific surface area of a shale and have strong heterogeneity.
(2) The multifractal parameters can be divided into the parameters of heterogeneity (D−10–D10, D0–D10 and D−10–D0) and the parameters of singularity (D1 and H). As the singularity of the pore size distribution increases, the pore volume is more concentrated in a certain pore size range, and the heterogeneity of the pores decreases. The roughness of the mesoporous surface has a positive correlation with the heterogeneity of its pore size distribution.
(3) A rough mesoporous surface hinders the transport of adsorbent. Mesopores with more concentrated pore size distribution have a higher adsorbate transport rate. The transport properties of micropores are not affected by the pore fractal dimension. The main controlling factors of the transport properties of micropores need further study.

Author Contributions

Conceptualization, Y.Z. and X.W.; Methodology, X.W.; Software, X.W.; Validation, Y.Z. and X.W.; Formal Analysis, X.W. and Y.W.; Investigation, Y.Z. and X.W.; Resources, Y.Z. and X.W.; Data Curation, X.W. and Y.Z.; Writing-Original Draft Preparation, X.W.; Writing–Review & Editing, Y.Z., X.W. and Y.W.; Visualization, Y.Z. and X.W.; Supervision, Y.Z.; Project Administration, Y.Z.; Funding Acquisition, Y.Z. All authors have read and agreed to the published version of the manuscript.

Funding

This research was funded by the National Natural Science Foundation of China grant number (41872132 and 41802183).

Acknowledgments

This research is sponsored by the National Natural Science Foundation of China (Project Nos. 41872132 and 41802183), National Science and Technology Major Project (Project No. 2017ZX05035004-002), joint Ph.D. program of “double first rate” construction disciplines of CUMT, and Outstanding Innovation Scholarship for Doctoral Candidate of CUMT (2019YCBS004).

Conflicts of Interest

The authors declare no conflict of interest.

Abbreviations

TOCTotal organic carbon content, %DTND−10–D10 of mesopores, dimensionless
QtzQuartz content, %DPND0–D10 of mesopores, dimensionless
FspFeldspar content, %DNND−10–D0 of mesopores, dimensionless
CbCarbonate content, %D1CInformation dimension of micropores, dimensionless
ClayClay content, %HCHurst index of micropores, dimensionless
PV1Mesopore pore volume, cm3/gDTCD−10–D10 of micropores, dimensionless
PV2Micropore pore volume, cm3/gDPCD0–D10 of micropores, dimensionless
SSABET specific surface area, m2/gDNCD−10–D0 of micropores, dimensionless
D1NInformation dimension of mesopores, dimensionlessDN1, DN2FHH fractal dimension of mesopores, dimensionless
HNHurst index of mesopores, dimensionlessDCV-S fractal dimension of micropores, dimensionless
p0The saturated vapor pressure, MPaVGas adsorption volume at the balance pressure, cm3/g
A, CFitting parameters in Frenkel-Halsey-Hill fractal modelV0The gas volume of the monolayer adsorption, cm3/g
pAdsorbent pressure in adsorption experiments, MPaqThe order of the distribution function
N (r)Number of boxes in multifractal analysisτ (q)Power exponent of the q-order moment
ρi (r)The probability distribution of the pore volumexq (r)The assignment function in multifractal analysis
φPorosityτTortuosity

References

  1. Jarvie, D.M.; Hill, R.J.; Ruble, T.E.; Pollastro, R.M. Unconventional shale-gas systems: The Mississippian Barnett Shale of north-central Texas as one model for thermogenic shale-gas assessment. AAPG Bull. 2007, 91, 475–499. [Google Scholar] [CrossRef]
  2. Ma, Y.; Pan, Z.; Zhong, N.; Connell, L.D.; Down, D.I.; Lin, W.; Zhang, Y. Experimental study of anisotropic gas permeability and its relationship with fracture structure of Longmaxi Shales, Sichuan Basin, China. Fuel 2016, 180, 106–115. [Google Scholar] [CrossRef]
  3. Yue, W.; Fan, T.; Zhang, J.; Shu, J.; Li, Y.; Zhang, J.; Chen, X. Characterization of the Upper Ordovician and Lower Silurian Marine Shale in Northwestern Guizhou Province of the Upper Yangtze Block, South China: Implication for Shale Gas Potential. Energy Fuels 2015, 28, 3679–3687. [Google Scholar]
  4. Guo, R.; Zhang, J.; Zhao, P.; Tang, X.; Liu, Z. Accumulation Conditions and an Analysis of the Origins of Natural Gas in the Lower Silurian Shiniulan Formation from Well Anye 1, Northern Guizhou Province. Energies 2019, 12, 4087. [Google Scholar] [CrossRef] [Green Version]
  5. Wang, Q.; Hu, Y.; Zhao, J.; Ren, L.; Zhao, C.; Zhao, J. Multiscale apparent permeability model of shale nanopores based on fractal theory. Energies 2019, 12, 3381. [Google Scholar] [CrossRef] [Green Version]
  6. Hu, H.; Hao, F.; Lin, J.; Lu, Y.; Ma, Y.; Li, Q. Organic matter-hosted pore system in the Wufeng-Longmaxi (O 3 w-S 1 1) shale, Jiaoshiba area, Eastern Sichuan Basin, China. Int. J. Coal Geol. 2017, 173, 40–50. [Google Scholar] [CrossRef]
  7. Sun, M.; Yu, B.; Hu, Q.; Yang, R.; Zhang, Y.; Li, B. Pore connectivity and tracer migration of typical shales in South China. Fuel 2017, 203, 32–46. [Google Scholar] [CrossRef]
  8. Sun, M.; Yu, B.; Hu, Q.; Zhang, Y.; Li, B.; Yang, R.; Melnichenko, Y.B.; Cheng, G. Pore characteristics of Longmaxi shale gas reservoir in the Northwest of Guizhou, China: Investigations using small-angle neutron scattering (SANS), helium pycnometry, and gas sorption isotherm. Int. J. Coal Geol. 2017, 171, 61–68. [Google Scholar] [CrossRef] [Green Version]
  9. Yang, R.; He, S.; Hu, Q.; Sun, M.; Hu, D.; Yi, J. Applying SANS technique to characterize nano-scale pore structure of Longmaxi shale, Sichuan Basin (China). Fuel 2017, 197, 91–99. [Google Scholar] [CrossRef]
  10. Gu, X.; Cole, D.R.; Rother, G.; Mildner, D.F.R.; Brantley, S.L. Pores in Marcellus Shale: A Neutron Scattering and FIB-SEM Study. Energy Fuels 2015, 29, 1295–1308. [Google Scholar] [CrossRef]
  11. Ji, W.; Song, Y.; Rui, Z.; Meng, M.; Huang, H. Pore characterization of isolated organic matter from high matured gas shale reservoir. Int. J. Coal Geol. 2017, 174, 31–40. [Google Scholar] [CrossRef]
  12. Kuila, U.; Prasad, M. Specific surface area and pore-size distribution in clays and shales. Geophys. Prospect. 2013, 61, 341–362. [Google Scholar] [CrossRef]
  13. Yang, B.; Kang, Y.; You, L.; Li, X.; Chen, Q. Measurement of the surface diffusion coefficient for adsorbed gas in the fine mesopores and micropores of shale organic matter. Fuel 2016, 181, 793–804. [Google Scholar] [CrossRef]
  14. Ekundayo, J.M.; Rezaee, R. Numerical Simulation of Gas Production from Gas Shale Reservoirs—Influence of Gas Sorption Hysteresis. Energies 2019, 12, 3405. [Google Scholar] [CrossRef] [Green Version]
  15. Chen, Q.; Zhang, J.; Tang, X.; Li, W.; Li, Z. Relationship between pore type and pore size of marine shale: An example from the Sinian–Cambrian formation, upper Yangtze region, South China. Int. J. Coal Geol. 2016, 158, 13–28. [Google Scholar] [CrossRef]
  16. Yang, F.; Ning, Z.; Wang, Q.; Zhang, R.; Krooss, B.M. Pore structure characteristics of lower Silurian shales in the southern Sichuan Basin, China: Insights to pore development and gas storage mechanism. Int. J. Coal Geol. 2016, 156, 12–24. [Google Scholar] [CrossRef]
  17. Loucks, R.G.; Reed, R.M.; Ruppel, S.C.; Jarvie, D.M. Morphology, Genesis, and Distribution of Nanometer-Scale Pores in Siliceous Mudstones of the Mississippian Barnett Shale. J. Sediment. Res. 2009, 79, 848–861. [Google Scholar] [CrossRef] [Green Version]
  18. Pan, J.; Zhu, H.; Hou, Q.; Wang, H.; Wang, S. Macromolecular and pore structures of Chinese tectonically deformed coal studied by atomic force microscopy. Fuel 2015, 139, 94–101. [Google Scholar] [CrossRef]
  19. Sethmann, I.; Wörheide, G. Structure and composition of calcareous sponge spicules: A review and comparison to structurally related biominerals. Micron 2008, 39, 209–228. [Google Scholar] [CrossRef]
  20. Leu, L.; Georgiadis, A.; Blunt, M.J.; Busch, A.; Bertier, P.; Schweinar, K.; Liebi, M.; Menzel, A.; Ott, H. Multi-scale description of shale pore systems by scanning SAXS and WAXS microscopy. Energy Fuels 2016, 30, 10282–10297. [Google Scholar] [CrossRef]
  21. Okolo, G.N.; Everson, R.C.; Neomagus, H.W.J.P.; Roberts, M.J.; Sakurovs, R. Comparing the porosity and surface areas of coal as measured by gas adsorption, mercury intrusion and SAXS techniques. Fuel 2015, 141, 293–304. [Google Scholar] [CrossRef]
  22. Bahadur, J.; Radlinski, A.P.; Melnichenko, Y.B.; Mastalerz, M.; Schimmelmann, A. Small-Angle and Ultrasmall-Angle Neutron Scattering (SANS/USANS) Study of New Albany Shale: A Treatise on Microporosity. Energy Fuels 2015, 29, 567–576. [Google Scholar] [CrossRef] [Green Version]
  23. Clarkson, C.R.; Solano, N.; Bustin, R.M.; Bustin, A.M.; Chalmers, G.R.; He, L. Pore structure characterization of North American shale gas reservoirs; using USANS/SANS, gas adsorption, and mercury intrusion. Fuel 2013, 103, 606–616. [Google Scholar] [CrossRef]
  24. Clarkson, C.R.; Freeman, M.; He, L.; Agamalian, M.; Melnichenko, Y.B.; Mastalerz, M.; Bustin, R.M.; Radliński, A.P.; Blach, T.P. Characterization of tight gas reservoir pore structure using USANS/SANS and gas adsorption analysis. Fuel 2012, 95, 371–385. [Google Scholar] [CrossRef]
  25. Mastalerz, M.; He, L.; Melnichenko, Y.B.; Rupp, J.A. Porosity of Coal and Shale: Insights from Gas Adsorption and SANS/USANS Techniques. Energy Fuels 2012, 26, 5109–5120. [Google Scholar] [CrossRef]
  26. Ruppert, L.F.; Sakurovs, R.; Blach, T.P.; He, L.; Melnichenko, Y.B.; Mildner, D.F.R.; Alcantar-Lopez, L. A USANS/SANS Study of the Accessibility of Pores in the Barnett Shale to Methane and Water. Energy Fuels 2013, 27, 772–779. [Google Scholar] [CrossRef]
  27. Habina, I.; Radzik, N.; Topór, T.; Krzyżak, A.T. Insight into oil and gas-shales compounds signatures in low field 1 H NMR and its application in porosity evaluation. Microporous Mesoporous Mater. 2017, 252, 37–49. [Google Scholar] [CrossRef]
  28. Thern, H.; Horch, C.; Stallmach, F.; Li, B.; Mezzatesta, A.; Zhang, H.; Arro, R. Low-field NMR laboratory measurements of hydrocarbons confined in organic nanoporous media at various pressures. Microporous Mesoporous Mater. 2017, 269, 21–25. [Google Scholar] [CrossRef]
  29. Zhou, B.; Komulainen, S.; Vaara, J.; Telkki, V.V. Characterization of pore structures of hydrated cements and natural shales by 129 Xe NMR spectroscopy. Microporous Mesoporous Mater. 2017, 253, 49–54. [Google Scholar] [CrossRef]
  30. Yan, W.; Sun, J.; Sun, Y.; Golsanami, N. A robust NMR method to measure porosity of low porosity rocks. Microporous Mesoporous Mater. 2018, 269, 113–117. [Google Scholar] [CrossRef]
  31. Labani, M.M.; Rezaee, R.; Saeedi, A.; Hinai, A.A. Evaluation of pore size spectrum of gas shale reservoirs using low pressure nitrogen adsorption, gas expansion and mercury porosimetry: A case study from the Perth and Canning Basins, Western Australia. J. Pet. Sci. Eng. 2013, 112, 7–16. [Google Scholar] [CrossRef]
  32. Mastalerz, M.; Schimmelmann, A.; Drobniak, A.; Chen, Y. Porosity of Devonian and Mississippian New Albany Shale across a maturation gradient: Insights from organic petrology, gas adsorption, and mercury intrusion. AAPG Bull. 2013, 97, 1621–1643. [Google Scholar] [CrossRef]
  33. Wang, S.; Javadpour, F.; Feng, Q. Confinement Correction to Mercury Intrusion Capillary Pressure of Shale Nanopores. Sci. Rep. 2016, 6, 20160. [Google Scholar] [CrossRef] [PubMed] [Green Version]
  34. Zhang, P.; Lu, S.; Li, J.; Zhang, J.; Xue, H.; Chen, C. Comparisons of SEM, Low-Field NMR, and Mercury Intrusion Capillary Pressure in Characterization of the Pore Size Distribution of Lacustrine Shale: A Case Study on the Dongying Depression, Bohai Bay Basin, China. Energy Fuels 2017, 31, 9232–9239. [Google Scholar] [CrossRef]
  35. Yuan, Y.; Rezaee, R. Comparative porosity and pore structure assessment in shales: Measurement techniques, influencing factors and implications for reservoir characterization. Energies 2019, 12, 2094. [Google Scholar] [CrossRef] [Green Version]
  36. Fan, D.; Ettehadtavakkol, A. Semi-analytical modeling of shale gas flow through fractal induced fracture networks with microseismic data. Fuel 2017, 193, 444–459. [Google Scholar] [CrossRef]
  37. Lee, S.; Fischer, T.B.; Stokes, M.R.; Klingler, R.J.; Ilavsky, J.; Mccarty, D.K.; Wigand, M.O.; Derkowski, A.; Winans, R.E. Dehydration Effect on the Pore Size, Porosity, and Fractal Parameters of Shale Rocks: Ultrasmall-Angle X-ray Scattering Study. Energy Fuels 2014, 28, 6772–6779. [Google Scholar] [CrossRef]
  38. Liu, K.; Ostadhassan, M.; Kong, L. Fractal and Multifractal Characteristics of Pore Throats in the Bakken Shale. Transp. Porous Media 2018, 126, 579–598. [Google Scholar] [CrossRef]
  39. Yang, F.; Ning, Z.; Liu, H. Fractal characteristics of shales from a shale gas reservoir in the Sichuan Basin, China. Fuel 2014, 115, 378–384. [Google Scholar] [CrossRef]
  40. Zhang, T.; Li, X.; Li, J.; Feng, D.; Wu, K.; Shi, J.; Sun, Z.; Han, S. A Fractal Model for Gas–Water Relative Permeability in Inorganic Shale with Nanoscale Pores. Transp. Porous Media 2018, 122, 305–331. [Google Scholar] [CrossRef]
  41. Krohn, C.E. Fractal measurements of sandstones, shales, and carbonates. J. Geophys. Res. Solid Earth 1988, 93, 3297–3305. [Google Scholar] [CrossRef]
  42. Dathe, A.; Eins, S.; Niemeyer, J.; Gerold, G. The surface fractal dimension of the soil–pore interface as measured by image analysis. Geoderma 2001, 103, 203–229. [Google Scholar] [CrossRef]
  43. Jaroniec, M. Evaluation of the Fractal Dimension from a Single Adsorption Isotherm. Langmuir 1995, 11, 2316–2317. [Google Scholar] [CrossRef]
  44. Tatlier, M.; Erdem-Şenatalar, A. Fractal Dimension as a Tool to Guide Zeolite Synthesis. Chaos Solitons Fractals 1998, 9, 1803–1812. [Google Scholar] [CrossRef]
  45. Liu, L.; Tang, S.; Xi, Z. Total Organic Carbon Enrichment and Its Impact on Pore Characteristics: A Case Study from the Niutitang Formation Shales in Northern Guizhou. Energies 2019, 12, 1480. [Google Scholar] [CrossRef] [Green Version]
  46. Avnir, D.; Jaroniec, M. An isotherm equation for adsorption on fractal surfaces of heterogeneous porous materials. Langmuir 1989, 5, 1431–1433. [Google Scholar] [CrossRef]
  47. Rouquerol, J.; Avnir, D.; Everett, D.H.; Fairbridge, C.; Haynes, M.; Pernicone, N.; Ramsay, J.D.F.; Sing, K.S.W.; Unger, K.K. Guidelines for the Characterization of Porous Solids. Pure Appl. Chem. 1994, 66, 1739–1758. [Google Scholar] [CrossRef]
  48. Wong, P.; Howard, J.; Lin, J. Surface Roughening and the Fractal Nature of Rocks. Phys. Rev. Lett. 1986, 57, 637–640. [Google Scholar] [CrossRef]
  49. Bernal, J.L.P.; Bello, M.A. Fractal geometry and mercury porosimetry: Comparison and application of proposed models on building stones. Appl. Surf. Sci. 2001, 185, 99–107. [Google Scholar] [CrossRef]
  50. Ismail, I.M.K.; Pfeifer, P. Fractal Analysis and Surface Roughness of Nonporous Carbon Fibers and Carbon Blacks. Langmuir 1994, 10, 1532–1538. [Google Scholar] [CrossRef]
  51. Tatlier, M.; Erdem-Çenatalar, A. Fractal dimension of zeolite surfaces by calculation. Chaos Solitons Fractals 2001, 12, 1145–1155. [Google Scholar] [CrossRef]
  52. Vázquez, E.V.; Ferreiro, J.P.; Miranda, J.G.V.; González, A.P. Multifractal Analysis of Pore Size Distributions as Affected by Simulated Rainfall. Vadose Zone J. 2008, 7, 500–511. [Google Scholar] [CrossRef]
  53. Ferreiro, J.P.; Vázquez, E.V. Multifractal analysis of Hg pore size distributions in soils with contrasting structural stability. Geoderma 2010, 160, 64–73. [Google Scholar] [CrossRef]
  54. Martínez, F.S.J.; Martín, M.A.; Caniego, F.J.; Tuller, M.; Guber, A.; Pachepsky, Y.; García-Gutiérrez, C. Multifractal analysis of discretized X-ray CT images for the characterization of soil macropore structures. Geoderma 2010, 156, 32–42. [Google Scholar] [CrossRef] [Green Version]
  55. Li, W.; Liu, H.; Song, X. Multifractal analysis of Hg pore size distributions of tectonically deformed coals. Int. J. Coal Geol. 2015, 144–145, 138–152. [Google Scholar] [CrossRef]
  56. Muller, J.; Mccauley, J.L. Implication of fractal geometry for fluid flow properties of sedimentary rocks. Transp. Porous Media 1992, 8, 133–147. [Google Scholar] [CrossRef]
  57. Xie, S.; Cheng, Q.; Ling, Q.; Li, B.; Bao, Z.; Fan, P. Fractal and multifractal analysis of carbonate pore-scale digital images of petroleum reservoirs. Mar. Pet. Geol. 2010, 27, 476–485. [Google Scholar] [CrossRef]
  58. Emmett, B.A.; Leloup, P.H.; Brunauer, S.; Stephen, S.; Katharine, S. The measurement of surface areas of soils and soil colloids by the use of low temperature van der waals adsorption isotherms. Soil Sci. 1938, 45, 57–66. [Google Scholar] [CrossRef]
  59. Seaton, N.A.; Walton, J.P.R.B.; Quirke, N. A new analysis method for the determination of the pore size distribution of porous carbons from nitrogen adsorption measurements. Carbon 1989, 27, 853–861. [Google Scholar] [CrossRef]
  60. Caniego, F.J.; Martí, M.A.; José, F.S. Rényi dimensions of soil pore size distribution. Geoderma 2003, 112, 205–216. [Google Scholar] [CrossRef]
  61. Wang, M.; Xue, H.; Tian, S.; Wilkins, R.W.T.; Wang, Z. Fractal characteristics of Upper Cretaceous lacustrine shale from the Songliao Basin, NE China. Mar. Pet. Geol. 2015, 67, 144–153. [Google Scholar] [CrossRef]
  62. Shao, X.; Pang, X.; Li, Q.; Wang, P.; Chen, D.; Shen, W.; Zhao, Z. Pore structure and fractal characteristics of organic-rich shales: A case study of the lower Silurian Longmaxi shales in the Sichuan Basin, SW China. Mar. Pet. Geol. 2017, 80, 192–202. [Google Scholar] [CrossRef]
  63. Yang, C.; Zhang, J.; Wang, X.; Tang, X.; Chen, Y.; Jiang, L.; Gong, X. Nanoscale pore structure and fractal characteristics of marine-continental transitional shale: A case study from the Lower Permian Shanxi Shale in the southeastern Ordos Basin, China. Mar. Pet. Geol. 2017, 88, 54–68. [Google Scholar] [CrossRef]
  64. Mandelbrot, B.B. The Fractal Geometry of Nature; Birkh Auser Verlag: Basel, Switzerland, 1991; 468p. [Google Scholar]
  65. Wei, M.; Zhang, L.; Xiong, Y.; Li, J.; Peng, P.A. Nanopore structure characterization for organic-rich shale using the non-local-density functional theory by a combination of N2 and CO2 adsorption. Microporous Mesoporous Mater. 2016, 227, 88–94. [Google Scholar] [CrossRef]
  66. Wang, Y.; Zhu, Y.; Liu, S.; Zhang, R. Pore characterization and its impact on methane adsorption capacity for organic-rich marine shales. Fuel 2016, 181, 227–237. [Google Scholar] [CrossRef] [Green Version]
  67. Muller, J. Characterization of pore space in chalk by multifractal analysis. J. Hydrol. 1996, 187, 215–222. [Google Scholar] [CrossRef]
  68. Yao, Y.; Liu, D.; Tang, D.; Tang, S.; Huang, W. Fractal characterization of adsorption-pores of coals from North China: An investigation on CH adsorption capacity of coals. Int. J. Coal Geol. 2008, 73, 27–42. [Google Scholar] [CrossRef]
  69. Ross, D.J.K.; Bustin, R.M. Impact of mass balance calculations on adsorption capacities in microporous shale gas reservoirs. Fuel 2012, 86, 2696–2706. [Google Scholar] [CrossRef]
  70. Kuila, U.; Mccarty, D.K.; Derkowski, A.; Fischer, T.B.; Topór, T.; Prasad, M. Nano-scale texture and porosity of organic matter and clay minerals in organic-rich mudrocks. Fuel 2014, 135, 359–373. [Google Scholar] [CrossRef] [Green Version]
  71. Loucks, R.G.; Reed, R.M.; Ruppel, S.C.; Hammes, U. Spectrum of pore types and networks in mudrocks and a descriptive classification for matrix-related mudrock pores. AAPG Bull. 2012, 96, 1071–1098. [Google Scholar] [CrossRef] [Green Version]
  72. Jiao, K.; Yao, S.; Liu, C.; Gao, Y.; Wu, H.; Li, M.; Tang, Z. The characterization and quantitative analysis of nanopores in unconventional gas reservoirs utilizing FESEM–FIB and image processing: An example from the lower Silurian Longmaxi Shale, upper Yangtze region, China. Int. J. Coal Geol. 2014, 128–129, 1–11. [Google Scholar] [CrossRef]
  73. Huang, L.; Ning, Z.; Wang, Q.; Qi, R.; Li, J.; Zeng, Y.; Ye, H.; Qin, H. Thermodynamic and Structural Characterization of Bulk Organic Matter in Chinese Silurian Shale: Experimental and Molecular Modeling Studies. Energy Fuels 2017, 31, 4851–4865. [Google Scholar] [CrossRef]
  74. Vasileiadis, M.; Peristeras, L.D.; Papavasileiou, K.D.; Economou, I.G. Modeling of bulk kerogen porosity: Methods for control and characterization. Energy Fuels 2017, 31, 6004–6018. [Google Scholar] [CrossRef] [Green Version]
  75. Bousige, C.; Ghimbeu, C.M.; Vix-Guterl, C.; Pomerantz, A.E.; Suleimenova, A.; Vaughan, G.; Garbarino, G.; Feygenson, M.; Wildgruber, C.; Ulm, F.J. Realistic molecular model of kerogen’s nanostructure. Nat. Mater. 2016, 15, 576–582. [Google Scholar] [CrossRef] [PubMed]
  76. Xiong, J.; Liu, X.; Liang, L.; Zeng, Q. Adsorption of methane in organic-rich shale nanopores: An experimental and molecular simulation study. Fuel 2017, 200, 299–315. [Google Scholar] [CrossRef]
  77. Slatt, R.M.; O’Brien, N.R. Pore types in the Barnett and Woodford gas shales: Contribution to understanding gas storage and migration pathways in fine-grained rocks. AAPG Bull. 2011, 95, 2017–2030. [Google Scholar] [CrossRef]
  78. Wu, C.; Tuo, J.; Zhang, L.; Zhang, M.; Li, J.; Liu, Y.; Qian, Y. Pore characteristics differences between clay-rich and clay-poor shales of the Lower Cambrian Niutitang Formation in the Northern Guizhou area, and insights into shale gas storage mechanisms. Int. J. Coal Geol. 2017, 178, 13–25. [Google Scholar] [CrossRef]
  79. Yang, J.; Hatcherian, J.; Hackley, P.C.; Pomerantz, A.E. Nanoscale geochemical and geomechanical characterization of organic matter in shale. Nat. Commun. 2017, 8, 2179. [Google Scholar] [CrossRef] [Green Version]
  80. Tang, X.; Zhang, J.; Wang, X.; Yu, B.; Ding, W.; Xiong, J.; Yang, Y.; Wang, L.; Yang, C. Shale characteristics in the southeastern Ordos Basin, China: Implications for hydrocarbon accumulation conditions and the potential of continental shales. Int. J. Coal Geol. 2014, 128–129, 32–46. [Google Scholar] [CrossRef]
  81. Ross, D.J.K.; Bustin, R.M. Investigating the use of sedimentary geochemical proxies for paleoenvironment interpretation of thermally mature organic-rich strata: Examples from the Devonian–Mississippian shales, Western Canadian Sedimentary Basin. Chem. Geol. 2009, 260, 1–19. [Google Scholar] [CrossRef]
  82. Chen, J.; Xiao, X. Evolution of nanoporosity in organic-rich shales during thermal maturation. Fuel 2014, 129, 173–181. [Google Scholar] [CrossRef]
  83. Liu, Y.; Zhu, Y.; Chen, S.; Wang, Y.; Song, Y. Evaluation of Spatial Alignment of Kerogen in Shale Using High-Resolution Transmission Electron Microscopy, Raman Spectroscopy, and Fourier Transform Infrared. Energy Fuels 2018, 32, 10616–10627. [Google Scholar] [CrossRef]
  84. Pape, H.; Clauser, C.; Iffland, J. Variation of permeability with porosity in sandstone diagenesis interpreted with a fractal pore space model. In Fractals and Dynamic Systems in Geoscience; Springer: Berlin/Heidelberg, Germany, 2000; pp. 603–619. [Google Scholar]
Figure 1. N2 adsorption-desorption isotherms of the Longmaxi Shale samples.
Energies 13 01349 g001
Figure 2. CO2 adsorption isotherms of the Longmaxi Shale samples.
Energies 13 01349 g002
Figure 3. Pore volume (a) and Brunauer–Emmett–Teller (BET)-specific surface area (b) of the Longmaxi Shale samples.
Energies 13 01349 g003
Figure 4. Pore size distribution of micropores and mesopores.
Energies 13 01349 g004
Figure 5. Plots of log[χ(q, ε)] versus log(ε) for the pore size distributions (PSDs) of mesopores.
Energies 13 01349 g005
Figure 6. Plots of log[χ(q, ε)] versus log(ε) for the PSDs of the micropores.
Energies 13 01349 g006
Figure 7. Plots of Dq versus q (−10 < q < 10) for the PSDs of the mesopores of samples from Xiaoxi (a) and Fendong section (b).
Energies 13 01349 g007
Figure 8. Plots of Dq versus q (−10 < q < 10) for the PSDs of the micropores of samples from Xiaoxi (a) and Fendong section (b).
Energies 13 01349 g008
Figure 9. Correlation coefficients of the shale material composition data, pore parameters and fractal parameters.
Energies 13 01349 g009
Figure 10. Plots of ln(V) versus ln(ln(P0/P)) from the N2 adsorption isotherms.
Energies 13 01349 g010
Figure 11. Plots of ln(V) versus ln(S) from the CO2 adsorption isotherms.
Energies 13 01349 g011
Figure 12. Relationship between the TOC content and pore volume (a) and BET-specific surface area (b) of Longmaxi Formation shale.
Energies 13 01349 g012
Figure 13. Relationship between the TOC content and spectral width parameter of mesopores (a) and micropores (b).
Energies 13 01349 g013
Figure 14. Plots of DN1 versus singularity parameters (a) and DN1 versus the spectral width parameters (b).
Energies 13 01349 g014
Figure 15. Plots of DN1 versus DN2 (a) and Dc versus the spectral width parameters (b).
Energies 13 01349 g015
Figure 16. Relationship between the fractal parameter and transport rate of the adsorbate of mesopores.
Energies 13 01349 g016
Table 1. Total organic carbon (TOC) and X-ray diffraction (XRD) analysis results of shale samples.
Sample No.TOC (%)Mineralogical Compositions (%)
QuartzOrthoclasePlagioclaseCalciteDolomitePyriteClay
X-48.2637.004.0012.0022.008.00-17.00
X-59.9377.003.004.00---16.00
X-75.8144.002.201.0013.405.102.3032.00
X-91.6236.801.106.406.705.201.6042.20
X-101.1951.006.0017.00---26.00
X-141.6434.0010.0010.0020.00--26.00
X-151.3432.006.0010.0026.00--26.00
F-44.9576.100.502.705.803.800.9010.20
F-64.6052.400.503.1016.007.804.3015.90
F-85.2642.500.504.1018.4014.903.6016.00
F-144.2062.00-5.006.0013.00-14.00
F-153.6083.00-1.00---16.00
Table 2. Multi-fractal parameters of Longmaxi Formation shale.
Sample No.MesoporesMicroporous
D1NHNDTNDPNDNNDN1DN2D1CHCDTCDPCDNCDC
X-41.010.990.810.190.632.762.700.970.970.520.220.302.23
X-51.010.980.970.220.752.772.720.950.960.540.160.382.56
X-71.010.990.740.230.502.752.650.960.960.530.190.342.62
X-91.000.980.900.250.652.732.660.970.970.660.180.492.30
X-101.041.010.450.120.332.712.650.980.970.510.150.362.23
X-141.020.990.620.210.412.702.620.970.970.580.160.422.29
X-151.010.980.680.240.442.722.620.950.950.480.230.252.52
F-41.020.990.740.220.522.712.700.980.970.510.200.322.29
F-61.021.000.650.150.502.752.700.980.970.570.180.392.31
F-81.020.990.690.230.472.732.700.980.970.470.180.282.27
F-141.020.990.630.210.422.722.680.980.970.570.180.392.26
F-151.031.000.590.180.412.662.630.940.940.620.310.322.32
Table 3. Fractal dimensions derived from the fractal Frenkel–Halsey–Hill (FHH) model.
Sample No.P/P0 > 0.5P/P0 < 0.5
Fitting EquationR2D1Fitting EquationR2D2
X-4y = −0.239x + 2.0970.9992.761y = −0.299x + 2.0920.9962.701
X-5y = −0.233x + 2.0490.9992.767y = −0.282x + 2.0420.9972.718
X-7y = −0.254x + 2.1510.9972.746y = −0.347x + 2.1050.9982.653
X-9y = −0.273x + 1.7050.9982.727y = −0.344x + 1.6910.9982.656
X-10y = −0.295x + 1.7340.9982.705y = −0.355x + 1.7250.9992.645
X-14y = −0.304x + 1.7290.9992.696y = −0.382x + 1.7190.9982.618
X-15y = −0.282x + 1.6900.9992.718y = −0.378x + 1.6710.9962.622
F-4y = −0.289x + 2.1770.9982.711y = −0.305x + 2.1850.9982.695
F-6y = −0.248x + 1.8160.9972.752y = −0.296x + 1.8060.9972.704
F-8y = −0.275x + 1.6560.9992.725y = −0.304x + 1.6610.9982.696
F-14y = −0.285x + 1.8890.9982.715y = −0.319x + 1.8890.9962.681
F-15y = −0.336x + 1.9900.9972.664y = −0.372x + 1.9800.9992.628
Table 4. Fractal dimensions derived from the volume-surface area (V-S) model.
Sample No.Fitting EquationR2DSample No.Fitting EquationR2D
X-4y = 0.742x + 6.9410.9792.229X-15y = 0.840x + 7.1590.9992.522
X-5y = 0.852x + 7.4870.9982.556F-4y = 0.762x + 7.0370.9942.288
X-7y = 0.872x + 7.4510.9992.617F-6y = 0.770x + 6.9780.9952.310
X-9y = 0.767x + 6.8740.9962.304F-8y = 0.757x + 6.9790.9942.271
X-10y = 0.764x + 6.9160.9952.227F-14y = 0.752x + 6.8720.9952.257
X-14y = 0.762x + 6.8720.9952.286F-15y = 0.772x + 7.0130.9972.316
Table 5. Adsorbent transport rate of Longmaxi shale based on low-pressure N2/CO2 adsorption (LP-N2/CO2GA).
Sample No.Transport Rate of N2 (cm³/(g·min))Transport Rate of CO2 (cm³/(g·min))
X-40.0370.009
X-50.0340.017
X-70.0290.008
X-90.0370.003
X-100.0590.009
X-140.0490.003
X-150.0470.004
F-40.0520.005
F-60.0330.008
F-80.0310.009
F-140.0420.005
F-150.0710.020

