Article

Detection and Location of Earth Fault in MV Feeders Using Screen Earthing Current Measurements

1
Institute of Electric Power Engineering, Poznan University of Technology, Piotrowo 3A, 60965 Poznan, Poland
2
Department of Network Asset Management, Enea Operator, Strzeszynska 58, 60479 Poznan, Poland
*
Author to whom correspondence should be addressed.
Energies 2020, 13(5), 1293; https://doi.org/10.3390/en13051293
Submission received: 4 February 2020 / Revised: 6 March 2020 / Accepted: 8 March 2020 / Published: 10 March 2020
(This article belongs to the Section A1: Smart Grids and Microgrids)

Abstract

:
The paper analyzes the utilization of cable screen currents for earth fault identification and location. Attention is paid on cable and mixed feeders—cable and overhead lines. The principle of operation is based on utilization of 3 criterion values: Ratio of cable screen earthing current and zero sequence cable core current—RF110/15, phase shift between cable screen earthing current and zero sequence cable core current—α and cable screen admittance defined as a ratio of cable screen earthing current and zero sequence voltage—Y0cs. Earth fault location is possible thanks to discovered relation between RF110/15 and α, whereas Y0cs allows for reliable detection of earth faults. Detection and identification are very important because it allows to increase the reliability of supply—reduce downtime and number of consumers affected by the fault. The article presents a phase to ground fault current flow for different power system configurations. At the end solution, which improves location capabilities is proposed. The solution is analyzed in PSCAD software and verified by network experiment.

1. Introduction

Nowadays one can notice a tendency to increase the number of measuring equipment installed in power system networks. The topic is analyzed by different organizations i.e., CIGRE WG B3.44—Substation servicing and supervision, present and expected future use of mobile devices and sensors. It is however noted that similar trends are observed in different industries. In industrial applications, one can observe the tendency to install 4.0 generation sensors, whereas in the consumer electronics industry one can observe the tendency to install more and more IoT devices [1]. It is, however, necessary to underline that, increasing the number of sensors leads to an increase in the amount of data. If data is not utilized properly will have a negative impact on the cost of IT system connected with data transmission, processing, and storage [2]. In order to maximize the effectiveness of installed sensors, it is necessary to process data locally, particularly in the case of wireless sensors, which have a limited amount of energy [3]. One has considered a fact that data transmission is more energy-consuming process than local data analysis. The paper focuses on the utilization of cable screen currents of MV power cables. In previous papers, a few functionalities were proposed—utilization of cable screen currents for identification of cable screen erroneous connection and for identification of earth faults in cable lines [4,5]. Moreover, proof of concept regarding the identification of line affected by phase to ground fault was presented. The literature presents additional functions like the identification of cable sheath faults. The paper presents earth fault for different configurations of power lines, the criterion of phase to ground fault detection is elaborated and the methodology of identification line affected by the fault is presented. Identification of line type affected by the fault is important in order to increase the reliability of the supply of MV distribution systems by reducing the time of fault removal and blocking of operation of auto-reclose. Reduced number of unsuccessful auto-reclose operations, helps to reduce thermal and mechanical tensions, which lead to oxidation of connection surface and PD discharges [6]. Moreover, a reduced number of unsuccessful auto-reclose operations helps to increase the quality of supply since voltage transients and sags connected with fault occurrence are reduced [7]. One has to hover notice that not all faults at the MV side are seen on the LV side. Thermal and mechanical tensions resulting from unsuccessful AR operation can be reduced by PulseCloser technology [8]. One has to underline that overvoltages still exist and could damage insulation and therefore utilization of prosed solution or combination of both is recommended.
Analysis of phase to ground faults is important since approximately 70–80% of all faults are phase to ground faults i.e., 72% in Portuguese [9]. In the case of cable lines, approximately a few earth faults are observed per 100 km, whereas in case of overhead lines a number of faults are in the range of 20/100 km [10].
The proposed method is developed for 3 phase 3 wire system with 1 neutral point grounding or isolated systems. Four wires network, multi-point grounded network and others require different methods of fault location and blocking of AR [11]. The presented criteria are not valid in multi-point grounded system since additional earthing points would create parallel paths for earth fault current flow. As a result of the parallel current flow paths, cable screen earthing current could be bigger than zero sequence cable core current. The effect could be compared to reverse capacitive current presented in paragraph simulation. An exception would be a few point earthed system i.e., 2, but only if the neutral earthing points would be outside the protected feeder. The schematic diagram of the proposed solutions is presented in Figure 1. The second paragraph presents a method of fault location in MV networks. The next paragraph presents a simulation model and describes relations important for fault location. Simulation results are confronted with the measurement taken in MV network during network experiments. One previous last chapter presents the algorithm of identification of line type affected by fault and branch as well as the system for ground fault identification. The summary presents the most important features of the system and presents the scope of future works.

2. Methods of Fault Localization

The literature presents a big number of solutions developed for the identification of the line affected by the fault. The topic is important for power system distribution networks, industrial and railway networks [12]. Despite a big number of localization algorithms presented in the literature, only 2 methods are utilized on a bigger scale—fault current indicators and distance protection relay [13,14]. Effectiveness of distance protection relays under phase to ground fault is strongly limited—[15] claims that identification of 1/3 of the feeder, which could be affected by the fault is a success. Distance protection is commonly used in HV and UHV lines and can identify the type of line affected by fault as long as the fault is not close to the point of line transition—cable to overhead [16]. Principle of operation of distance relay is presented in Figure 2—protection zone determined via impedance setting is marked with blue lines and feeder impedance, including branches, is marked with black color. Unfortunately measured fault impedance can be greatly shifted from the line impedance what is caused mostly by measuring and parameter errors as well as fault impedance—on MV level only resistance is considered. As a result, it is almost impossible to identify faulted branch.
Utilization of distance relays in MV networks is connected with many problems i.e., difficulties with a determination of k parameter Equation (1) required for proper calculation of impedance under phase to ground fault [17,18]. Effectiveness of distance relays is affected by load before fault occurrence, fault resistance, presence of additional power sources and others [19]. Due to many parameters affecting impedance measurement, there is uncertainty range of impedance measurement and distance to fault is only approximation.
k = 1 3 ( Z _ 0 Z _ L 1 )
where Z _ 0 is zero sequence impedance, Z _ L is positive sequence impedance.
The next alternative for the phase to ground fault location is the utilization of the phase shift between current transients recorded in different parts of networks [20]. The method is developed for cable lines, however, it is necessary to develop a method for cable—overhead lines. The disadvantage of the method is connected with the necessity of human interpretation of results and the necessity of high-quality devices—recording signal with high sampling rate—in range of MHz, which in turn increases the cost of the hardware. Automation of devices. Similar method—traveling waves method in 2 places uses additional processing methods—Teager Energy operator to identify the moment of traveling wave occurrence and wavelet Hilbert Huang transform for identification of transients [21]. Different methods of identification line type affected by fault are the installation of additional sensors along the protected feeder i.e., PD sensors on cable joints [22]. The concept, however, requires high investment costs and operational problems. The next identification concept is connected with an optimization algorithm for earth fault location. The method can be used in isolated and compensated mv networks. Unfortunately, the effectiveness of method operation depends on fault resistance and local energy sources. The effectiveness of identification is in the range of 80–95% [23]. Despite the presented method, harmonic based methods like Zon, Volna, ZVN, YC3, etc. or symmetrical component-based i.e., negative current are used [24,25].
Probably fault current indicator gained the biggest popularity in MV networks. The fault indicators indicate the area between indicators as an area under fault conditions. The disadvantage of the indicators is many complications and technical constraints i.e., installation and maintenance of the fault indicators [26,27]. Effectiveness of fault location can be increased if electrical signals are processed via advanced tools i.e., wavelet and correlation with other systems like geographic information system—GIS i.e., it is possible to claim that fault was created because of contact with tree, when trees are marked in GIS system one can reduce the area of search to place with trees i.e., forest [28]. It is also possible to analyze voltage sag type in order to identify fault reasons and localize the fault [29,30].
Presented methods are based on phase currents measurements. The presented method is based on the screen current measurement. The literature presents information about the utilization of screen current measurement for identification of line, however, 3 phase cable screens currents and complex algorithms are necessary, whereas in the case of developed method only cable screen earthing current—I0cs is needed [31]. Only 1 side current measurement is needed in the method and simple signal processing method what significantly reduces the cost of measuring equipment comparing to the other presented solutions. Due the specific operation—identification of the segment affected by the fault is compared with similar solutions—fault indicators and distance protection is compared in Table 1. Different fault location methods are compared in [32].
In the literature, much attention is paid on the analysis of local energy sources on protection relay [33]. Proposed solution work properly in active system networks with many additional power sources and new devices like fault current limiters (FCLs) etc. since zero-sequence current flow is not affected by Dy transformers and YYn transformers, ungrounded at MV side [34,35]. Local energy sources could affect zero-sequence current flow if YNyn transformer is used [36,37]. In such case local energy sources i.e., prosumers could have an impact on zero-sequence current flow. In most cases however prosumers have small power and as a result, the impact is also small. At the same time one has to underline that in the polish powers system, apart from exceptional cases, networks are grounded in only one point, what allows to neglect the impact of local energy sources on zero sequence current completely.
Despite the possibility to distinguish line type affected by the fault, the proposed algorithm is capable of identifying branch affected by the earth fault. One has to underline that the possibility of branch identification is limited and depends on electrical parameters of power lines—mostly on cables length and earthing resistances, what is presented in the paragraph—simulation results. An additional factor affecting the proposed algorithm is connected with power system reconfiguration i.e., tie open point modification [38]. To compensate for network reconfiguration, one can send fault data and network information to the central system. Based on the data simulation model is created i.e., in PowerFactory (version 2019 SP4, DIgSILENT GmbH, Gomaringen, Germany) or PSCAD software (v6.1, Manitoba Hydro International Ltd., Winnipeg, Manitoba, Canada). Simulation software is used to obtain data for different fault locations, which are further compared with measured fault data. Simulation software can be run in background mode thanks to API interfaces [39]. It is also possible to increase the accuracy of results if weather data or other will be used to assess earthing resistance. The proposed method can be used in cable lines with different bonding configurations i.e., cross bonded lines or one point bonded lines [40].

3. Measuring System

The proposed solution utilizes Rogowski coils for current measurement. The measuring system is presented in Figure 3 [5]. In many places around the globe, conventional current transformers are used, however, utilization of Rogowski coils fits in world trends. One of the main reason for CT transformer installation are historical issues—current transformers not only provide measurand, but also energy to run analog relays [41]. Nowadays relays are connected to an external power supply and power from CT is not necessary. It is, however, difficult to replace conventional CT transformers because some protection relays are not able to read Rogowski coil signal so an old CTs are replaced with a new a one and when protection relay needs to be replaced it is adopted to an existing current sensors. Authors believe that protection relays manufacturer should equip protection relays with bigger number of inputs—Rogowski and conventional or provide accessories for signal conversion. In many cases, new protection relays already use Rogowski coil to measure secondary side transformers and some manufacturers already offer relays with both current input types [42].

4. Simulation Tests

Earth fault current flow in the MV cable line network is presented in Figure 4. The model is built from the following components: 110/15 transformer, grounding transformer, earthing system, cable, and overhead line [43]. The cable line is modeled as a Frequency-dependent line and considers distributed parameters.
Figure 5 presents earthing current sources. The current sources marked with yellow, grey, red and green are presented in the previous author’s publications [4,5]. Sources marked with red-blue and light blue are presented in the next paragraphs. Simulations were made in PSCAD software. Attention is paid on earthing resistances and the number of cable earthing points because those parameters have the biggest impact on simulation results. Moreover, earthing system resistance is a function of time i.e., resistance made of pipe ¾ inch with a length 3 feet in rocky, clay ground is varying in the range of 42 do 77 Ω. Depth of earthing system installation has a big impact on resistance variation i.e., 10 feet long ¾ pipe is varying in the range of 37 to 58 Ω [44]. Variability of earthing resistance depends on the earthing system’s spatial layout and material of the earthing system and soil type [45]. It is possible to assess earthing system resistance using weather station data or humidity sensors installed in the distribution system network.
In the previous author’s paper [5], a concept of faulted line identification is presented. In case of fault between cable screen and cable core, the phase shift between I0cs and I0cc current is 0, whereas in case of a fault in overhead line installed after the cable the phase shift is 90. The presented concept is a valid hover is simplified. In real cable lines, the phase shift can vary in a relatively broadband, which is presented in the paragraph.
Simulations were aimed at sensitivity analysis on a reduction factor of 110/15 kV substation and phase shift between the zero-sequence current measured in cable cores and earthing current. Attention is paid on cable parameters, mostly on cable screen cross-section and cable length and earthing resistances.
Mathematical description of cable lines reduction factor is given by the formula [46]. Mathematical description of reduction factor of cables with ECC wire can be found in [47], the reduction factor of 3 core cables in [48] and in [49] reduction factor of parallel lines. Most publications focus on electrocution protection and consider a case of phase to screen fault, where touch voltage has the biggest amplitudes. A reduction factor of mixed power lines—cable, overhead lines is based on the scheme presented in Figure 6.
Relations presented in Figure 6 allows to develop following set of equations describing the cable screen earthing current:
a 11 I c s a + a 12 I c s b + a 13 I c s c = b 1 3 I 0 c c
a 22 I c s b + a 21 I c s a + a 23 I c s c = b 2 3 I 0 c c
a 33 I c s c + a 31 I c s a + a 32 I c s b = b 3 3 I 0 c c
I g r = 3 I 0 c c ( I c s a + I c s b + I c s c )
a i i = ( R e 1 + L c z c + R e 2 ) ;                         i [ 1 , 3 ]
a i j = ( R e 1 + L c z m i , j + R e 2 ) ;                         i j
b i = ( R e 1 + L c z m p , i + R e 2 ) ;                         i [ 1 , 3 ]
After solving the presented set of equations using method of substitution following formulas are obtained:
3 I 0 c s = 3 I 0 c c ( 1 3 R e 1 + L c ( z c z m p , 1 ) L c ( z m 1 , 2 + z z ) + 3 R e 1 + 3 R e 2 )
Earth fault in overhead section is also connected with electrocution hazard, it is, however, smaller than in case of fault along the cable line. Additional attention is paid on HV and EHV line because of high zero sequence currents amplitude resulting from direct earthing of neutral points. Electric shock protection requires additional analysis and is presented in [51].
It is also possible to identify line affected by earth fault in microgrids, what actually is simpler since lengths of lines in such grids are typically smaller. At the same time, one has to remember that microgrid requires additional protection relay—interface protection [52]. Identification and location of 2fg faults requires separate attention and is part of current research [53].

4.1. Cable Lines

Among factors, which could influence angle α is the self-capacitive current of the cable line. In case of uniform cable line (without additional earthing resistances) practically whole capacitive current will flow through the earthing system of 110/15 substation. The capacitive current from healthy phases is then flowing to the grounded phase through MV windings of transformers. For case of simplicity only D winding of 110/15 kV transformer is considered and isolated network is considered. Blue color represents the capacitive current of a cable line, whereas orange color represents capacitive current of overhead line. Idealized earth fault (fault resistance is zero) occur in place EF1 and all capacitive current is flowing to the place of earth fault. If earth fault would occur in cable line marked with red color (location EF2), the capacitive earth fault current of cable line measured at location marked with I0cs would be compensated because blue arrows have opposite direction. At the same time self-capacitive current measured in cable cores would be compensated for the same reason. The current flow is presented in the Figure 7. Unfortunately, with the increase of cable length and increase of earthing system number, factors presented as negligible will play a bigger role and consequently, angle α will be varying. The biggest α and smallest RF110/15 can be observed for the case of earth fault at the end of the cable line. Simulation results consider only this—worst case.
Another factor, which have an impact on RF110/15 and angle α is reverse self-capacitive current, which flows to place of fault from load side and reverses induced current resulting from the flow of capacitive current as is presented in Figure 8. L1 is a length of cable between 110/15 substation and fault location, whereas L2 is the length between fault location and cable end. As can be observed self-capacitive current flows through whole cable length (L1 + L2). On the length, L1 current is compensated since current from 2 ‘healthy’ phases is flowing to the grounded phase. On distance L2 however one can observe only current flowing to supply side, as a result zero-sequence current on distance L2 is greater than 0 and according to induction law, the current induces additional zero sequence current in cable screens. The induced zero-sequence cable screen current has a different phase shift than zero-sequence current resulting from the galvanic connection. As a result, angle α of the resulting zero sequence current is different. Despite described currents, in Figure 7, one can notice additional current marked with light blue, which is a part of self-capacitive current flowing from opposite direction. The current is usually small and negligible, however, in case of high capacitance behind the fault location i.e., long cable or MV substation the current can also influence angle α and RF110/15. The same effect is observed in overhead line and the current is marked with yellow. Red color represents earth fault current component flowing through neutral point. The bigger the component is, the smaller is the effect of reverse capacitive current.
Analysis of the Figure 9 and Figure 10 allows to observe that with the increase of cable length, angle α is rising. When cable length increases, an amplitude of earth fault current returning to the 110/15 station is reduced at the same time a difference between I0cs and I0cc is rising—what results in a rise of a magnetic field, which induces a current in cable screens. Current flowing through cable screens is a combination of current resulting from galvanic connection and induction. With the rise of cable length, an amplitude of MV earthing system current rises and at the same time voltage resulting from current flow through earthing resistance increases. As a consequence, voltage difference between earthing system at load side and supply side increases, what in turn can induce a flow of circulating current.

4.2. Cable—Overhead Lines

In case of earth fault in overhead section of mixed feeder in the ideal case—short cable line grounded with high resistance, angle α is 90°. With an increase in the length of cable, more and more current is flowing through the earthing system instead of screens of ‘healthy’ phases. Earthing system of MV network has resistive character and therefore angle α is changed.
The number of earthing systems and resistance has a big impact on earth fault current flow. In order to assess the impact of the parameters on α and RF110/15, a model presented in Figure 11 is developed. It is assumed that the same cable type is used 3 × 150/25 or 3 × 150/50, which is clearly a simplification since normally cross-section of cable core and screen is reduced since fault current is reduced by increasing length of lines (lines impedance), what naturally limits short circuit power and thermal stress.
Simulation results for faults outside the cable line are presented in Figure 12 and Figure 13. It is assumed that resistance of the earthing system is below 10 Ω—1, 2, 3, 5, 7 or 10 Ω and earth resistivity is 200 Ωm [54]. Surface earth resistivity has an impact on current induced in the earth around the cable line [55].
As is presented in Figure 12 and Figure 13, cable screen cross section has limited impact on results. Increase of cable length leads to an increase of the RF110/15 and decrease of the α. Increase of R earth leads to decrease of the RF110/15 and increase of the α. Presented relations make identification of line type more difficult—the precise measurement of I0cc and I0cs currents is required. At some point, it is practically impossible. The maximum cable length, which allows for proper identification in case of cable lines with just one earthing system at the end is approximately 10 km. One has to however underline that when the length of the cable increases the uncertainty of simulation results also increase therefore results are limited to 5 km long cable to avoid hasty conclusions.
A big number of factors affecting RF110/15 and angle α make the analysis more difficult, however, the presented result confirms that the presented concept can be used in real-life scenarios to distinguish between faults in cable and overhead sections.
There is boundary earth fault condition—fault in a transition point—change of line type. In this case, RF110/15 and α can be strongly affected if earthing resistance is comparable with surface earth resistivity and resulting resistance between cable screens and fault location.
Figure 14 and Figure 15 present impact of earthing system number on RF110/15 and α. Increasing cable length and number of earthing systems makes the identification of line type affected by the fault more and more difficult and at some point, it becomes impossible. 3 core cable, which is almost completely replaced with 1 core cable in most countries could have a different type of cable sheath, but in most cases, the sheath was made of uninsulated Pb alloy. The sheath acts as a multi-point (indefinitely large) grounding system and therefore presented criteria are not operational in these types of lines i.e., AKnFt [56]. It is possible to use the presented criteria in 3 core cables with XLPE insulation, which are installed in Scotch MV networks [57].
Further analysis allows to conclude that the presented method could be adjusted to complex—multi-branch feeders (Figure 16), which are quite common in distribution system network and are included in benchmark models i.e., CIGRE [58]. The idea is based on previously presented relations—change of induced current in the function of line length. If branches are created by cables, which lengths differ significantly or resistances of earthing systems in different branches differ significantly one can observe the significant change of induced currents. As a result, one can reduce time to locate failure since a significant part of the feeder can be excluded from the search area. The proposed methodology is very interesting, but unfortunately not universal. In some feeders, the proposed method could be a very effective tool for earth fault location and identification, whereas in different feeders it is only possible to identify the type of line affected by the fault. It is believed that distribution feeders should be analyzed in the context of the effectiveness of the proposed method. If the method is effective one can resign from the installation of fault current indicators, which are effective, but cumbersome solution.

5. Research in the MV Network

Measurements in MV networks are taken at a new mixed feeder. Cable line connected with 110/15 station is made of 3xNA2XS(F)2.Y 150/25 12/20 kV cable, which is 370 m long. The measurement system is presented in Figure 17. Rogowski coils are installed on cable cores and screens and additional fault recorder is installed at the secondary side of instrument transformers. The role of the additional recorder is to verify measuring errors at the secondary side. In this particular case, brand new current transformers with low ratio 75:5 allowed to get the acceptable measuring error—amplitude error below 5% and phase error in range 10–15°.
The tests were based on applying an artificial connection between the working conductor and the cable screens with the help of a controlled circuit breaker. During the tests, the number of cable screens connected to the earth earthing system was changed and no effect on the natural current flowing in healthy phases was noticed. Overvoltages in grounded return screens were also measured during the tests to determine the risk to cable screens, but the subject is analyzed in separate project.
Table 2 presents the results of the network tests. After test number 2b one of the lines was switched and as a result earth fault current is changed significantly since tests were carried out in compensated network with tap regulated coil in neutral point. As can be observed simulation results and measurement results were similar with an error below 5%. Figure 18 presents cable screen and core waveforms for case number 1, after operation of the active current forcing system, presented in Table 2, as can be observed currents flow evenly in all phases, but one can observe additional distortions in cable, through which an earthing current is flowing.
High harmonics content could have a negative influence on the operation of protection relays and therefore the signal is typically filtered to remove unwanted components of the signal—in case of the proposed solution only fundamental component is left [59].

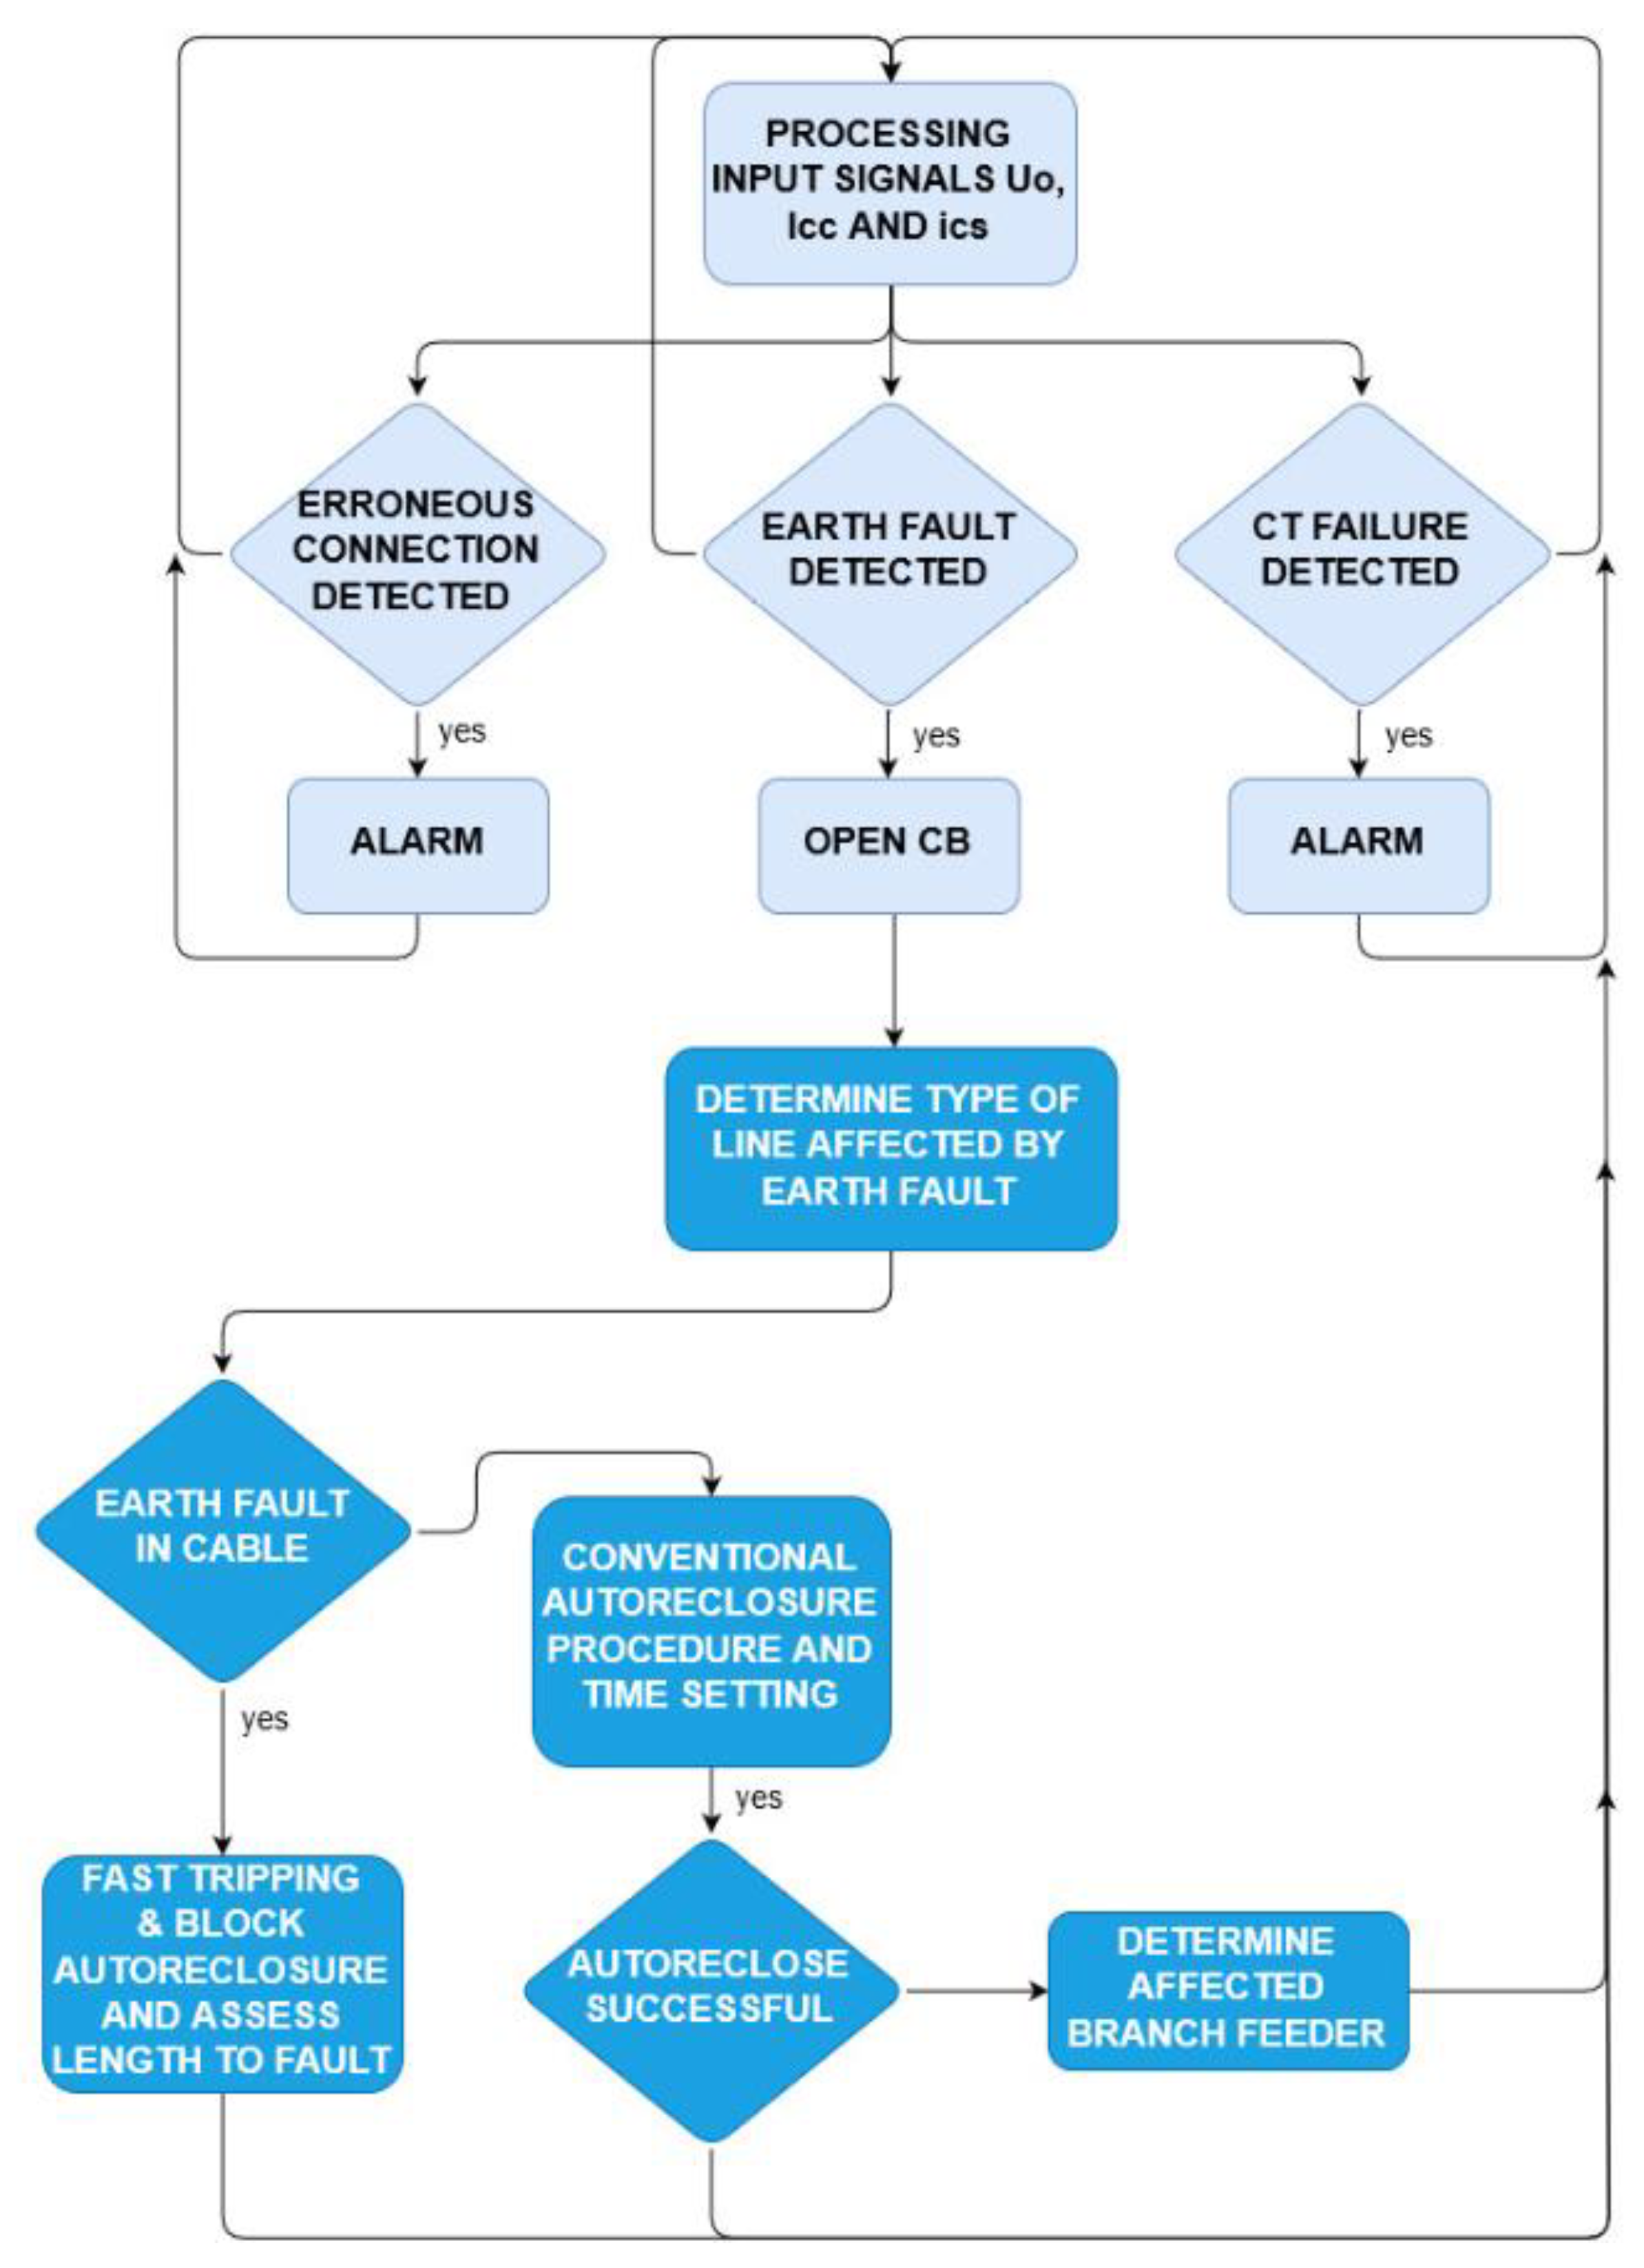
6. Developed Algorithms

Presented results can be expressed as the RF110/15 in a function of α, which allows for simpler identification of line type affected by the fault. Figure 19 presents results presented in Figure 9, Figure 10, Figure 12 and Figure 13 expressed in RF110/15/α plane for different grounding resistances 1, 2, 3, 5, 7 and 10 Ω and length of cable lines in range of 1 to 5 km. Shades of gray represent faults at the end of the cable line and shades of blue represent faults in overhead lines. Dashed lines determine 2 zones—fault in cable line is marked in section defined by dotted black lines and earth faults in overhead section of the protected feeder are marked with blue, dotted lines. As can be seen zones are slightly shifted from simulation results, what is needed to cope with simulation errors and modeling inaccuracies. Precise value of correction factors is not known—typically in case of protection relays correction factors are set based on operational experience [60].
Presented considerations allowed for the development of an algorithm for earth fault location and identification of the faulted line. The big advantage od line recognition is the possibility to block auto-reclose devices in case of failures along the cable, which are permanent. Moreover, 2 time settings—fast for earth faults along the cable line and slow for fault in overhead line sections can be used to ensure compromise between the reliability of supply and insulation stresses. The algorithm presented in Figure 20 analyzes angle α and RF110/15 and use conventional comparators to determine if measurands are inside the protection zones. If measured values are within area 1 a fault in the cable is recognized, in the range 2—fault in overhead section. Analysis of Figure 8, Figure 9, Figure 13 and Figure 14 allows to notice that in case of short cable lines—< 3 km, it is possible to analyze only RF110/15 in order to determine if fault occurred in a cable line or outside – in overhead section. One can conclude practical conclusion—in case of short cable lines it is not necessary to replace conventional CT with Rogowski coil in order to use the presented criterion. As is presented in previous author’s paper, in case of low current flowing through primary side conventional CT can introduce big measuring error – even 20%. In order to avoid negative impact, i.e., unwanted tripping, of the error on protection algorithm CT loading block is introduced (I_load > Imin_load). If loading of primary side CT is below threshold, algorithm makes the decision about tripping based solely on Y0cs, which is modified admittance protection criterion, obtained according to formula:
Y 0 c s = I 0 c s U 0
where U 0 is zero sequence voltage.
Preliminary research confirmed that similar characteristics are obtained for cable lines in depths of the network—not connected with 110/15 kV station. Topic is currently analyzed and is a part of future research.
After protected feeder is de energized, the fault location general algorithm presented in Figure 21 is started. The general procedure is based on utilization of simulation software or mathematical model. Detailed description of cable line model can be found in PhD thesis [61]. Due to the model complexity, the algorithm requires relatively big amount of time to identify branch affected by earth fault or determine distance to earth fault. As a result, it is not possible, assuming reasonable cost of protection relay, to use the algorithm in real time.
The fault location procedure is started after measured signals: U0, I0cc, I0cs and information about present system configuration are send to the system. After obtaining information about the system configuration the simulation model is updated. Moreover, it is possible to adjust earthing resistances if weather, particularly rain information is provided. Afterwards faults in key locations are simulated—in case of an earth fault in one of overhead sections fault at the beginning of overhead lines are simulated, whereas if an earth fault is identified in cable sections—fault is simulated in the places of cable line branching. Simulation results are compared with measurement results. Differences between simulation results and measured values are calculated. The fault location characterized via the smallest difference is chosen as faulted branch. After faulted cable branch is identified, simulations are resumed, however this time, simulated fault locations are changed and the fault is simulated along faulted cable branch. Simulation results are again compared with measurement results and place characterized by the smallest difference is indicated as fault location. In some cases, similar electric parameters of branches, it is not possible to identify just 1 fault location since simulation results could be very similar i.e., just 5% difference between results. In case of small differences between simulation results, a list of results is send to grid operator. Finally, operator obtain simulation results—if one branch is affected information to repair team is send immediately, however in case of more potential fault locations are indicated, the grid operator need to coordinate repair action. It is also possible to use statistical data or operator experience to choose branch, which is more likely to be short-circuited. Both, simulation and measurement results are saved in the system database in order to observe effectiveness of the proposed solution.
In order to understand performance of the developed algorithm, a performance comparison is given in Table 3.
Comparison of different earth fault location solutions clearly shows that in case of single point grounded cable lines, developed solution is preferred solution. Furthermore, developed solution has big performance in case of short lines since installation of additional fault current indicators is not justified from economical point of view. Furthermore, the proposed solution is the preferred choice in case of lines with branches. At the same time one has to notice that the proposed solution operates properly if length of cable lines creating different branches differ significantly—at least 1 km for the same grounding resistance or grounding resistance differ significantly i.e., 2 and 5 ohms. Therefore, if the proposed solution is not working one can use fault current indicators. As is presented in table distance relay performance for earth fault location is small, but one has to notice that distance protection can locate phase to phase faults with relatively high precision. Fault current indicators are preferred solutions for overhead lines.

7. Summary

At the beginning of the paper, review of materials about earth fault location in distribution system network is presented. Furthermore, comparison of chosen earth fault location methods—fault current indicators, distance protection and proposed solution is made. New criterion values are presented—phase shift between zero sequence current and cable screen earthing current and ratio of cable screen earthing current and zero sequence current—return factor (RF110/15). Different earthing screen current sources are presented and analyzed in order to ensure proper, sensitive operation of earth fault protection and at the same time eliminate a risk of unwanted tripping of earth fault protection. Simplified mathematical model describing earth fault current flow in cable lines is presented, what allows to understand the principle of operation. Further, different feeder configurations and factors affecting performance of the developed solutions are presented. Graphs showing criterion quantities are described. After simulation result, the developed algorithms for earth fault identification and location are presented. Additionally, SWOT analysis results and performance analysis of the proposed solution and conventional fault location methods is presented below.
Strengths:
  • no communication required;
  • cost effective single point measuring;
  • the developed algorithm can detect earth faults in case of zero sequence voltage or current transformer failure;
  • operate properly in case of neutral point impedance/transformer failure.
Weakness:
  • simplified analytical expression is not sufficient for different cases and therefore it is recommended to use simulation software for analysis of real cable line. Proposed approach may be problematic in some countries;
  • proposed solution is not universal and, in some cases, (presented in Table 3), the effectiveness could be reduced.
Opportunities:
  • further features can be integrated i.e., monitoring of cable screen connections or monitoring of stray currents;
  • improvement of reliability of supply in place where conventional technologies are not justified from economical point of view i.e., suburban areas.
Threats:
  • training for utility employees is needed;
  • it is not always clear what is the lowest value of earthing resistance of complex earthing system and therefore further research activities may be needed.

8. Conclusions

The contribution of the paper is connected with identification of new value, which is used as a criterion for earth fault detection and location. The proposed value—phase shift between zero sequence current and cable screen earthing current is combined with previously presented ratio of cable screen earthing current and zero sequence current. It is proposed to present values on x-y plane, where the angle is on x axis and the ratio, referred as return factor (RF110/15) is on y axis. Proposed representation of criterion values greatly simplifies analysis. The proposed criterion is based on single point measurement and allows for clear identification of line type affected by earth fault. Proposed solution has unique feature, which allow to identify branch of line affected by an earth fault. Principle of operation of the proposed solutions is presented and the different screen earthing current sources are analyzed in order to ensure sensitive earth fault protection and eliminate a risk of unwanted tripping of earth fault protection.
Presented solutions can be applied in distribution system networks and reduce downtime after earth faults. Downtime reduction is really important for power system reliability, which among power distribution loss reduction are 2 main driving forces of power system research [62].
In some cases, just RF110/15 is enough to identify the type of line affected by an earth fault, but in case of longer cable lines (≥ 2.5 km), one has to measure angle α between I0cc and I0cs. Results of conducted network tests and experience indicate that residual connection current transformer is often characterized by big measuring errors (angle) and therefore it is recommended to use Rogowski coils for measurements.
The proposed solution is characterized by very good operational performance and practically 100% effectiveness in case of an earth faults of many MV lines. It is however not universal. First and foremost a distribution feeder should be analyzed in the context of proper operation of the proposed method. Conducted tests confirm that models included in simulation software work properly, however, it has to be underlined that tests were carried out in short cable line 370 m and further tests are planned. It is also planned to develop a criterion for 2fg fault detection and an expert system, which utilize cable screen earthing current measurement to maximize effectiveness of measuring system.
The proposed algorithm can be combined with distance protection and location algorithms for phase to phase fault location, what allows to combine advantages of both solutions.

Author Contributions

Conceptualization, K.L.; methodology, K.L, J.L.; software, K.L.; validation, K.L., J.L., J.Z.; formal analysis, G.D.; investigation, K.L.; resources, J.Z., J.L., G.D., K.L.; data curation, K.L.; writing—original draft preparation, K.L.; writing—review and editing, K.L., J.L., J.Z.; visualization, K.L.; supervision, J.L., J.Z.; project administration, K.L.; All authors have read and agreed to the published version of the manuscript.

Funding

The research was financed from resources of the Ministry of Science and Higher Education for Statutory Activities No. 0711/SBAD/4410, name of the task: Improvement of Reliability of Supply in Distribution Network.

Conflicts of Interest

The authors declare no conflict of interest.

References

  1. Schütze, A.; Helwig, N.; Schneider, T. Sensors 4.0—Smart sensors and measurement technology enable Industry 4.0. J. Sensors Sens. Syst. 2018, 7, 359–371. [Google Scholar] [CrossRef]
  2. Kim, B.-S.; Kim, K.-I.; Shah, B.; Chow, F.; Kim, K.H. Wireless Sensor Networks for Big Data Systems. Sensors 2019, 19, 1565. [Google Scholar] [CrossRef] [PubMed] [Green Version]
  3. Bouguera, T.; Diouris, J.-F.; Chaillout, J.-J.; Jaouadi, R.; Andrieux, G. Energy Consumption Model for Sensor Nodes Based on LoRa and LoRaWAN. Sensors 2018, 18, 2104. [Google Scholar] [CrossRef] [PubMed] [Green Version]
  4. Lowczowski, K.; Nadolny, Z.; Olejnik, B. Analysis of Cable Screen Currents for Diagnostics Purposes. Energies 2019, 12, 1348. [Google Scholar] [CrossRef] [Green Version]
  5. Lowczowski, K.; Lorenc, J.; Andruszkiewicz, J.; Nadolny, Z.; Zawodniak, J. Novel Earth Fault Protection Algorithm Based on MV Cable Screen Zero Sequence Current Filter. Energies 2019, 12, 3190. [Google Scholar] [CrossRef] [Green Version]
  6. Mauseth, F.; Hammervoll, K.D.; Hvidsten, S. Dielectric properties of service aged medium voltage XLPE cable joints. In Proceedings of the 2010 10th IEEE International Conference on Solid Dielectrics, Potsdam, Germany, 4–9 July 2010; Institute of Electrical and Electronics Engineers (IEEE): New York, NY, USA, 2010; pp. 1–4. [Google Scholar]
  7. Frimpong, E.A.; Okyere, P.Y. A Review of Adaptive Autoreclosure Techniques. Indian J.Comput. Sci. Eng. 2010, 1, 222–228. [Google Scholar]
  8. IntelliRupter PulseCloser Fault Interrupter. Available online: https://www.sandc.com/en/products--services/products/intellirupter-pulsecloser-fault-interrupter (accessed on 10 January 2020).
  9. European Commission. Integration of Variable Distributed Resources in Distribution Networks; Seventh Framework Programme; THEME ENERGY: Bilbao, Spain, 2012. [Google Scholar]
  10. CIRED WG03. Fault Management in Electrical Distribution Systems; VTT Technical Research Centre of Finland: Espoo, Finland, 1999. [Google Scholar]
  11. Seo, H.-C. New Adaptive Reclosing Technique in Unbalanced Distribution System. Energies 2017, 10, 1004. [Google Scholar] [CrossRef] [Green Version]
  12. Platero, C.; Serrano, J.; Lopez-Toledo, M.; Granizo, R. Influence of High-Speed Train Power Consumption and Arc Fault Resistances on a Novel Ground Fault Location Method for 2× 25 kV Railway Power Supply Systems Influence of High-Speed Train Power Consumption and Arc Fault Resistances on a Novel Ground Fault. Energies 2018, 11, 1601. [Google Scholar] [CrossRef] [Green Version]
  13. Hoppel, W.; Sieluk, W.; Czarnecki, D. Zabezpieczenie podimpedancyjne w terminalach polowych CZIP-PRO dla linii sredniego napięcia. Wiadomosci Elektrotechniczne 2019, 87, 31–36. [Google Scholar] [CrossRef]
  14. Tutvedt, K.A.; Seguin, R.; Kjolle, G.; Simonsen, S.; Hermansen, T.S.; Myhr, I. Smart fault handling in medium-voltagedistribution grids. In Proceedings of the 24th International Conference & Exhibition on Electricity Distribution, Glasgow, Scotland, 12–15 June 2017. [Google Scholar]
  15. Wurm, M. Earth Fault Distance Localization in Inductive Earthed Networks by means of Distance Protection. In Proceedings of the 21st International Conference on Electricity Distribution, Frankfurt, Germany, 6–9 June 2011. [Google Scholar]
  16. Siemens, Applications for 2005 SIPROTEC Protection Relays; Siemens Aktiengesellschaft: Nuernberg, Germany, 2005.
  17. ABB. Distance Protection REF 542plus—Application and Setting Guide; ABB: Vaasa, Finland, 2008. [Google Scholar]
  18. Tshobeni, S. Short Feeder Distance Protection and its Application Limits. In Proceedings of the 19th International Conference on Electricity Distribution, Vienna, Austria, 21–24 May 2007. [Google Scholar]
  19. Tsimtsios, A.M.; Nikolaidis, V.C. Application of distance protection in mixed overhead-underground distribution feeders with distributed generation. J. Eng. 2018, 2018, 950–955. [Google Scholar] [CrossRef]
  20. Jensen, C.; Nanayakkara, O.; Rajapakse, A.; Gudmundsdottir, U.; Bak, C. Online fault location on AC cables in underground transmission systems using sheath currents. Electr. Power Syst. Res. 2014, 115, 74–79. [Google Scholar] [CrossRef]
  21. Bernadić, A.; Leonowicz, Z. Fault location in power networks with mixed feeders using the complex space-phasor and Hilbert–Huang transform. Int. J. Electr. Power Energy Syst. 2012, 42, 208–219. [Google Scholar] [CrossRef] [Green Version]
  22. Rajalakshmi, B.; Kalaivani, L.B.R. Analysis of Partial Discharge in underground cable joints. In Proceedings of the 2015 International Conference on Innovations in Information, Embedded and Communication Systems (ICIIECS), Coimbatore, India, 19–20 March 2015; Institute of Electrical and Electronics Engineers (IEEE): New York, NY, USA, 2015; pp. 1–5. [Google Scholar]
  23. Le, T.D.; Petit, M. An Optimisation algorithm for Earth fault location. In Proceedings of the 24th International Conference on Electricity Distribution, Glasgow, Scotland, 12–15 June 2017. [Google Scholar]
  24. Linčiks, J.; Baranovskis, D. Single Phase Earth Fault Location in the Medium Voltage Distribution Networks. Sci. J. Riga Tech. Univ. Power Electr. Eng. 2009, 25, 13–18. [Google Scholar] [CrossRef] [Green Version]
  25. Farughian, A.; Kumpulainen, L.; Kauhaniemi, K. Earth Fault Location Using Negative Sequence Currents. Energies 2019, 12, 3759. [Google Scholar] [CrossRef] [Green Version]
  26. Carlsson, F.; Etherden, N.; Johansson, A.; Wall, D.; Fogelberg, A.; Lidström, E. Advanced fault location in compensated distribution networks. CIRED Workshop 2016, 114. [Google Scholar] [CrossRef] [Green Version]
  27. Olejnik, B. Skutecznosc Sygnalizatorow Przeplywu Pradu Zwarciowego Podczas Wysokooporowych Zwarc Doziemnych W Sieci Sredniego Napiecia; Poznan University of Technology Publishing House: Poznan, Poland, 2020. [Google Scholar]
  28. Sunil, D.V.; Yadaiah, N. An expert system for fault location in distribution feeder line. In Proceedings of the 2017 International Conference on Energy, Communication, Data Analytics and Soft Computing (ICECDS), Chennai, India, 1–2 August 2017; Institute of Electrical and Electronics Engineers (IEEE): New York, NY, USA, 2017; pp. 2465–2469. [Google Scholar]
  29. Almeida, B.; Louro, M.; Queiroz, M.; Neves, A.; Nunes, H. Improving smart SCADA data analysis with alternative data sources. CIRED-Open Access Proc. J. 2017, 2017, 1223–1226. [Google Scholar] [CrossRef] [Green Version]
  30. Vieira, F.; Santos, P.H.M.; Filho, J.M.C.; Leborgne, R.C.; Leite, M.P. A Voltage-Based Approach for Series High Impedance Fault Detection and Location in Distribution Systems Using Smart Meters. Energies 2019, 12, 3022. [Google Scholar] [CrossRef] [Green Version]
  31. Arrabe, R.G.; Platero, C.A.; Gomez, F.A.; Rebollo, E. Novel Auto-Reclosing Blocking Method for Combined Overhead-Cable Lines in Power Networks. Energies 2016, 9, 964. [Google Scholar] [CrossRef] [Green Version]
  32. Dashti, R.; Salehizadeh, S.M.; Shaker, H.R.; Tahavori, M. Fault Location in Double Circuit Medium Power Distribution Networks Using an Impedance-Based Method. Appl. Sci. 2018, 8, 1034. [Google Scholar] [CrossRef] [Green Version]
  33. Rahim, M.N.A.; Mokhlis, H.; Abu Bakar, A.H.; Jamian, J.J.; Sukumar, S. Progress on Protection Strategies to Mitigate the Impact of Renewable Distributed Generation on Distribution Systems. Energies 2017, 10, 1864. [Google Scholar]
  34. Joint Working Group IEEE Power and Energy Society. Fault Current Contributions from Wind Plants; Joint Working Group IEEE Power and Energy Society: College Station, TX, USA, 2015; pp. 137–227. [Google Scholar]
  35. Tang, W.-J.; Yang, H.-T. Data Mining and Neural Networks Based Self-Adaptive Protection Strategies for Distribution Systems with DGs and FCLs. Energies 2018, 11, 426. [Google Scholar] [CrossRef] [Green Version]
  36. Kilickiran, H.C.; Akdemir, H.; Sengor, I.; Kekezoglu, B.; Paterakis, N.G. A Non-Standard Characteristic Based Protection Scheme for Distribution Networks. Energies 2018, 11, 1241. [Google Scholar] [CrossRef] [Green Version]
  37. Ates, Y.; Boynuegri, A.R.; Uzunoglu, M.; Nadar, A.; Yumurtacı, R.; Erdinç, O.; Paterakis, N.G.; Catalão, J.P. Adaptive Protection Scheme for a Distribution System Considering Grid-Connected and Islanded Modes of Operation. Energies 2016, 9, 378. [Google Scholar] [CrossRef]
  38. Chul, S.H. Novel Protection Scheme considering Tie Switch Operation in an Open-Loop Distribution System using Wavelet Transform. Energies 2019, 12, 1725. [Google Scholar]
  39. PSCAD 4.6.2 Automation API Documentation 2019. Available online: https://hvdc.ca/knowledge-base/read,article/459/pscad-4-6-2-automation-api-documentation/v (accessed on 10 January 2020).
  40. IEEE Std 575TM 2014 Guide for Bonding Shields and Sheaths of Single-Conductor Power Cables Rated 5 kV through 500 kV. Insul. Cond. IEEE Power Energy Soc. 2014, 1–83.
  41. Milovac, P.; Javora, R.; Skendzic, V. Sensor technology in a medium-voltage switchgear for the US market applications. CIRED-Open Access Proc. J. 2017, 2017, 432–435. [Google Scholar] [CrossRef] [Green Version]
  42. Mikronika. Urzadzenia dla Energetyki. Zabezpieczenia firmy Mikronika serii SO-54SR-xxx do zastosowan 2018, 5, 36–39. [Google Scholar]
  43. Bernadic, A.; Anane, Z. Neutral Point Connections in MV Power Networks with Grounding Zigzag Transformers—Analysis And Simulations. J. Energy 2019, 68, 42–48. [Google Scholar]
  44. Megger. Getting Down to Earth A Practical Guide to Earth Resistance Testing; MeterCenter: Chandler, AZ, USA, 2015. [Google Scholar]
  45. Zawodniak, J.; Wielkopolski, S.O. Podstawowe bledy popelniane podczas projektowania i wykonywania uziemien. Autom. Elektr. ZAKLOCENIA 2017, 8, 92–97. [Google Scholar] [CrossRef]
  46. Andruszkiewicz, J.; Lorenc, J.; Łowczowski, K.; Weychan, A.; Zawodniak, J. Energy losses’ reduction in metallic screens of MV cable power lines and busbar bridges composed of single-core cables. Ekspolatacja i Niezawodn.-Maint. Reliab. 2019, 22, 15–25. [Google Scholar] [CrossRef]
  47. Todorovski, M.; Ackovski, R. Equivalent Circuit of Single-Core Cable Lines Suitable for Grounding Systems Analysis Under Line-to-Ground Faults. IEEE Trans. Power Deliv. 2013, 29, 751–759. [Google Scholar] [CrossRef]
  48. Liang, Z.; Zhu, G. Analysis of Earth Currents in a Medium-Voltage Distribution Network with Three-Core Cables. In Proceedings of the IEEE Innovative Smart Grid Technologies—Asia, Bangkok, Thailand, 3–6 November 2015. [Google Scholar]
  49. Benato, R.; Sessa, S.D.; Guglielmi, F.; Partal, E.; Tleis, N. Ground Return Current Behaviour in High Voltage Alternating Current Insulated Cables. Energies 2014, 7, 8116–8131. [Google Scholar] [CrossRef] [Green Version]
  50. Viel, E.; Griffiths, H. Fault current distribution in HV cable systems. IEE Proc.-Gener. Transm. Distrib. 2000, 147, 231. [Google Scholar] [CrossRef]
  51. Mangione, S. A Simple Method for Evaluating Ground-Fault Current Transfer at the Transition Station of a Combined Overhead-Cable Line. IEEE Trans. Power Deliv. 2008, 23, 1413–1418. [Google Scholar] [CrossRef]
  52. Jing, L.; Son, D.-H.; Kang, S.-H.; Nam, S.-R. A Novel Protection Method for Single Line-to-Ground Faults in Ungrounded Low-Inertia Microgrids. Energies 2016, 9, 459. [Google Scholar] [CrossRef] [Green Version]
  53. Khakimzyanov, E.; Mustafin, R.; Platonov, P. Method of fault location for double line-to-earth faults in distribution networks. Eng. Sci. Technol. Int. J. 2016, 19, 1668–1671. [Google Scholar] [CrossRef] [Green Version]
  54. Strzalka, J.T.; Wojsznis, T. Zasady wykonywania pomiarow uziemien i oceny wynikow pomiarow. Biul. SEP 2003, 20, 1–15. [Google Scholar]
  55. Popovic, L.M. Comparative analysis of grounding systems formed by MV cable lines with either uninsulated or insulated metal sheath(s). Electr. Power Syst. Res. 2011, 81, 393–399. [Google Scholar] [CrossRef]
  56. Tele-Fonika Kable S.A. Kable i przewody elektroenergetyczne; Tele-Fonika Kable S.A: Cracow, Poland, 2019; pp. 276–310. [Google Scholar]
  57. ScottishPower, ScottishPower Distribution Cables & Equipment. Metal Theft. Available online: https://www.spenergynetworks.co.uk/userfiles/file/ScottishPower_cables_equipment_metal_theft.pdf (accessed on 26 February 2016).
  58. Strunz, K.; Abbasi, E.; Abbey, C.; Andrieu, C.; Gao, F.; Gaunt, T. Benchmark Systems for Network Integration of Renewable and Distributed Energy Resources. Cigre Task Force C 2014, 6, 78. [Google Scholar]
  59. Wannous, K.; Toman, P. Evaluation of Harmonics Impact on Digital Relays. Energies 2018, 11, 893. [Google Scholar] [CrossRef] [Green Version]
  60. Lorenc, J. Admitancyjne Zabezpieczenia Ziemnozwarciowe; Wydawnictwo Politechniki Poznanskiej: Poznan, Poland, 2007. [Google Scholar]
  61. Mugala, G. High Frequency Characteristics of Medium Voltage XLPE Power Cables. KTH Electr. Eng. 2005, 17, 93. [Google Scholar]
  62. Jajczyk, J.; Kasprzyk, L. The Use of Coupled Temperature and Electromagnetic Fields in Optimization Problems. In Proceedings of the 6th IASME/WSEAS International Conference on Heat Transfer, Thermal Engineering and Environment, Rhodes, Greece, 20–22 August 2008. [Google Scholar]
Figure 1. Schematic diagram of the developed system (the elements described in this study are marked in blue, and the elements in blue [5].
Energies 13 01293 g001
Figure 2. Characteristics of distance protection.
Energies 13 01293 g002
Figure 3. Measuring system; NP—neutral point of ZNyn transformer, BB—MV busbars, Re1—resistance of 110/15 earthing system; Re2—resistance of MV earthing system.
Energies 13 01293 g003
Figure 4. Cable screen current flow.
Energies 13 01293 g004
Figure 5. Earthing current sources.
Energies 13 01293 g005
Figure 6. Coupling impedances in case of earth fault in cable, based on [50].
Energies 13 01293 g006
Figure 7. Capacitive component of earth fault current flow in mixed feeder; cable line marked with red; overhead line marked with yellow; another power lines marked with green; Te—grounding transformer; Ts—secondary winding of 110/15.
Energies 13 01293 g007
Figure 8. The idea of reverse self-current (capacitive) and reverse self-induced (capacitive) current.
Energies 13 01293 g008
Figure 9. RF110/15 for faults between cable core and screen at the end of the cable line in a trefoil configuration.
Energies 13 01293 g009
Figure 10. α for faults between cable core and screen at the end of cable line in a trefoil configuration.
Energies 13 01293 g010
Figure 11. A model for testing the impact of the number and earthing systems of a cable line on the earth fault current distribution.
Energies 13 01293 g011
Figure 12. α for faults in overhead section of mixed feeder (cable in a trefoil configuration).
Energies 13 01293 g012
Figure 13. RF110/15 for faults in overhead section of mixed feeder (cable in a trefoil configuration).
Energies 13 01293 g013
Figure 14. Impact of earthing system number on angle α.
Energies 13 01293 g014
Figure 15. Impact of earthing system number on RF110/15.
Energies 13 01293 g015
Figure 16. Analysis of branches affected by ground faults.
Energies 13 01293 g016
Figure 17. Diagram of the measuring system.
Energies 13 01293 g017
Figure 18. Fault between cable screen and core (nr 1 in Table 2) of 2 points bonded cable.
Energies 13 01293 g018
Figure 19. RF110/15/α characteristic.
Energies 13 01293 g019
Figure 20. An algorithm for fault detection and identification of line type affected by earth fault.
Energies 13 01293 g020
Figure 21. General fault location algorithm.
Energies 13 01293 g021
Table 1. Comparison of earth fault location methods in MV grids.
MethodsFault Current IndicatorDistance ProtectionProposed Solution
Detection of 1fg faultsYesYesYes
Detection of 2fg and phase to phase faultsYesYesYes 1
Fault location identificationThe section between 2 indicators 2The estimated location of phase to phase faults 3Estimated location to faults in cable lines and identification of line type affected by faults 4
Identification of branches affected by faultsYes, if additional current indicators are installed and integrated with the fault management system 5In exceptional cases 6Yes, if there are significant differences in electric parameters between lines 4
The complexity of measuring systemVery big – many measuring systemsBig – complex algorithm and hardware 7Average – utilization of additional current sensors for I0cs measurement
AdvantagesPossibility to install indicators in convenient placesGood operational performance in case of phase to phase faultsGives the possibility to use 2 different time settings
Operational issuesDifficult installation and maintenance actions in different places. Communication is required 8Difficult – expensive protection relay tester is required 9Average difficulty 10
Proper operation in case of neutral point failureNoNoYes
Auto reclose blockingPossible 11In exceptional cases 12Possible
1 According to preliminary investigation it is possible to detect 2 phase to ground faults using cable screen earthing current. Due to complexity, the topic is excluded from the paper content. 2. The effectiveness of fault current indicators strongly depends on number of indicators used. Theoretically fault current indicators could be installed at every support structure of the overhead line. At the same time one has to notice that cost would increase greatly. 3 The estimated location in case of an earth fault in distribution network is 1/3 of the protected feeder. 4 Detailed description in the following sections of the paper. 5 From technical point of view earth fault current indicators can be adopted to any complex feeder. One has to underline that performance (unwanted trips or missing trips) of simple fault current indicators has often been questioned. 6 In exceptional cases it is possible—if points on RF110/15 = f(α) differ significantly, it is possible to indicate branch affected by fault (the principle is presented in paragraph 4). 7 In case of conventional distance relays one can observe complex, sophisticated algorithms, which require fast hardware for real time control of 6 fault impedance loops. 8 Communication failure can compromise the system. 9 Verification of distance protection performance require a tester with 4 current and 4 voltage outputs. Additional training for utility employees responsible for testing is required. 10 Detailed description and analysis is difficult what is presented in the paper. At the same time however one can notice that interpretation of method, development of model is relatively simple. It is believed that a few hours training would be sufficient to educate a new utility employee. 11 If earth fault indicator is installed at the end of the cable lines. 12 In exceptional cases—long overhead line and short cable line.
Table 2. Results of network tests.
Lp.Measurements in MVConnection with GroundSimulation ResultsSimulation Errors
I0żrI0żpαrRF110/15ABCI0żpαsRF110/15RF110/15α
144.02542.7061.7597.011143.3840.0398.51.59−1.91
2a44.06641.8121.6294.910143.1250.1497.93.12−1.64
2b42.6740.2082.794.210141.7590.1497.93.89−2.84
3a34.86533.3471.9895.600133.4010.2995.80.21−1.88
3b33.39131.2781.4493.700131.9920.2995.82.25−1.28
4a33.40231.0183.3592.901131.1680.0493.30.44−3.68
4b31.81429.6312.7993.101131.1680.0498.05.23−3.06
531.6010.67786.92.141110.89181.842.831.75−5.62
αr—angle measured on the primary side.
Table 3. Performance of the RF/α, fault current indicators and distance relay for earth faults in MV networks.
Case 1 (Figure 1, 5, 10 km)Location of Earth Fault in Cable LineLocation of Earth Fault in Overhead LineIdentification of Line Type Affected by Fault and Auto-Reclose Blocking for Earth Faults in Cable LineIdentification of Branch
Case 1 (Figure 6) cable 1 km overhead section 1 km
DistanceNo No nona
Fault indicatorNo 1Yes, but because of operation issues is not installedYes 2na
Developed criteriaYes No Yesna
Case 1 (Figure 6) cable 5 km overhead section 5 km
DistanceNo No limitedna
Fault indicatorNo 1 yesYes 2na
Developed criteriaYes No Yesna
Case 2 (Figure 7) cable 1 km overhead section 1 km and 10 km cable line
DistanceNo No No na
Fault indicatorNo Yes, but because of operation issues is not installedyesna
Developed criteriaRequire special attention in compensated networksNo Yesna
Case 2 (Figure 7) cable 5 km overhead section 5 km and 10 km cable line
DistanceNo No No na
Fault indicatorNo Yes, but because of operation issues is not installedyesna
Developed criteriaRequire special attention in compensated networksNo Yesna
Case 2 (Figure 10) cable 1 km overhead section 1 km
DistanceNo No No na
Fault indicatorSegment between Re1 and Re2 or segment between Re2 and Re3 dYes, but because of operation issues is not installedyesna
Developed criteriayesNo Yesna
Case 2 (Figure 10) cable 1 km overhead section 10 km
DistanceNo No No na
Fault indicatorSegment between Re1 and Re2 or segment between Re2 and Re3Yes, but because of operation issues is not installedyesna
Developed criteriaPerformance depend on number of earthing points and earthing resistance. No Yesna
Case 2 (Figure 15) cable 1 km and 3 km, overhead section 10 km
DistanceNo No No No
Fault indicatorSegment between Re1 and Re2 or segment between Re2 and Re3YesyesYes, if earth fault indicator is installed
Developed criteriaPerformance depend on number of earthing points and earthing resistance.—If points on RF110/15 = f(α) differ significantly (Figure 18).No YesYes, for faults in overhead lines
1. Can be installed only in places where cable screen is removed. 2. Earth fault current indicator installed at transition point (Re2).

