Article

Dynamic Tensile Strength of Dry and Saturated Hard Coal under Impact Loading

School of Mechanics and Civil Engineering, China University of Mining and Technology (Beijing), Beijing 100083, China
*
Author to whom correspondence should be addressed.
Energies 2020, 13(5), 1273; https://doi.org/10.3390/en13051273
Submission received: 14 December 2019 / Revised: 21 February 2020 / Accepted: 2 March 2020 / Published: 10 March 2020
(This article belongs to the Special Issue Risk and Integrity Management of Energy Assets)

Abstract

:
To evaluate the influence of water content on the hard coal dynamic behavior, the dynamic tensile properties of saturated coal Brazilian disk (BD) samples were studied using a split Hopkinson pressure bar system, and dry samples were also tested as a control group. In the range of impact speeds studied, the tensile strength of the saturated coal is lower than that of the dry specimen. A synchronized triggering high-speed camera was used to monitor the deformation and failure process of dry and saturated coal samples, allowing analysis of the failure stages and mechanism of dynamic BD test, the broken mode was classified into three types, which can be classified into unilateral tensile failure, bilateral or multilateral tensile failure, and shear failure. Finally, fragments smaller than 5 mm in diameter were statistically analyzed. There is less debris in range of 0–5.0 mm for the saturated coal sample than for the dry coal. This study provides some information about the dynamic response of the hard coal for the relevant practical engineering.

1. Introduction

With increased intensity of deep mining, disasters such as rock burst, coal and gas outbursts have become more frequent, seriously affecting the safety of coal production [1,2,3]. Coal mine safety is required for efficient coal production, and the prevention and control of rock and coal outbursts is an important component of overall mine safety. Coal seam water injection has been demonstrated to be an effective method to actively prevent coal burst and other dynamic disasters of coal mass. The water injection technique changes the fracture structure of the coal mass and weakens the brittleness of the coal seam. Application of this approach relieves the energy stored in coal over a large range, widens the plastic deformation zone in front of the coal wall, and shifts the stress concentration zone into the deep coal mass. This change weakens the stress concentration, mitigates the accumulation of coal body pressure potential, and significantly improves the spatial uniformity of the energy release process. Thus, the occurrence frequency or the intensity of coal outburst is weakened. The mechanical properties, failure modes, and the distribution characteristics of the coal debris after crushing are directly related to the potential for failure and the design of the working face and the coal roadway. Therefore, mechanical testing of coal samples under different moisture content conditions can provide important guidance for the rational design of coal pillars and roadway support.
There has been extensive research on the properties of coal with different water content. Gu [4] found that the dynamic properties of coal samples are obviously affected by the water absorption time, considering three stages of the process with different water–coal interaction mechanisms of each stage. Perera [5] compared the strength and deformation characteristics of saturated and dry coal samples. Pan [6] carried out loading and unloading tests on coal specimens in five typical water content states and analyzed the relationship between water content and coal elastic modulus. Yao [7] assumed that the strength distribution of coal micro-elements satisfies the Weibull distribution, and derived the statistical damage constitutive model of coal considering the influence of water content.
As the tensile strength is much smaller than the compressive strength, there is a focus on the measurement of tensile strength. To assess the tensile strength test of geomaterials, direct and indirect stretching methods can be used. As the direct method has high costs and is complicated to perform, an indirect method is more typically used to test the tensile strength of geomaterials, such as the Brazilian disc (BD) splitting method. Dai [8] extended the BD splitting method to the Hopkinson dynamic test and verified the reliability of the test. The Hopkinson pressure bar system has been used to conduct many dynamic tensile strength tests on rock materials, including natural geomaterials like granite [9], marble [10], sandstone [11], mudstone [12], and shale [13], and artificial materials such as concrete [14] and ceramics [15]. However, there have been few reports on the dynamic tensile strength of coal samples. Shan [16] proposed a new test method to measure the fracture toughness of coal samples. Using a new type of loading equipment, specimens with V-shaped cuts were used to test the dynamic fracture toughness of anthracite. Coal samples prepared under both dry and saturated conditions were studied by Zhao [17], and he found that saturated coal samples have higher dynamic tensile strength compared to the strengths of the dry ones, and the impact velocity has a greater influence on the tensile strength of the coal sample than the bedding angle.
In this study, the dynamic BD test was used to study the dynamic tensile mechanical and failure characteristics of hard coal. First, the effect of impact velocities on dynamic tensile strength of coal samples was analyzed. Second, using a synchronized triggering high-speed camera, images of the dynamic failure process were captured, allowing analysis of the process of the hard coal sample failure. Finally, the distribution characteristics of debris after coal sample crushing were compared and analyzed.

2. Sample Preparation and Test Process

2.1. Coal Sample Production

The hard coal material used in this test was obtained from a coal mine in Hebei, China. The sample is gray, compact, and lacks obvious joints. The water content is 0.5%, the volatile matter is 1.5%, the ash is 35.6%, and the fixed carbon is 62.4%. To maintain the original state of the coal sample as much as possible, the sample was wrapped with plastic wrap, manually transported to the ground, transferred to a wooden box, and transported to the laboratory. Large coal blocks were processed into cylindrical coal samples for quasi-static and dynamic tests. According to the standard [18], cylindrical coal samples 100 mm in height and 50 mm in diameter were prepared for quasi-static compression tests, and coal samples 25 mm thick and 50 mm in diameter were prepared for quasi-static and dynamic tensile tests. The two faces of the specimen were polished, and should be flat to 0.25 mm, and the total number of specimens used for dynamic testing was 30. After processing, half of the samples were placed in a thermotank and incubated at 105 °C for 48 h, and the other specimens were put into a concrete vacuum machine. The vacuum degree was 0.1 MPa and a vacuum time of 3 h was required to drain the air inside the rock. After vacuum saturation, samples were set in a natural saturated condition for 72 h. Figure 1 shows the processed coal samples, and Figure 2 displays the concrete vacuum machine.
The quasi-static mechanical properties of coal samples were tested using an MTS hydraulic servo-control testing system, the loading method adopted displacement control, and the loading rate of the uniaxial compression and BDtests were 0.06 and 0.35 mm/min, respectively. The uniaxial compressive strength (UCS) of the dry coal samples was 46.64 MPa, the tensile strength was 5.75 MPa, and the UCS and tensile strength of the coal samples in the saturated condition were 30.23 and 3.82 MPa, respectively. Figure 3 shows the uniaxial compression testing results.

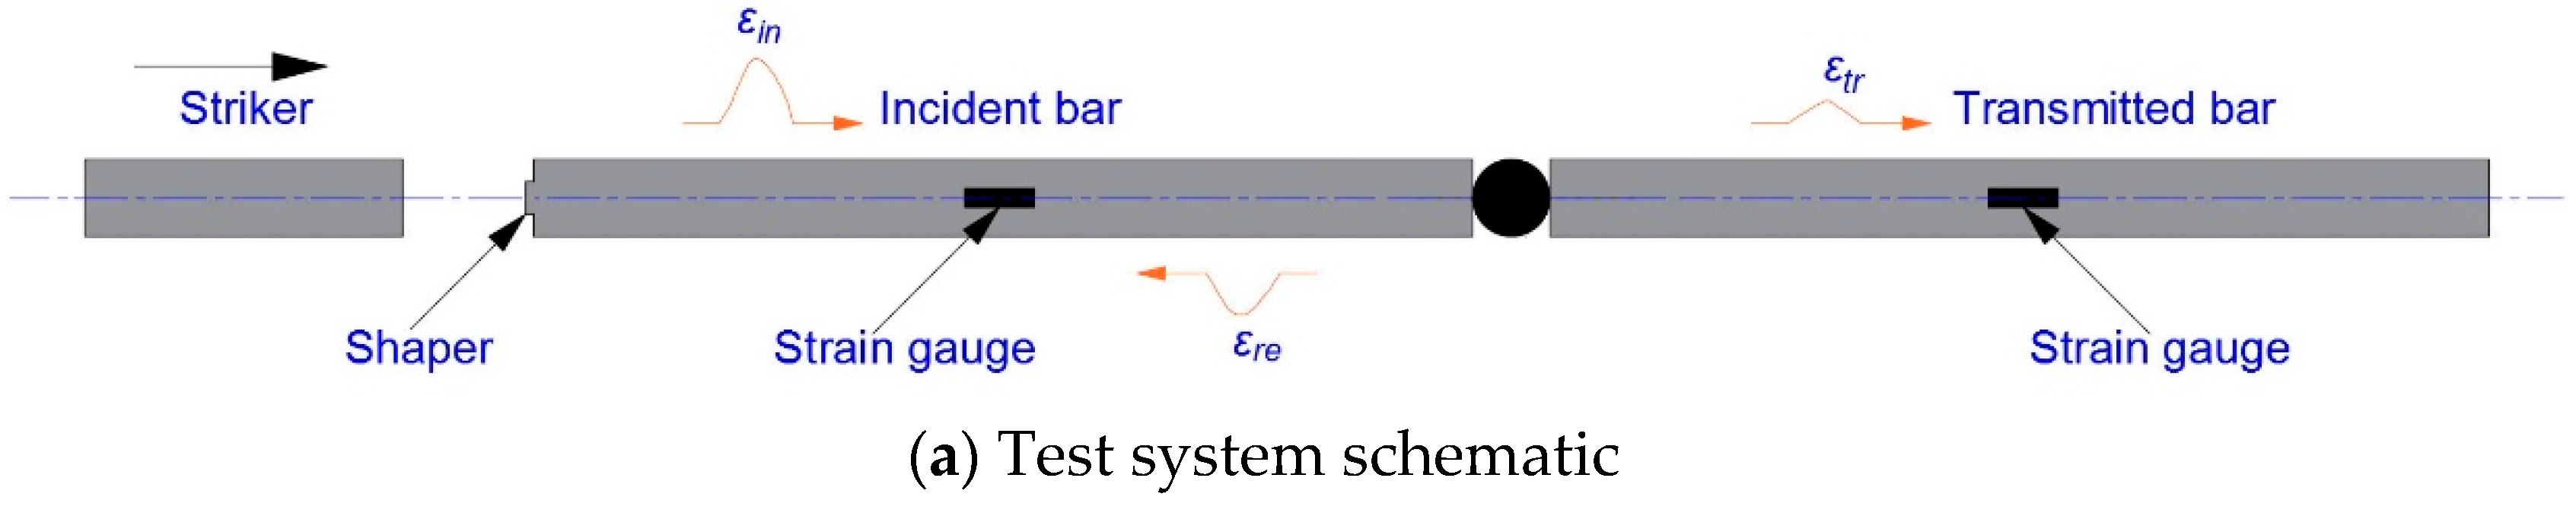
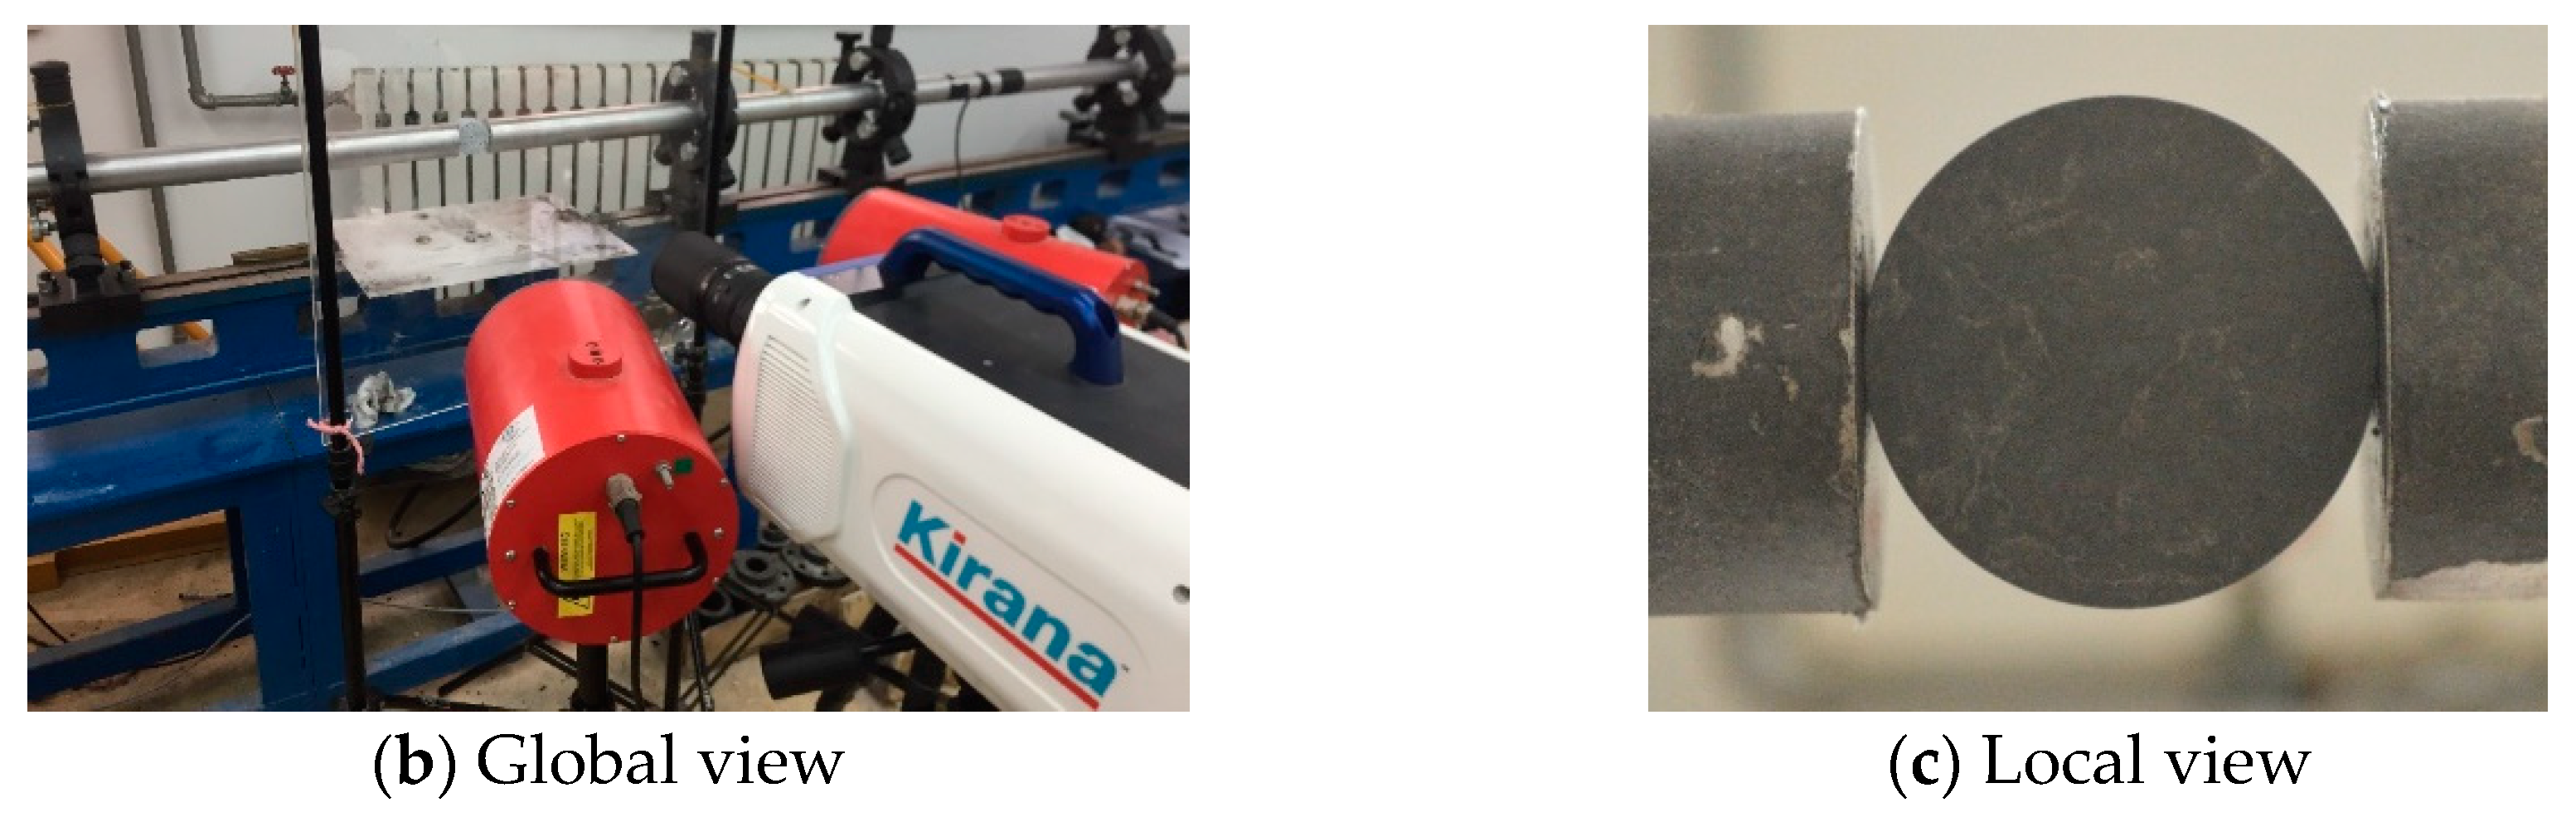
2.2. Test Equipment and Principle

The dynamic test was completed at the High-Speed Impact Laboratory, China University of Mining and Technology (Beijing). The impact, the incident, and the transmission cylindrical bars used in this experiment were all made from 60Si2Mn alloy steel. The bullet length was 300 mm, the lengths of the incident and transmission bars were 2000 and 1800 mm, respectively. The bar diameter was φ = 50 mm. Two strain gauges were symmetrically attached to the bar to acquire signals, and data acquisition was performed using a DC-97A dynamic acquisition instrument, which exhibits high precision and good stability. A Wheatstone bridge was used to convert the resistance signal into a voltage signal. The speed was monitored using a laser measurement device with high sensitivity and a wide measuring range of 0.6–50 m/s. Figure 4 presents a schematic diagram of the experimental apparatus.
A high-speed camera system with synchronous triggering was used to record the specimen rupture process. The trigger signal was provided by a strain gauge attached to the incident bar. A Kirana-5M high-speed camera was used with a μCMOS sensor to realize high-speed acquisition without reducing image resolution. The image resolution was fixed at 924 × 768 pixels, 180 photos were obtained for each test, and the fastest shooting speed was 5 × 10⁶ frames per second (fps).

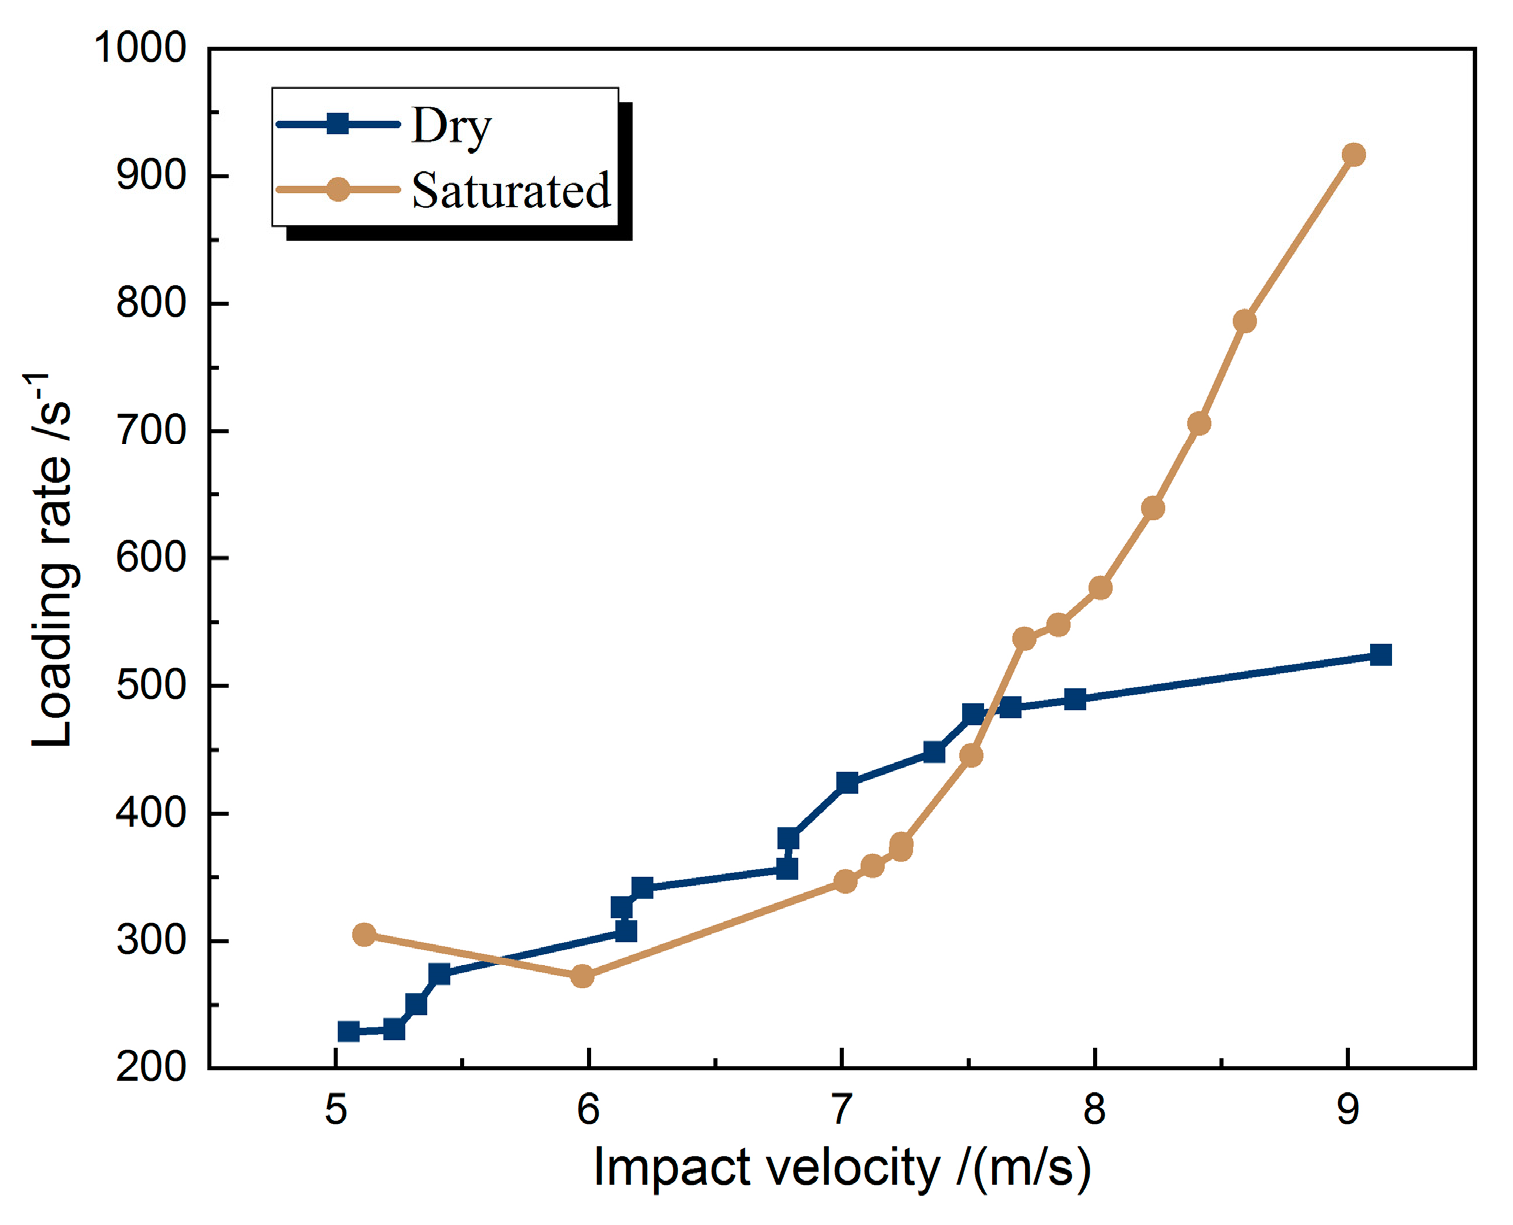
2.3. Experimental Process and Data Processing

Due to the simplicity, convenience, and economy of the BD test, BD samples were prepared and used to determinate the dynamic tensile mechanical properties. In the test, a BD specimen was radially sandwiched between the input and the output bars. When the bullet strikes the input bar, there is excitation of a forward-propagating incident pulse εin. When the pulse reaches the interface of the incident bar and specimen, part of the pulse εre is reflected due to wave impedance mismatch, and part of the pulse εtr continuously goes forward into the transmitted bar, which is obtained from a strain gauge glued on the transmitted bar. According to Frew [19,20], the rubber disc acts as a shaper to eliminate high frequency oscillation and extend the rise time of the incident wave. When the stress at both ends is approximately equal, it can be assumed that a state of stress equilibrium is achieved during the loading process, as shown in Figure 5. Figure 6 illustrates a typical dynamic tensile loading history curve. The slope of a nearly linear increase region was defined as the loading rate. For all tests in this study, the loading rate was determined using this method. The loading rate is one of the significant characteristics for describing the dynamic tensile strength [21], and will be analyzed in the following sections.
After the internal stress of the specimen reaches equilibrium, the dynamic loading process of the BD specimen is equivalent to “quasi-static” compression, so the quasi-static tensile strength formula can be extended to the dynamic splitting tensile test. The forces P1(t) and P2(t) at both ends of the test sample can be calculated according to Equation (1) [22], and then we can utilize Equation (2) to calculate the tensile stress σt(t) of the coal.
{ P 1 ( t ) = E b A b [ ε i n ( t ) + ε r e ( t ) ] P 2 ( t ) = E b A b ε tr ( t )
σ t ( t ) = 2 P ( t ) π D B = 2 E b A b π B D ε t r ( t )
where Ab and Eb are the cross-sectional area and elastic modulus of the split Hopkinson pressure bar (SHPB), respectively. D and B are the diameter and thickness of the Brazilian disk, respectively. P(t) is the average of the front and rear ends of the sample. When the sample breaks under impact loading, the transmitted wave signal reaches the peak value. The peak stress σt(t)max is the dynamic tensile strength of the coal.
The main focus of this study was to determine the dynamic strength of coal samples under different impact loads. The velocities of the bullets were changed as the result of increasing or decreasing the barrel pressure. The range of impact velocity was approximately controlled at 5–9 m/s.

3. Experimental Results and Analysis

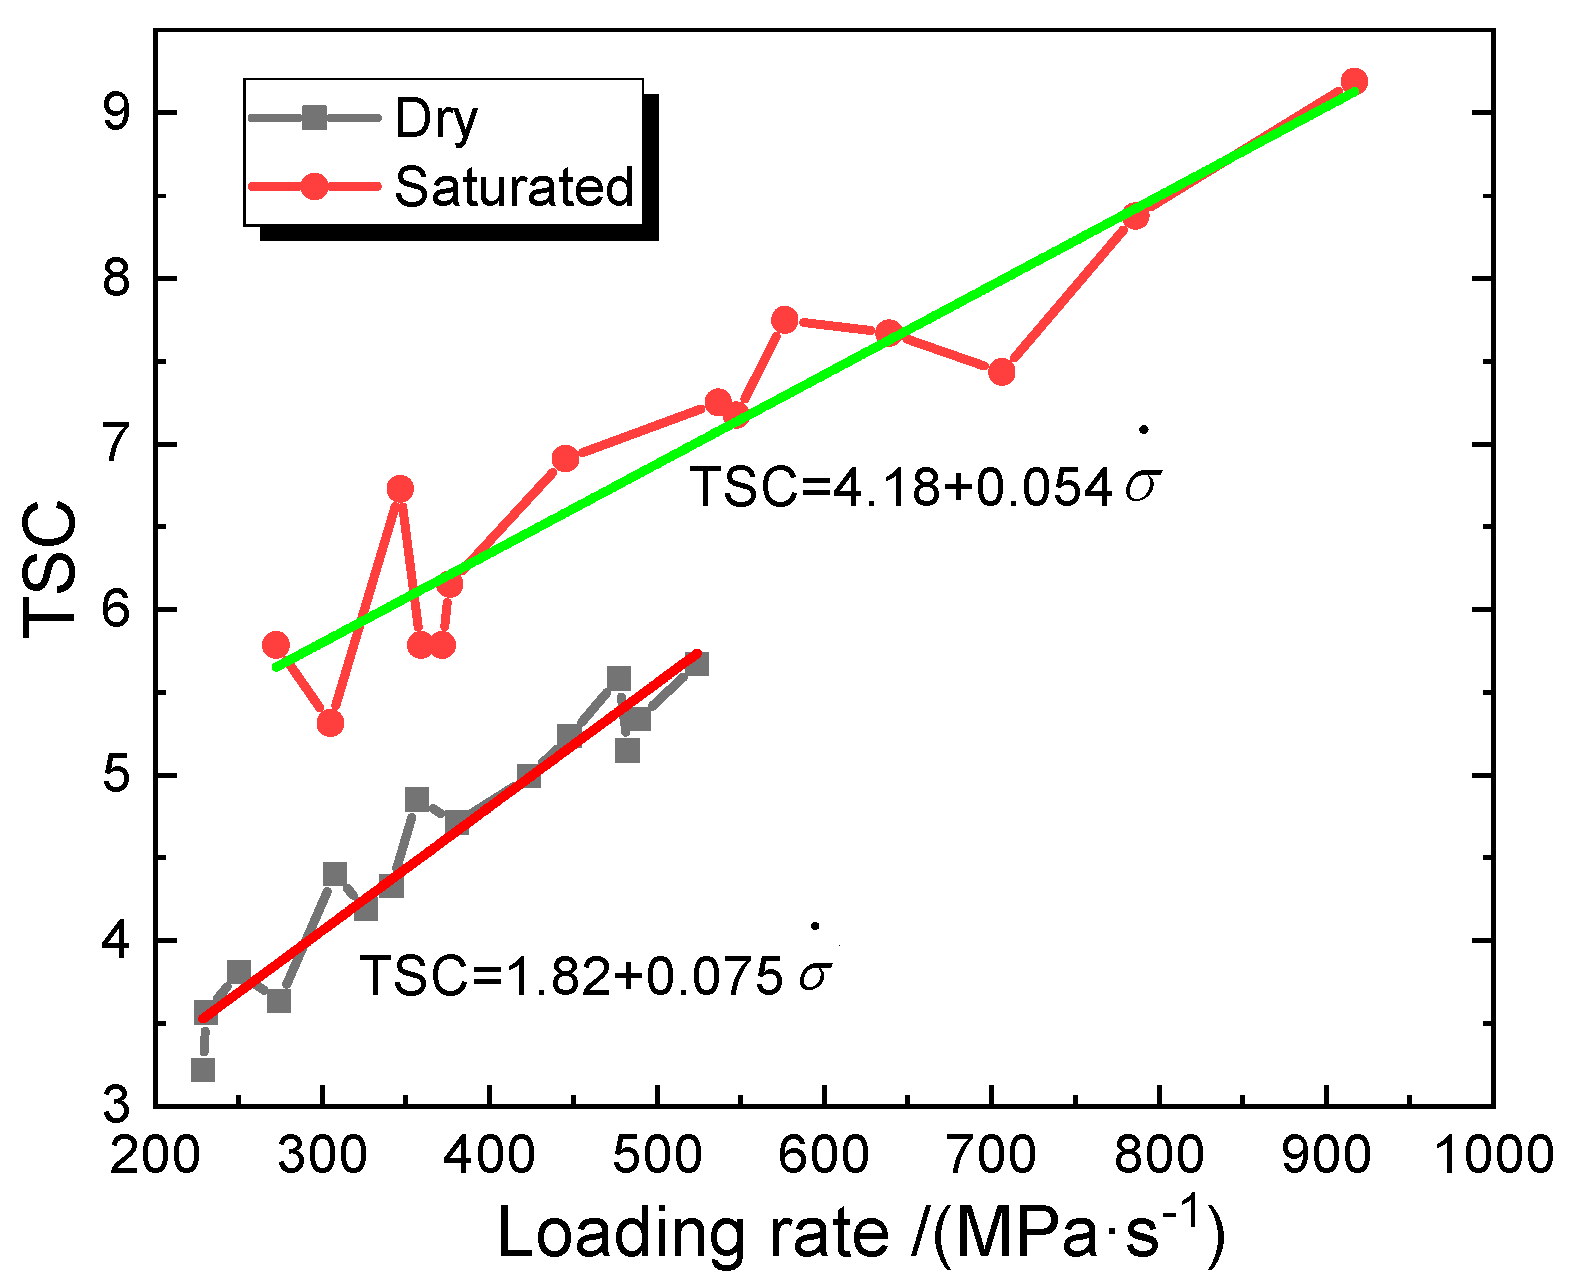
3.1. Effect of Loading Rate on Dynamic Tensile Strength

The stress history curves of the samples at different impacts were obtained using the method as described in Section 2. Figure 7 and Figure 8 show the stress history curves of the dry and saturated specimens, respectively. As shown in Figure 7, the dynamic tensile strength of the dry coal sample increased with increased loading rate. The duration of the sample failure process remains nearly the same, and showed no direct correlation with impact velocity. According to the data presented in Figure 8, the dynamic tensile strength of the saturated coal sample displays an apparent rate dependency, and the duration of time from initial loading to the peak value for saturated and dry samples are obviously different. For dry specimen, the duration is around 120 μs. For saturated specimen, under low impact velocity, the duration time is as long as 146 μs. With increased striker velocity, the damage time of the specimen is short. This may be due to the generation of pore water pressure inside the coal sample, which is not dissipated under the impact load. The presence of the pore water pressure accelerates the destruction of the coal sample [11,23].
Based on the method mentioned in Section 2.3, the mechanical parameters of the rock dynamic tensile tests are extracted, and listed in Table A1. Due to the good integrity of the coal sample selected for this study, the dynamic tensile strength and loading rate of both the dry and saturated coal sample exhibited an obvious loading rate effect, which is consistent with the studies on rock [24,25], as shown in Figure 9. The linear relationships for the dry and saturated states can be expressed as: σ t = 10.5 + 0.043 σ · and σ t = 16.0 + 0.021 σ · , respectively. The saturated coal sample test results are more discrete, and the dynamic strength and the loading rate exhibit a better linear correlation in the dry state. It can be seen that the dynamic tensile strength of the dry coal sample was significantly higher than that of the saturated coal sample, indicating that the presence of water has a softening effect on the strength of the coal, which is caused by weakening of cementation. From the data presented in Figure 10, we can see little difference in the loading rates of dry and saturated samples under low-speed impact. With increasing impact velocity, the loading rate of dry specimens increased slowly and linearly. The loading rate of saturated specimens increased rapidly and shows an exponential trend.
The tensile sensitivity coefficient (TSC) is used to describe the dynamic loading effect on the tensile strength, which is defined as the ratio of the dynamic tensile strength to the quasi-static ones. The value of TSC under dry and saturated states is illustrated in Figure 11.
It can be seen that the TSC increases with loading rate under both dry and saturated conditions, and the TSC growth rate of dry samples is gently larger than the saturated one. Under same loading rate, it is obviously shown that the TSC of saturated coal is larger that of the dry samples, which means that the saturated sample is more sensitive to the loading rate.

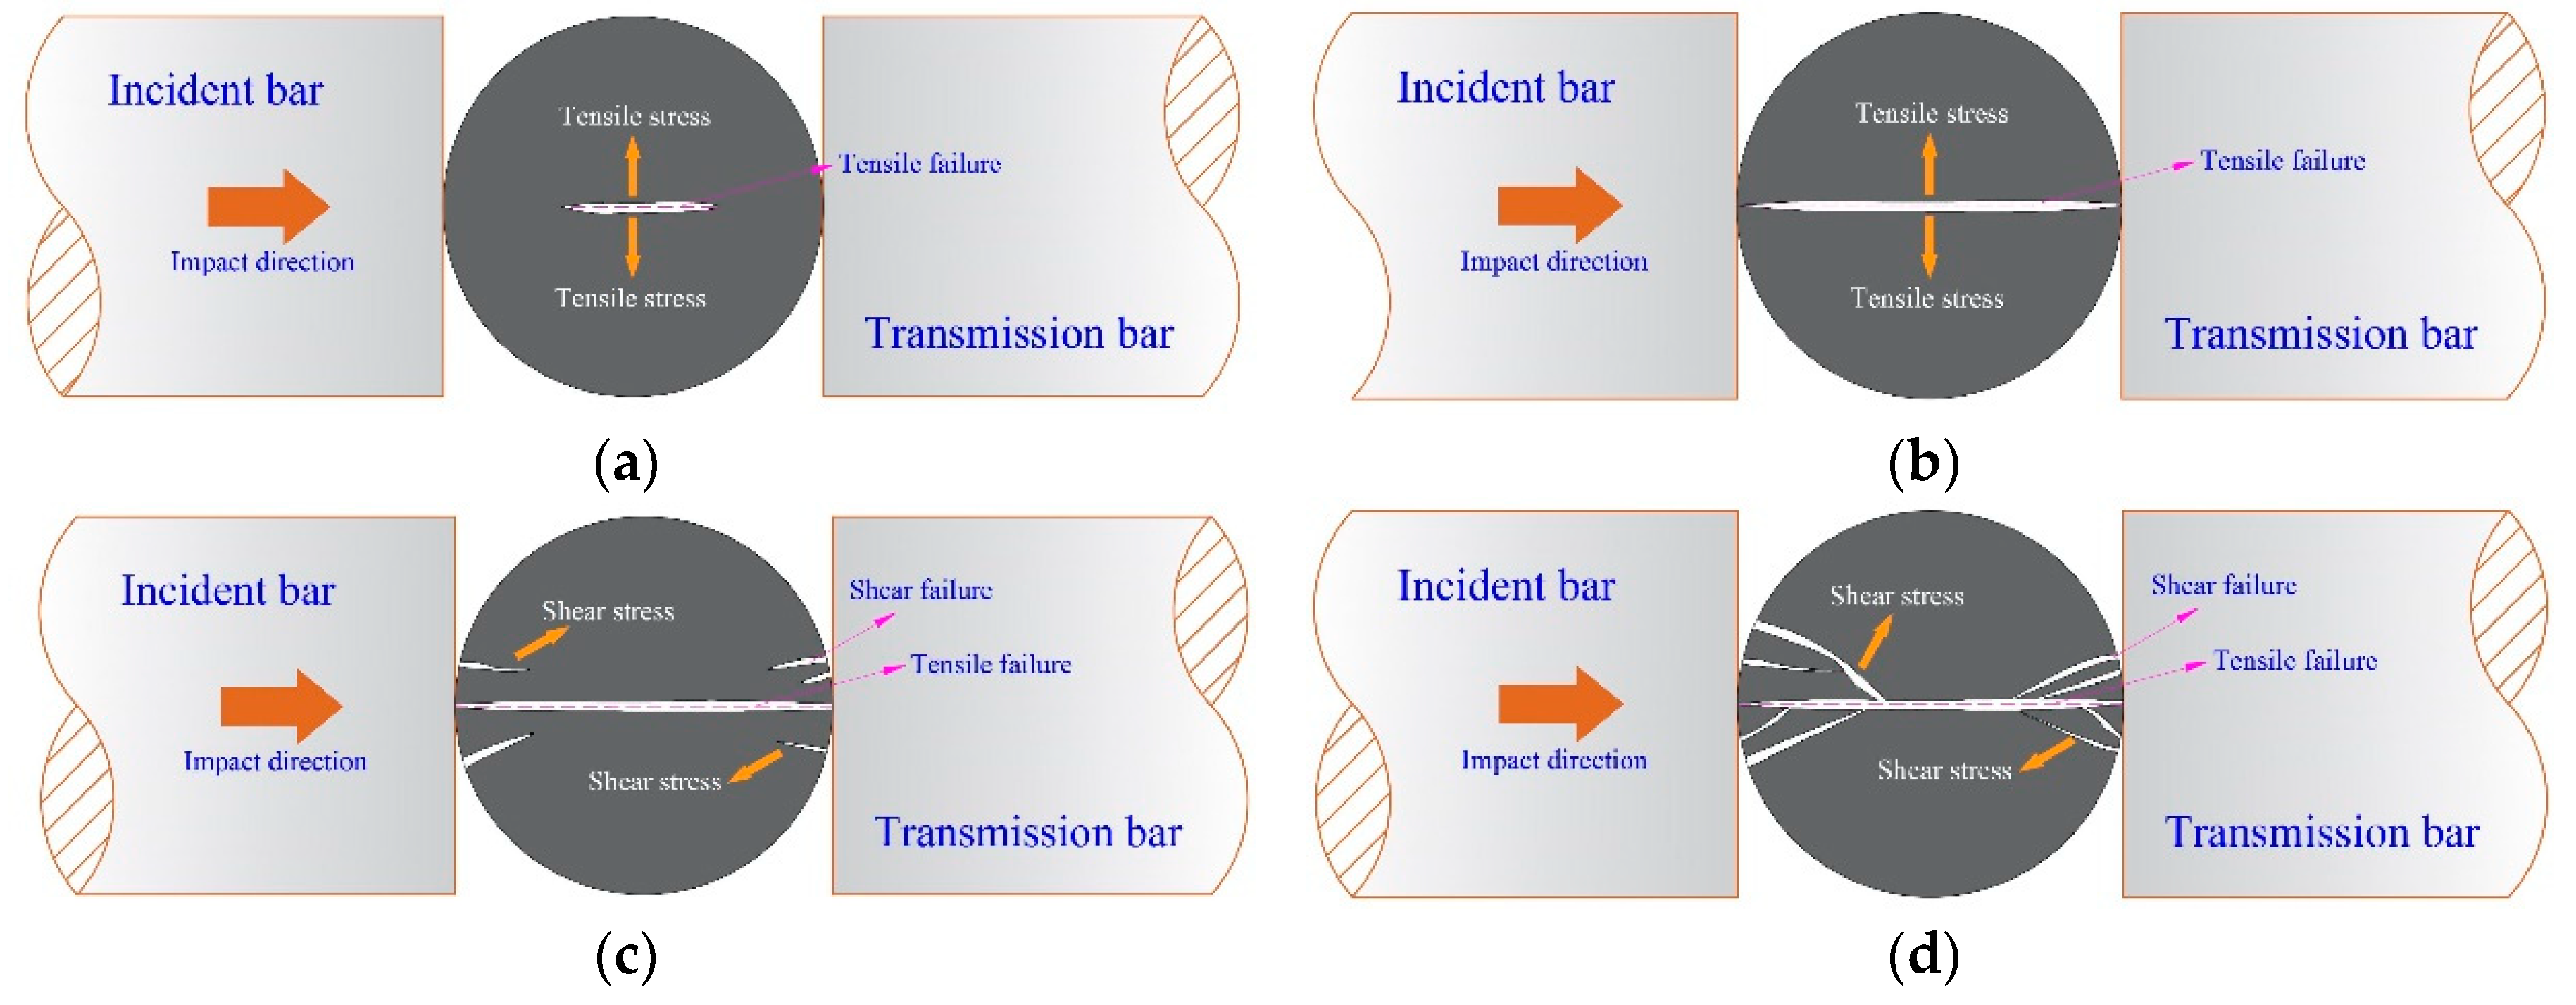
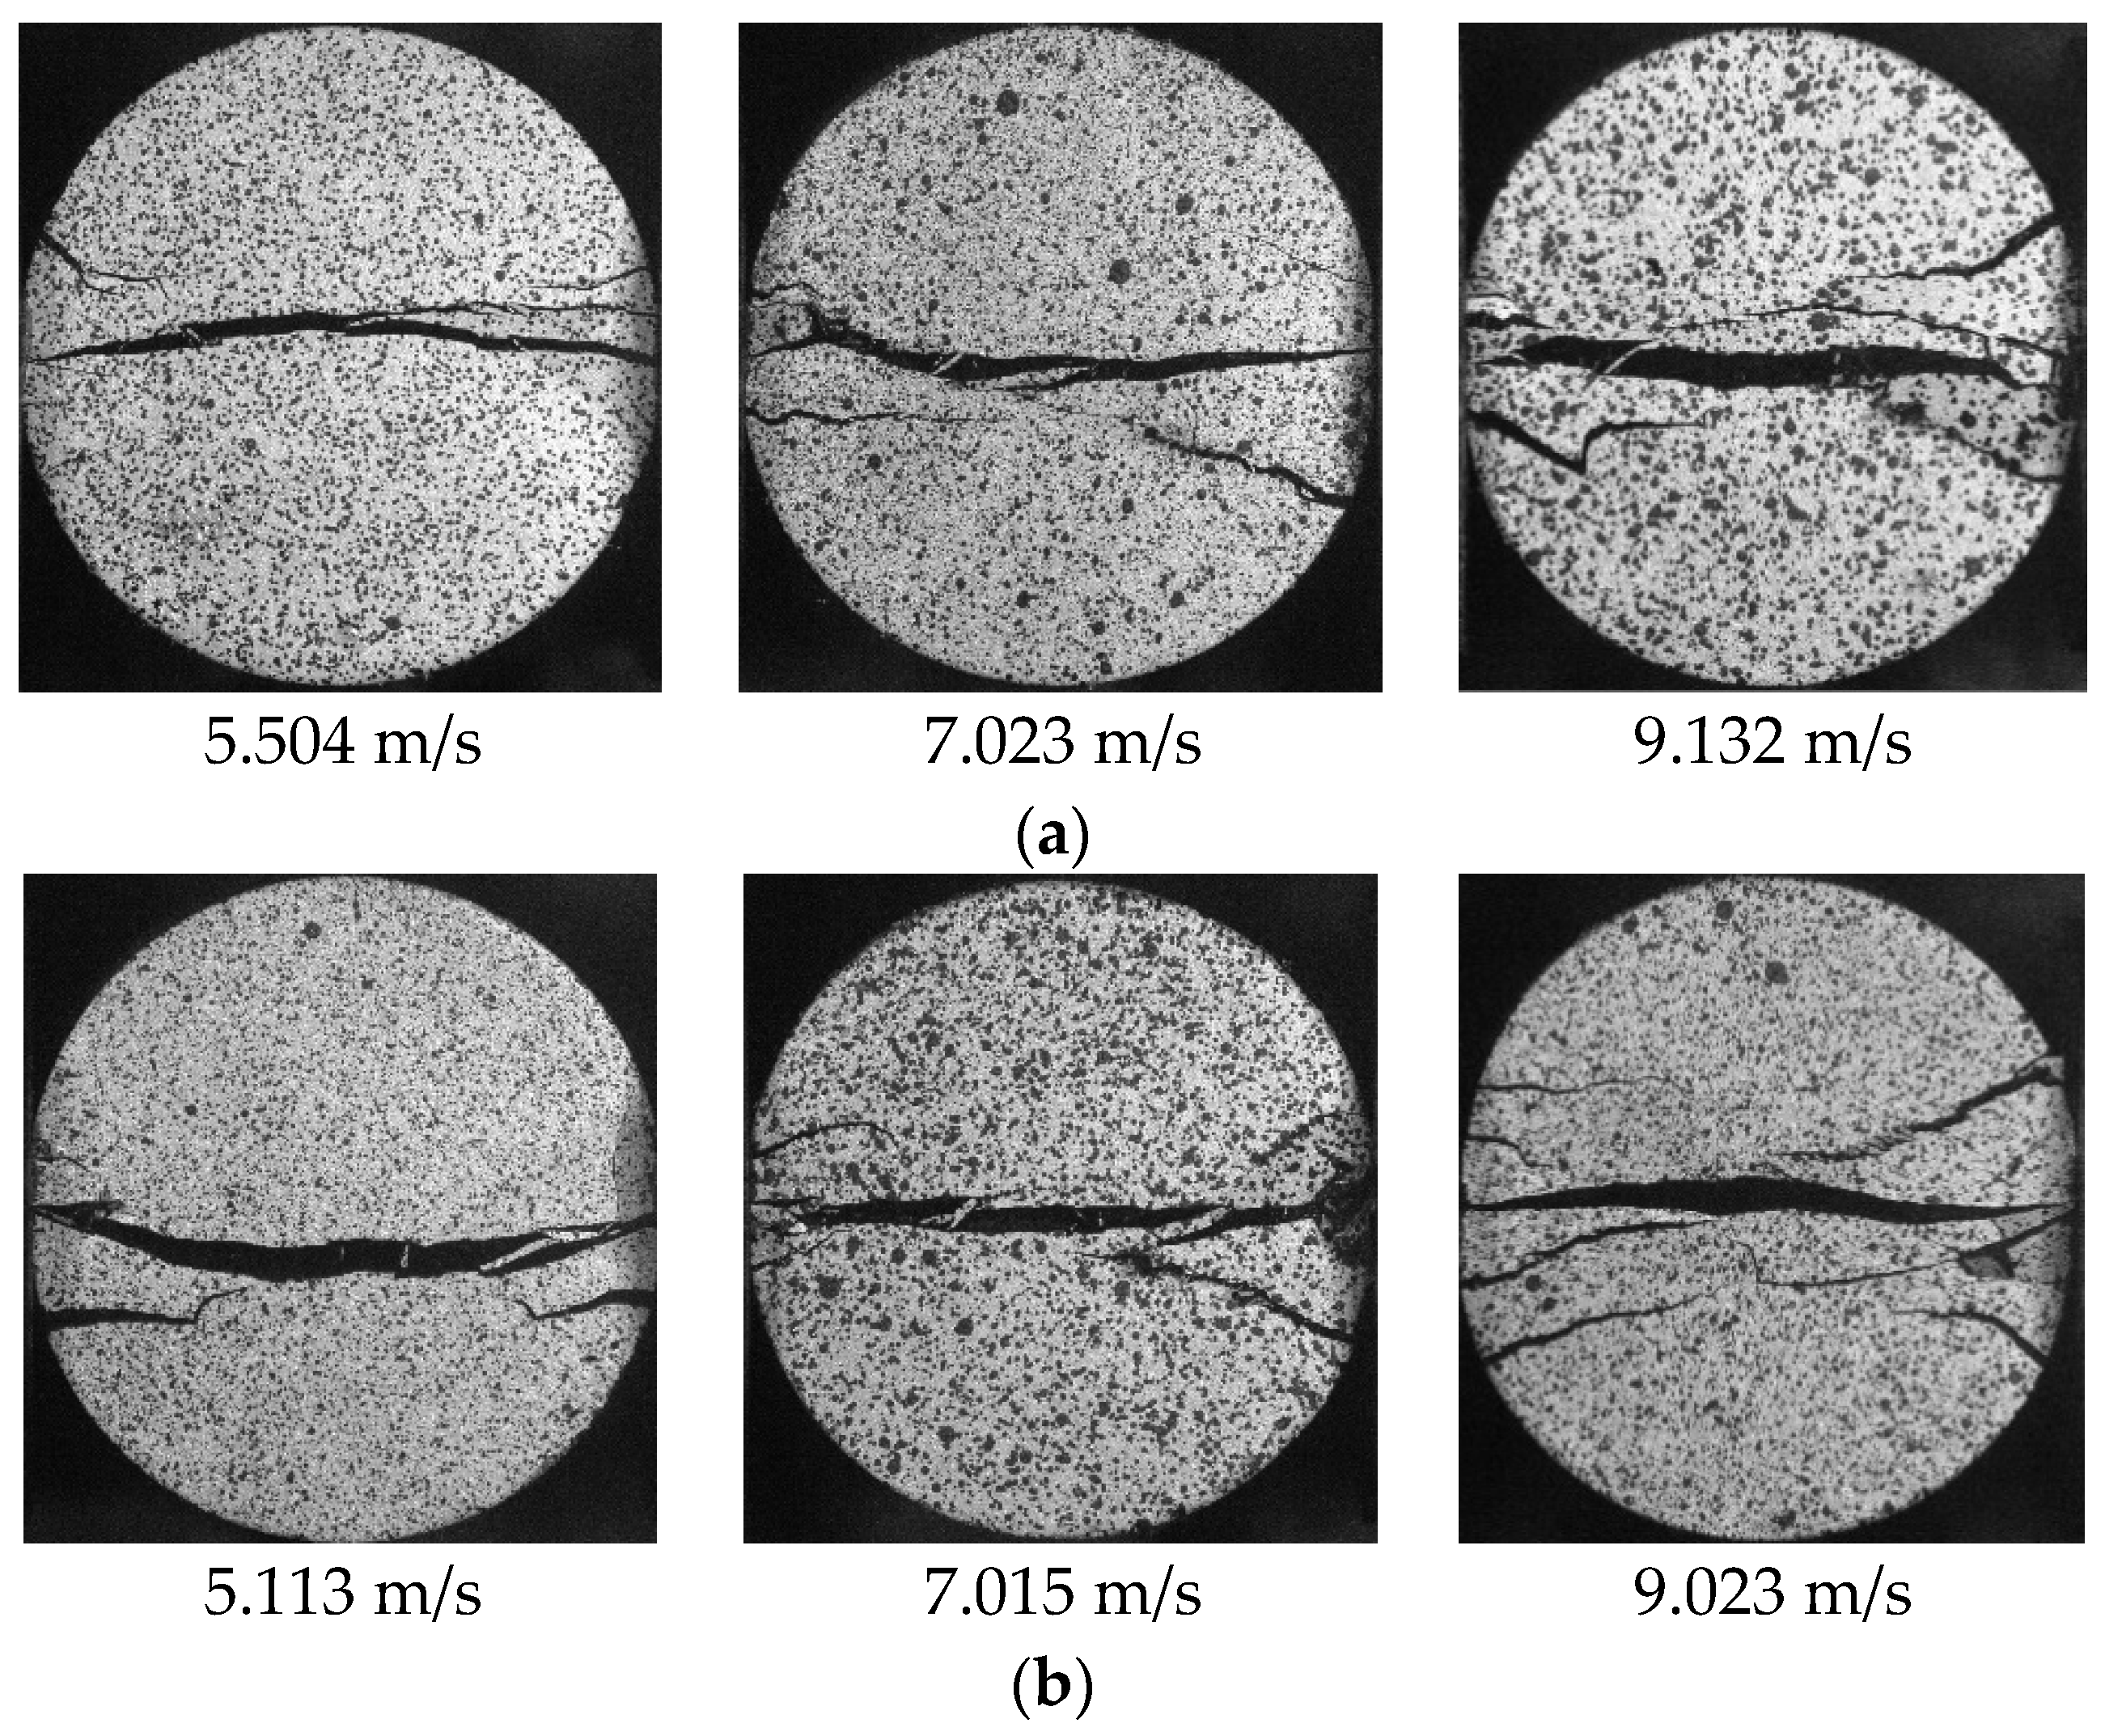
3.2. Specimen Rupture Process and Fracture Model Analysis

According to previous studies [26,27,28], rock shows an apparent strain rate effect, which has a positive correlation with bullet velocity. In this test, bullets launched with different speeds were used to study the damage mechanism of the loading rate under different water content conditions. We analyzed the fracture form and debris distribution characteristics of the sample to evaluate the influence of water on coal sample damage [29,30].
(1) Analysis of the rupture process of the specimen
The rupture processes of the dry and saturated coal sample were captured by using a high-speed camera as mentioned in Section 2.2. Typical dynamic failure processes (with impact velocity about 7 m/s) of the coal samples are shown in Figure 12 (dry) and Figure 13 (saturated).
From the specimen photos of the failure process, samples in both dry and saturated state are affected by tensile failure, forming a main crack in the specimen along the loading direction, and accompanied by a triangular compression zone where the specimen contacts the bars [17,29,30]. The failure process of the tensile test of the coal sample can be decomposed into four steps, (a) crack initiation; (b) crack expansion; (c) occurrence of secondary cracks; (d) completely destroyed, as shown in Figure 14. When load is applied, deformation began to occur at the point of the specimen in contact with the waveguide bar, and a triangular compression zone appeared at both ends of the coal sample. Then, a crack occurred in the middle of the specimen and gradually expanded until penetration of this main crack, with damage mainly caused by tensile stress. After completion of the dynamic splitting test, the rock was further squeezed by the waveguide bars, and secondary cracks initiated at both ends of the rock. The secondary crack deflects during the expansion process, and quickly coalesces with the main crack, resulting in several fragments at both ends of the specimen. This damage is mainly caused by shear failure.
(2) Failure mode
Figure 15 displays the final failure pictures under different impact velocities. At the same impact loading, it is hard to say which of the dry or saturated coals is more severely damaged. However, it can be seen that more shear cracks will appear in the saturated specimen, resulting in more larger pieces in the rock fragments, and a larger triangular compression zone will appear in dry samples, resulting in more fine debris. To further reveal the rupture of the sample, the size and number of pieces of debris larger than 5 mm was determined, including the maximum and average dimension. It is found that the maximum and average size of the dry sample is 26.52 and 17.96 mm, respectively, both larger than that of the saturated sample, and the number of pieces of debris presents an opposite trend, as the average number of pieces of debris collected from saturated coal samples is nine, more than that of the dry sample. It means that the damage of saturated coal is more severe. We assume that the reason for the above phenomenon is that the presence of water causes the coal cement to weaken, its resistance to external loads reduces, and shear cracks are more likely to occur when loading.
After the dynamic test of the coal sample, there were four main fragment characteristics: semi-disc bulk, small fragment, debris, and powder. Figure 16 presents typical photos of the dry and saturated coal samples after failure.
Generally speaking, a comprehensive comparative analysis of the impact velocity and water content state shows that, for saturated specimens, due to the water weakening effect, more large debris will be generated under shear forces. For dry specimens, a more pronounced triangular compression zone will be generated at the loading ends, resulting in more fine debris. There are three main cross-section shapes after the tensile failure of the coal sample. Type I has only a large unilateral tensile fracture surface, Type II has bilateral or multilateral tensile surfaces, and Type III fragments have shear fracture surfaces. Figure 17 shows a schematic illustration of the locations for a specimen of the different debris. It is assumed that with an increase of wavelength, the evolution of fragment failure model is as follows: (1) at a low impact velocity, the fragments are two large Type I fragments that are semicircular in shape, mainly caused by the tensile failure; (2) with increased impact speed, the larger volume fragment is Type I, and the debris includes some small-volume Type II cross-section fragments. In this stage, the damage is still mainly caused by tensile stress, with some fragments generated by shear failure. (3) When the impact velocity continuously increases, there are simultaneously large-volume Type I fragments, some small-volume Type II cross-section fragments, and some debris Type III cross-section fragments. The shear failure is more obvious in this stage.
For the same water content, the degree of coal sample fragmentation increases with the increase of the bullet velocity, because the faster bullet has a larger loading rate. It is assumed that during the dynamic failure process, the existence of water decreases the connection degree between particles or particles and the cement, which is consistent with the analysis mentioned above, so the ability of coal to resist deformation is weakened, resulting in less damage of the dry coal sample.

3.3. Debris Distribution Characteristics

It is noted that water-saturated specimens are obviously more severely damaged with larger debris, but the smaller pieces of debris are less than dry specimens. The amount of debris and powder was directly related to the working environment. Therefore, the debris was collected and screened after crushing of the coal sample, and fragments in the range of 0–0.16, 0.16–0.63, and 0.63–5 mm were separately weighed.
Figure 18 shows that with increased impact velocity, the mass percentage of the dry coal fragments in the three particle sizes increases. The rupture process of the coal sample is essentially the evolution process of energy. A larger impact velocity correlates with a greater input energy. Therefore, more fragments are generated after the specimen breaks. The fragments with a diameter of 0.63–5 mm are mainly shapes in the form of sheets, blocks, and pellets. The diameter of debris from 0.16 to 63 mm appears granular in shape, and the diameter of debris from 0 to 0.16 mm is powder in shape. Equation (3) is a fitting formula for the mass percentage and impact velocity. It can be seen from the formula that the mass percentage of different debris sizes has a nonlinear relationship with the impact velocity.
{ ω d = 3.85 + 1.72 v 0.09 v 2 , D d e b r i s = 0.63 ~ 5.00 mm ω d = 0.61 + 0.29 v 0.01 v 2 , D d e b r i s = 0.16 ~ 0.63 mm ω d = 0.24 0.03 v 0.01 v 2 , D d e b r i s = 0.00 ~ 0.16 mm ω s = 1.70 + 0.85 v 0.03 v 2 , D d e b r i s = 0.63 ~ 5.00 mm ω s = ω = 1.76 + 0.57 v 0.02 v 2 , D d e b r i s = 0.16 ~ 0.63 mm ω s = ω = 0.35 + 0.14 v 0.004 v 2 , D d e b r i s = 0.00 ~ 0.16 mm
where ω and v are the mass percentage and impact velocity, respectively. Ddebris is the diameter of the debris. The subscripts d and s mean dry and saturated, respectively. For a dry or saturated coal sample with a crumb particle size of 0–0.16 mm, the mass percentage of the crumb varied slightly with extension of the velocity of the striker, and was substantially below 0.5%. However, for dry or saturated coal samples with a crumb size of 0.16–0.63 mm, the crumb mass percentage increased with increased impact velocity. The crumb mass percentage of the saturated coal also nearly equals that of the dry coal. Fragments with a size of 0.63–5.0 mm of dry samples is of a significantly higher mass percentage than the other two, indicating that dry samples in this size are larger than saturated samples, which means the dry sample will produce larger debris. Meanwhile, from the quasi-static compression test results, the elastic modulus of the saturated coal sample is smaller than that of the dry one, which means the ability of coal to resist deformation is weakening. Therefore, the rupture intensity should increase for saturated coal, which is consistent with experimental results. In general, the maximum dimension of the dry coal samples’ debris is larger, and the fragment size distribution of saturated coal samples is more uniform.

4. Conclusions

In this study, dynamic tensile testing was performed based on BD coal samples under dry and saturated conditions using a SHPB system. The effect of impact loading rate on the coal sample tensile properties was investigated and a synchronized high-speed camera technique was utilized to capture the dynamic rupture process. The results lead to the following conclusions.
(1) The tensile strength of the coal sample in both dry and saturated state shows obvious loading rate strengthening characteristics, and the relationships for the dry and saturated states can be expressed as σ t = 10.5 + 0.043 σ · and σ t = 16.0 + 0.021 σ · , respectively. The presence of water will weaken the coal dynamic tensile strength. However, with increased loading rate, the degree of weakening is reduced, and the dry coal sample requires less time to reach peak stress than the saturated sample. It is noted that the loading rate of dry and saturated coal samples exhibited different sensitivities to the impact velocity, with saturated coal samples being more sensitive.
(2) In both dry and saturated state samples, the failure is firstly caused by tensile failure, and accompanied by a triangular compression zone, forming a main crack and two triangular crushed areas. For saturated specimens, more large debris will be generated due to shear forces. For dry specimens, a more obvious triangular compression zone will be generated at the both ends of the specimen.
(3) Overall, there is less debris in range of 0–5.0 mm for the saturated coal sample than for the dry coal, experimentally demonstrating the effectiveness of water injection on the working environment.
There are many other factors which may affect the dynamic behavior of hard coal as strain rate is increased, such as types of coal, water content, and loading waveform. Furthermore, although the study achieves some meaningful results, there are still gaps in guiding engineering practice. Therefore, further work, in particular more field test data, is needed.

Author Contributions

Authors’ individual contributions are provided as following: X.Z. and Q.L. conceived and designed the experiments; G.W. and S.F. performed the experiments; X.Z. and S.F. analyzed the data; X.Z. wrote the paper; S.F. undertook proofreading. All authors have read and agreed to the published version of the manuscript.

Funding

The authors sincerely appreciate financial support from the National Key Research and Development Program of China (No. 2016YFC0600903) and the National Natural Science Foundation of China (No. 51774287).

Acknowledgments

The help of state key laboratory of coal resources and safe mining is gratefully acknowledged.

Conflicts of Interest

The authors declare that they have no conflicts of interest.

Appendix A

Table A1. Experimental results of dynamic tensile tests.
TypeNo.Loading Rate/(GPa/s)Tensile Strength/(MPa)TypeNo.Loading Rate/(GPa/s)Tensile Strength/(MPa)
Dry1228.718.5Saturated1272.422.1
2230.720.52304.820.3
3250.221.93346.725.7
4274.020.94358.822.1
5307.425.35371.722.1
6326.124.16376.223.5
7341.324.97445.326.4
8356.527.98536.727.7
9380.527.19547.527.4
10423.628.710576.529.6
11447.830.111638.929.3
12477.232.112706.228.4
13482.529.61378632.0
14489.130.714916.835.1
15524.032.6

References

  1. He, X.; Dou, L.; Mu, Z.; Gong, S.; Cao, A.; He, J. Continuous monitoring and warning theory and technology of rock burst dynamic disaster of coal. J. China Coal Soc. 2014, 39, 1485–1491. [Google Scholar] [CrossRef]
  2. Zhang, J.; Jiang, F.; Yang, J.; Bai, W.; Zhang, L. Rockburst mechanism in soft coal seam within deep coal mines. Int. J. Min. Sci. Tech. 2017, 27, 551–556. [Google Scholar] [CrossRef]
  3. Lu, C.; Dou, L.; Liu, H.; Liu, H.; Liu, B.; Du, B. Case study on microseismic effect of coal and gas outburst process. Int. J. Rock Mech. Min. Sci. 2012, 53, 101–110. [Google Scholar] [CrossRef]
  4. Gu, H.; Tao, M.; Li, X.; Li, Q.; Cao, W.; Wang, F. Dynamic response and failure mechanism of fractured coal under different soaking times. Theor. Appl. Fract. Mech. 2018, 98, 112–122. [Google Scholar] [CrossRef]
  5. Perera, M.S.A.; Ranjith, P.G.; Peter, M. Effects of saturation medium and pressure on strength parameters valley brown coal: Carbon dioxide, water and nitrogen saturations. Energy 2011, 36, 6941–6947. [Google Scholar] [CrossRef]
  6. Pan, Z.; Connell, L.D.; Michael, C.; Connelly, L. Effects of matrix moisture on gas diffusion and flow in coal. Fuel 2010, 89, 3207–3217. [Google Scholar] [CrossRef]
  7. Yao, Q.L.; Li, X.H.; Zhou, J.; Ju, M.; Chong, Z.; Zhao, B. Experimental study of strength characteristics of coal specimens after water intrusion. Arab. J. Geosci. 2015, 8, 6779–6789. [Google Scholar] [CrossRef]
  8. Dai, F.; Huang, S.; Xia, K.; Tan, Z. Some fundamental issues in dynamic compression and tension tests of rocks using split Hopkinson pressure bar. Rock Mech. Rock Eng. 2010, 43, 657–666. [Google Scholar] [CrossRef]
  9. Zhao, J.; Li, H.; Wu, M.; Li, T. Dynamic uniaxial compression tests on a granite. Int. J. Rock Mech. Min. Sci. 1999, 36, 273–277. [Google Scholar] [CrossRef]
  10. Wang, Q.; Li, W.; Xie, H. Dynamic split tensile test of flattened Brazilian disc of rock with SHPB setup. Mech. Mater. 2009, 41, 252–260. [Google Scholar] [CrossRef]
  11. Huang, S.; Xia, K.; Yan, F.; Feng, X. An experimental study of the rate dependence of tensile strength softening of Longyou sandstone. Rock Mech. Rock Eng. 2010, 43, 677–683. [Google Scholar] [CrossRef]
  12. Lu, Y.; Wang, L. Effect of water and temperature on short-term and creep mechanical behaviors of coal measures mudstone. Environ. Earth Sci. 2017, 76, 597. [Google Scholar] [CrossRef]
  13. Xia, K.; Huang, S.; Jha, A.K. Dynamic tensile test of coal, shale and sandstone using split Hopkinson pressure bar: A tool for blast and impact assessment. Int. J. Geotech. Earthq. Eng. 2010, 1, 24–37. [Google Scholar] [CrossRef]
  14. Lambert, D.E.; Ross, C.A. Strain rate effects on dynamic fracture and strength. Int. J. Impact Eng. 2000, 24, 985–998. [Google Scholar] [CrossRef]
  15. Hogan, J.D.; Spray, J.G.; Rogers, R.J.; Boonsue, S.; Vincent, G.; Schneider, M. Micro-scale energy dissipation mechanisms during dynamic fracture in natural polyphase ceramic blocks. Int. J. Impact Eng. 2011, 38, 931–939. [Google Scholar] [CrossRef]
  16. Shan, R.; Gao, W.; Cheng, X.; Liu, T. Determining dynamic fracture toughness of anthracite by using a short—Rod specimen. Explos. Shock Waves 2008, 28, 455–461. [Google Scholar]
  17. Zhao, Y.; Liu, S.; Jiang, Y.; Wang, K.; Huang, Y. Dynamic Tensile Strength of Coal under Dry and Saturated Conditions. Rock Mech. Rock Eng. 2016, 49, 1709–1720. [Google Scholar] [CrossRef]
  18. Zhou, Y.; Xia, K.; Li, X.; Li, H.B.; Ma, G.W.; Zhao, J.; Zhou, Z.L.; Dai, F. Suggested methods for determining the dynamic strength parameters and mode-I fracture toughness of rock materials. Int. J. Rock Mech. Min. Sci. 2012, 49, 35–44. [Google Scholar] [CrossRef]
  19. Frew, D.J.; Forrestal, M.J.; Chen, W. A split Hopkinson pressure bar technique to determine compressive stress-strain data for rock materials. Exp. Mech. 2001, 41, 40–46. [Google Scholar] [CrossRef]
  20. Frew, D.J.; Forrestal, M.J.; Chen, W. Pulse-shaping techniques for testing brittle materials with a split Hopkinson pressure bar. Exp. Mech. 2002, 42, 93–106. [Google Scholar] [CrossRef]
  21. Zhang, Q.B.; Zhao, J. A review of dynamic experimental techniques and mechanical behavior of rock materials. Rock Mech. Rock Eng. 2014, 47, 1411–1478. [Google Scholar] [CrossRef] [Green Version]
  22. Chen, R.; Xia, K.; Dai, F.; Lu, F.; Luo, S.N. Determination of dynamic fracture parameters using a semi-circular bend technique in split Hopkinson pressure bar testing. Eng. Fract. Mech. 2009, 76, 1268–1276. [Google Scholar] [CrossRef]
  23. Wu, S.; Chen, X.; Zhou, J. Influence of strain rate and water content on mechanical behavior of dam concrete. Constr. Build. Mater. 2012, 36, 448–457. [Google Scholar] [CrossRef]
  24. Wu, S.F.; Zhang, Q.C.; Li, S.L.; Chen, B.; Liu, D. Impact mechanical characteristics and damage evolution model of granite. J. China Coal Soc. 2016, 41, 2756–2763. [Google Scholar] [CrossRef]
  25. Li, H.B.; Li, J.C.; Liu, B.; Li, J.; Li, S.; Xia, X. Direct Tension Test for Rock Material Under Different Strain Rates at Quasi-Static Loads. Rock Mech. Rock Eng. 2013, 46, 1247–1254. [Google Scholar] [CrossRef]
  26. Zhu, W.C.; Niu, L.L.; Li, S.H.; Xu, Z. Dynamic Brazilian test of rock under intermediate strain rate: Pendulum hammer-driven SHPB test and numerical simulation. Rock Mech. Rock Eng. 2015, 48, 1867–1881. [Google Scholar] [CrossRef]
  27. Wang, L. Foundations of Stress Waves, 2nd ed.; Elsevier Press: Oxford, UK, 2007; pp. 5–64. [Google Scholar]
  28. Lundberg, B. A split Hopkinson bar study of energy absorption in dynamic rock fragmentation. Int. J. Rock. Mech. Min. 1976, 13, 187–197. [Google Scholar] [CrossRef]
  29. Ye, J.; Yang, Y.; Chang, Z.; Wang, Y. Airy stress function method for analytic solution of stress field during brazilian disc test. J. Eng. Geol. 2009, 17, 528–532. [Google Scholar]
  30. Ma, T.; Peng, N.; Zhu, Z.; Zhang, Q.; Yang, C.; Zhao, J. Brazilian Tensile Strength of Anisotropic Rocks: Review and New Insights. Energies 2018, 11, 304. [Google Scholar] [CrossRef] [Green Version]
Figure 1. Processed coal samples.
Energies 13 01273 g001
Figure 2. Saturated water test machine.
Energies 13 01273 g002
Figure 3. Uniaxial compression strength versus displacement curves of saturated and dry samples.
Energies 13 01273 g003
Figure 4. The schematic diagram of the experimental equipment.
Energies 13 01273 g004aEnergies 13 01273 g004b
Figure 5. Dynamic balance verification.
Energies 13 01273 g005
Figure 6. Determination of loading rate.
Energies 13 01273 g006
Figure 7. Typical curves of dry samples’ dynamic tensile stress history.
Energies 13 01273 g007
Figure 8. Typical curves of saturated samples’ dynamic tensile stress history.
Energies 13 01273 g008
Figure 9. The relationship between loading rate and dynamic tensile strength for dry and saturated samples.
Energies 13 01273 g009
Figure 10. The relationship between loading rate and impact velocity for dry and saturated samples.
Energies 13 01273 g010
Figure 11. Tensile sensitivity coefficient (TSC) of dry and saturated samples.
Energies 13 01273 g011
Figure 12. Dynamic failure process of dry coal samples (TC indicates tensile crack, and SC indicates shear crack).
Energies 13 01273 g012
Figure 13. Dynamic failure process of saturated coal samples.
Energies 13 01273 g013
Figure 14. Diagram of sample failure process: (a) crack initiation; (b) crack expansion; (c) occurrence of secondary cracks; (d) completely destroyed.
Energies 13 01273 g014
Figure 15. Failure pattern of coal samples: (a) dry; (b) saturated.
Energies 13 01273 g015
Figure 16. Typical fragment morphology after dynamic tensile failure: (a) dry; (b) saturated.
Energies 13 01273 g016
Figure 17. Schematic diagram of a typical fragmentation.
Energies 13 01273 g017
Figure 18. Mass percentages of dry and saturated coal samples.
Energies 13 01273 g018

