Article

Stochastic Optimization of Microgrid Participating Day-Ahead Market Operation Strategy with Consideration of Energy Storage System and Demand Response

1
School of Economics and Management, North China Electric Power University, Beijing 102206, China
2
Beijing Key Laboratory of New Energy and Low-Carbon Development, North China Electric Power University, Beijing 102206, China
3
Department of Economic Management, North China Electric Power University, Baoding 071003, China
*
Authors to whom correspondence should be addressed.
Energies 2020, 13(5), 1255; https://doi.org/10.3390/en13051255
Submission received: 24 December 2019 / Revised: 10 February 2020 / Accepted: 5 March 2020 / Published: 8 March 2020

Abstract

:
More and more attention has been paid to the development of renewable energy in the world. Microgrids with flexible regulation abilities provide an effective way to solve the problem of renewable energy connected to power grids. In this article, an optimization strategy of a microgrid participating in day-ahead market operations considering demand responses is proposed, where the uncertainties of distributed renewable energy generation, electrical load, and day-ahead market prices are taken into account. The results show that, when the microgrid implements the demand response, the operation cost of the microgrid decreases by 4.17%. Meanwhile, the demand response program can transfer the peak load of the high-price period to the low-price period, which reduces the peak valley difference of the load and stabilizes the load curve. Finally, a sensitivity analysis of three factors is carried out, finding that, with the increase of the demand response adjustable ratio or the maximum capacity of the electrical storage devices, the operation cost of the microgrid decreases, while, with the increase of the demand response cost, the operation cost of the microgrid increases and, finally, tends to the cost without the demand response. The sensitivity analysis reveals that the demand response cost has a reasonable pricing range to maximize the value of the demand response.

1. Introduction

The effective use and development of renewable energy has become an important part of the energy development strategy of all countries in the world [1]. According to the statistics released by the International Renewable Energy Agency (IRENA) in 2018, the global renewable energy generation accounts for one-third of the total generation [2]. In 2018, the newly installed capacity of renewable energy in the word was 171GW [3], the year-on-year growth rate was 7.9%, and two-thirds of the new power generation came from renewable energy [3]. However, the renewable energy resources are intermittent by nature [4]. After large-scale integration of renewable energy into the grid, it may not only bring new challenges to the safe and stable operation of the power system but also lead to invalid investment, such as the problem of the abandonment of wind and photovoltaic power generation. Microgrids with flexible regulation ability provide an effective way to solve the problem of renewable energy connected to power grids [5]. Due to the limitations of the current prediction technology, the prediction error of output power of renewable energy, such as wind and solar energy, and power consumption of user loads is large [6]. With responsibility for its own profits and losses, microgrid operators are facing operational risks in the power market. Under many uncertain factors, such as electrical market price [7], renewable energy output [8], and user load [9], how to realize the economic dispatch of microgrids becomes a remarkable issue.
In recent years, some scholars have examined the optimization of microgrids under the electrical market environment, which can be categorized as follows: (1) The objective of the optimal operation strategy of microgrids is different. The optimal operation strategies of some researches are single objective functions, such as minimizing the operation cost [10,11,12] or maximizing the benefits [13,14] of microgrids in the power market. Considering the limitations of single-objective optimization, other scholars use multi-objective optimization to explore this problem [15,16,17]. (2) The different factors that are considered as main features of microgrid operation models (references [18,19,20]) have investigated the optimal operation of microgrids with consideration of distributed renewable energy. In References [21,22], the optimal operation of microgrids is modeled and solved under the background of smart grids. (3) Different methods are used to solve the optimal operation of microgrids. Stochastic optimization method is used to find the optimum solution of microgrid operations in References [23,24]. Robust optimization [25] and robust distributed optimization [26] approaches are used by some scholars to solve the problem.
In Reference [27], a comprehensive supervised operation of plug-in electric vehicles (PEVs) is proposed, whose goal is to assist the microgrid by using the PEVs’ available stored energy while keeping satisfactory operating conditions for the grid. In order to consider the user feeling in optimal operation of the microgrid, an optimization model based on user power unsatisfactory degree is proposed in [28], which solves the problem of ignoring the load characteristics. The researchers of Reference [29] formulate a chance-constrained two-stage stochastic programming model to evaluate the impacts of variability in renewable resources in the microgrid operation. Sliding mode observer-based fault diagnosis theory has been used in a proposed diagnosis and mitigation strategy to estimate the error in the sensor measurements due to any sensor fault or cyber attack in the microgrid in Reference [30]. Different heating production systems, such as CHPs, boilers, and solar thermal devices, are considered, as well as heat exchangers, to integrate a detailed description of a multi-source thermal production system in a microgrid framework [31].
The application of energy storage systems in power systems has been developed rapidly because of their good technical characteristics. When one is applied in a microgrid, it can improve the operation efficiency of the microgrid and influence the operation control strategy of the microgrid [32]. A novel real-time monitoring operation model of a microgrid is suggested, where the overall cost function includes containing conventional fuel power plants, wind and solar renewable power generation, and battery storage systems [33]. In Reference [34], by combining the FMEA method and Monte simulations, a novel reliability evaluation method was proposed to discuss several different operational strategies for energy storage devices in a microgrid. Similarly, electrical demand response programs can make the load adjustable. Implementing a demand response in a microgrid can improve the ability of the microgrid to integrate the distributed generation [35]. The rise of demand response research has introduced a new research perspective for the optimization of microgrid operations. The impact of customers’ participation level in the Emergency Demand Response Program and the effect of illogical incentive values in implementing this program on the microgrid operation are represented in Reference [36].
In this article, an optimization strategy of a microgrid-participating day-ahead market operation considering demand response is proposed, where the uncertainties of distributed renewable energy generation, electrical load, and day-ahead market price are taken into account. The innovation of this article is as follows:
(1) The stochastic optimization model is used to describe the random characteristics of renewable energy output and electricity price. In order to make the model more consistent with the actual operation situation of the microgrid, the fluctuation characteristics of renewable energy output and the uncertainty of electricity price in the day-ahead market are incorporated into the optimal operation model of a microgrid. So, the operation strategy can better avoid market risk and improve the economic performance of a microgrid operation. (2) Energy storage device is introduced in the power supply side of a microgrid, and the demand response contract between the microgrid operator and the user is considered on the demand side. A two-way interaction mode between power supply and demand is constructed in order to integrate energy storage devices and regulable loads into the economic dispatch of a microgrid. (3) Make full use of schedulable resources to ease the uncertainty of intermittent energy generation and promote the consumption of renewable energy.
Remainder of this paper has been organized as follows: Section 2 presents the microgrid model with electrical energy storage and demand response. Section 3 is the introduction of stochastic programming. Section 4 is dedicated to the formulation of stochastic optimization of a microgrid operation. In Section 5, the simulation data, conditions, results, and the discussion of the results have been explored. Finally, the conclusion is in Section 6.

2. Microgrid Model

A microgrid can contain a variety of devices and technologies, in which information and energy flow among each other. Then, the assumed microgrid model should be defined firstly to clarify the object of the optimization problem. Assumed microgrid model in this article is as shown in Figure 1. As it is clear in this figure, the internal structure of a microgrid, in which the main form of energy flow is electrical energy, includes wind turbine, micro gas turbine, electrical storage device, and electrical demand. Similar to an electrical energy storage device, electrical demand can generate bidirectional energy flow in a microgrid due to the demand response. As a whole, microgrid operators can purchase and sell energy through electrical grid connection points in the electrical market. The microgrid management unit can get the information from all units of the microgrid and electrical market. By processing the information, the microgrid operator makes the optimal operation strategy of the microgrid to get the maximum profit in the electrical market environment. It should be noted that, the electrical market considered in this article is a fully competitive market, in which all market participants are price-takers. Therefore, when the microgrid operators participate in the electrical market, the operation strategy of a microgrid will not affect the market-clearing price of the power market.

3. Stochastic Programming

Stochastic optimization is an important branch of mathematical optimization, which deals with the optimization problem with random variables in data. The stochastic optimization method can effectively solve the uncertainty problem in the optimization model. This method has been widely used in the optimization fields of the energy system, especially in the electrical power system [37,38]. The description of uncertain factors in stochastic optimization is based on the probability distribution characteristics of them. Results of the stochastic optimization will be scene-based; that is, show the optimal strategy in facing each scene. In this paper, the method is mainly used to reflect the uncertainties of wind turbine output and electrical market price. Considering all scenario sets, the optimal solution is found, which makes the output operation strategy of a microgrid more risk-resistant.

4. Problem Formulation

In this article, the stochastic optimization of daily scheduling of a microgrid is modeled, which takes into account the forecast curve of hourly power load, hourly wind speed, and day-ahead electrical market price. The reliable and economic operation of the microgrid and the main grid are also considered in the daily scheduling. The details are as follows. The interpretations of symbols of formulas are shown as Table 1.

4.1. Objective Function

Stochastic programming method is used to study the optimal operation of a microgrid with energy storage and demand response in this paper. It should be noted that some variables are scenario-based because of the system’s uncertainty sources.
The objective function of this paper is to minimize the daily operation cost of the microgrid, which includes the transaction cost of the electrical market, wind power curtailment cost, energy storage operation cost, micro-gas turbine generation cost, and demand response cost. The daily operation time T is divided into 24 periods, where each period t is one hour. The objective function is as follows:
min C mg = t = 1 24 s ω s ( C g r i d + C w p c + C e s s + C m t g + C d r )
where C mg is the total daily operation cost of the microgrid system, ω s demonstrates the probability of scenario s t h , C g r i d is responsible for the transaction cost of the electrical market, C w p c is indicator of the cost of wind power curtailment, C e s s accounts for the cost of energy storage operation, C m t g indicates the cost of the micro-gas turbine generation, and C d r presents the cost of the electrical demand response.

4.1.1. The Transaction Cost of the Electrical Market

C g r i d = p g r i d ( t , s ) P g r i d ( t , s ) Δ t
where p g r i d ( t , s ) is the day-ahead electrical power price at time t and scenario s and P g r i d ( t , s ) accounts for the imported electrical power from the main grid at time t and scenario s . When the microgrid operator purchases electricity from the electrical market, the value is positive; otherwise, the value is negative.

4.1.2. The Cost of Wind Power Curtailment

C w p c = p w p c P w p c ( t , s ) Δ t
where p w p c is the penalty price of the wind power curtailment.

4.1.3. The Cost of Energy Storage Operation

C e s s = [ p e o p ( P c h ( t , s ) + P d i s ( t , s ) ) + p g r i d ( t , s ) ( P c h ( t , s ) P d i s ( t , s ) ) ] Δ t
where p e o p is the unit cost of the electrical storage operation. It should be noted that the source of electrical energy obtained by electrical storage cannot be determined when electrical storage is charging power at time t . Therefore, the cost of electrical energy when the electrical storage is charging power at time t cannot be determined by the source of the electrical energy supply. So, this paper introduces opportunity cost to solve this problem. At time t , if the operator decides to charge electrical energy into the electrical storage device, he gives up the revenue of selling it to the electrical market at market price. Thus, this paper considers that the electrical energy cost of P c h ( t , s ) is p g r i d ( t , s ) .

4.1.4. The Cost of Micro Gas Turbine Generation

C m t g = p m t g P m t g ( t , s ) Δ t
where p m t g is the unit cost of the micro-gas turbine generation.

4.1.5. The Cost of Electrical Demand Response

C d r = p d r ( P d o w n ( t , s ) + P u p ( t , s ) ) Δ t
where p d r is the unit cost of the electrical demand response.

4.2. Constraints

There are different kinds of constraints that are essential to model the microgrid. These constraints have been demonstrated in the following.

4.2.1. Power Balance

The microgrid system needs to meet the conditions of power balance. The formula is defined as presented in (7):
P d e m a n d ( t , s ) P d o w n ( t , s ) + P u p ( t , s ) = P g r i d ( t , s ) + P w ( t , s ) P w p c ( t , s ) + P m t g ( t , s ) + P d i s ( t , s ) P c h ( t , s )
In Equation (7), the left side of the equation represents the load, which is adjusted by the demand response program. The right side of the equation represents the output of the main grid and each unit of the microgrid. The left and right sides of the equation must be equal at all times to ensure the power balance of the microgrid.

4.2.2. Exchange Line Capacity between the Microgrid and the Main Grid

When the microgrid operator purchases and sells electrical power from the market, it needs to meet the constraints of the exchange line capacity between the microgrid and the main grid. The formula is as follows:
P g r i d min | P g r i d ( t , s ) | P g r i d max
where P g r i d min and P g r i d max demonstrate the minimum capacity and maximum capacity of imported power from the main grid.

4.2.3. Wind Farm Constraints

The uncertain output power of wind farms mainly depends on wind speed. The relationship between output power of wind farms and wind speed is studied in Reference [39]. The function relationship is as follows:
P w ( v ( t , s ) ) = { 0 , v ( t , s ) v i n c   or   v ( t , s ) v o u t c v ( t , s ) v i n c v r a t e d c v i n c P r w , v i n c v ( t , s ) v r a t e d c P r w , v r a t e d c v ( t , s ) v o u t c
0 P w p c ( t , s ) μ w p c P w p c max ( s )
P w p c max ( s ) = max { P w ( t , s ) , t = 1 , , 24 }
where v ( t , s ) is wind speed at time t and scenario s . v i n c and v o u t c represent cut-in and cut-out speeds of wind turbines. v r a t e d c and P r w indicates rated speeds and rated output power of wind turbines. μ w p c presents allowable proportions of abandoned power for wind farms. P w p c max ( s ) accounts for maximum wind power output at scenario s .

4.2.4. Micro Gas Turbine Constraints

The operation of the micro-gas turbine unit in the microgrid is constrained by the micro-gas turbine’s technical conditions. The formulas are as follow.
P m t g min P m t g ( t , s ) P m t g max
r m t g min | P m t g ( t , s ) P m t g ( t 1 , s ) | r m t g max
where P m t g min and P m t g max demonstrate the minimum capacity and maximum capacity of output power from micro-gas turbine. r m t g min and r m t g max represent minimum climbing rates and maximum climbing rates of the micro-gas turbine at time t .

4.2.5. Electrical Storage Constraints

In order to maintain a good operation condition and extend the lifetime of the electrical storage device, the charging and discharging power of the electrical storage should be in a limited range.
P e s s min P e s s ( t , s ) P e s s max
where P e s s min and P e s s max demonstrate the minimum capacity and maximum capacity of residual energy of an electrical storage device.
Since the time scale selected in this article is one day, a reasonable initial residual energy E 0 is given in the electrical storage operation scheduling. After one day of charging and discharging operation, the residual energy of electrical storage is still E 0 . This method not only helps to solve the optimization model but also ensures the time continuity of the calculation results. The output operation strategy can let the microgrid operators continuously participate in the electrical market.
{ P e s s ( t , s ) = E 0 , t = 1 , 24 P e s s ( t , s ) = E 0 + ( u c h P c h ( t , s ) ( 1 u d i s ) P d i s ( t , s ) ) Δ t P l o s s ( t , s ) + P e s s ( t - 1 , s ) , 2 t 23
P l o s s ( t , s ) = μ l o s s P e s s ( t , s )
where u c h and u d i s present electrical storage charging and discharging efficiencies. P l o s s ( t , s ) is the power loss of the electrical storage at time t and scenario s . μ l o s s accounts for the electrical storage loss ratio. Equation (16) models the natural energy loss of the electrical storage device in an actual operation.
P e s s E r E min ( 1 u c h ) I c h ( t , s ) P c h ( t , s ) P e s s E r E max ( 1 u c h ) I c h ( t , s )
P e s s E r E min u d i s I d i s ( t , s ) P d i s ( t , s ) P e s s E r E max u d i s I d i s ( t , s )
0 I c h ( t , s ) + I d i s ( t , s ) 1
where P e s s E is the electrical storage capacity. r E min and r E max demonstrate the minimum and maximum allowable electrical storage charging/discharging rates. I c h ( t , s ) and I d i s ( t , s ) are 0–1 variables, which represent the state of charging and discharging of an electrical storage at time t and scenario s . When I c h ( t , s ) is 1, it means the electrical storage is in the state of charging. When I c h ( t , s ) is 0, it means the electrical storage is in the state of noncharging. When I d i s ( t , s ) is 1, it means the electrical storage is in the state of discharging. When I d i s ( t , s ) is 0, it means the electrical storage is in the state of nondischarging. Equation (19) ensures that the electrical storage will not be in the state of charging and discharging at the same time.

4.2.6. Demand Response Constraints

Demand response program can stabilize the load curve and effectively reduce the operation cost of a microgrid [40]. In order to minimize the impact of the demand response on the users’ own power consumption behavior, this paper refers to the method proposed by Reference [41]. According to this method law, a total shifted-down load by a user should be equal with the shifted-up amount during the 24 h.
t = 1 24 P d o w n ( t , s ) = t = 1 24 P u p ( t , s )
The constraints of the demand response shift-up and shift-down load are as follows:
0 P d o w n ( t , s ) μ d o w n P d e m a n d ( t , s ) I d o w n ( t , s )
0 P u p ( t , s ) μ u p P d e m a n d ( t , s ) I u p ( t , s )
0 I d o w n ( t , s ) + I u p ( t , s ) 1
where μ d o w n and μ u p are the maximum ratios of shifted-up and shifted-down loads. I d o w n ( t , s ) and I u p ( t , s ) are 0–1 variables, which represent the state of shifted-up and shifted-down loads by the demand response program at time t and scenario s . When I d o w n ( t , s ) is 1, it means the load is in the state of shifted-down. When I d o w n ( t , s ) is 0, it means the load is not in the state of shifted-down. When I u p ( t , s ) is 1, it means the load is in the state of shifted-up. When I u p ( t , s ) is 0, it means the load is not in the state of shifted-up. Equation (23) ensures that the load will not be in the state of shifted-down and shifted-up at the same time.

5. Simulation and Discussion

5.1. Simulation Information

In order to show how the demand response affects the operation strategy of the microgrid, three cases are considered in the simulation. The results of the three cases are compared and analyzed in the following part. The specific contents of the three cases are as follows.
Case 1: Without demand response (DR).
Case 2: With DR and without DR cost.
Case 3: With DR and DR cost.
In the three cases, the uncertain factors such as wind speed, power load, and market price of the day-ahead power are considered. In this paper, a Monte Carlo simulation method is used to generate 400 scenarios, which is needed for stochastic optimization. The wind speed scenarios are generated with the Weibull probability density function. The normal probability density function is used to generate the load and the day-ahead market price scenarios. Finally, by using the method of Reference [42], the number of scenarios is reduced to 20. Figure 2 and Figure 3 show the basic load and day-ahead market price. By taking these values as the average value of the probability density function, where the standard deviation is taken as 10%, the scenarios of the corresponding variables are generated. Parameters required by the Weibull function and other important parameters in the microgrid optimization model are shown in Table 2. This paper uses YALMIP programming language and MATLAB software to solve the model.

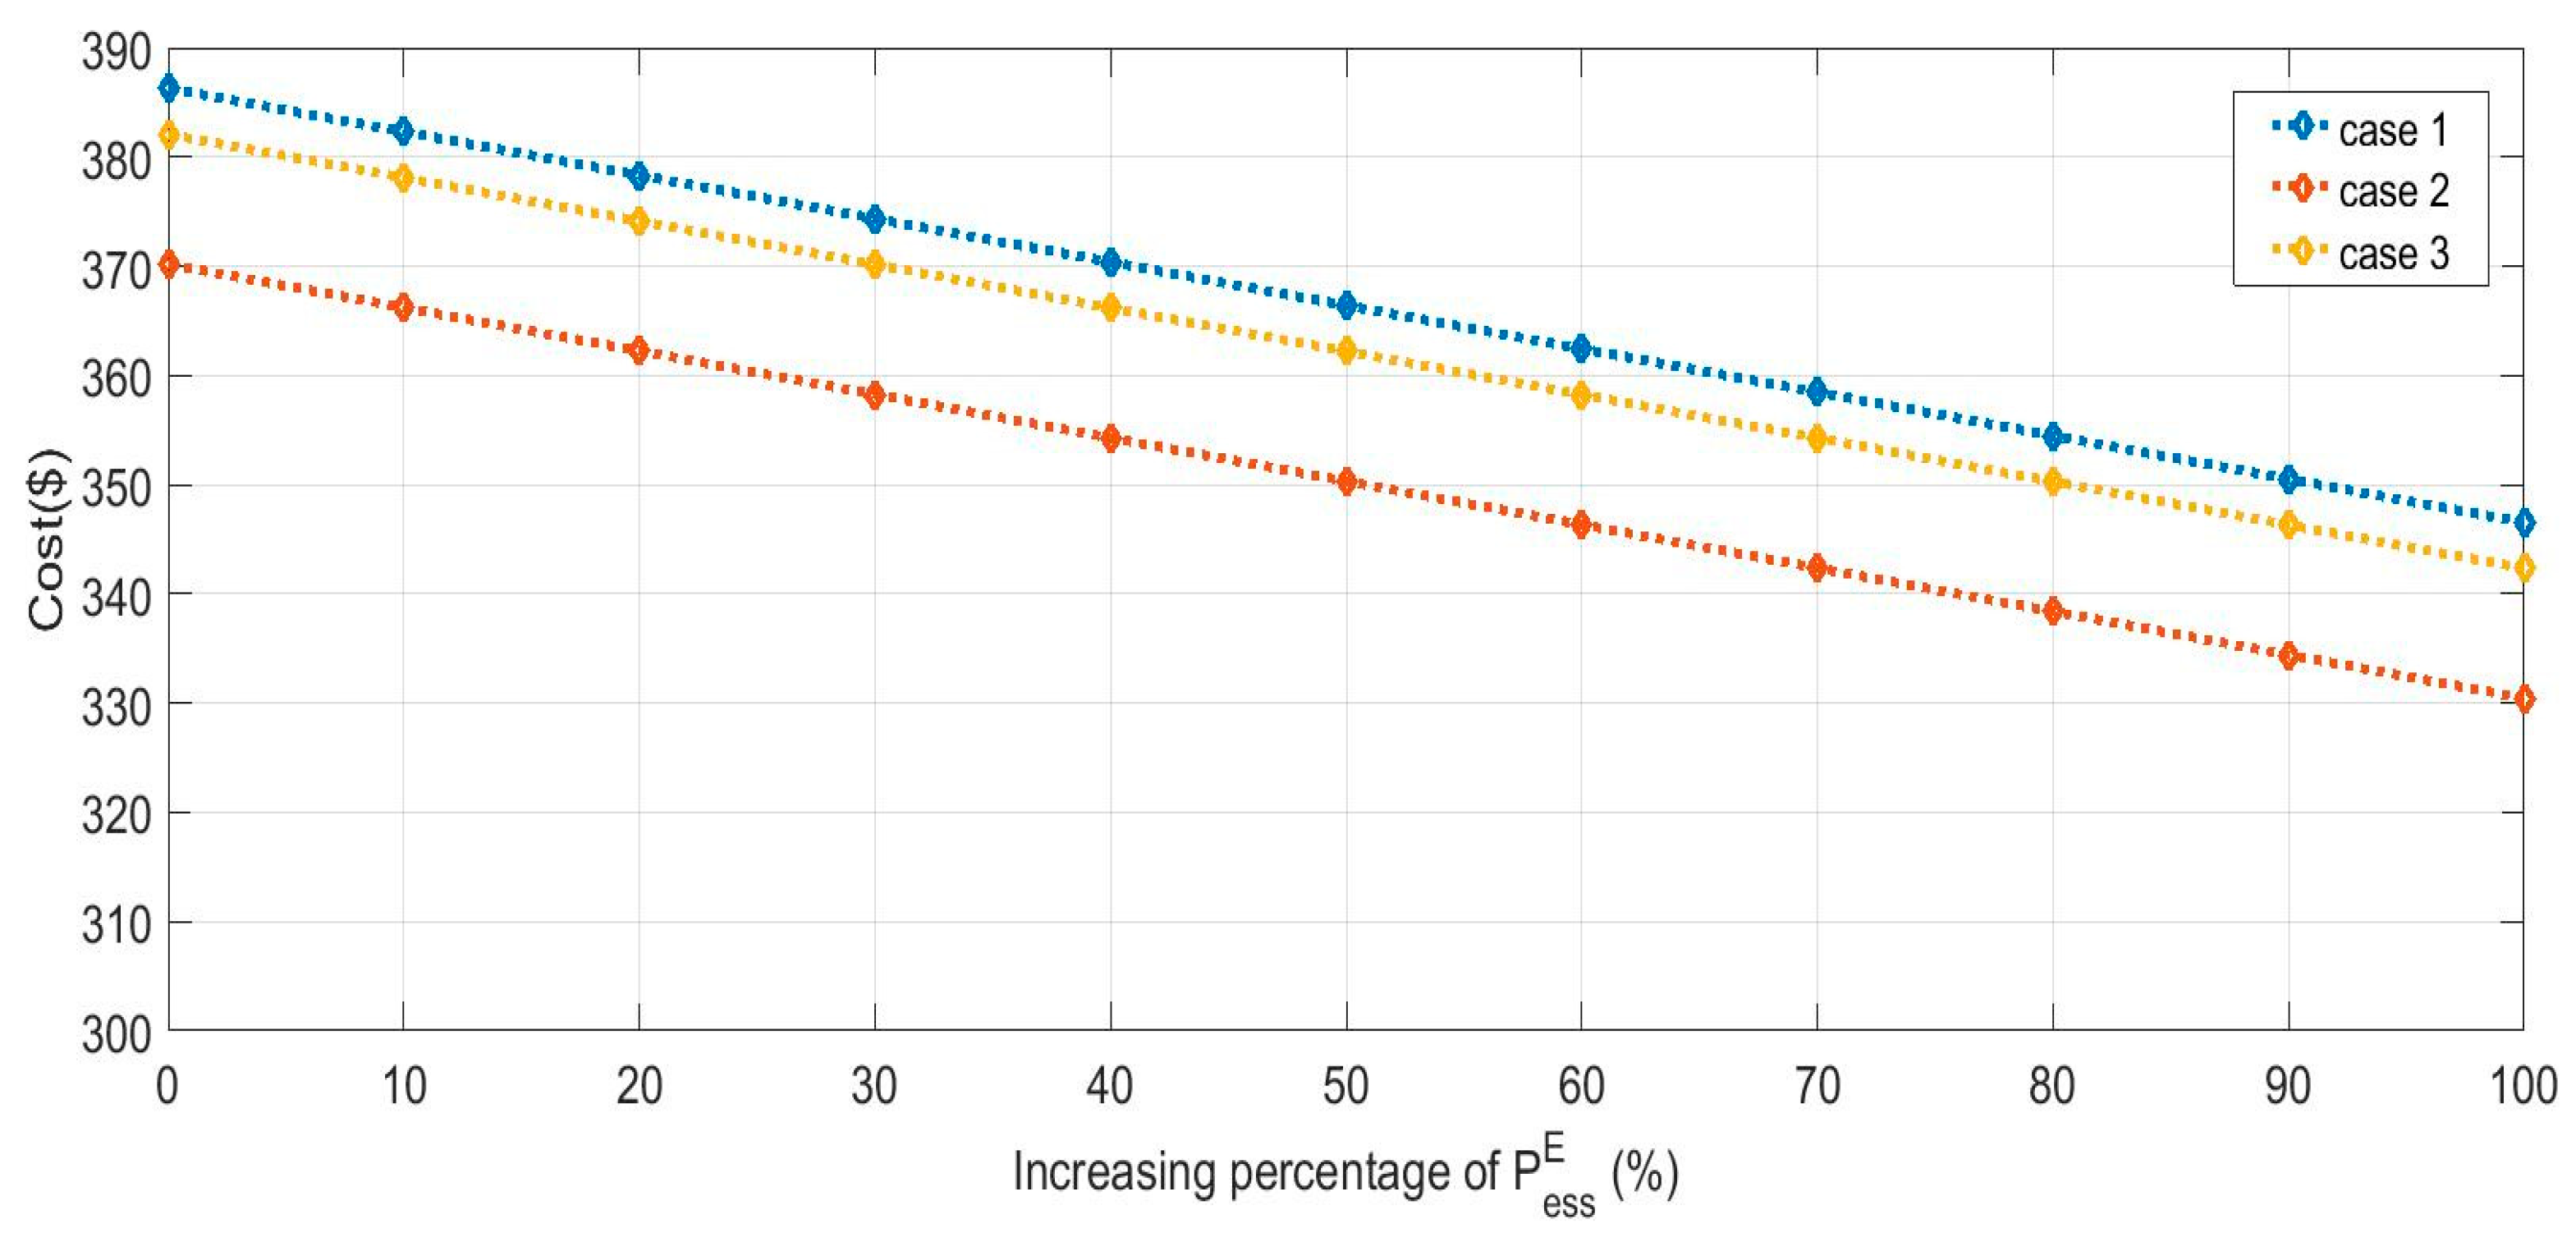
5.2. Simulation Results and Discussion

The optimized operation cost of a microgrid in different cases is shown in Table 3. In case 1, case 2, and case 3, the optimized operation cost of a microgrid is $386.29, $370.19, and $382.08, respectively. The difference of costs in the three cases shows that the demand response program and the cost of the demand response will affect the optimal operation and, finally, affect the operation cost of the microgrid. When the microgrid implements a free demand response, the operation cost of the microgrid decreases by 4.17%, indicating that, after the demand response is implemented, the load of the microgrid can be adjusted, which can better reduce the risk brought by the price uncertainty in the electricity market and reduce the operation cost of the microgrid. With the cost of demand response in case 3, the operation cost of the microgrid decreased by 1.09%. This shows that the cost of demand response has an impact on the operation of a microgrid. Sensitivity analysis of the demand response cost will be carried out at the end of this section.
Displaying the results of all 20 scenarios in this article will take up a lot of space to display the graphs and tables. Therefore, this paper chooses scenario 10 as an example to analyze and discuss the optimized microgrid operation results.
Figure 4 shows the transaction electrical power from the main grid in three cases. In the figure, a positive value indicates that the microgrid purchases electrical power from the main grid, and a negative value indicates that the microgrid sells electrical power. In case 1, the microgrid buys less energy from the main grid in the low-price period and sells less energy in the high-price period. Compared with case 1, the transaction between the microgrid and main grid is more active in case 2. More power is purchased in the low-price period and sold in the high-price period under this case. This result shows that the adjustment of the demand response to load will affect the strategy of the microgrid participating in the day-ahead electrical market. From the simulation results, we can see that a microgrid with a demand response will increase the power purchase in a low-price period and the power sale in a high-price period. In this way, the operation benefit of a microgrid can be improved. The effect of the demand response costs on the participation of a microgrid in the day-ahead electricity market is significant. Comparing the result curves of case 2 and case 3, the demand response cost mainly affects the participation of the microgrid in the electricity market during the subpeak period of the electricity price.
Figure 5 shows the charging and discharging power of the electrical storage of the microgrid in three cases. The positive value in the figure represents the charging power of the electrical storage devices, and the negative value represents the discharging power. As shown in the figure, in three cases, the charging and discharging strategies of the electrical storage devices of the microgrid are basically the same. From the results of this paper, the demand response has no significant effect on the operation of electrical storage devices of a microgrid. Figure 6 shows the wind farm output.
Figure 7 shows the load curve of the microgrid in three cases. As shown in the figure, the demand response program can tap the potential of the demand side of load flexibility. The demand response program transfers the peak load of the high-price period to the low-price period, which reduces the peak valley difference of the load and stabilizes the load curve.
Sensitivity analysis of the demand response cost, demand response adjustable ratio, and electrical storage maximum capacity are also carried out in this paper. Figure 8 shows the sensitivity analysis results of the demand response cost. With the increase of the demand response cost, the operation cost of the microgrid also increases and, finally, tends to the cost without the demand response in case 1. This shows that the demand response cost has a reasonable pricing range. For the operators of a microgrid, the high cost will make the demand response lose its economic value and make the operators abandon the use of a demand response to optimize the operation strategy. Figure 9 shows the sensitivity analysis of the demand response adjustable ratio. With the increase of the demand response adjustable ratio, the operation cost of the microgrid decreases. The operation cost of the microgrid in case 2 without the demand response cost decreased more than that in case 3. Figure 10 shows the sensitivity analysis of the maximum capacity of the electrical storage devices. In the three cases, the operation cost of the microgrid decreases with the increase of the energy storage capacity.
The stochastic optimization method is compared with the conventional deterministic optimization method in this paper. Table 4 shows the operation cost of the microgrid and the rate of abandoned energy from the wind turbine for both methods under three cases in scenario 10. In Table 4, SO and DO represents stochastic optimization and deterministic optimization. μ a w represents the rate of abandoned energy from the wind turbine, which is calculated as follows:
μ a w = t = 1 24 P w p c ( t ) t = 1 24 P w ( t )
As shown in Table 4, the operation cost of the microgrid with the stochastic optimization method is lower than that with deterministic optimization method in all three cases. The rates of the abandoned energies from the wind turbine, which are greater than 0 with the deterministic optimization method, are all 0 with the stochastic optimization method in all three cases. Compared with the above results, we can see that the operation strategy of the microgrid with the stochastic optimization method is not only conducive to the absorption of renewable energy but also can effectively reduce the operation costs of the microgrid.

6. Conclusions

This paper puts forward the operation optimization strategy of a microgrid with a micro-gas turbine, wind farm, electrical storage devices, and demand response program to participate in the day-ahead electrical market. The stochastic volatility of the renewable energy output, electrical power price, and load is introduced into the model. The stochastic optimization method is used to solve the model. The results show that, when the microgrid implements the demand response, the operation cost of the microgrid decreases by 4.17%. Meanwhile, the demand response program transfers the peak load of the high-price period to the low-price period, which reduces the peak valley difference of the load and stabilizes the load curve. Finally, a sensitivity analysis of the three factors is carried out. With the increase of the demand response adjustable ratio or the maximum capacity of the electrical storage devices, the operation cost of the microgrid decreases. With the increase of the demand response cost, the operation cost of the microgrid increases and, finally, tends to the cost without the demand response in case 1. This shows that the demand response cost has a reasonable pricing range to maximize the value of the demand response.
In recent years, with the practice and popularization of the combined cooling heating and power (CCHP) microgrid, this research can be extended to study the strategy of the CCHP microgrid participating in the electricity market. A demand response program can be applied to a hot demand and cold demand to study the optimal operation strategy of the CCHP microgrid.

Author Contributions

H.L. proposed the concept of this research and completed the manuscript. B.L., X.W., and S.Z. analyzed the empirical data. H.Z. and Y.W. gave some suggestions. All authors have read and agreed to the published version of the manuscript.

Funding

This study is supported by the National Natural Science Foundation of China (Grant No.71973043), the Fundamental Research Funds for the Central Universities (2019QN077), and the Fundamental Research Funds for the Central Universities (2019MS131).

Conflicts of Interest

The authors declare no conflicts of interest.

References

  1. Li, H.; Lu, H.; Li, B. Quantitative research on externalities brought by wind power priority scheduling to power generation enterprises based on probabilistic production simulation. Power Syst. Technol. 2017, 41, 3803–3808. [Google Scholar]
  2. Ajeigbe, O.A.; Munda, J.L.; Hamam, Y. Optimal allocation of renewable energy hybrid distributed generations for small-signal stability enhancement. Energies 2019, 12, 4777. [Google Scholar] [CrossRef] [Green Version]
  3. Pu, L.; Wang, X.; Tan, Z.; Wu, J.; Long, C.; Kong, W. Feasible electricity price calculation and environmental benefits analysis of the regional nighttime wind power utilization in electric heating in Beijing. J. Clean. Prod. 2019, 212, 1434–1445. [Google Scholar] [CrossRef]
  4. Pu, L.; Wang, X.; Tan, Z.; Wang, H.; Yang, J.; Wu, J. Is China’s electricity price cross-subsidy policy reasonable? Comparative analysis of eastern, central, and western regions. Energy Policy 2020, 138, 111250. [Google Scholar] [CrossRef]
  5. Yu, W.; Li, S.; Zhu, Y.; Yang, C. Management and distribution strategies for dynamic power in a ship’s micro-grid system based on photovoltaic cell, diesel generator, and lithium battery. Energies 2019, 12, 4505. [Google Scholar] [CrossRef] [Green Version]
  6. Yuan, T.; Sun, Z.; Ma, S. Gearbox fault prediction of wind turbines based on a stacking model and change-point detection. Energies 2019, 12, 4224. [Google Scholar] [CrossRef] [Green Version]
  7. Sánchez de la Nieta, A.; González, V.; Contreras, J. Portfolio decision of short-term electricity forecasted prices through stochastic programming. Energies 2016, 9, 1069. [Google Scholar] [CrossRef] [Green Version]
  8. Wang, Y.; Yang, Y.; Tang, L.; Sun, W.; Li, B. A Wasserstein based two-stage distributionally robust optimization model for optimal operation of CCHP micro-grid under uncertainties. Int. J. Electr. Power Energy Syst. 2020, 119, 105941. [Google Scholar] [CrossRef]
  9. Manzoor, A.; Javaid, N.; Ullah, I.; Abdul, W.; Almogren, A.; Alamri, A. An intelligent hybrid heuristic scheme for smart metering based demand side management in smart homes. Energies 2017, 10, 1258. [Google Scholar] [CrossRef] [Green Version]
  10. Sharma, S.; Bhattacharjee, S.; Bhattacharya, A. Probabilistic operation cost minimization of Micro-Grid. Energy 2018, 148, 1116–1139. [Google Scholar] [CrossRef]
  11. Sharma, A.; Kolhe, M.; Konara, K.; Ulltveit-Moe, N.; Muddineni, K.; Mudgal, A.; Garud, S. Performance assessment of institutional photovoltaic based energy system for operating as a micro-grid. Sustain. Energy Technol. Assess. 2020, 37, 100563. [Google Scholar] [CrossRef]
  12. Sharma, S.; Bhattacharjee, S.; Bhattacharya, A. Operation cost minimization of a micro-grid using quasi-oppositional swine influenza model based optimization with quarantine. Ain Shams Eng. J. 2018, 9, 45–63. [Google Scholar] [CrossRef] [Green Version]
  13. Pankiraj, J.S.; Yassine, A.; Choudhury, S. An auction mechanism for profit maximization of peer-to-peer energy trading in smart grids. Procedia Comput. Sci. 2019, 151, 361–368. [Google Scholar] [CrossRef]
  14. Liu, Y.; Zuo, K.; Liu, X.A.; Liu, J.; Kennedy, J. Dynamic pricing for decentralized energy trading in micro-grids. Appl. Energy 2018, 228, 689–699. [Google Scholar] [CrossRef] [Green Version]
  15. Li, G.; Zhai, X.; Li, Y.; Feng, B.; Wang, Z.; Zhang, M. Multi-objective optimization operation considering environment benefits and economy based on ant colony optimization for isolated micro-grids. Energy Procedia 2016, 104, 21–26. [Google Scholar] [CrossRef]
  16. Ndwali, K.; Njiri, J.G.; Wanjiru, E.M. Multi-objective optimal sizing of grid connected photovoltaic batteryless system minimizing the total life cycle cost and the grid energy. Renew. Energy 2019, 148, 1256–1265. [Google Scholar] [CrossRef]
  17. Pisacane, O.; Severini, M.; Fagiani, M.; Squartini, S. Collaborative energy management in a micro-grid by multi-objective mathematical programming. Energy Build. 2019, 203, 109432. [Google Scholar] [CrossRef]
  18. Colombo, P.; Saeedmanesh, A.; Santarelli, M.; Brouwer, J. Dynamic dispatch of solid oxide electrolysis system for high renewable energy penetration in a microgrid. Energy Convers. Manag. 2020, 204, 112322. [Google Scholar] [CrossRef]
  19. Obara, S.; Sato, K.; Utsugi, Y. Study on the operation optimization of an isolated island microgrid with renewable energy layout planning. Energy 2018, 161, 1211–1225. [Google Scholar] [CrossRef]
  20. Wang, D.; Qiu, J.; Reedman, L.; Meng, K.; Lai, L.L. Two-stage energy management for networked microgrids with high renewable penetration. Appl. Energy 2018, 226, 39–48. [Google Scholar] [CrossRef]
  21. Molavi, A.; Shi, J.; Wu, Y.; Lim, G.J. Enabling smart ports through the integration of microgrids: A two-stage stochastic programming approach. Appl. Energy 2020, 258, 114022. [Google Scholar] [CrossRef]
  22. Nnaji, E.C.; Adgidzi, D.; Dioha, M.O.; Ewim, D.R.E.; Huang, Z. Modelling and management of smart microgrid for rural electrification in sub-saharan Africa: The case of Nigeria. Electr. J. 2019, 32, 106672. [Google Scholar] [CrossRef]
  23. Zhang, K.; Li, J.; He, Z.; Yan, W. Microgrid energy dispatching for industrial zones with renewable generations and electric vehicles via stochastic optimization and learning. Phys. A Stat. Mech. Appl. 2018, 501, 356–369. [Google Scholar] [CrossRef]
  24. Grover-Silva, E.; Heleno, M.; Mashayekh, S.; Cardoso, G.; Girard, R.; Kariniotakis, G. A stochastic optimal power flow for scheduling flexible resources in microgrids operation. Appl. Energy 2018, 229, 201–208. [Google Scholar] [CrossRef] [Green Version]
  25. Wang, L.; Li, Q.; Cheng, X.; He, G.; Li, G.; Wang, R. A robust optimization approach for risk-averse energy transactions in networked microgrids. Energy Procedia 2019, 158, 6595–6600. [Google Scholar] [CrossRef]
  26. Wang, L.; Zhang, B.; Li, Q.; Song, W.; Li, G. Robust distributed optimization for energy dispatch of multi-stakeholder multiple microgrids under uncertainty. Appl. Energy 2019, 255, 113845. [Google Scholar] [CrossRef]
  27. Rodrigues, Y.R.; De Souza, A.C.Z.; Ribeiro, P.F. An inclusive methodology for Plug-in electrical vehicle operation with G2V and V2G in smart microgrid environments. Int. J. Electr. Power Energy Syst. 2018, 102, 312–323. [Google Scholar] [CrossRef]
  28. Yang, D.; Chong, Q.; Hu, B.; Ma, M. Optimal operation of microgrid based on user power unsatisfactory. Energy Procedia 2018, 145, 76–81. [Google Scholar] [CrossRef]
  29. Marino, C.; Quddus, M.A.; Marufuzzaman, M.; Cowan, M.; Bednar, A.E. A chance-constrained two-stage stochastic programming model for reliable microgrid operations under power demand uncertainty. Sustain. Energy Grids Netw. 2018, 13, 66–77. [Google Scholar] [CrossRef]
  30. Saha, S.; Roy, T.K.; Mahmud, M.A.; Haque, M.E.; Islam, S.N. Sensor fault and cyber attack resilient operation of DC microgrids. Int. J. Electr. Power Energy Syst. 2018, 99, 540–554. [Google Scholar] [CrossRef]
  31. Aluisio, B.; Dicorato, M.; Forte, G.; Litrico, G.; Trovato, M. Integration of heat production and thermal comfort models in microgrid operation planning. Sustain. Energy Grids Netw. 2018, 16, 37–54. [Google Scholar] [CrossRef]
  32. Mahmoud, T.S.; Ahmed, B.S.; Hassan, M.Y. The role of intelligent generation control algorithms in optimizing battery energy storage systems size in microgrids: A case study from Western Australia. Energy Convers. Manag. 2019, 196, 1335–1352. [Google Scholar] [CrossRef]
  33. El-Faouri, F.S.; Alzahlan, M.W.; Batarseh, M.G.; Mohammad, A.; Za’ter, M.E. Modeling of a microgrid’s power generation cost function in real-time operation for a highly fluctuating load. Simul. Model. Pract. Theory 2019, 94, 118–133. [Google Scholar] [CrossRef]
  34. Ge, S.; Sun, H.; Liu, H.; Li, J.; Zhang, X.; Cao, Y. Reliability evaluation of multi-energy microgrids: Energy storage devices effects analysis. Energy Procedia 2019, 158, 4453–4458. [Google Scholar] [CrossRef]
  35. Neves, D.; Pina, A.; Silva, C.A. Comparison of different demand response optimization goals on an isolated microgrid. Sustain. Energy Technol. Assess. 2018, 30, 209–215. [Google Scholar] [CrossRef]
  36. Imani, M.H.; Niknejad, P.; Barzegaran, M.R. The impact of customers’ participation level and various incentive values on implementing emergency demand response program in microgrid operation. Int. J. Electr. Power Energy Syst. 2018, 96, 114–125. [Google Scholar] [CrossRef]
  37. Mohseni-Bonab, S.M.; Rabiee, A.; Mohammadi-Ivatloo, B. Voltage stability constrained multi-objective optimal reactive power dispatch under load and wind power uncertainties: A stochastic approach. Renew. Energy 2016, 85, 598–609. [Google Scholar] [CrossRef]
  38. Nojavan, S.; Zare, K.; Mohammadi-Ivatloo, B. Optimal stochastic energy management of retailer based on selling price determination under smart grid environment in the presence of demand response program. Appl. Energy 2017, 187, 449–464. [Google Scholar] [CrossRef]
  39. Soroudi, A.; Aien, M.; Ehsan, M. A probabilistic modeling of photo voltaic modules and wind power generation impact on distribution networks. IEEE Syst. J. 2011, 6, 254–259. [Google Scholar] [CrossRef] [Green Version]
  40. Imani, M.H.; Ghadi, M.J.; Ghavidel, S.; Li, L. Demand response modeling in microgrid operation: A review and application for incentive-based and time-based programs. Renew. Sustain. Energy Rev. 2018, 94, 486–499. [Google Scholar] [CrossRef]
  41. Jabari, F.; Nojavan, S.; Ivatloo, B.M.; Bannae Sharifian, M.B. Optimal short-term scheduling of a novel tri-generation system in the presence of demand response programs and battery storage system. Energy Convers. Manag. 2016, 122, 95–108. [Google Scholar] [CrossRef]
  42. Sedighizadeh, M.; Esmaili, M.; Mohammadkhani, N. Stochastic multi-objective energy management in residential microgrids with combined cooling, heating, and power units considering battery energy storage systems and plug-in hybrid electric vehicles. J. Clean. Prod. 2018, 195, 301–317. [Google Scholar] [CrossRef]
Figure 1. Microgrid architecture.
Energies 13 01255 g001
Figure 2. Expected load curve for scenario generation.
Energies 13 01255 g002
Figure 3. Expected day-ahead market price curve for scenario generation.
Energies 13 01255 g003
Figure 4. Transaction electrical power from the main grid in scenario 10.
Energies 13 01255 g004
Figure 5. Charging and discharging power of the electrical storage in scenario 10.
Energies 13 01255 g005
Figure 6. Output power of the wind farm in scenario 10.
Energies 13 01255 g006
Figure 7. Load with and without demand response (DR) in scenario 10.
Energies 13 01255 g007
Figure 8. Sensitivity analysis of the cost of the demand response.
Energies 13 01255 g008
Figure 9. Sensitivity analysis of the maximum ratios of the shiftable load (down and up).
Energies 13 01255 g009
Figure 10. Sensitivity analysis of the capacity of electrical storage.
Energies 13 01255 g010
Table 1. The interpretations of symbols of formulas.
SymbolInterpretationSymbolInterpretation
t time (hour) index P c h ( t , s ) charging power of electrical storage at time t and scenario s
s scenario index P d i s ( t , s ) discharging power of electrical storage at time t and scenario s
P g r i d ( t , s ) imported electrical power from main grid at time t and scenario s P w p c ( t , s ) abandoned wind power at time t and scenario s
P m t g ( t , s ) output power of micro gas turbine at time t and scenario s P w ( t , s ) output power of wind turbine at time t and scenario s
P d o w n ( t , s ) shifted down electrical power by demand response program at time t and scenario s P u p ( t , s ) shifted up electrical power by demand response program at time t and scenario s
P e s s ( t , s ) residual energy of electrical storage at time t and scenario s P d e m a n d ( t , s ) electrical demand of microgrid at time t and scenario s
Table 2. Simulation parameters.
ParameterUnitValueParameterUnitValueParameterUnitValue
π w p c $/kWh0.4 P m t g E kW700 P e s s min kWh12.5
π e o p $/kWh0 P m t g min kW280 E 0 kWh100
π m t g $/kWh0.03 P m t g max kW700 u c h -0.9
π d r $/kWh0.005 r m t g min kW/min20 u d i s -0.9
P g r i d min kW0 r m t g max kW/min20 r E min -0.05
P g r i d max kW2000 P e s s E kW250 r E max -0.38
v i n c m/s4 P e s s max kWh225 μ l o s s -0.05
v o u t c m/s10 P r w kW400 μ d o w n -0.15
v r a t e d c m/s22 μ w p c -1 μ u p -0.15
Table 3. Optimal operation strategy cost of a microgrid in three cases. DR: demand response.
Case NumberDRDR CostCost ($)Reduction
1××386.290
2×370.194.17%
3382.081.09%
Table 4. Comparison of the results of methods stochastic optimization (SO) and deterministic optimization (DO) in scenario 10.
Case NumberSO Cost ($) SO   μ a w DO Cost ($) DO   μ a w
1378.330393.115.03%
2362.240368.672.79%
3274.130383.653.24%

