Article

Pore-Fractures of Coalbed Methane Reservoir Restricted by Coal Facies in Sangjiang-Muling Coal-Bearing Basins, Northeast China

1
School of Energy Resources, China University of Geosciences, Beijing 100083, China
2
Coal Reservoir Laboratory of National Engineering Research Center of Coalbed Methane Development & Utilization, Beijing 100083, China
*
Author to whom correspondence should be addressed.
Energies 2020, 13(5), 1196; https://doi.org/10.3390/en13051196
Submission received: 17 January 2020 / Revised: 26 February 2020 / Accepted: 4 March 2020 / Published: 5 March 2020

Abstract

:
The pore-fractures network plays a key role in coalbed methane (CBM) accumulation and production, while the impacts of coal facies on the pore-fractures network performance are still poorly understood. In this work, the research on the pore-fracture occurrence of 38 collected coals from Sangjiang-Muling coal-bearing basins with multiple techniques, including mercury intrusion porosimetry (MIP), micro-organic quantitative analysis, and optic microscopy, and its variation controlling of coal face were studied. The MIP curves of 38 selected coals, indicating pore structures, were subdivided into three typical types, including type I of predominant micropores, type Ⅱ of predominant micropores and macropores with good connectivity, and type Ⅲ of predominant micropores and macropores with poor connectivity. For coal facies, three various coal facies were distinguished, including lake shore coastal wet forest swamp, the upper delta plain wet forest swamp, tidal flat wet forest swamp using Q-cluster analysis and tissue preservation index–gelification index (TPI-GI), and wood index–groundwater influence index (WI-GWI). The results show a positive relationship between tissue preservation index (TPI), wood index (WI), and mesopores (102 nm–103 nm), and a negative relationship between TPI, WI, and macropores/fractures. In addition, groundwater level fluctuations can control the development of type C and D fractures, and the frequency of type C and D fractures show an ascending trend with increasing groundwater index (GWI), which may be caused by the mineral hydration of the coal. Finally, from the perspective of the pore-fractures occurrence in CBM reservoirs, the wet forest swamp of upper delta plain is considered to be the optimization areas for Sangjiang-Muling coal-bearing basins by a comparative study of various coal facies.

1. Introduction

Coal is the source rock and reservoir for coalbed methane (CBM) [1]. There has been a growing emphasis on CBM in many countries, including China, United States, and Australia in recent years, since it is beneficial to the safety production of mine, greenhouse gas reduction, and has great economic value as a form of clean, unconventional natural gas resource [2,3,4,5,6]. Currently, high costs and low production rates are two key factors influencing CBM commercial development [7]. The dual pore-fracture system of CBM reservoir can provide CBM enrichment space and the channel for the gas adsorption, diffusion, and seepage. The fracture is made up of micro-fracture and macro-fracture, the former is the bridge of pores and macro-fractures; macro-fracture is the pathway for CBM flow from coal reservoirs to wellbores [8,9,10]. Hence, evaluating pore-fracture is important to acquire a high abundance CBM reservoir and a high productivity reservoir.
Discrepancy in pore-fracture characteristics caused the different CBM reservoir permeability, porosity, and the capacity of gas adsorption. In this work, the combined pore size classification applied, which is classified as micropores (<10 nm), transition pores (10 nm–102 nm), mesopores (102 nm–103 nm), macropores (103 nm–104 nm), and super pores/microfractures (over 104 nm) [11,12]. The content of micropores and transition pores represent adsorption capacity of CBM in the coal reservoir, the higher the proportion of micropores and transition pores, the stronger adsorption capacity [12]. Pore-fracture may also greatly affect the interaction between pore-fracture and gas-liquid molecules. Micropores and mesopores has great affinity with certain gases (e.g., CO2, CH4,) because of its extremely large internal surface area, and large quantities of gas is adsorbed on the surface of the pore in the adsorbed state [12,13,14]. Pervious scholars suggested that the matrix permeability is controlled by pore size distribution and the connectivity between pores and fractures; N2 BET surface area should be influenced by the mesopores structure [15,16]. For natural fractural factures, the hydraulic fracturing is an effective way to enhance CBM recovery by increasing the width and length of the natural fractures and improving the connectivity among the natural fractures [17,18].
Factors influencing pore-fracture of CBM reservoir through the coalification on pore-fracture characteristics has been limited, investigated by using MIP and gas adsorption, which show that positive correlations exist between micropores, transition pores, porosity, and the coal rank [19]. Moreover, the structural stress also had a significant impact on porosity and connectivity of pores as confirmed by atomic force microscopy [20]. However, a few studies have focused on the relationship between coal facies and pore-fracture characteristics, which refer to the primary genetic types, organic petrology, sedimentology, and organic geochemistry [21,22,23].
In this work, firstly, the pore-fracture structure characteristics were investigated with MIP, optic microscopy to coal samples from Sangjiang-Muling coal-bearing basins. Then, three coal facies were identified using Q-cluster analysis and tissue preservation index–gelification index (TPI-GI), wood index–groundwater influence index (WI-GWI) diagram, and the relationship between pores, fractures of coal, and coal facies were established. Finally, a new approach predicting favorable areas of CBM reservoir from the perspective of coal facies was proposed.

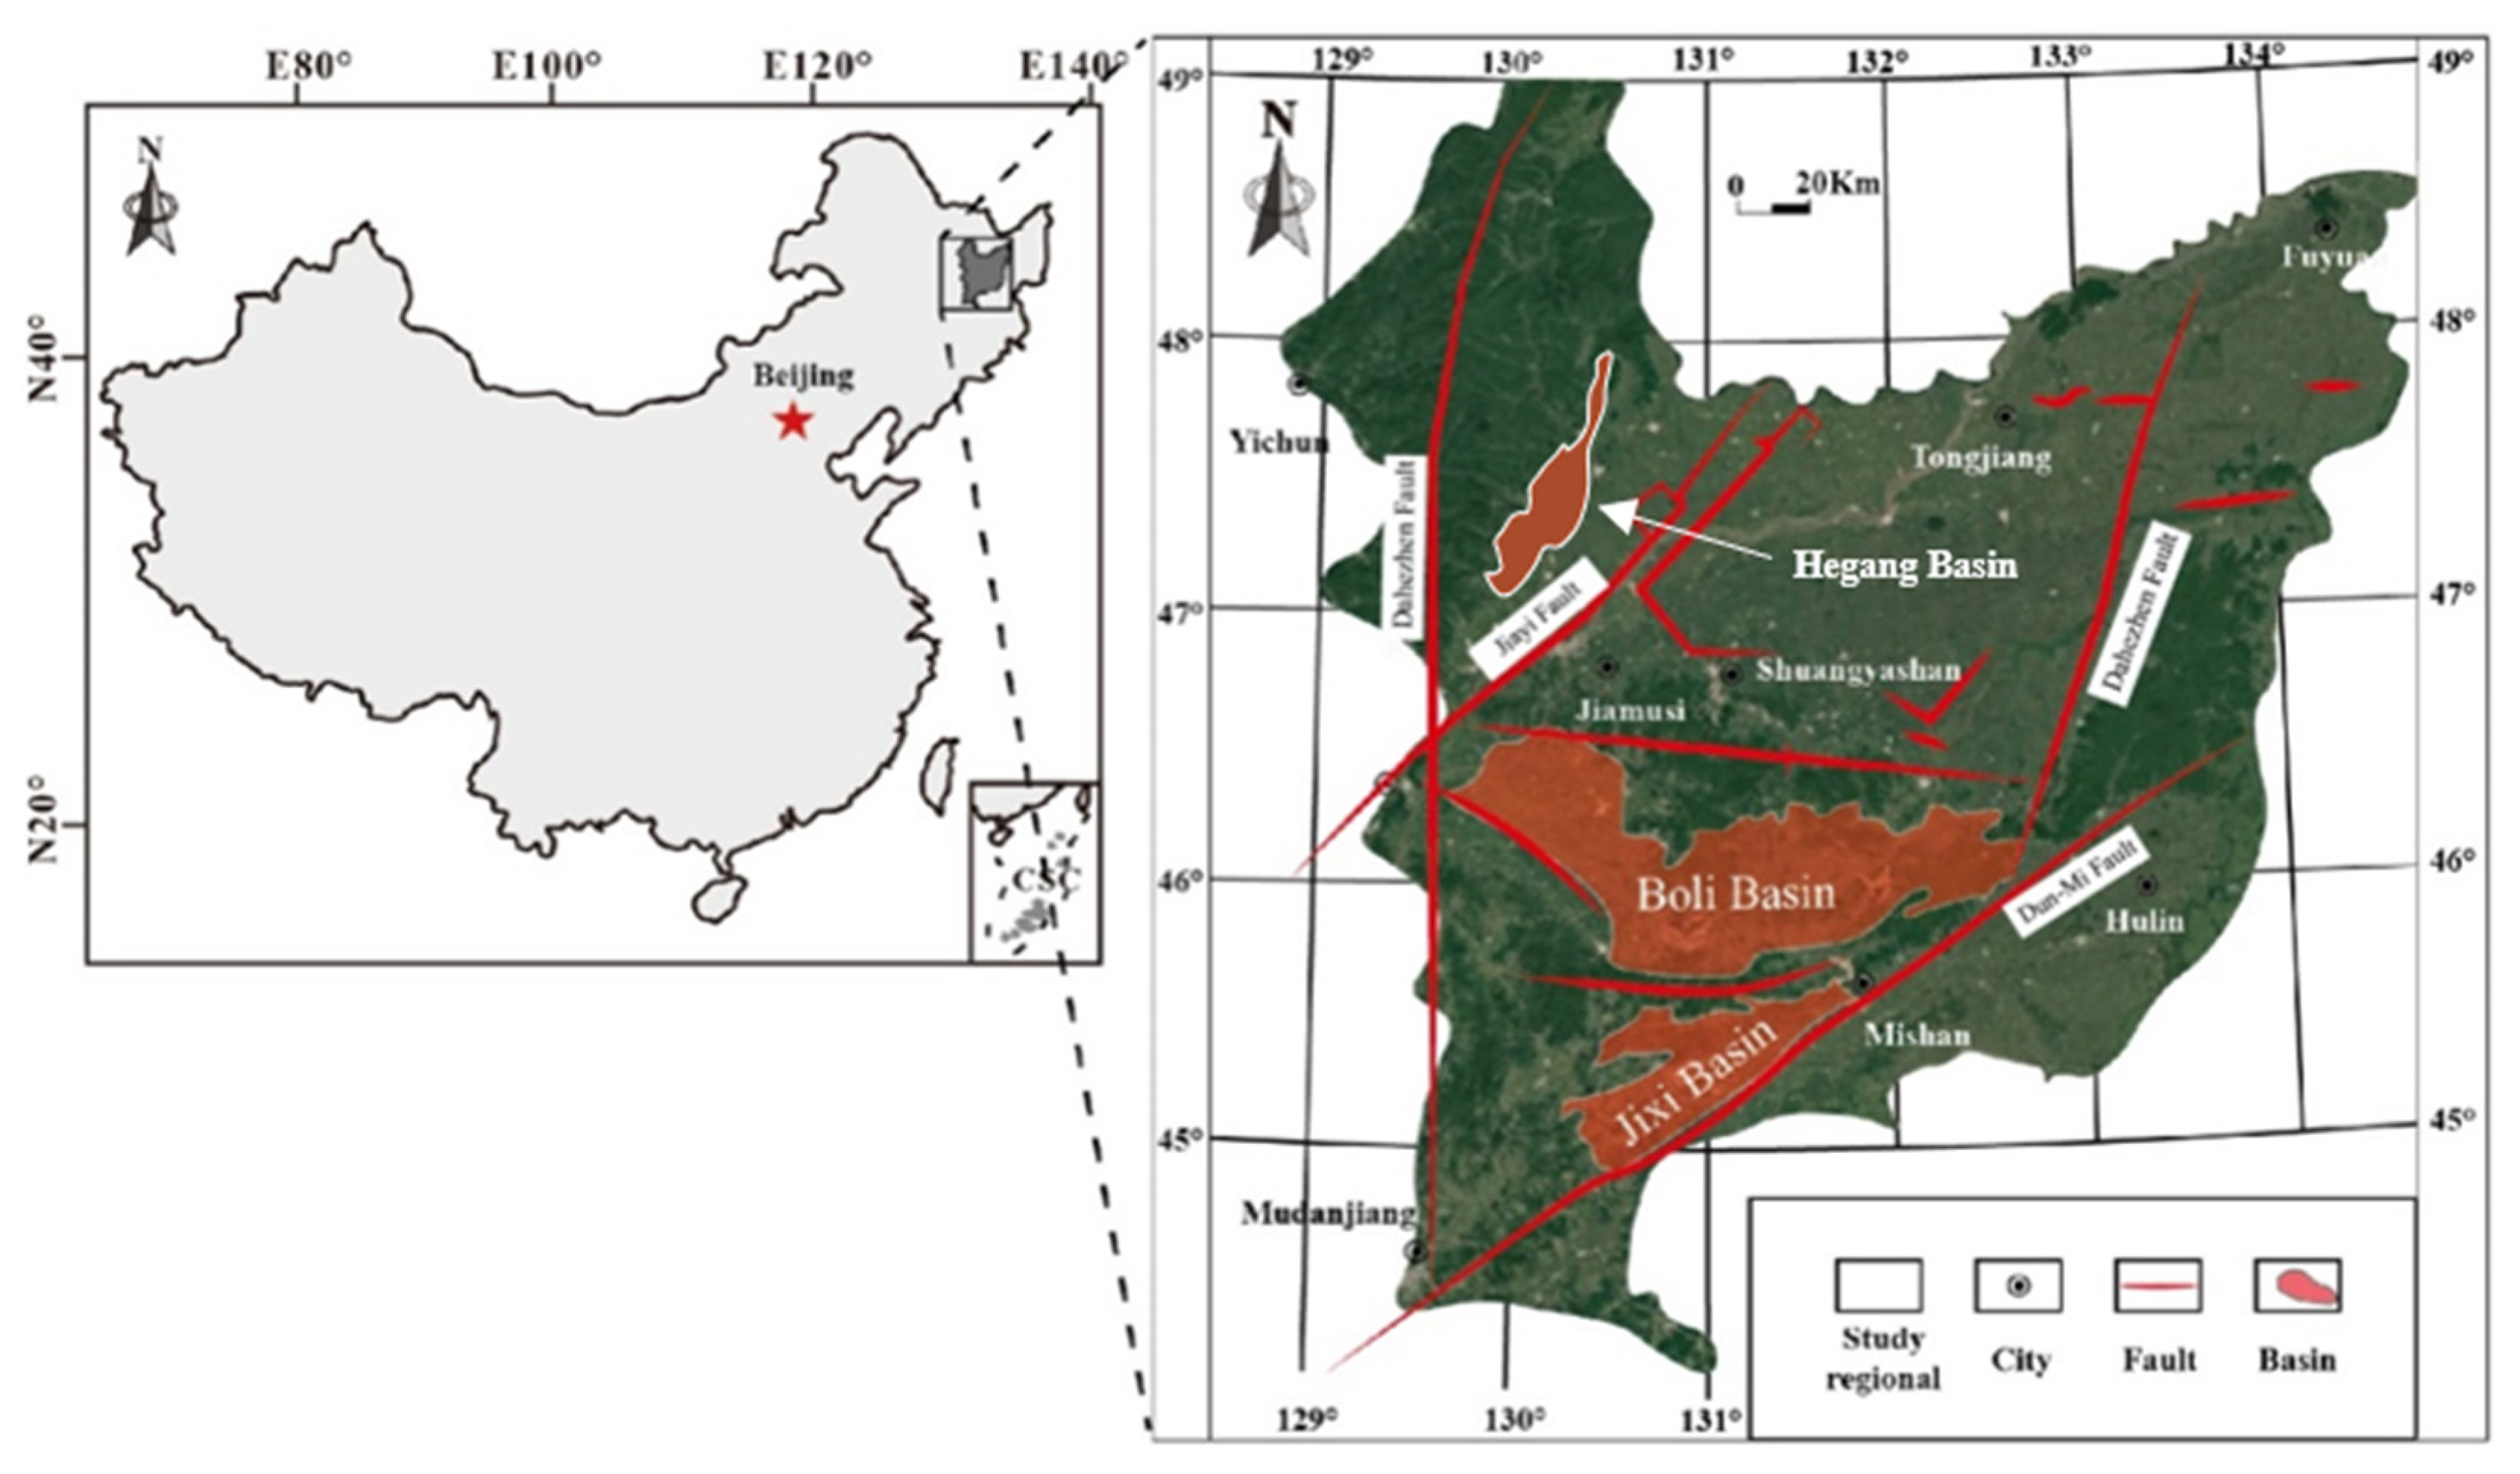
2. Geologic Settings

Sangjiang-Muling coal-bearing basins are located in Northeast China, which contain Boli basin, Suibin sag, Hegang basin, Jixi basin, and Hulin coal-bearing basin with abundant CBM resources. Sangjiang-Muling coal-bearing basins have experienced multi-stage tectonics, including the middle and late stages of Yanshanian and Himalayan movements in the evolution of the coal-bearing basins, North–South (N–S) direction Jiaying Fault to the west, the South–North (S–N) direction Dahezhen Fault to the east, and the North–East (N–E) direction Dunmi Fault to the southeast are main faults of Sangjiang-Muling coal-bearing basins, as shown in Figure 1 [24]. Early Cretaceous Chengzihe (K1c) and early Cretaceous Qihulin-Yunshan (K1q-K1y) formations are main coal-bearing strata in this area and formed at the same stage, with more than 100 coal seams; thickness of coal lines range between 0.6–2.0 m. The Chengzihe Formation is mainly composed of tufa, mudstone, sandstone, and coal seams, in which coal seam—about 70 coal seams are available with minable thicknesses less than 29.5 m. The palaeomires of these seams strata developed mainly in the lagoon-gulf and delta plain [8].

3. Sampling

A total of 38 coal samples were collected from the working faces of Jixi, Boli, and Hegang basin (Figure 1) for coal lithotype analysis, mercury porosimetry, counting microfractures with photometer microscopy. Maximum vitrinite reflectance (%R max) and maceral analyses (500 points) were carried out on polished slabs of approximately 30 × 30 mm2 in reflected optical light with a Leitz MPV-3 photometer microscope, following China standard GB/T 6948-2008 and GB/T 8899-1998, respectively [25,26]. Coal macerals were analyzed following the scheme of the International Committee of Coal Petrology (ICCP, 1998) [27]. Proximate analyses were also measured to obtain the percentage of moisture content (air-dried basis), ash yield (air-dried basis), hydrogen content (air-dried basis), and fixed carbon (air-dried basis) based on Chinese National standards GB/T 30732-2014 (Table 1)

4. Experiments and Methods

4.1. Mercury Intrusion Porosimetry

Mercury intrusion porosimetry (MIP) experiment is the most commonly used method for analyzing the pore characteristics of the porous medium, including porosity, pore structure, pore connectivity, and pore compression coefficient. Compared with the gas adsorption method, a more comprehensive range of pore sizes could be measured with MIP, including pore characteristics of mesopore and macropore that cannot be measured by the gas adsorption method. During the MIP experiment, the higher the pressure of mercury injection, the smaller the measured pore size.
Washburn equation [28], can be adopted to obtain pore radius, as follows:
r m a x = 2 σ c o s θ P T
Where P T is mercury injection pressure, MPa; σ is surface tension, set to be 0.48 J/m2; θ is the contact angle between mercury and coal, set to be 141°; r m a x is the maximum capillary radius, μm. Thus, the equation could be substituted:
r m a x = 0.746 P T

4.2. Microfractures Statistics by Optical Microscope

The microfractures of coal refer to fracture with the width at the micron scale, which links pores and cleats of coal and plays a crucial role in CBM extraction [29]. Firstly, the resin and paraffin in a certain ratio are melted together and poured into the microfractures in coal. Secondly, the preprocessed coal samples were cut and polished into 3 × 3 × 3 cm3. Finally, the microfractures of coal were counted by LABORLUX 12 POL optical microscope [30]. The microfractures could be divided into four types based on their width (W) and length (L) in this work [31]: type A (W ≥ 5 μm and L ≥ 10 mm), type B (W ≥ 5 μm and L ≤ 10 mm), type C (W < 5 μm and L ≥ 300 μm), and type D (W < 5 μm and L < 300 μm).
The microfracture frequency of coal could be determined quantitatively with the optical microscope, which is defined as the total microfracture number within 9 cm2 (fracture frequency with per 9 cm2). The microfractures morphologies involving dendritic, filamentous, orthogonal, and X-shaped, and connectivity of also can be acquired.

4.3. Coal Facies Identification

Coal petrology characteristics are an essential sign of paleo-environmental conditions; maceral composition and content depend on the plant species and their composition of the swamp water, to a large extent. Although there are some objections made by researchers, several coal facies indices have been proposed. The most commonly applied ones include tissue preservation index (TPI), gelification index (GI), wood index (WI), and groundwater index (GWI) [32,33] to reveal information on coal-forming plants, swamp water condition, and sedimentary environment during peat accumulation and classify coal facies [19,34]. These interpretations could be more accurate when coal facies indices correlate with paleontological, organic geochemistry, and mineralogical data of coal seams [35,36,37,38,39].
TPI is the percentage of tissue degradation on wood in coal-forming plants, reflecting the intensity of microbiological deterioration and demonstrating the pH value in the environment. Generally, a low pH-value environment corresponds to a high TPI value, which can better preserve the plant tissues because the weaker microbial activity leads to weak biochemical degradation in this environment [37,40,41,42]. Meanwhile, the TPI is also an essential parameter of the proportion of woody plants in the paleo-environmental. GI represents the ratio between gelation components and non-gelation components reflecting water table in the peat mire and the degree of gelification [33,35,40,43]. The higher GI, the greater the gelification and the wetter the peat mire. Vegetation index (VI) is widely used to study peat mires; however, Zhang et al. suggested the liptinite group is lacking in the macerals, the wood index (WI) was better suited than vegetable index [44]. WI was first proposed to characterize as coal-forming vegetation and the degree of plant preservation [44,45]. The GWI implies the intensity of rheotropic conditions as a ratio of the gelification and mineral matter contents in coal during the period of peat accumulation [41,46,47]. A higher GWI value indicates higher mineral content and higher water levels, which means that peat mire is rheotropic. A combined classification from pervious scholars for coal facies is used in this study [19,34]: dry forest swamp (0 < GI < 1 and TPI > 1), wet forest swamp (GI > 1 and TPI > 1), rheotropic environment (GWI > 1), mesotrophic environment (0.5 < GWI < 1), ombrotrophic environment (GWI > 1) [41].
The four facies indexes could be calculated by the following formulas [19]:
TPI   =   Telinite   +   Collotelinite   +   Semifusinite   +   Fusinite Collodetrinite   +   Macrinite   +   Inertodetrinite
GI   = Vitrinite   +   Macrinite Semifusinite   +   Fusinite   +   Inertodetrinite
WI   = Telinite   +   Collotelinite Collodetrinite   +   Vitrodetrinite
GWI   = Gelinite   +   Corpogelinite   +   Minerals   +   Vitrodetrinite Telinite   +   Collotelinite   +   Collodetrinite

5. Results

5.1. Standard Coal Qualty Parameters

The mean maximum vitrinite reflectance of 38 coal samples are in the range of 0.49%–1.6%, and could be divided into two coal ranks: low-rank coals (%R max < 0.65) and medium-rank coals (0.65 < %R max < 1.9). Due to the regional magma thermal metamorphism, metamorphism occurs to varying degrees in various regions. Among the target basins, the coal samples from Boli basin have a relatively high maturity with %R max more than 1, and the coal samples from Hegang and Jixi basin have low maturity.
The experiment results showed that the coal composition and proximate analysis content were significantly difference as shown in Table 1. The selected coal samples have carbon contents of 57.48%–85.14% (air-dried basis), hydrogen of 3.42%–7.76% (dry basis), moisture of 0.86%–2.06% (dry ash-free basis) and ash content of 4.41%–30.67% (air-dried basis). The results show that for coal from Sangjiang-Muling’s coal-bearing basins, and with a change in the ash yield, the porosity experienced increases at first and then declines.

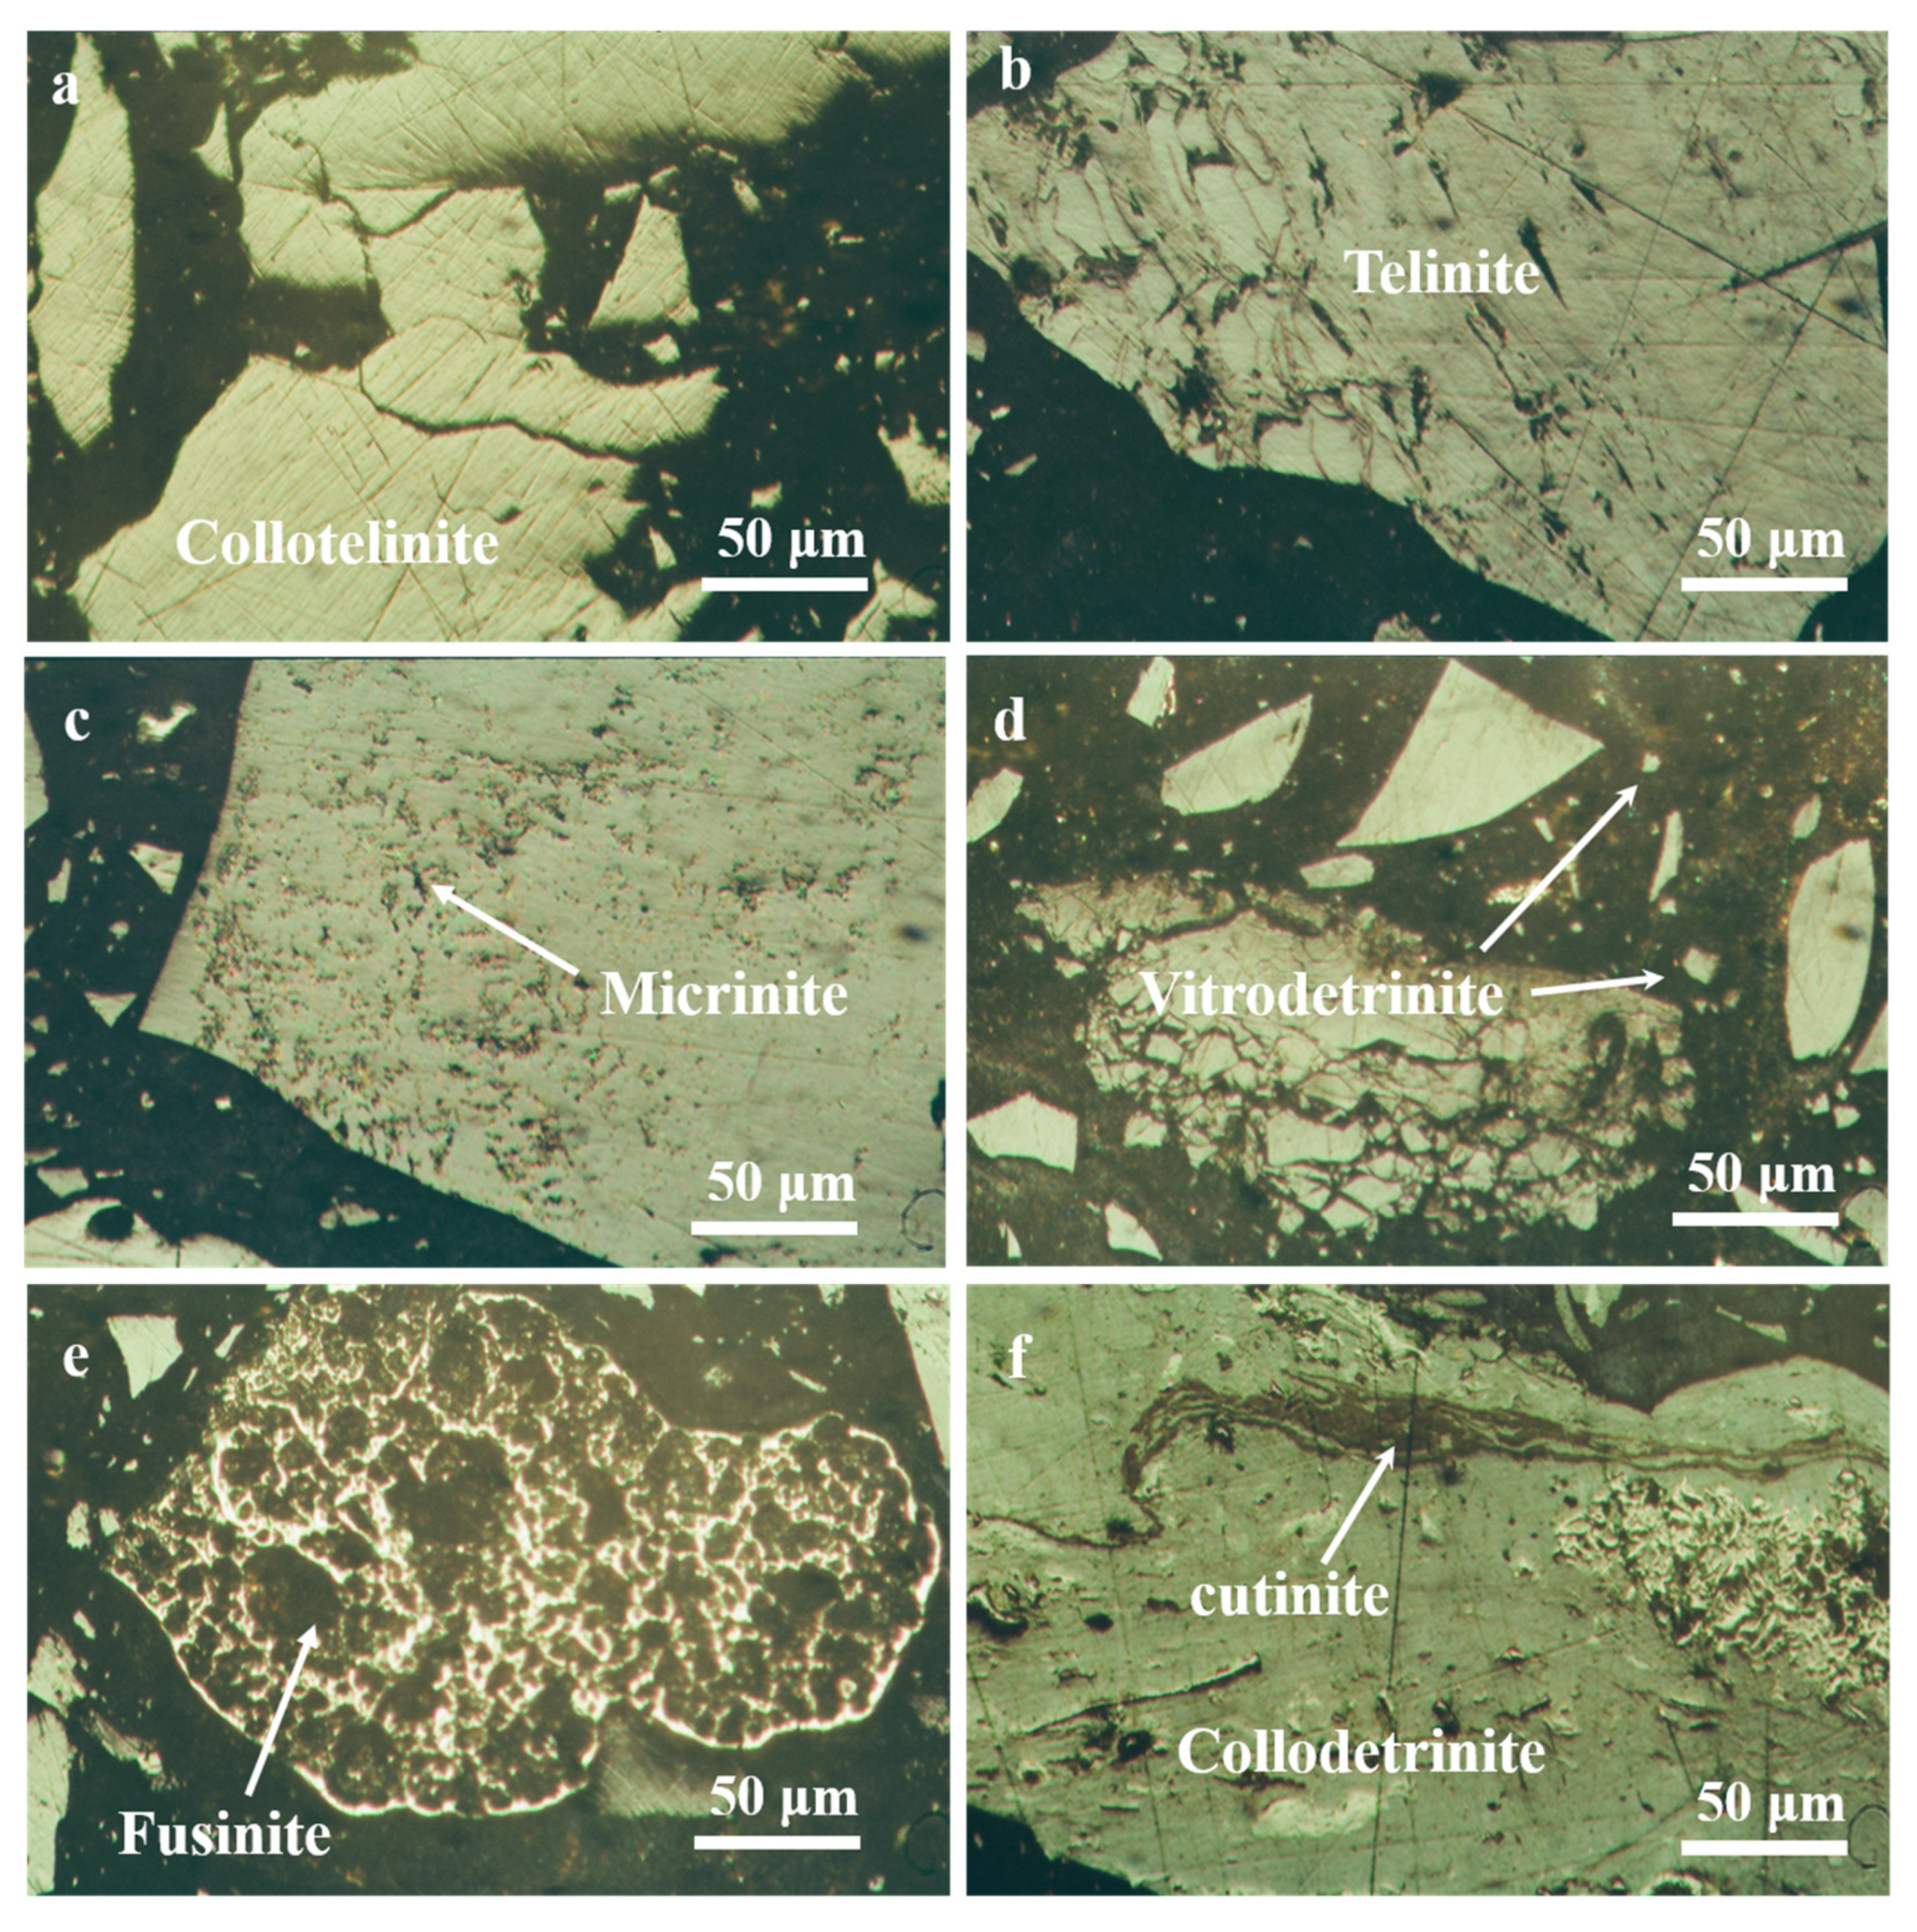
5.2. Maceral Compositions

The volume contents for vitrinite, inertinite and liptinite varies from 34%–95.1%, 1.3%–62.7%, 0.7%–18.2%, respectively. It is noticed that the volume of liptinite decline to 0 when the mean maximum vitrinite reflectance is over 1.4%. It is expectable to not identify liptinite with increase of coal rank towards anthracite. The visual features of liptinite could be similar with inertinite after 1.4 and being absent in high-rank coals. Vitrinite is a significant maceral in coal with averaging 82.33 vol.% (vol., volume fraction) as shown in Figure 2, whereas for sample NE19, the percentage of inertinite is as high as 62.7% and is the main maceral of coal. In the vitrinite group, the most abundant collotelinite vary from 42.3%–90.5%, with averaging 71.41 vol.%, and followed by collodetrinite contents, vary from 0.2–12.1%, with averaging 7.75 vol.%. The mineral content of coal is composed primarily of clay and pyrite with range of 0.2% to 8.3% in volume fraction and was relatively less in the coal samples NE13 and NE7.

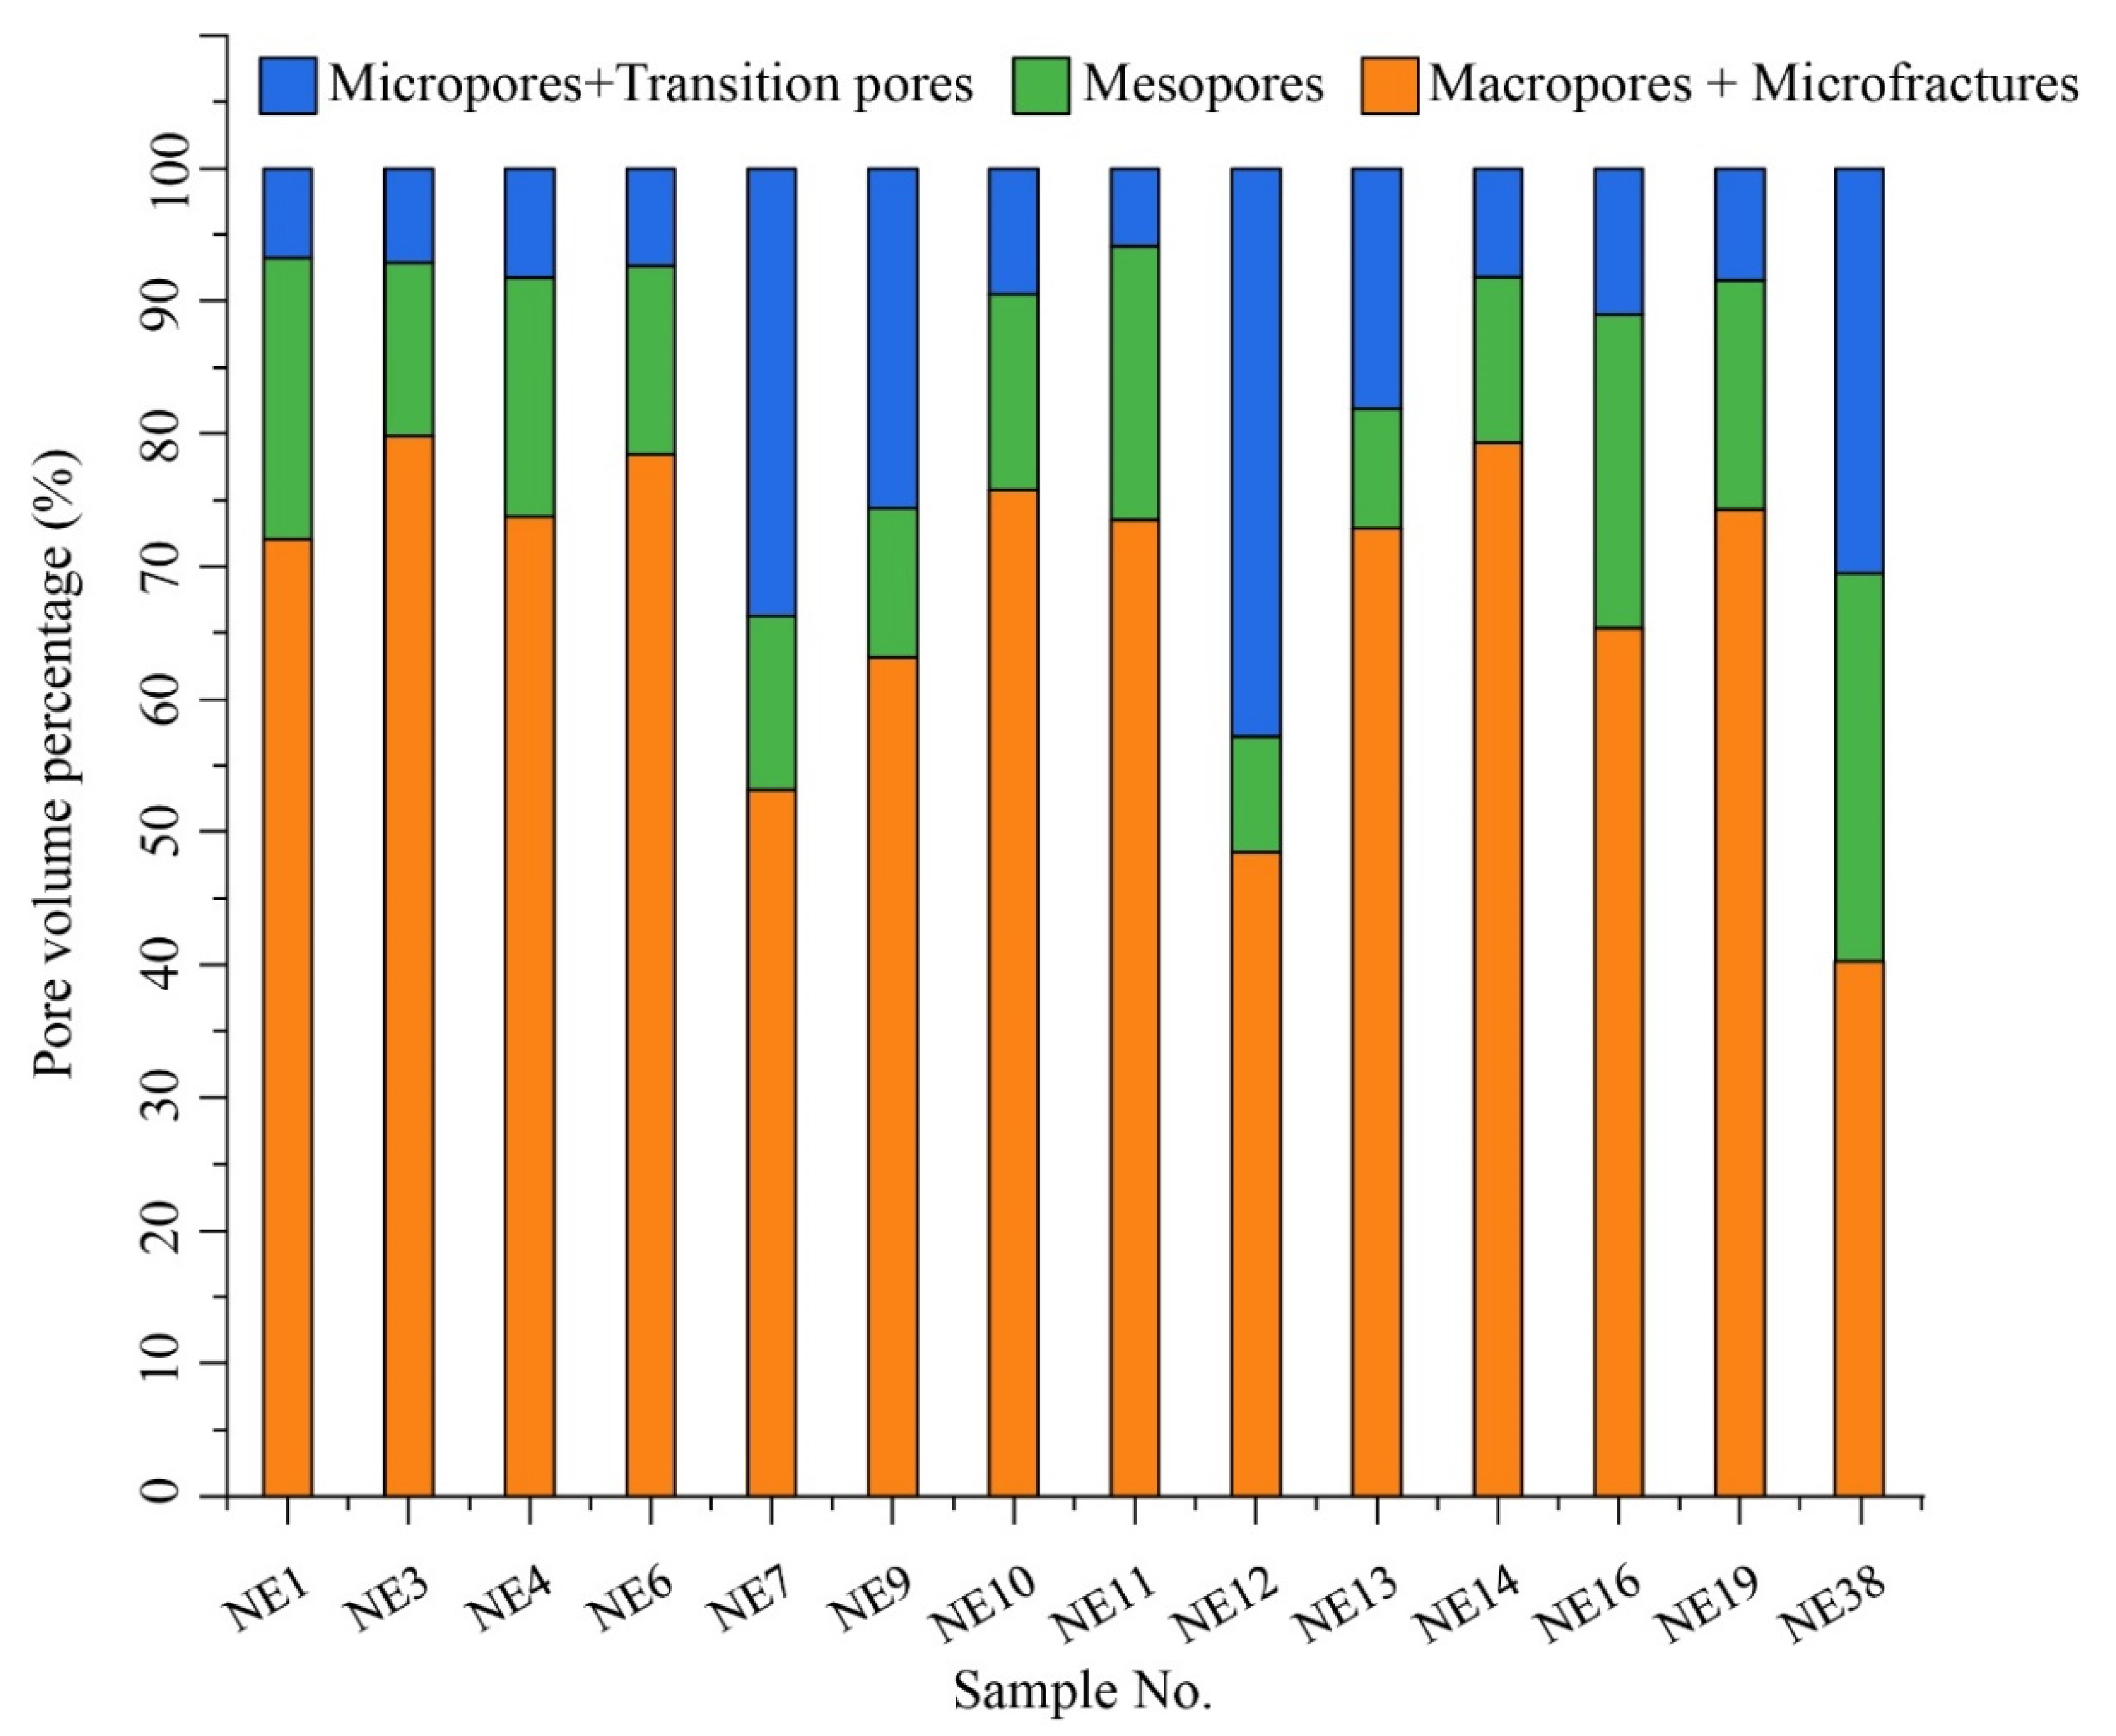
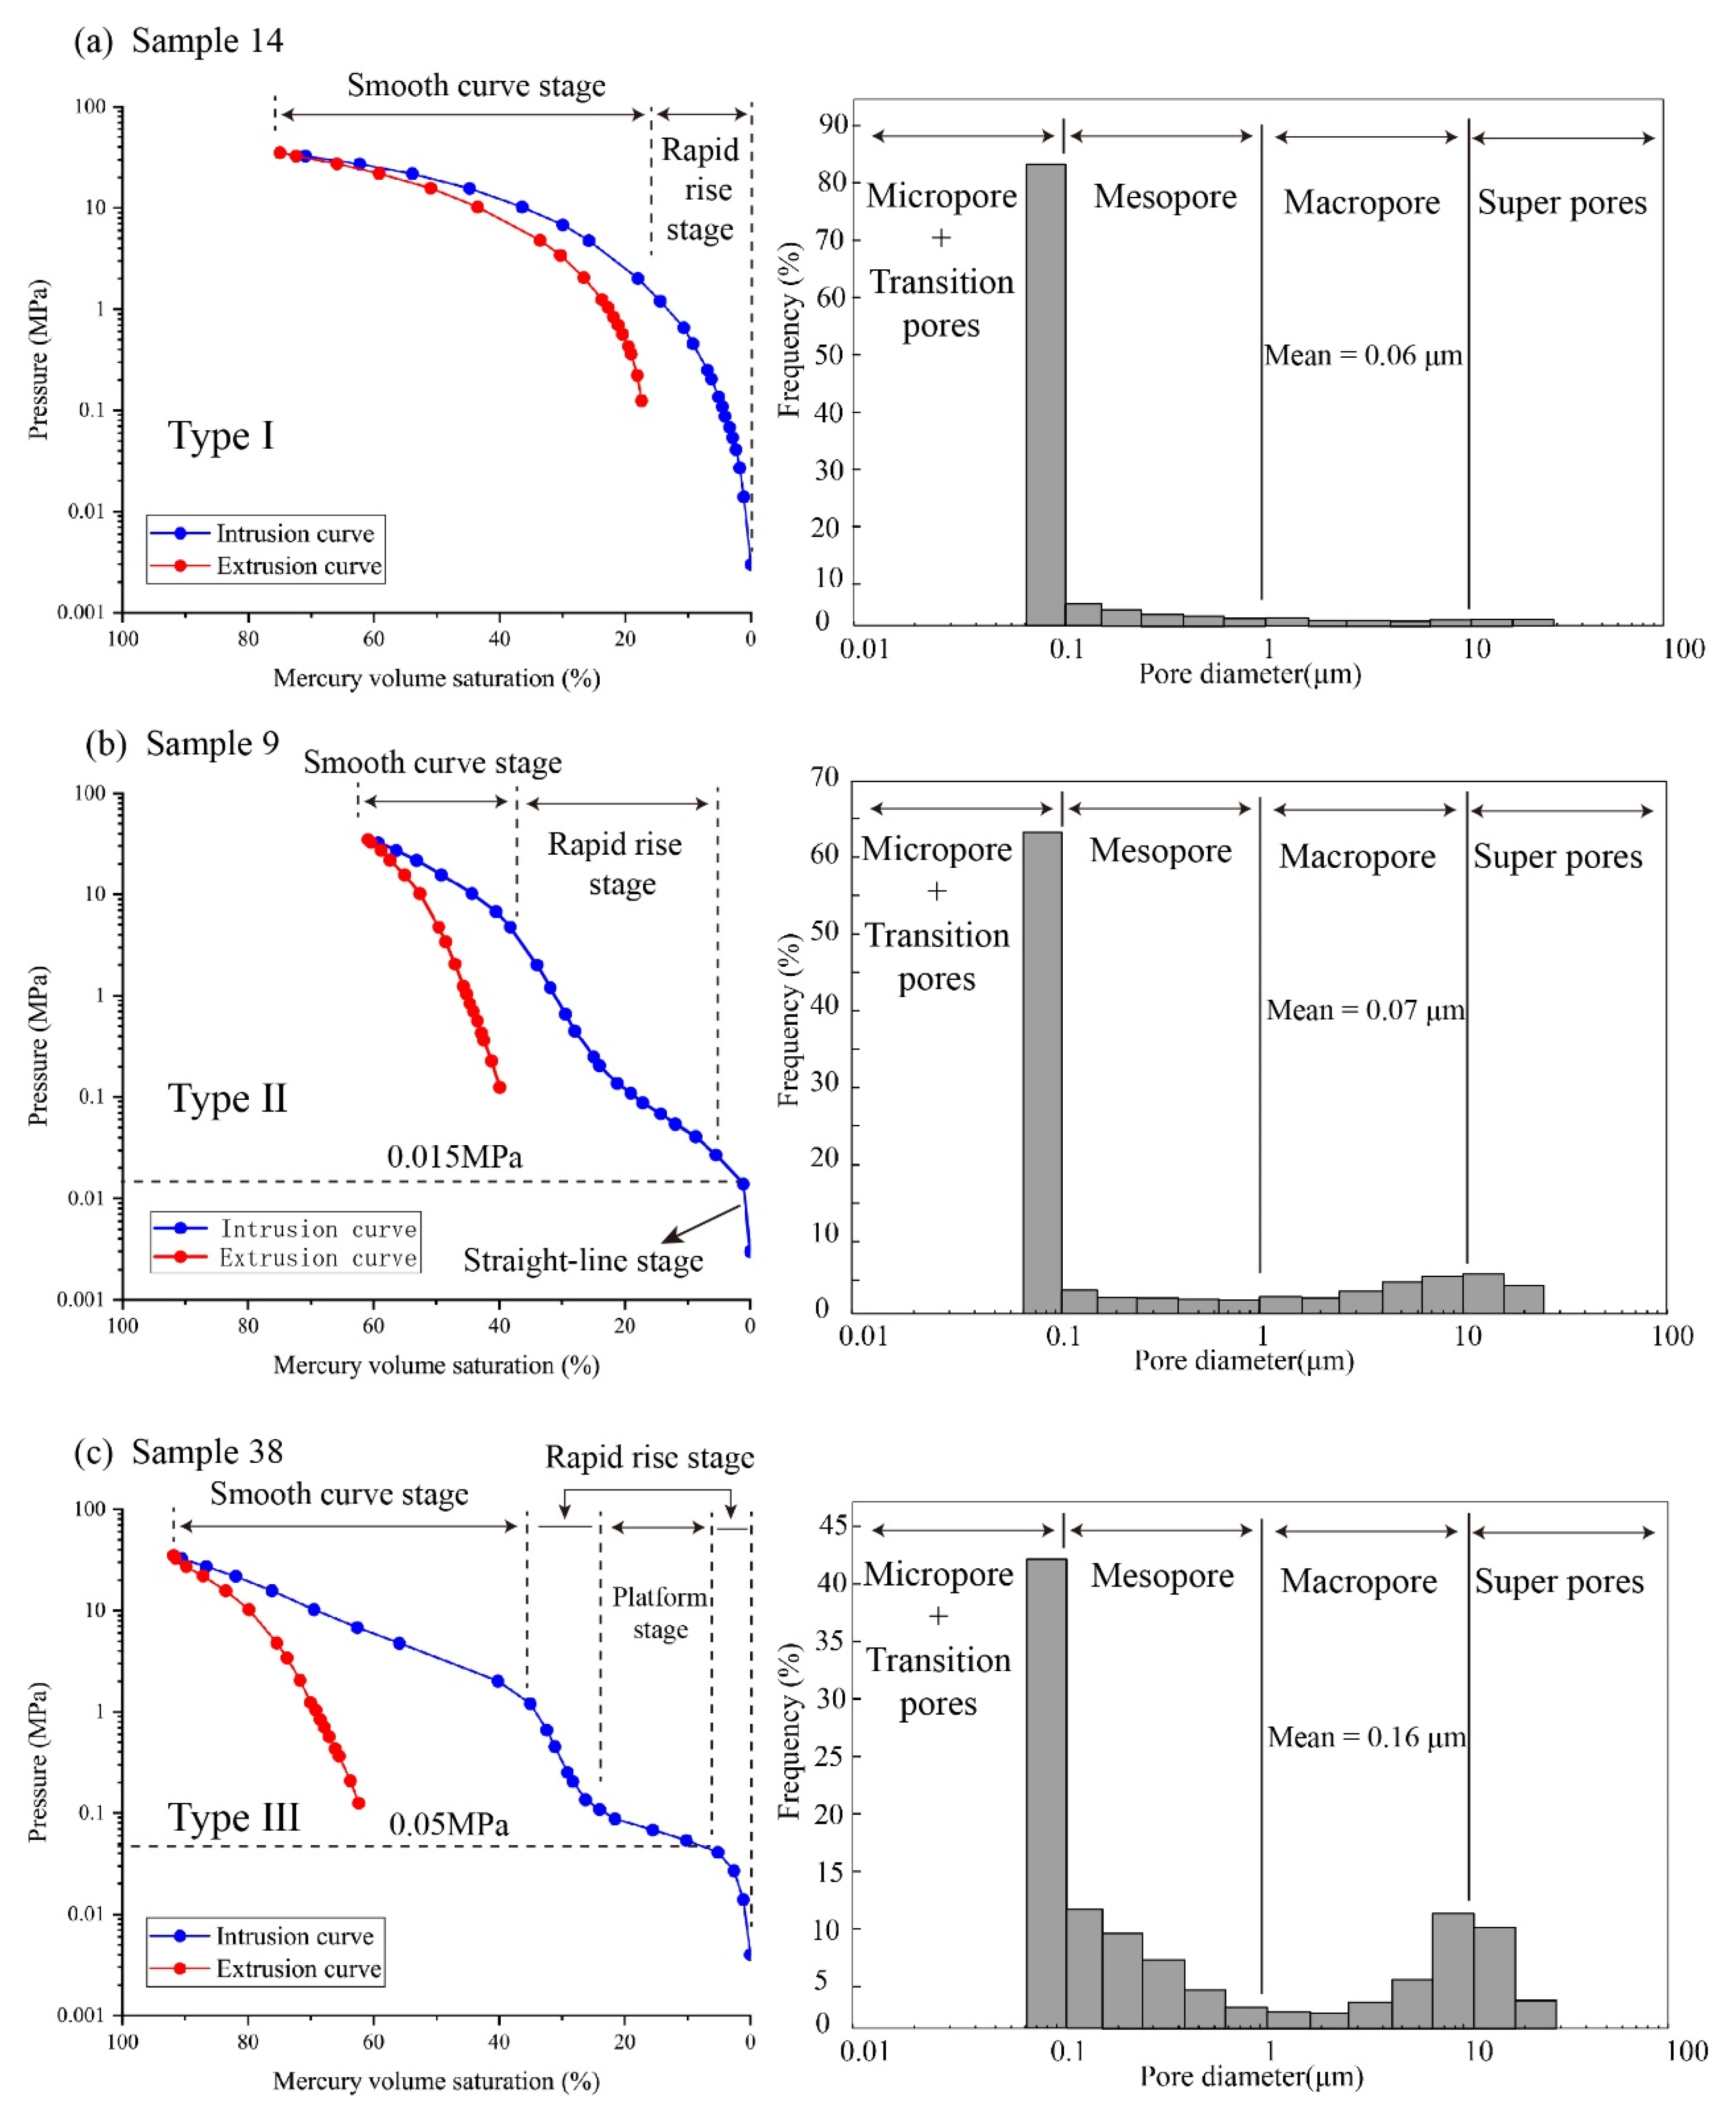
5.3. Pore Characteristics

In the MIP experiment, different mercury intrusion and extrusion curves illustrate the connectivity, pore size, and distribution of coal reservoirs [48]. Pores characteristics of various coal samples with MIP are presented in Table 2. The porosity and the total pore volume are 1%–7% and 8.23–11.7 cm3, respectively. Pore-throat diameters vary from 0.03 μm–0.36 μm and the corresponding average pore-throat diameter is 0.116 μm. Figure 3 presents the significant heterogeneity in pore size distribution (PSD), the proportion of micropores and transition pores (<100 nm) for most coal samples are higher than mesopore and super pores/microfractures, except samples NE12 and NE38. The average percentage of pores with diameters less than 100 nm is 68.25%, the pores with diameters larger than 100 nm account for 31.75%.
The tendency of mineral contents vs. porosity was similar to that ash yield vs. porosity (Figure 4). Porosity increase, as first, is mainly because space is created between minerals for low mineral content, with more mineral, and a portion of space is filled with clay and maceral.
Three types of mercury injection curves were classified of 14 coal samples as shown in Table 2. Type Ⅰ is represented by sample NE14, as shown in Figure 5a. The mercury injection curve is divided into two distinct stages, including rapid rise stage and smooth curve stage. The rapid rise stage in low-pressure conditions indicates that—with the increment of pressure— mercury is difficult to inject into the pore of coal. When pressure increases from 0 MPa to 1 MPa, the mercury volume saturation shows less change with rising from 0% to 20%; after the pressure is greater than 1 MPa, the mercury injection is relatively stable, and the injection curve is relatively smooth. This type of mercury injection curve has high mercury saturation and high efficiency of mercury withdrawal with 80% and 81.25%, respectively, which indicates micropores and transition pores are dominated based on Equation (1), meanwhile, the pores are well connected due to the high efficiency of mercury withdrawal [49]. Type Ⅱ is represented by sample NE9 with three stages—straight-line stage, rapid rise stage, and smooth curve stage, as shown in Figure 5b; for this type, the proportion of adsorption-pores, calculated by MIP, are nearly 63.12%, and macropores and microfractures are better developed than type Ⅰ. Obviously, the mercury injection curve for type Ⅲ has four stages, including the rapid rise stage, platform stage, rapid rise stage, and smooth curve stage. Additionally, mercury intrusion saturation over 90% and the extrusion of mercury saturation is relatively low, only 32.1%, which indicates the pores are not well connected [49]. There are two rapid rise stages so that micropores and transition pores are not well developed, at only 40.42%, and two peaks of pore size distribution could be found in Figure 5c.

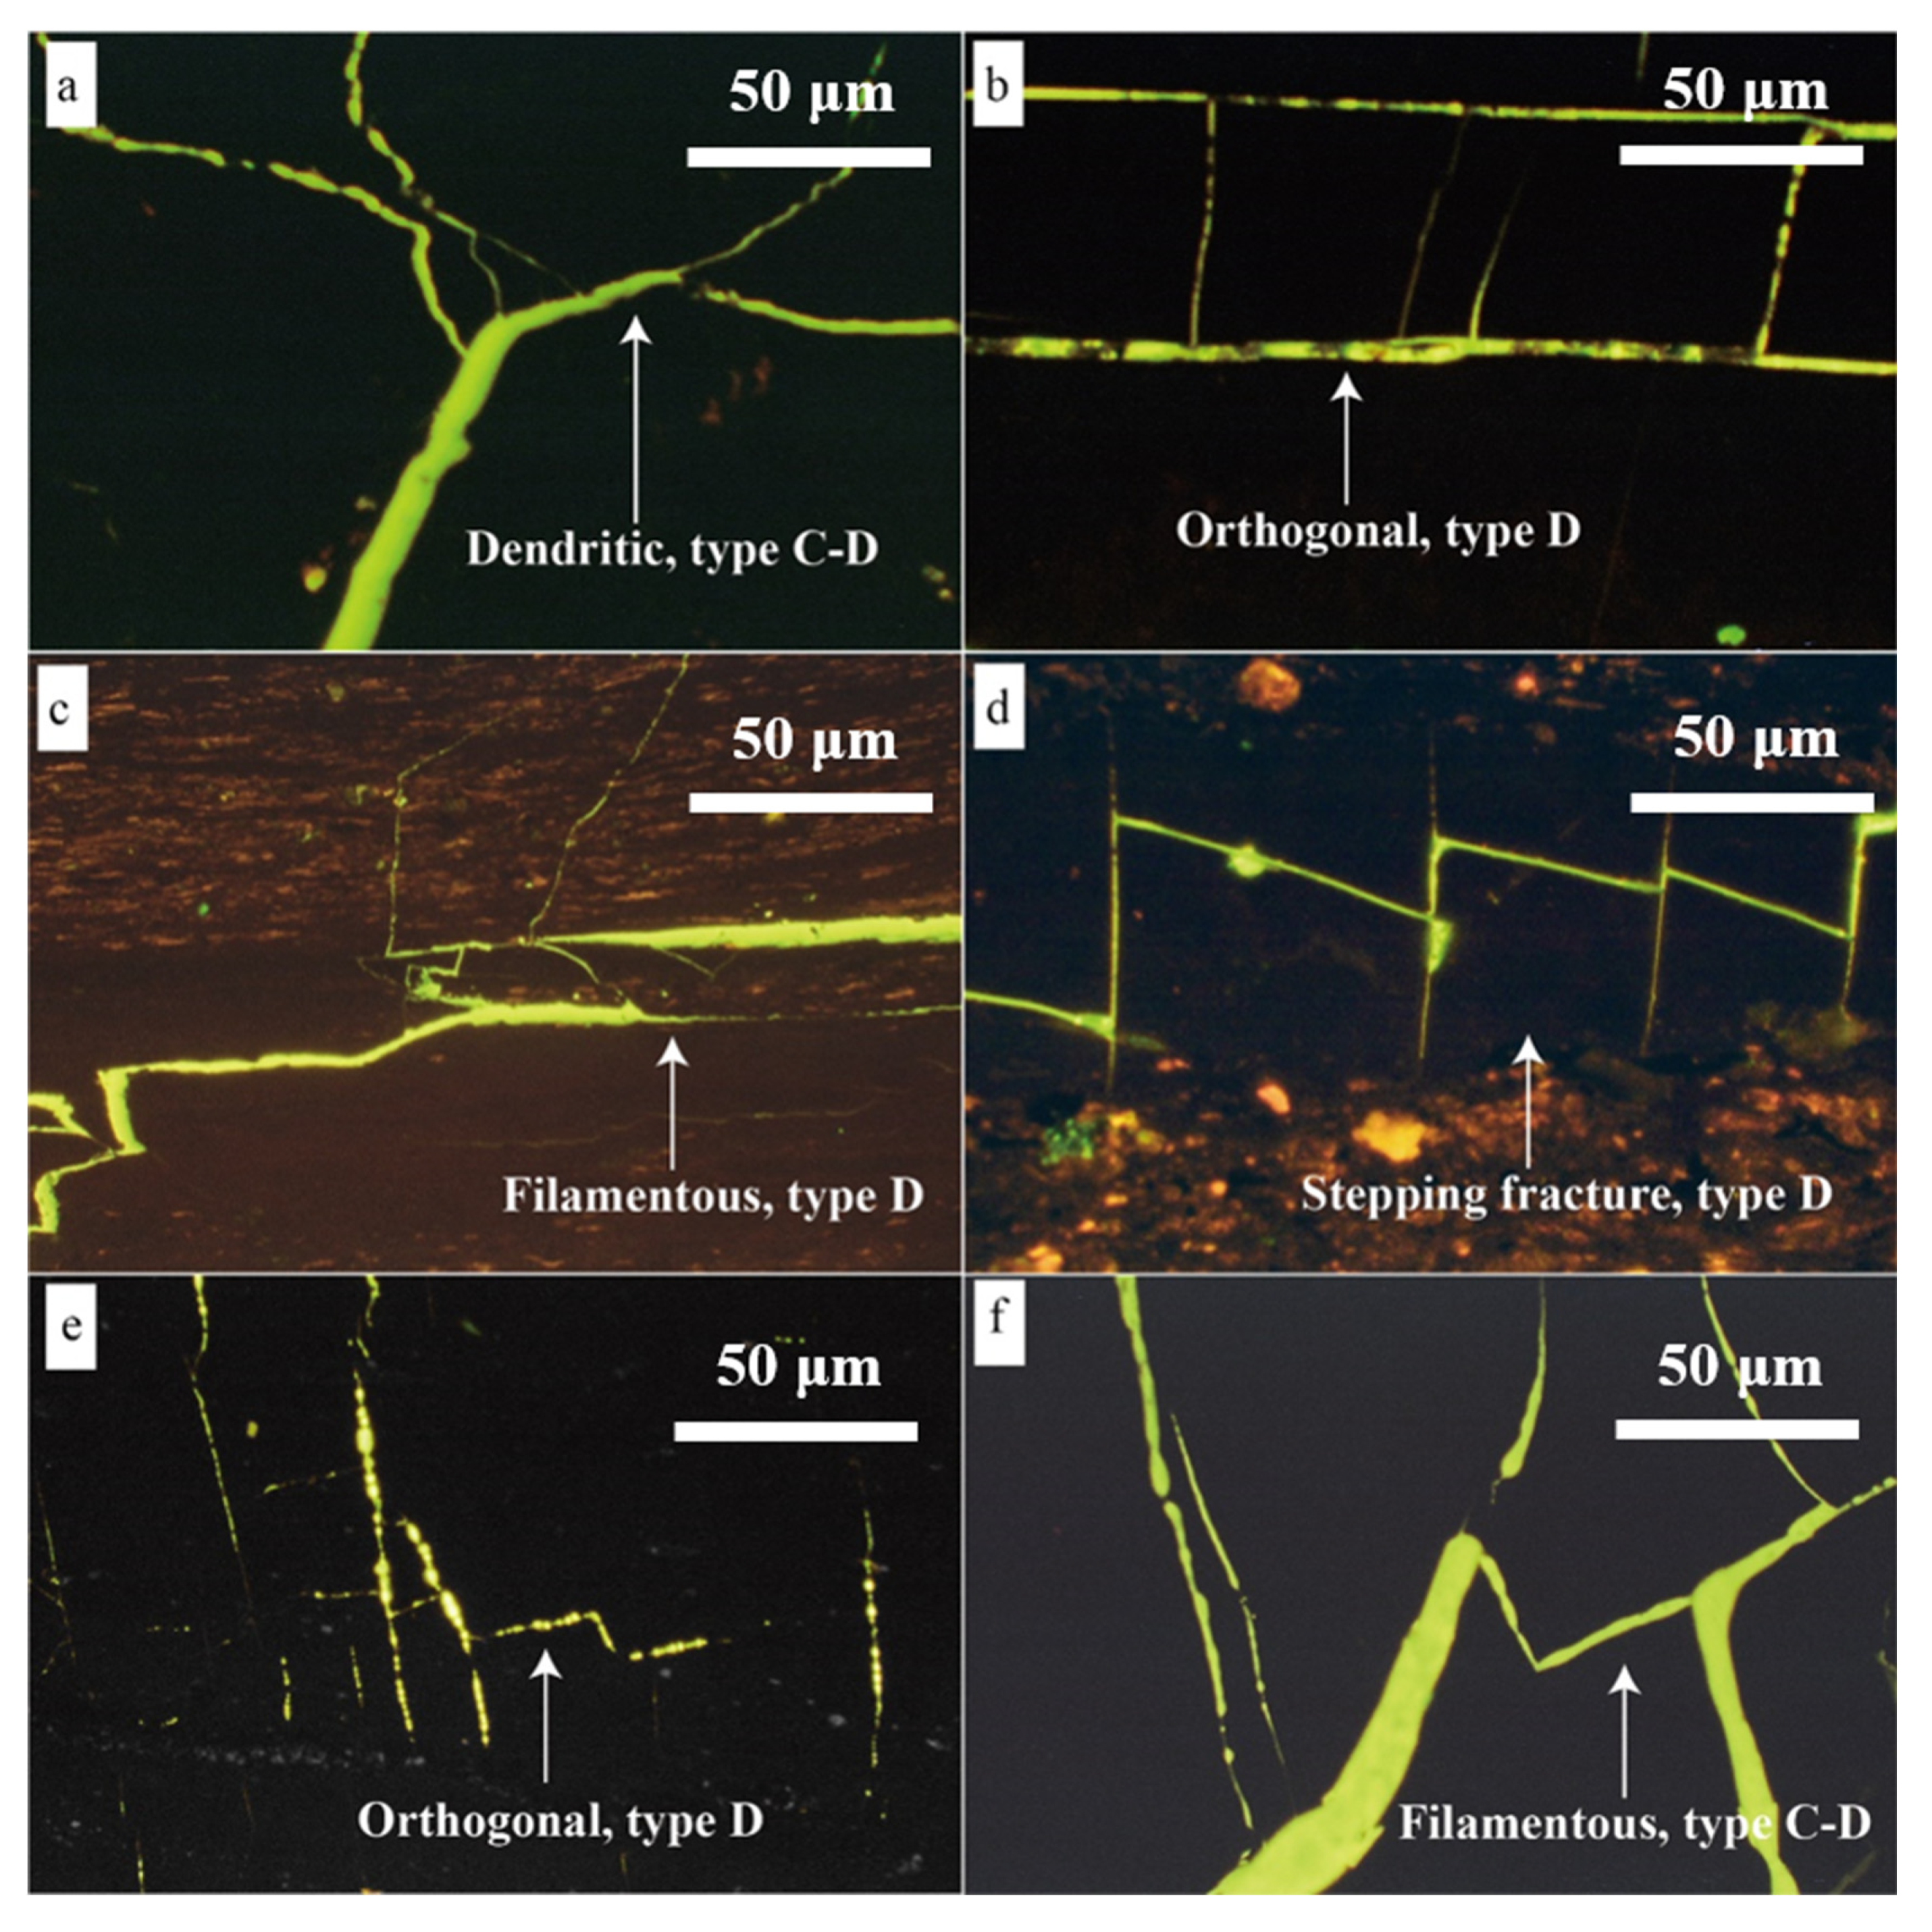
5.4. Microfracture Characteristics

The microfractures frequency and morphology characteristics of different coal samples are shown in Figure 6 and Table 1. Type D microfractures are most abundant and display the best-developed, accounting for more than 70% of the total microfractures in the Sangjiang-Muling coal-bearing basins, which has a wide gap of density, ranging from 12 to 312 per 9 cm2 with an average number of 58.1 per cm2, filamentous, orthogonal, and X-shaped, and are the dominant morphology for type D microfractures (Figure 6.). Type C microfractures are, secondly, developed with a range from 3 to 60 per 9 cm2, with an average number of 19.8 per 9 cm2. While type A and B microfractures are poorly developed, accounting for less than 2 per 9 cm2; moreover, some coal samples did not develop this kind of fracture (such as samples NE5, NE6, NE7), which indicates it is different for CBM to migrate from pores to microfractures and cleats.

6. Discussions

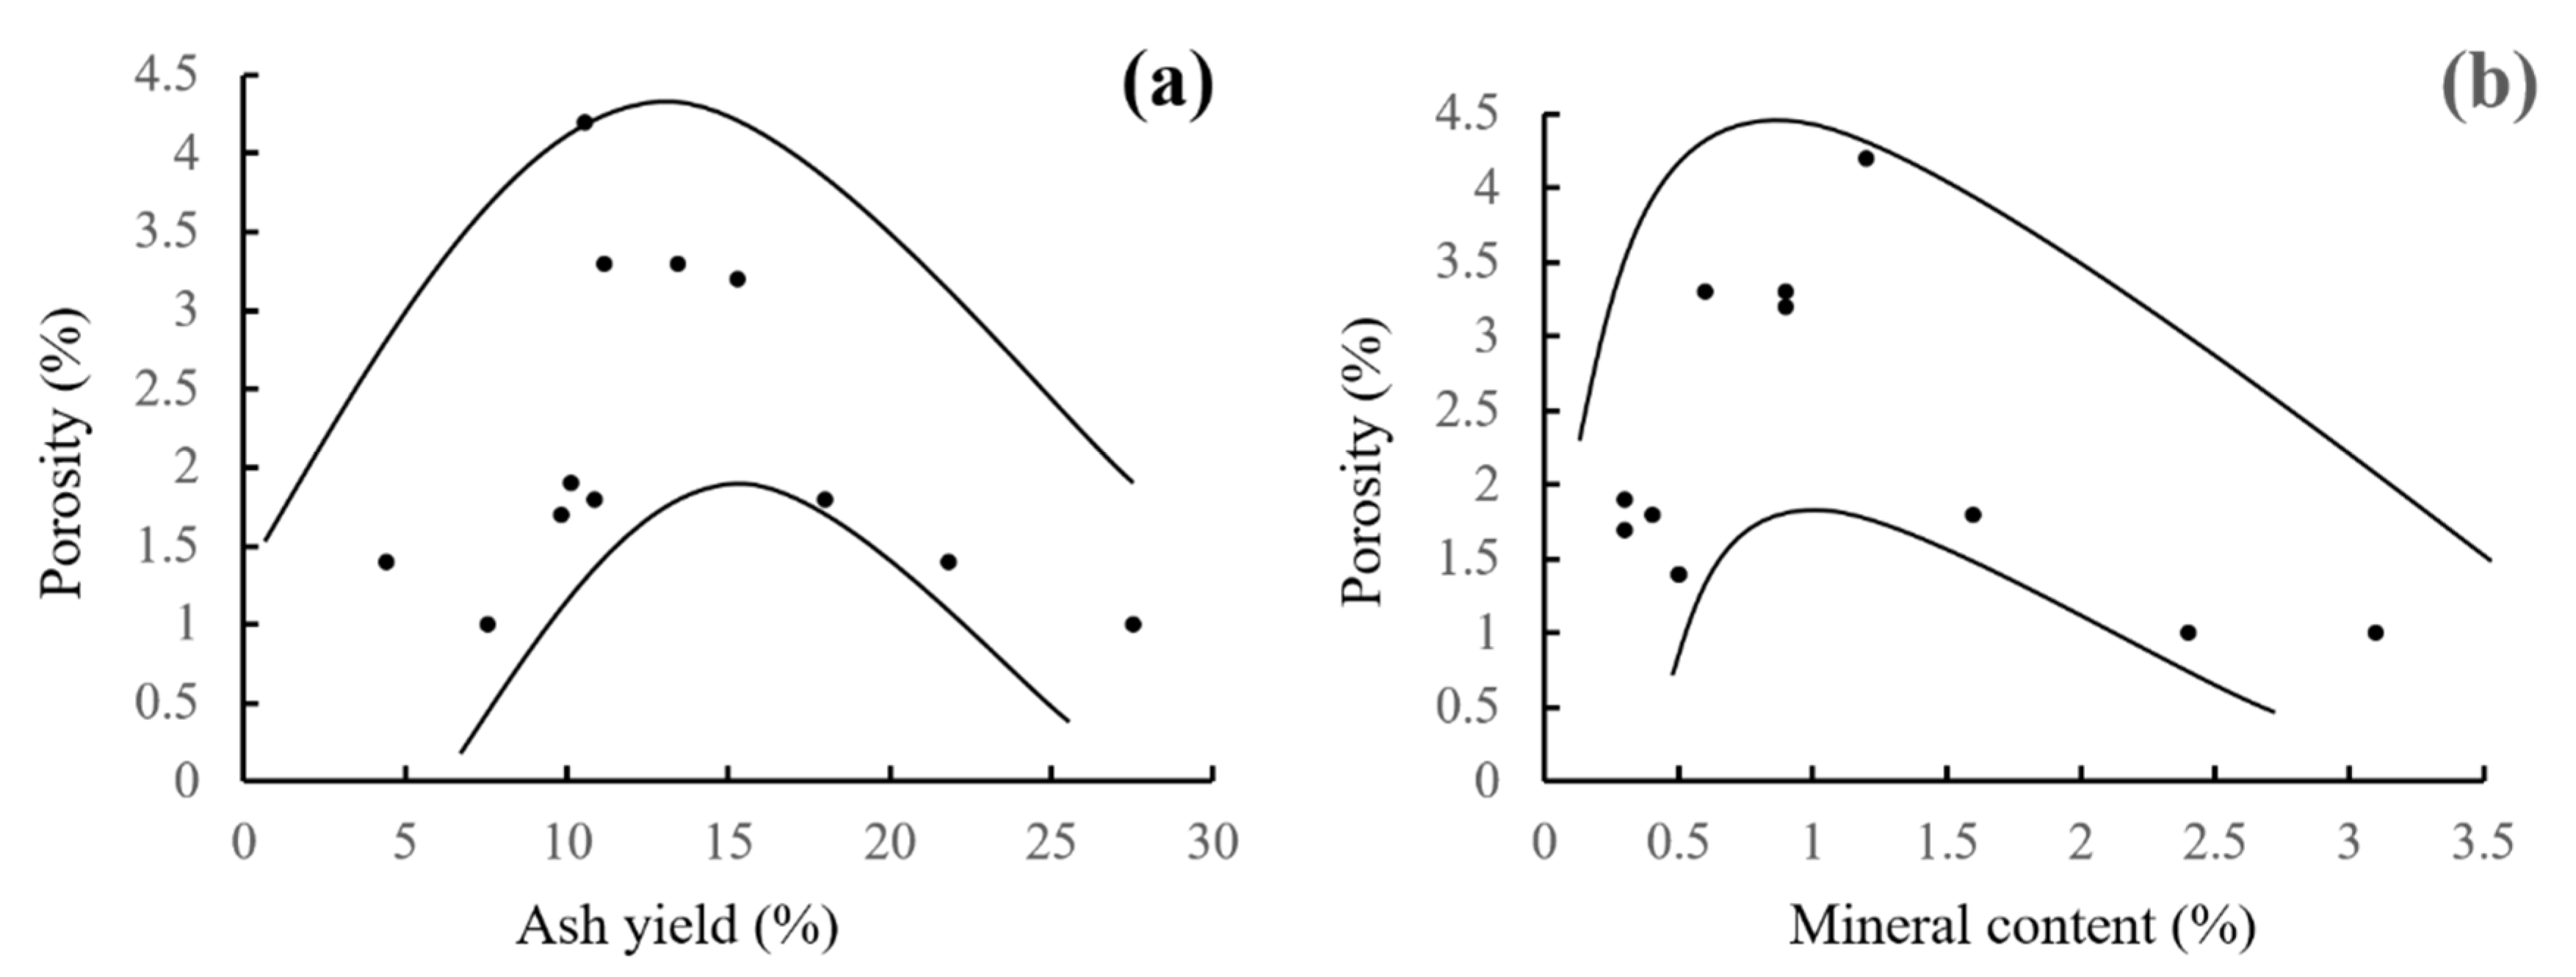
6.1. Effects of Coal Facies on Pore-Fracture Performance

6.1.1. Characteristics of Coal Facies

The results of TPI, GI, WI, and GWI are calculated in Table 3 from the formula in Section 4.3, as shown in Table 3. To note, in order to reflect peat accumulation environment, only syngenetic minerals are used for calculating GWI. The TPI and GI value in this block is generally more massive than the previous, with TPI range from 0.3 to 47 and GI range from 1 to 106, which indicates that woody plants are dominant and high in preservation potential in the paleo-environment [37,38,41,50]. Almost all of the samples are located in the wet forest swamp region with pervious methods in Section 4.3. For more details of coal facies, Q-cluster analysis (farthest neighbor), GI-TPI, and WI-GWI plates were applied. Q-cluster analysis is a multivariate statistical analysis method that classifies the objects with the similar relationship of the research object. It can classify similar samples based on the observation parameters (TPI, GI, WI, and GWI in this work) of the samples and the degree of similarity between specific calculated samples [51]. Three various coal facies (Coal facies 1, Coal facies 2, and Coal facies 3) were distinguished by Q-cluster analysis, as shown in Figure 7. Two superclusters (Coal facies 1 + Coal facies 2 and Coal facies 3) could be observed in Figure 7. The main reason of the differences between two superclusters is the different GI of coal samples. GI of two superclusters are in the range of 1 to 24.7 and 20 to 106, respectively. For the first superclusters, the TPI of Coal facies 1 are relatively low, varying from 0.3–11, and the TPI of Coal facies 2 are between 18 and 47. Furthermore, ash yield and vitrinite content of Coal facies 3 is higher than Coal facies 1 and Coal facies 2.
Combined with the distribution characteristics of coal samples in the GI-TPI diagram (Figure 8), the Q-clustering results could be adjusted appropriately on the basis of the Q-cluster method. The ash content of sample NE26 is significantly higher than other samples in coal facies 1 (Table 1), which reflect severe water dynamic conditions and low water table; thus, sample NE26 was reclassified into the Coal facies 3. Three types of coal facies could be denominated as Type Ⅰ, Type Ⅱ, and Type Ⅲ, (Table 3, Figure 8). Three types of coal facies are the upper delta plain wet forest swamp, lake shore coastal wet forest swamp, tidal flat wet forest swamp, respectively.
Lake shore coastal wet forest swamp is characterized by high water level and good tissue preservation, the dominant source for the peat is herbaceous arborescent assembly of plants in peat formation, this facies has low TPI (1 < TPI < 15), low GI (1 < GI < 25), low WI (1 < WI < 15), and low GWI (<0.1). The upper delta plain wet forest swamp is dominated by woody plants with the high water table and good tissue preservation, high TPI (>15), low GI (1 < GI < 25), high WI (>40), low GWI (<0.1). The characteristics of tidal flat wet forest swamp are low water table and high gelification, in such conditions, semi-bright coal and bright coal are the main lithotypes, and the ash content of coal is high, with more than 20% due to the tidal action. This facies has high TPI (>15), high GI (>25), high WI (>40), and low GWI (<0.1).

6.1.2. Effects of Coal Facies on Pore Development

The paleo-environment governs the degree of pore development by affecting the petrographic composition and content of macerals [12,52,53,54,55,56,57,58]. Zhang et al. studies have found that the macro- and mesopores are closely correlated to TPI with the R-cluster analysis method, while there are no data to support the specific relationship between pore and coal facies [20]. As shown in Figure 9(a2,a3,c2,c3), there is obvious relationship between coal facies and pore development. As the value of TPI and WI increased, the percentage of micropores and transition pores (<102 nm) increased, and negative correlation between TPI or WI and macropores could be observed, while there was no significant correlation between pore size between 102 nm and coal facies index, pore size between 103 nm and and coal facies index. The origin of macropore, beginning with the space in residual cell structures of precursor plants, or among mineral particles, high TPI, meaning a rapid peat accumulation process with a short effective time of gelification, plant cell structures, are well preserved, and poorly developed macropores of coal. Therefore, the proportion of macropores of coal is highly correlated to the TPI, and TPI could indicate the seepage characteristics of coal.

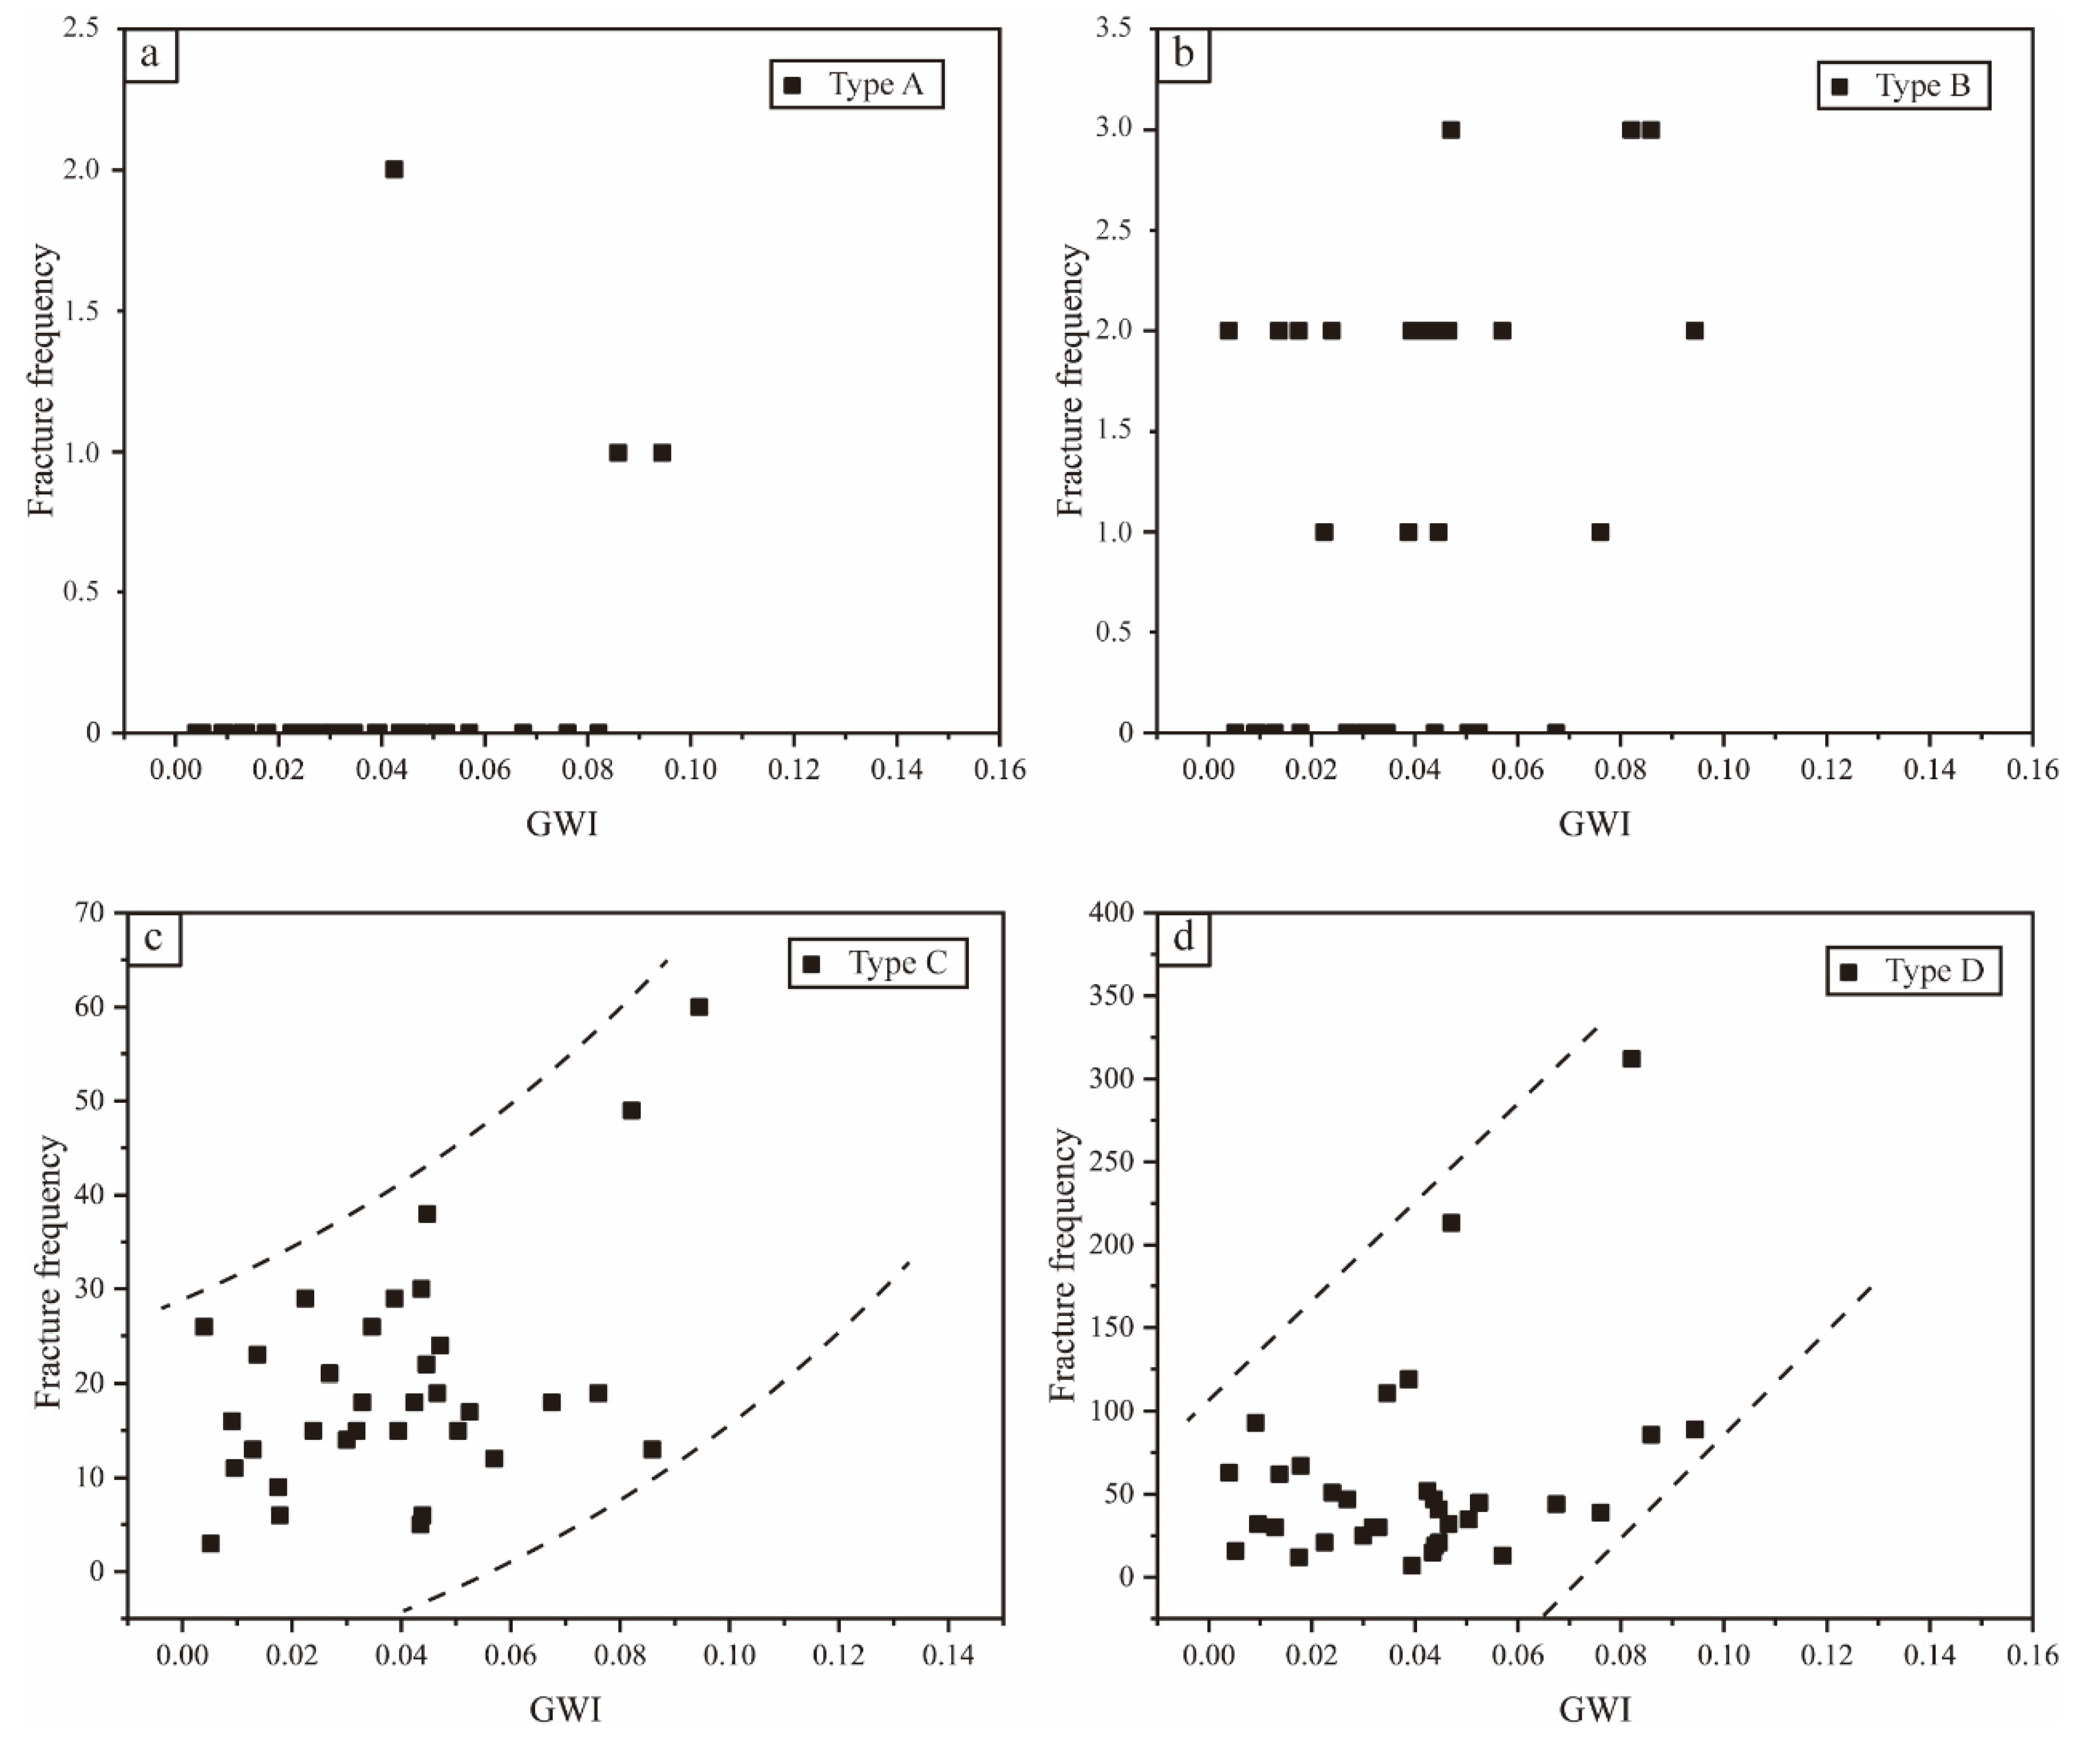
6.1.3. The Effects of Coal Facies on Fracture

Figure 10 shows the correlation analysis between coal facies index (GWI) and various types (Type A, B, C and D) of fractures for all coal samples. For type A and type B fractures, which are slightly developed in the coal samples with a range from 0 to 2 and 0 to 3 per 9 cm2, respectively, and these two types of fractures do not have any trend with the GWI. Fracture frequency of Type C and Type D shows a positive relationship as GWI increases, as shown in Figure 10c,d. The GWI reflect flowing capacity, as shown in Figure 8b; the high value of GWI indicates unstable conditions and high groundwater table during the period of peat accumulation, meanwhile, high GWI indicates high amounts of minerals based on the formula in Section 4.3. Generally, organic matter is more hydrophobic than clay minerals and other mineral grains [53]. Hydration has significant impact on fracture developed in coal reservoir, since minerals would be swelling in reaction to water-based fluid, primary fractures would expand in width and length, and would create new fractures in hydration, which makes pore-fractures network more complete, and has good connectivity between pores and fractures [59]. Based on the relationship between GWI and different kinds of fractures and the effects of hydration on fractures, we can find the hydration of mineral has no effect on type A and type B fractures, and great effect on type A and type B fractures developed in coal.

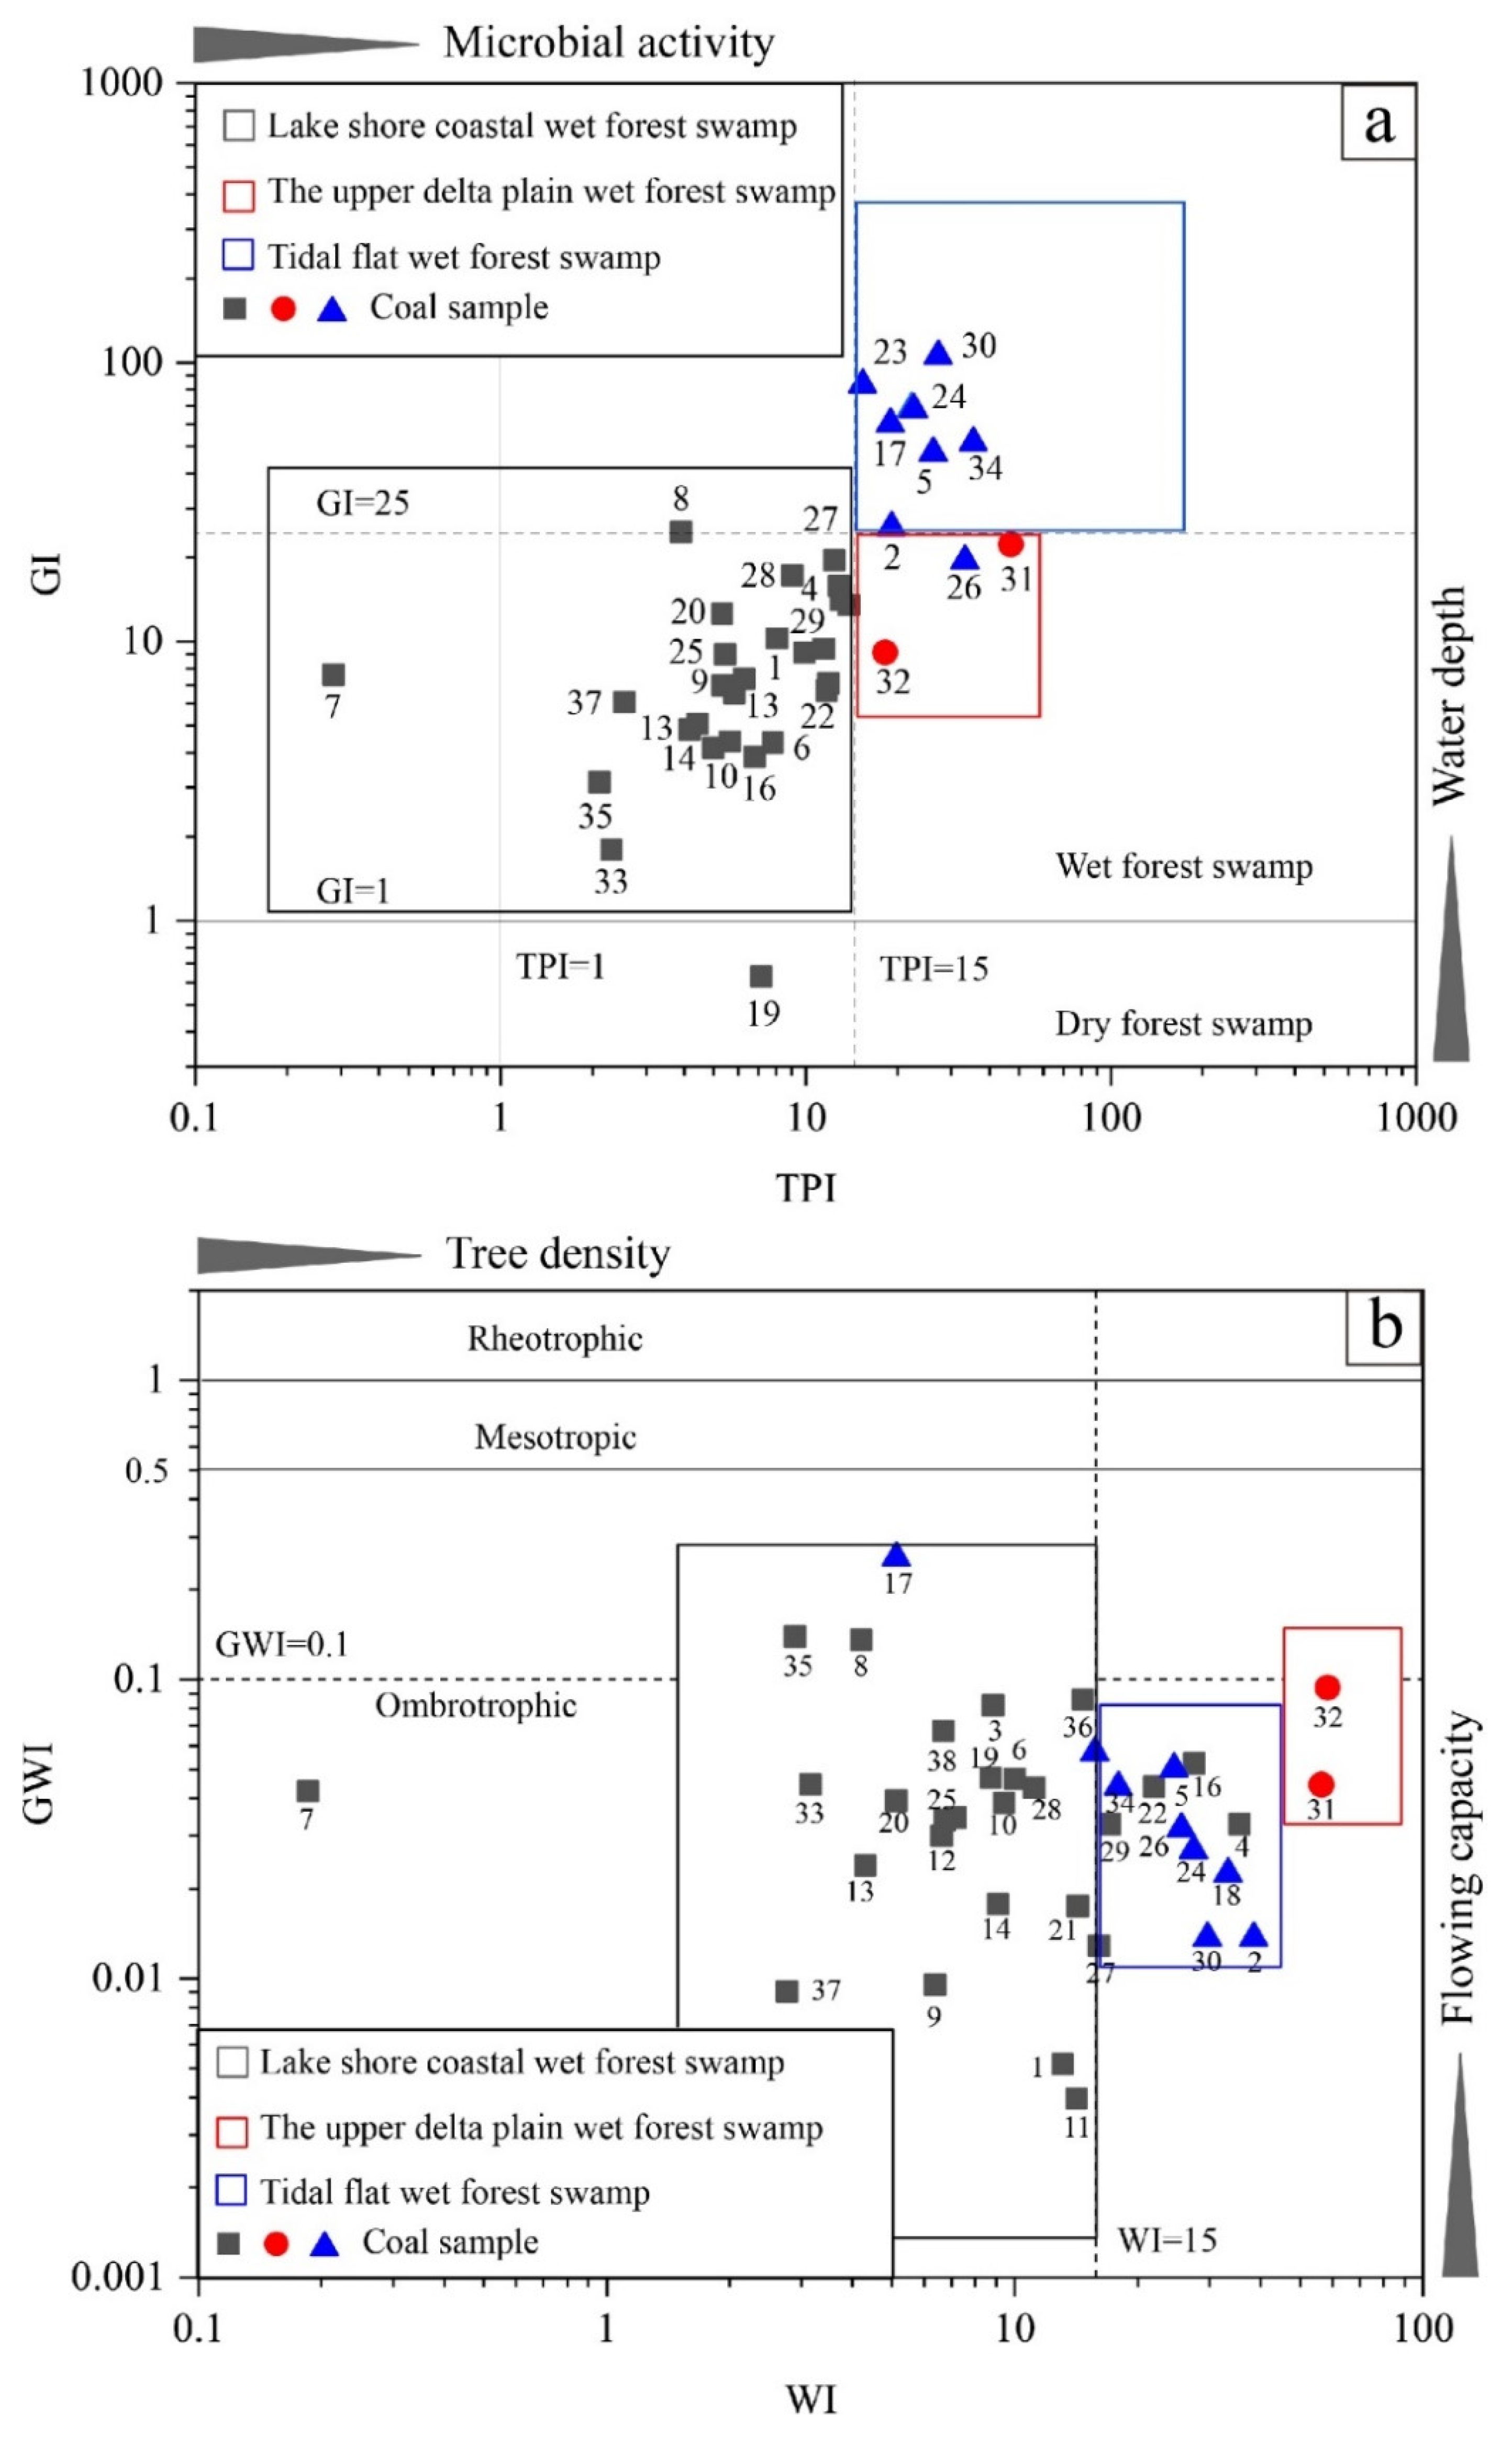
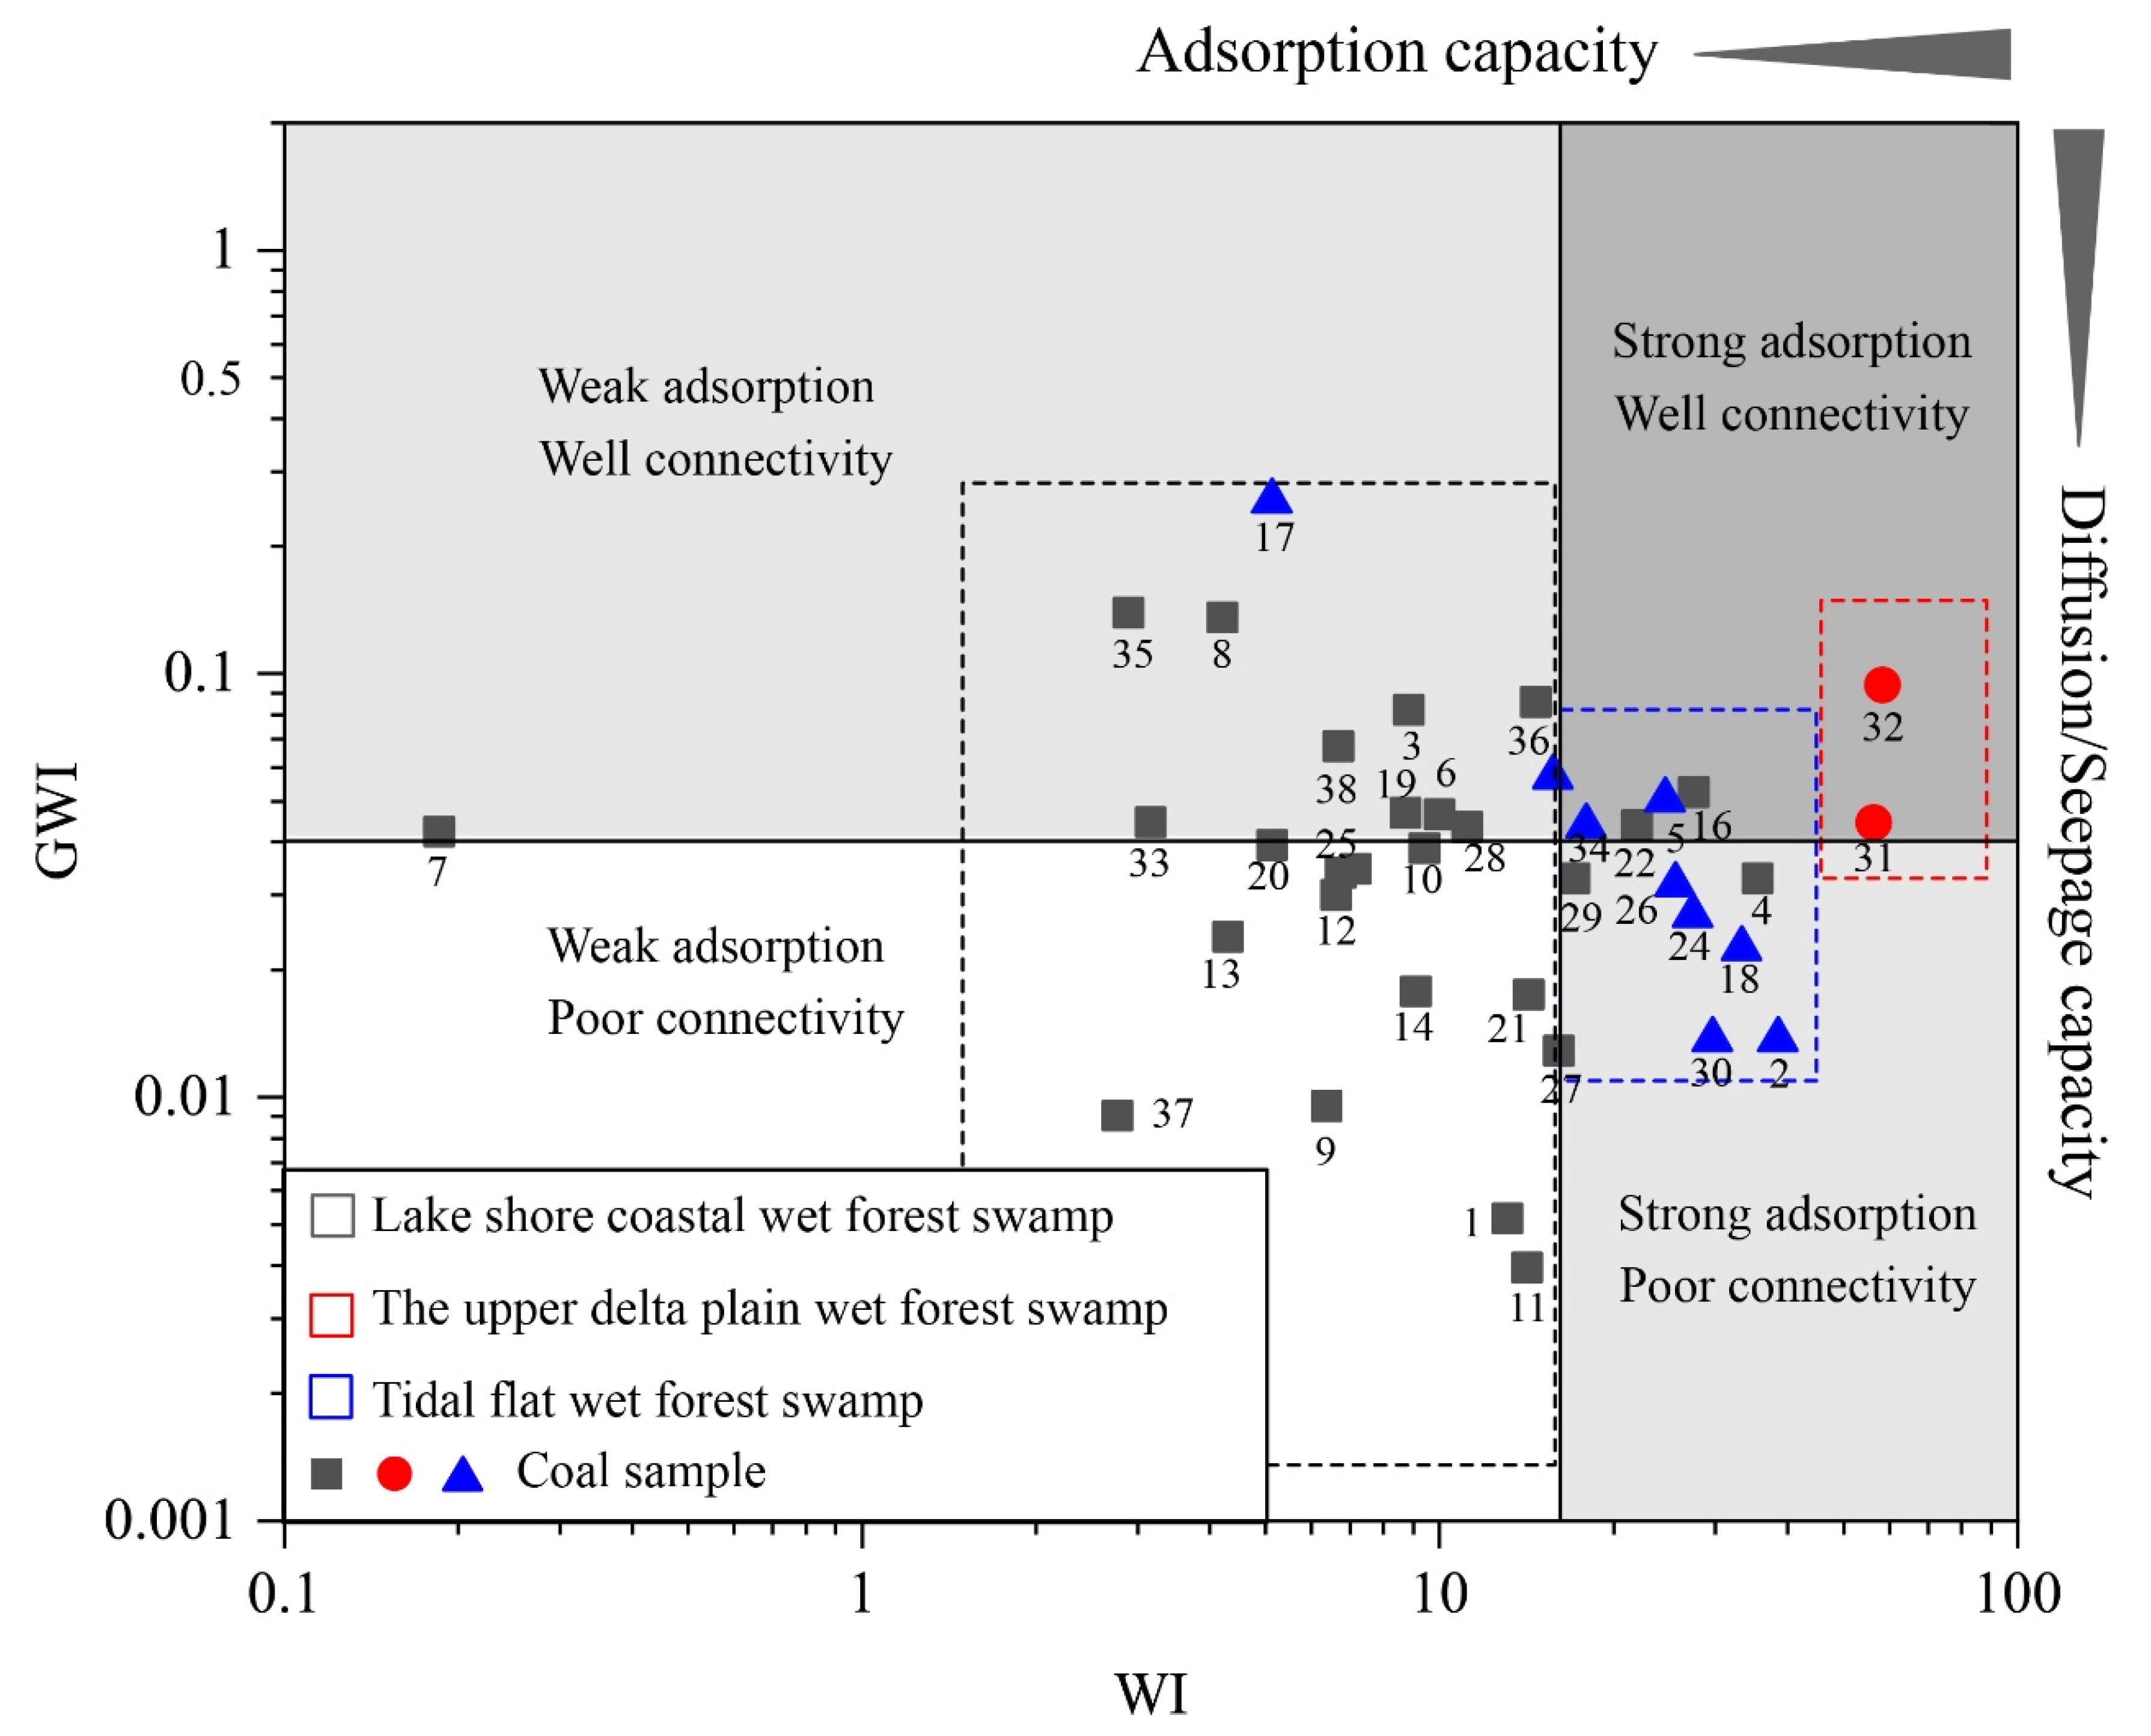
6.2. Prediction of CBM Reservoir Favorable Areas with Coal Facies

Adsorption capacity and diffusion/seepage capacity are two key indicators for CBM reservoir, which would affect the CBM enrichment and production directly [60]. On the above basis, the percentage of micropores and transition pores related to the TPI and WI, the frequency of type C and type D, increases as GWI is increased. Thus, we consider there is another function for the WI-GWI diagram—favorable area evaluation in the CBM reservoir. The WI-GWI diagram could be divided into four areas, including:
  • strong adsorption, well connectivity area,
  • weak adsorption, well connectivity area,
  • weak adsorption, poor connectivity area, and
  • strong adsorption, poor connectivity area, as shown in Figure 11.
By combining the results of coal facies identification in Section 6.1.1, we found the coal facies of the upper delta plain wet forest swamp to be the most favorable area for CBM production, with strong adsorption and well connectivity of the coal reservoir, and lake shore coastal wet forest swamp is no benefit for CBM enrichment and gas migration in the coal reservoir.

7. Conclusions

The pore-fracture structure and coal facies of different coal samples from the Sangjiang-Muling coal-bearing basins were investigated by MIP, optical microscope, and Q-cluster analysis. The following conclusions can be made:
(1)
Micropores and transition (<100 nm) pores are most abundant and display the best developed for all coal samples, with an average percentage of 68.25%. Three types of mercury injection curve were classified based on MIP experiment, and type Ⅱ is good for CBM flow in the coal reservoir due to the high porosity of macropores and well connectivity of pores in coal reservoir.
(2)
Type D microfractures are most abundant and display the best-developed microfractures, which account for more than 70% of the total microfractures. The hydration of minerals has little effect on type A and type B fractures, whereas it has great effect on type C and type D fractures developed in coal.
(3)
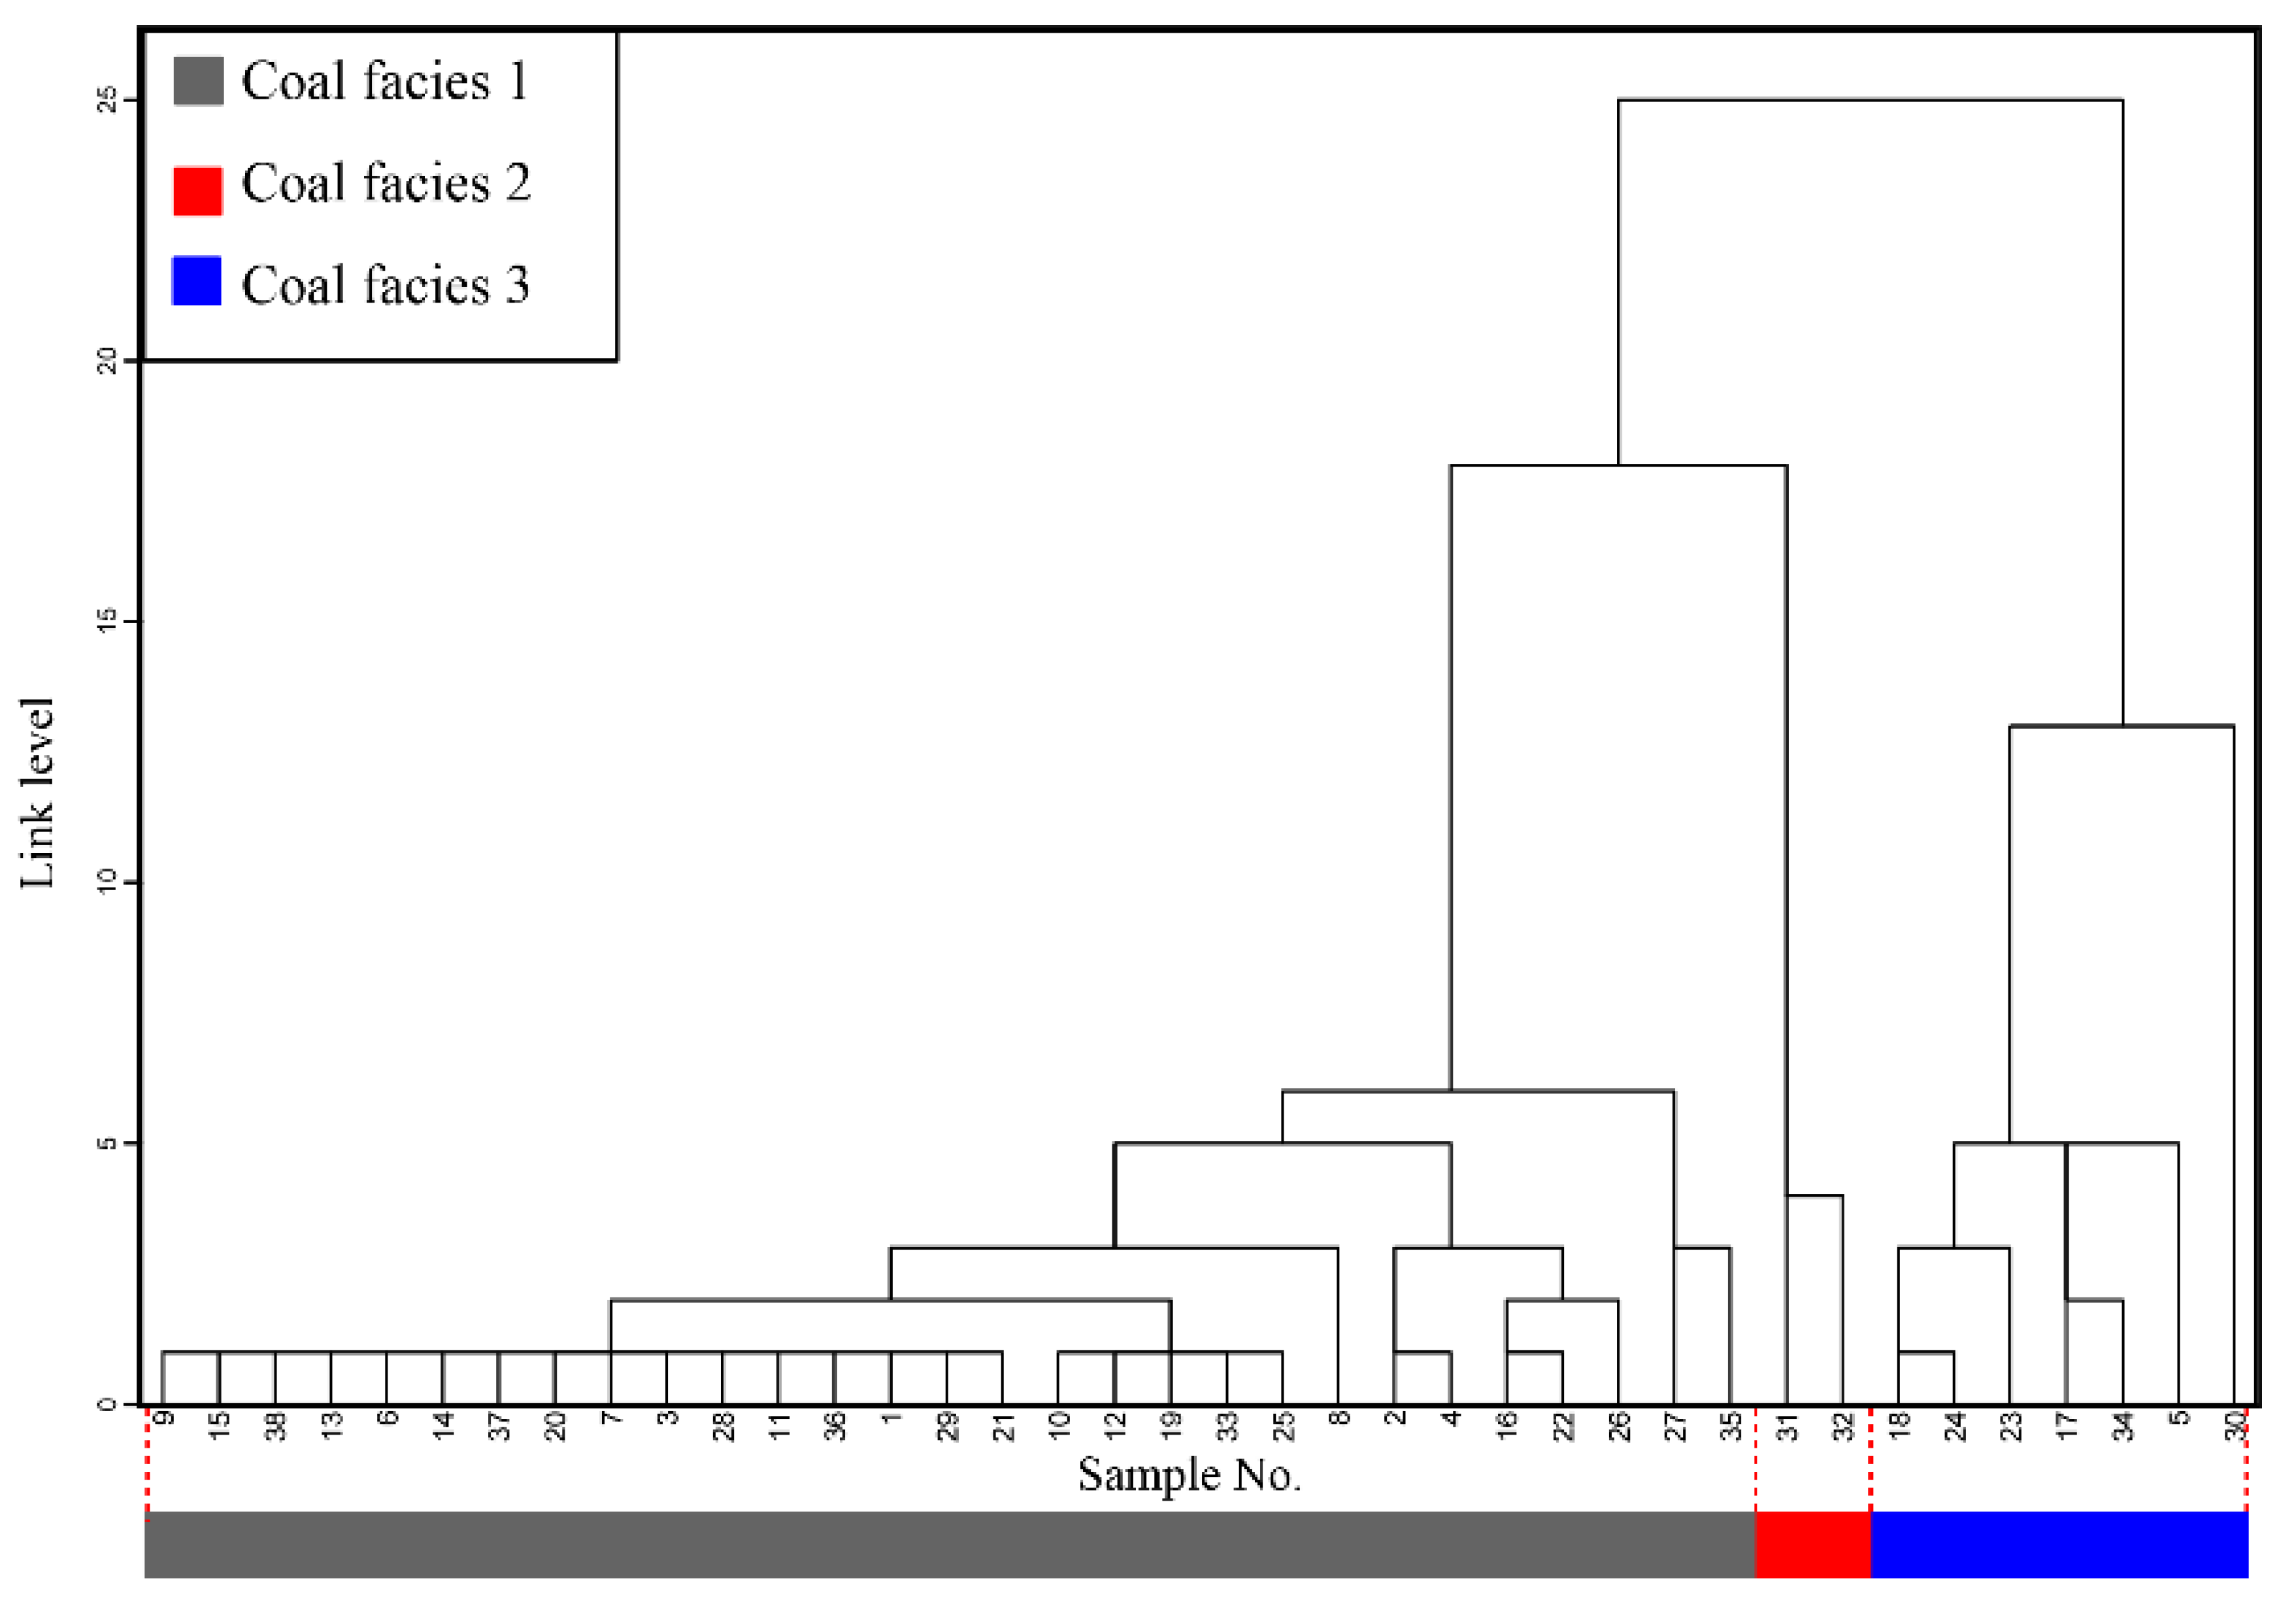
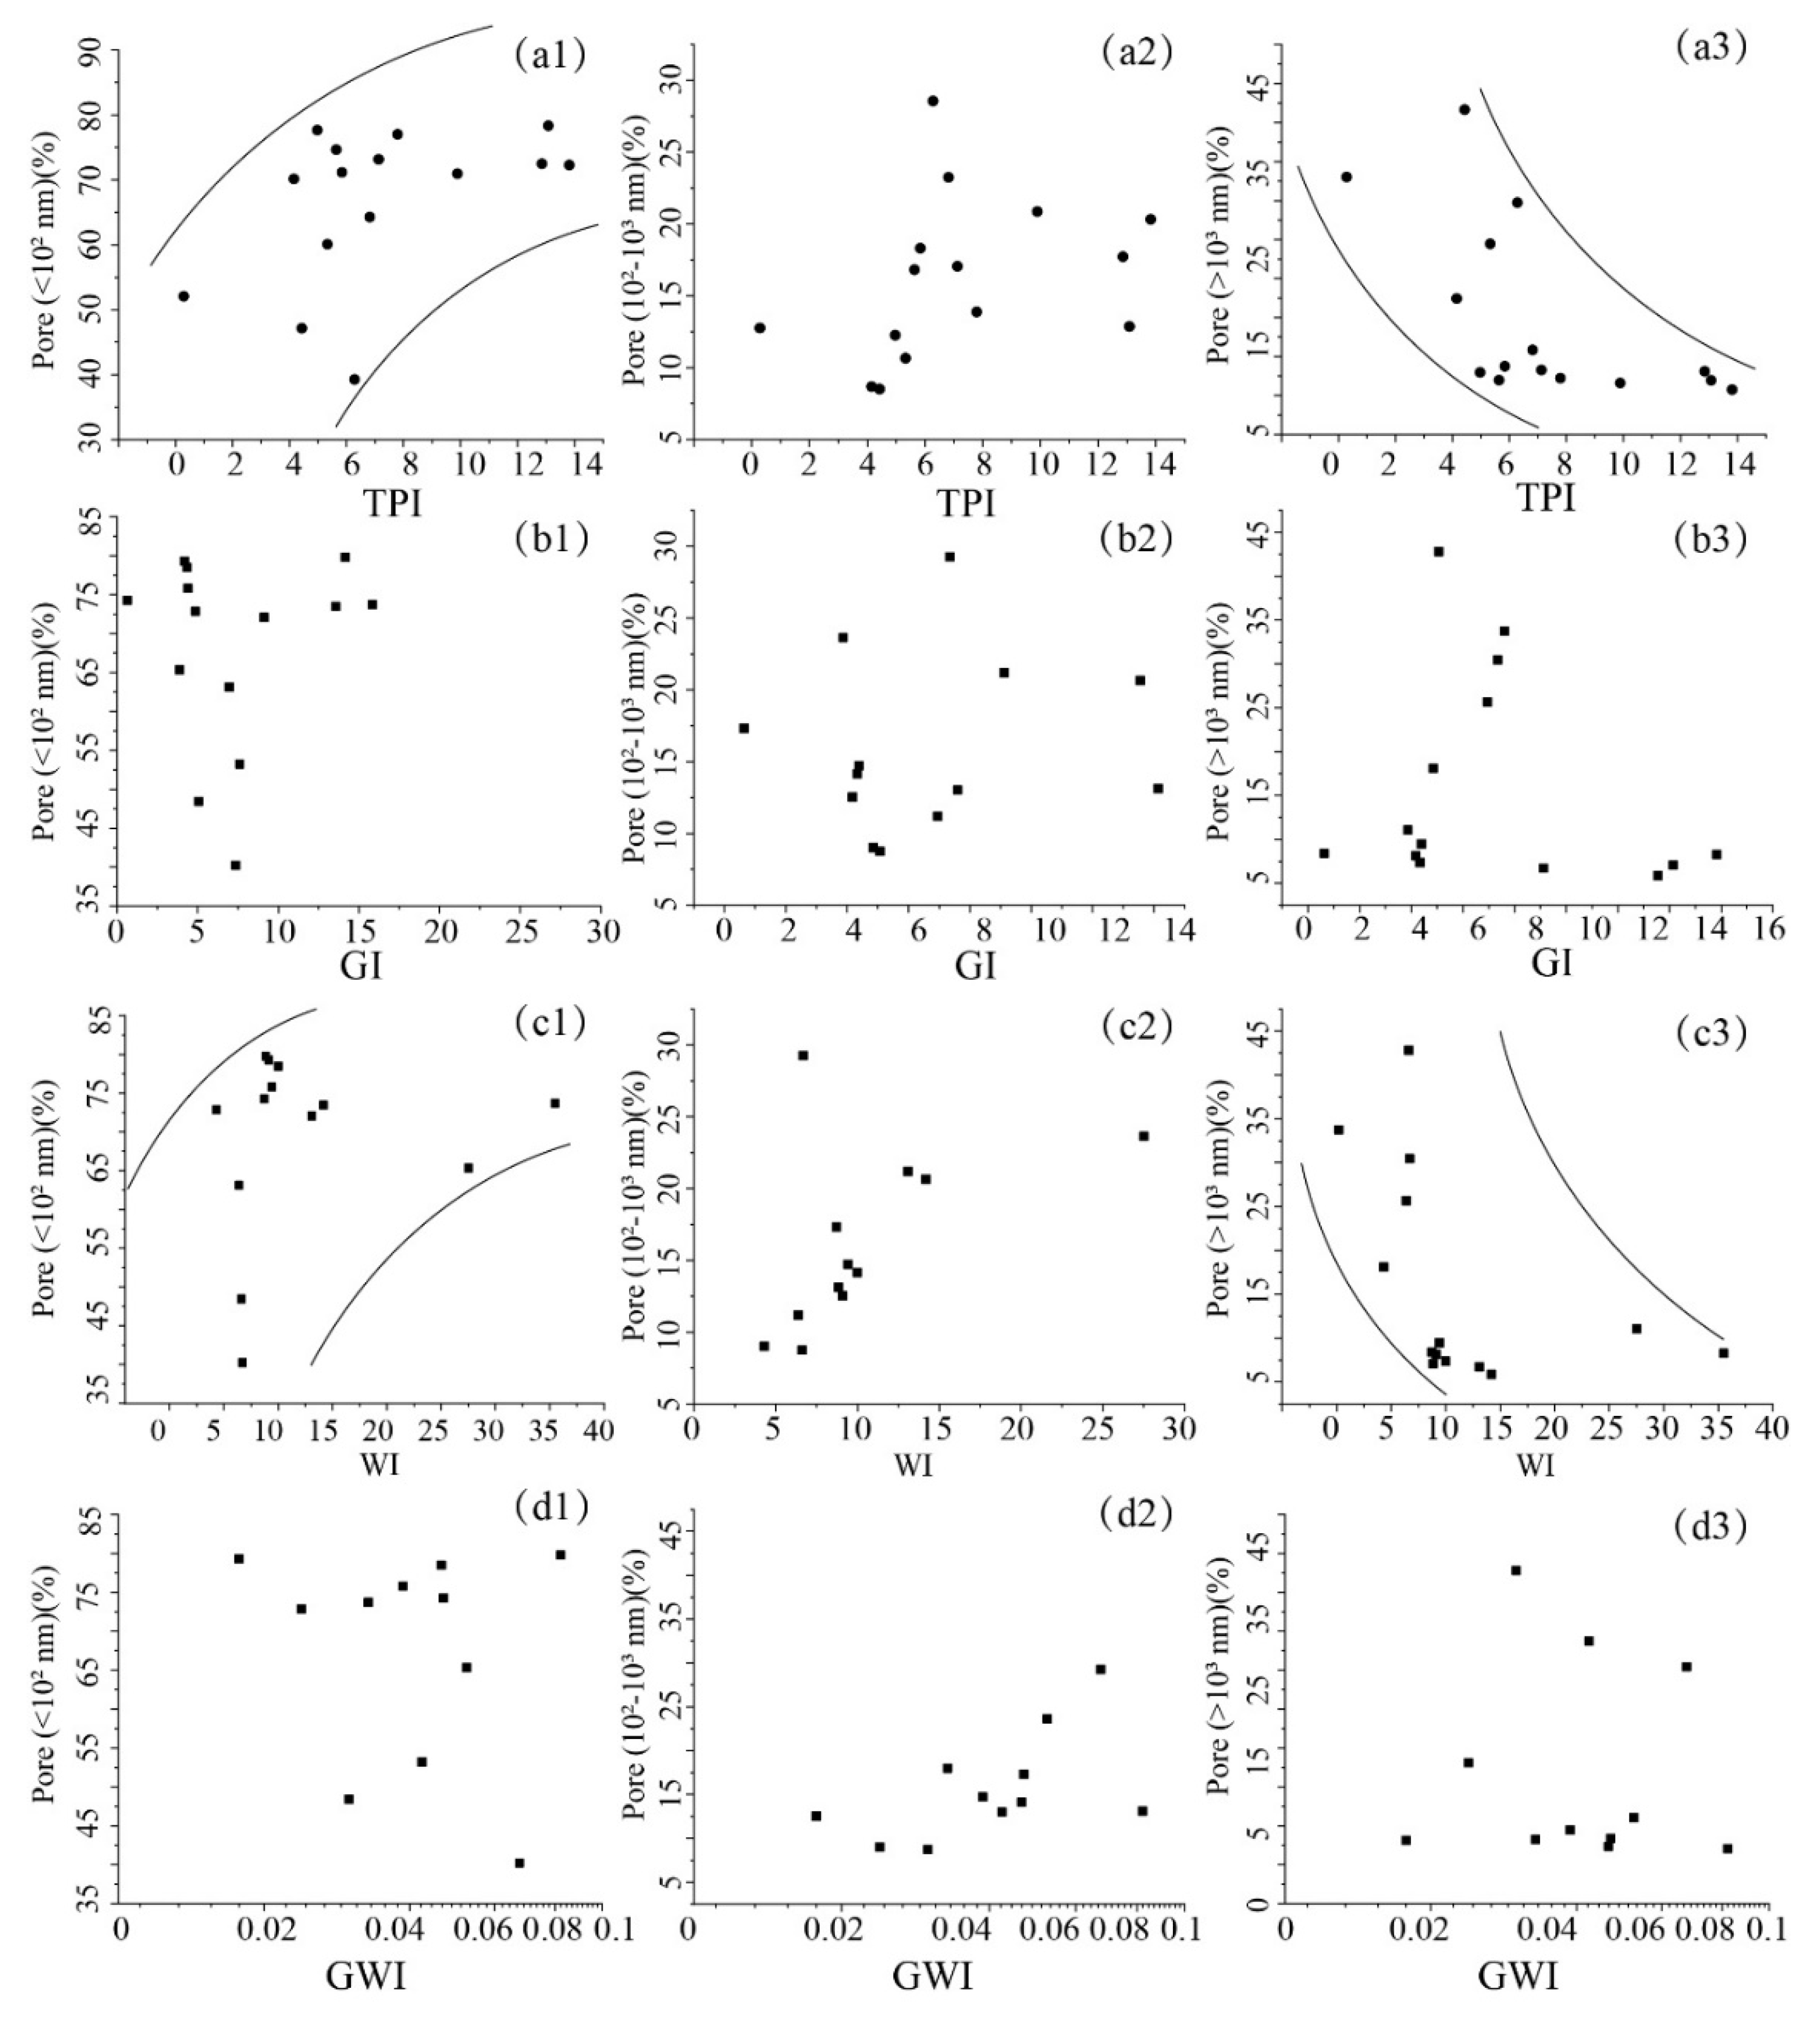
Three types of coal facies were identified based on the Q-cluster analysis, GI-TPI, and GWI-WI diagrams, including lake shore coastal wet forest swamp, the upper delta plain wet forest swamp, tidal flat wet forest swamp, respectively. There is positive correction between TPI, WI, and micropores, a negative correlation between TPI, WI, and macropores/fractures.
(4)
The WI-GWI diagram could also be used to evaluate favorable areas in CBM reservoir based on the effects of WI, GWI on pore and fracture characteristics. The upper delta plain wet forest swamp is an optimization of favorable areas of the CBM reservoir, with strong adsorption and well connectivity of pores for Sangjiang-Muling coal-bearing basins.

Author Contributions

D.L. and Y.C. conceived and designed the experiments; Y.L. performed the experiments and wrote the paper; Y.L. and Y.C. analyzed the data; D.L. and Y.C. revised the paper and provided language support; Q.L., Q.J. provided technical support. All authors have read and agreed to the published version of the manuscript.

Funding

This research was funded by the National Natural Science Fund (Grant NOs. 41830427, 41772160 and 41922016) and the Fundamental Research Funds for Central Universities (Grant NO. 2652018002).

Conflicts of Interest

The authors declare no conflict of interest.

References

  1. Yao, Y.B.; Liu, D.M.; Liu, J.G.; Xie, S.B. Assessing the Water Migration and Permeability of Large Intact Bituminous and Anthracite Coals Using NMR Relaxation Spectrometry. Trans. Porous Med. 2015, 107, 527–542. [Google Scholar] [CrossRef]
  2. Scott, A.R. Hydrogeologic factors affecting gas content distribution in coal beds. Int. J. Coal Geol. 2002, 50, 363–387. [Google Scholar] [CrossRef]
  3. Wang, B.; Sun, F.J.; Tang, D.Z.; Zhao, Y.; Song, Z.H.; Tao, Y. Hydrological control rule on coalbed methane enrichment and high yield in FZ Block of Qinshui Basin. Fuel 2015, 140, 568–577. [Google Scholar] [CrossRef]
  4. Li, Z.T.; Liu, D.M.; Cai, Y.D.; Ranjith, P.G.; Yao, Y.B. Multi-scale quantitative characterization of 3-D pore-fracture networks in bituminous and anthracite coals using FIB-SEM tomography and X-ray Μ-CT. Fuel 2017, 209, 43–53. [Google Scholar] [CrossRef]
  5. Pashin, J.C. Variable gas saturation in coalbed methane reservoirs of the Black Warrior Basin: Implications for exploration and production. Int. J. Coal Geol. 2010, 82, 135–146. [Google Scholar] [CrossRef]
  6. Cai, Y.D.; Liu, D.M.; Yao, Y.B.; Li, J.Q.; Qiu, Y.K. Geological controls on prediction of coalbed methane of No. 3 coal seam in Southern Qinshui Basin, North China. Int. J. Coal Geol. 2011, 88, 101–112. [Google Scholar] [CrossRef]
  7. Zhao, J.L.; Tang, D.Z.; Xu, H.; Lv, Y.M.; Tao, S. High production indexes and the key factors in coalbed methane production: A case in the Hancheng block, southeastern Ordos Basin, China. J. Pet. Sci. Eng. 2015, 130, 55–67. [Google Scholar] [CrossRef]
  8. Wang, Z.Z.; Pan, J.N.; Hou, Q.L.; Yu, B.S.; Li, M.; Niu, Q.H. Anisotropic characteristics of low-rank coal fractures in the Fukang mining area, China. Fuel 2018, 211, 182–193. [Google Scholar] [CrossRef]
  9. Ouyang, Z.Q.; Liu, D.M.; Cai, Y.D.; Yao, Y.B. Investigating the fractal characteristics of pore-fractures in bituminous coals and anthracites through fluid flow behavior. Energy Fuels 2016, 30, 10348–10357. [Google Scholar] [CrossRef]
  10. Cai, Y.; Liu, D.; Mathews, J.P.; Pan, Z.; Elsworth, D.; Yao, Y.; Li, J.; Guo, X. Permeability evolution in fractured coal—Combining triaxial confinement with X-ray computed tomography, acoustic emission and ultrasonic techniques. Int. J. Coal Geol. 2014, 122, 91–104. [Google Scholar] [CrossRef]
  11. Hodot, B.B. Outburst of Coal and Coalbed Gas (Chinese Translation); China Coal Industry Press: Beijing, China, 1966; Volume 318. [Google Scholar]
  12. Cai, Y.D.; Liu, D.M.; Pan, Z.J.; Yao, Y.B.; Li, J.Q.; Qiu, Y.K. Pore structure and its impact on CH4 adsorption capacity and flow capability of bituminous and subbituminous coals from Northeast China. Fuel 2013, 103, 258–268. [Google Scholar] [CrossRef]
  13. Wang, H.C.; Fu, X.H.; Jian, K.; Li, T.; Luo, P.P. Changes in coal pore structure and permeability during N2 injection. J. Nat. Gas Sci. Eng. 2015, 27, 1234–1241. [Google Scholar] [CrossRef]
  14. Rodrigues, C.F.; Lemos De Sousa, M.J. The measurement of coal porosity with different gases. Int. J. Coal Geol. 2002, 48, 245–251. [Google Scholar] [CrossRef] [Green Version]
  15. Wang, G.; Qin, X.J.; Shen, J.N.; Zhang, Z.Y.; Han, D.Y.; Jiang, C.H. Quantitative analysis of microscopic structure and gas seepage characteristics of low-rank coal based on CT three-dimensional reconstruction of CT images and fractal theory. Fuel 2019, 256, 115900. [Google Scholar] [CrossRef]
  16. Chalmers, G.R.L.; Ross, D.J.K.; Bustin, R.M. Geological controls on matrix permeability of Devonian Gas Shales in the Horn River and Liard basins, northeastern British Columbia, Canada. Int. J. Coal Geol. 2012, 103, 120–131. [Google Scholar] [CrossRef]
  17. Huang, B.X.; Liu, C.Y.; Fu, J.H.; Guan, H. Hydraulic fracturing after water pressure control blasting for increased fracturing. Int. J. Rock Mech. Min. Sci. 2011, 48, 976–983. [Google Scholar] [CrossRef]
  18. Cheng, W.; Jin, Y.; Chen, M. Reactivation mechanism of natural fractures by hydraulic fracturing in naturally fractured shale reservoirs. J. Nat. Gas Sci. Eng. 2015, 27, 1357–1365. [Google Scholar] [CrossRef]
  19. Wang, F.; Cheng, Y.P.; Lu, S.Q.; Jin, K.; Zhao, W. Influence of coalification on the pore characteristics of middle-high rank coal. Energy Fuels 2014, 28, 5729–5736. [Google Scholar] [CrossRef]
  20. Pan, J.N.; Zhu, H.T.; Hou, Q.L.; Wang, H.H.; Wang, S. Macromolecular and pore structures of Chinese tectonically deformed coal studied by atomic force microscopy. Fuel 2015, 139, 94–101. [Google Scholar] [CrossRef]
  21. Zhang, S.H.; Tang, S.H.; Tang, D.Z.; Pan, Z.J.; Yang, F. The characteristics of coal reservoir pores and coal facies in Liulin district, Hedong coal field of China. Int. J. Coal Geol. 2010, 81, 117–127. [Google Scholar] [CrossRef]
  22. Cecil, C.B.; Stanton, R.W.; Neuzil, S.G.; Dulong, F.T.; Ruppert, L.F.; Pierce, B.S. Paleoclimate controls on late Paleozoic sedimentation and peat formation in the central Appalachian basin (U.S.A.). Int. J. Coal Geol. 1985, 5, 195–230. [Google Scholar] [CrossRef]
  23. Mastalerz, M.; Kvale, E.P.; Stankiewicz, B.A.; Portle, K. Organic geochemistry in Pennsylvanian tidally influenced sediments from SW Indiana. Org. Geochem. 1999, 30, 57–73. [Google Scholar] [CrossRef]
  24. Zhao, X.Q.; Chen, H.L.; Zhang, F.Q.; Sun, M.D.; Yang, J.G.; Tan, B.D. Characteristics, structural styles and tectonic implications of Mesozoic-Cenozoic faults in the eastern Heilongjiang basins (NE China). J. Asian Earth Sci. 2017, 146, 196–210. [Google Scholar] [CrossRef]
  25. Shan, C.G.; Zhang, T.S.; Liang, X.; Zhang, Z.; Wang, M.; Zhang, K.; Zhu, H.H. On the fundamental difference of adsorption-pores systems between vitrinite- and inertinite-rich anthracite derived from the southern Sichuan basin, China. J. Nat. Gas Sci. Eng. 2018, 53, 32–44. [Google Scholar] [CrossRef]
  26. Hou, H.H.; Shao, L.Y.; Li, Y.H.; Li, Z.; Wang, S.; Zhang, W.L.; Wang, X.T. Influence of coal petrology on methane adsorption capacity of the Middle Jurassic coal in the Yuqia Coalfield, northern Qaidam Basin, China. J. Pet. Sci. Eng. 2017, 149, 218–227. [Google Scholar] [CrossRef]
  27. ICCP. The new vitrinite classification (ICCP System 1994). Fuel 1998, 77, 349–358. [Google Scholar] [CrossRef]
  28. Cai, Y.D.; Li, Q.; Liu, D.M.; Zhou, Y.F.; Lv, D.W. Insights into matrix compressibility of coals by mercury intrusion porosimetry and N2 adsorption. Int. J. Coal Geol. 2018, 200, 199–212. [Google Scholar] [CrossRef] [Green Version]
  29. Zeng, F.H.; Peng, F.; Guo, J.C.; Wang, D.Y.; Zhang, S.R.; Zhang, P.; Zhang, B. Gas transport study in the confined microfractures of coal reservoirs. J. Nat. Gas Sci. Eng. 2019, 68, 102920. [Google Scholar] [CrossRef]
  30. Cai, Y.D.; Liu, D.M.; Pan, Z.J.; Che, Y.; Liu, Z.H. Investigating the Effects of Seepage-Pores and Fractures on Coal Permeability by Fractal Analysis. Trans. Porous Med. 2016, 111, 479–497. [Google Scholar] [CrossRef]
  31. Zhao, J.L.; Xu, H.; Tang, D.Z.; Mathews, J.P.; Li, S.; Tao, S. Coal seam porosity and fracture heterogeneity of macrolithotypes in the Hancheng Block, eastern margin, Ordos Basin, China. Int. J. Coal Geol. 2016, 159, 18–29. [Google Scholar] [CrossRef]
  32. Calder, J.H.; Gibling, M.R.; Mukhopadhyay, P. Peat formation in a Westphalian B piedmont setting, Cumberland basin, Nova Scotia: Implications for the maceral-based interpretation of rheotrophic and raised paleomires. Bull. Soc. Geol. Fr. 1991, 162, 283–298. [Google Scholar]
  33. Diessel, C.F.K. Coal-bearing Depositional Systems; Springer: Berlin, Germany, 1992; p. 721. [Google Scholar]
  34. Diessel, C.F.K. The correlation between coal facies and depositional environments. In Advances in the Study of the Sydney Basin; The University of Newcastle: Newcastle, UK, 1986; pp. 19–22. [Google Scholar]
  35. Bechtel, A.; Sachsenhofer, R.F.; Kolcon, I.; Gratzer, R.; Otto, A.; Püttmann, W. Organic geochemistry of the Lower Miocene Oberdorf lignite (Styrian Basin, Austria): Its relation to petrography, palynology and the palaeoenvironment. Int. J. Coal Geol. 2002, 1, 31–57. [Google Scholar] [CrossRef]
  36. Çelik, Y.; Karayiğit, A.İ.; Querol, X.; Oskay, R.G.; Mastalerz, M.; Özer, M.S.K. Coal characteristics, palynology, and palaeoenvironmental interpretation of the Yeniköy coal of Late Oligocene age in the Thrace Basin (NW Turkey). Int. J. Coal Geol. 2017, 181, 103–123. [Google Scholar]
  37. Oskay, R.G.; Bechtel, A.; Karayiğit, A.İ. Mineralogy, petrography and organic geochemistry of Miocene coal seams in the Kınık coalfield (Soma Basin-Western Turkey): Insights into depositional environment and palaeovegetation. Int. J. Coal Geol. 2019, 210, 103205. [Google Scholar] [CrossRef]
  38. Jasper, K.; Hartkopf-Fröder, C.; Flajs, G.; Littke, R. Evolution of Pennsylvanian (late Carboniferous) peat swamps of the Ruhr Basin, Germany: Comparison of palynological, coal petrographical and organic geochemical data. Int. J. Coal Geol. 2010, 83, 346–365. [Google Scholar] [CrossRef]
  39. Zdravkov, A.; Bechtel, A.; Sachsenhofer, R.F.; Kortenski, J.; Gratzer, R. Vegetation differences and diagenetic changes between two Bulgarian lignitedeposits—Insights from coal petrology and biomaker composition. Org. Geochem. 2011, 42, 237–254. [Google Scholar] [CrossRef]
  40. Oikonomopoulos, I.K.; Kaouras, G.; Tougiannidis, F.; Ricken, W.; Gurk, M.; Antoniadis, P. The depositional conditions and the palaeoenvironment of the Achlada xylite-dominated lignite in western Makedonia, Greece. Palaeogeogr. Palaeoclimatol. Palaeoecol. 2015, 440, 777–792. [Google Scholar] [CrossRef]
  41. Omodeo-Salé, S.; Deschamps, R.; Michel, P.; Chauveau, B.; Suárez-Ruiz, I. The coal-bearing strata of the Lower Cretaceous Mannville Group (Western Canadian Sedimentary Basin, South Central Alberta), PART 2: Factors controlling the composition of organic matter accumulations. Int. J. Coal Geol. 2017, 179, 219–241. [Google Scholar] [CrossRef]
  42. Karayiğit, A.İ.; Bircan, C.; Mastalerz, M.; Oskay, R.G.; Querol, X.; Lieberman, N.R.; Türkmen, I. Coal characteristics, elemental composition and modes of occurrence of some elements in the İsaalan coal (Balıkesir, NW Turkey). Int. J. Coal Geol. 2017, 172, 43–59. [Google Scholar] [CrossRef]
  43. Karayiğit, A.İ.; Littke, R.; Querol, X.; Jones, T.; Oskay, R.G.; Christanis, K. The Miocene coal seams in the Soma Basin (W. Turkey): Insights from coal petrography, mineralogy and geochemistry. Int. J. Coal Geol. 2017, 173, 110–128. [Google Scholar] [CrossRef]
  44. Zhang, P.F.; Jin, K.L.; Wu, T.; Wang, C.G. Coal-Bearing Sedimentary and Coal Formed Oil, Turpan-Hami Basin; China Coal Industry Press: Beijing, China, 1997; pp. 168–176. [Google Scholar]
  45. Petersen, H.I.; Ratanasthien, B. Coal facies in a Cenozoic paralic lignite bed, Krabi Basin, southern Thailand: Changing peat-forming conditions related to relative sea-level controlled water table variations. Int. J. Coal Geol. 2011, 87, 2–12. [Google Scholar] [CrossRef]
  46. Oskay, R.G.; Christanis, K.; İnaner, H.; Salman, M.; Taka, M. Palaeoenvironmental reconstruction of the eastern part of the Karapınar-Ayrancı coal deposit (Central Turkey). Int. J. Coal Geol. 2016, 163, 100–111. [Google Scholar] [CrossRef]
  47. Siavalas, G.; Linou, M.; Chatziapostolou, A.; Kalaitzidis, S.; Papaefthymiou, H.; Christanis, K. Palaeoenvironment of Seam I in the Marathousa Lignite Mine, Megalopolis Basin (Southern Greece). Int. J. Coal Geol. 2009, 78, 233–248. [Google Scholar] [CrossRef]
  48. Janssen, C.; Wirth, R.; Reinicke, A.; Rybacki, E.; Naumann, R.; Wenk, H.-R.; Dresen, G. Nanoscale porosity in SAFOD core samples (San Andreas Fault). Earth Planet. Sci. Lett. 2011, 301, 179–189. [Google Scholar] [CrossRef]
  49. Li, Z.T.; Liu, D.M.; Cai, Y.D.; Shi, Y.L. Investigation of methane diffusion in low-rank coals by a multiporous diffusion model. J. Nat. Gas Sci. Eng. 2016, 33, 97–107. [Google Scholar] [CrossRef]
  50. Mitrović, D.; Đoković, N.; Životić, D.; Bechtel, A.; Šajnović, A.; Stojanović, K. Petrographical and organic geochemical study of the Kovin lignite deposit, Serbia. Int. J. Coal Geol. 2016, 168, 80–107. [Google Scholar]
  51. Khare, N.; Nigam, R.; Mayenkar, D.N.; Saraswat, R. Cluster analysis of benthic foraminiferal morpho-groups from the western margin of India reflects its depth preference. Cont. Shelf Res. 2017, 151, 72–83. [Google Scholar] [CrossRef]
  52. Peng, S.; Xiao, X.H. Investigation of multiphase fluid imbibition in shale through synchrotron-based dynamic micro-CT imaging. J. Geophys. Res. Solid Earth 2017, 122, 4475–4491. [Google Scholar] [CrossRef]
  53. Busch, A.; Gensterblum, Y. CBM and CO2-ECBM related sorption processes in coal: A review. Int. J. Coal Geol. 2011, 87, 49–71. [Google Scholar] [CrossRef]
  54. Clarkson, C.; Bustin, R. Variation in permeability with lithotype and maceral composition of Cretaceous coals of the Canadian Cordillera. Int. J. Coal Geol. 1997, 33, 135–151. [Google Scholar] [CrossRef]
  55. Karayiğit, A.İ.; Mastalerz, M.; Oskay, R.G. Meso-and microporosity of the subbituminous kM2 coal seam (Soma, Turkey) and its relationship with coal characteristics. Int. J. Coal Geol. 2017, 184, 73–87. [Google Scholar]
  56. Karayiğit, A.İ.; Mastalerz, M.; Oskay, R.G.; Buzkan, İ. Bituminous coal seams from underground mines in the Zonguldak Basin (NW Turkey): Insights from mineralogy, coal petrography, Rock-Eval pyrolysis, and meso- and microporosity. Int. J. Coal Geol. 2018, 199, 91–122. [Google Scholar] [CrossRef]
  57. Mastalerz, M.; Drobniak, A.; Rupp, J. Meso- and micropore characteristics of coal lithotypes: Implications for CO2 adsorption. Energy Fuels 2008, 22, 4049–4061. [Google Scholar] [CrossRef]
  58. Laxminarayana, C.; Crosdale, P. Role of coal type and rank on methane sorption characteristics of Bowen Basin, Australia coals. Int. J. Coal Geol. 1999, 40, 309–325. [Google Scholar] [CrossRef]
  59. Zhang, Y.H.; Lebedev, M.; Sarmadicaleh, M.; Barifcani, A.; Rahman, T.; Lglauer, S.J. Swelling effect on coal micro structure and associated permeability reduction. Fuel 2016, 182, 568–576. [Google Scholar] [CrossRef] [Green Version]
  60. Mastalerz, M.; Drobniak, A.; Strąpoć, D.; Solano Acosta, W.; Rupp, J. Variations in pore characteristics in high volatile bituminous coals: Implications for coal bed gas content. Int. J. Coal Geol. 2008, 76, 205–216. [Google Scholar] [CrossRef]
Figure 1. Sampling location of Sangjiang-Muling coal-bearing basins, Northeast China.
Energies 13 01196 g001
Figure 2. Microphotographs of macerals. (a) Sample NE3; (b) Sample NE7; (c) Sample NE13; (d) Sample NE26; (e) Sample NE25; (f) Sample NE10.
Energies 13 01196 g002
Figure 3. The pore volume distribution of selected coals from Sangjiang-Muling coal-bearing basins.
Energies 13 01196 g003
Figure 4. Relationship between the porosity and the ash yield (a) and mineral content of coal (b).
Energies 13 01196 g004
Figure 5. The pore size and volume distribution of 15 coal samples from Sangjiang-Muling coal-bearing basins.
Energies 13 01196 g005
Figure 6. Morphology and frequency of endogenous microfractures observed by optical microscope (×63). (a) Sample NE19, Dendritic, F = 213; (b) Sample NE14, orthogonal, F = 67; (c) Sample NE22, filamentous, F = 25; (d) Sample NE4, orthogonal, F = 30; (c) Sample NE25, orthogonal, F = 137; (d) Sample NE31, filamentous, F = 61.
Energies 13 01196 g006
Figure 7. Dendrogram showing coal facies results of Q-cluster analysis.
Energies 13 01196 g007
Figure 8. Coal facies interpretation from Sangjiang-Muling coal-bearing basins. (a) Gelification index–tissue preservation index (GI–TPI), (b) groundwater index–wood index (GWI–WI).
Energies 13 01196 g008
Figure 9. Relationships between the pore size and coal facies index. (a1) the relationship between pore size (<102 nm) and TPI; (a2) the relationship between pore size (102 nm–103 nm) and TPI; (a3) the relationship between pore size (>103 nm) and TPI; (b1) the relationship between pore size (<102 nm) and GI; (b2) the relationship between pore size (102 nm–103 nm) and GI; (b3) the relationship between pore size (>103 nm) and GI; (c1) the relationship between pore size (<102 nm) and WI; (c2) the relationship between pore size (102 nm–103 nm) and WI; (c3) the relationship between pore size (>103 nm) and WI; (d1) the relationship between pore size (<102 nm) and GWI; (d2) the relationship between pore size (102 nm–103 nm) and GWI; (d3) the relationship between pore size (>103 nm) and GWI.
Energies 13 01196 g009
Figure 10. Relationships between the microfractures and coal facies index (GWI). (a) GWI against type A fractures; (b) GWI against type B fractures; (c) GWI against type C fractures; (d) GWI against type D fractures.
Energies 13 01196 g010
Figure 11. Favorable areas evaluation of CBM reservoir with the GWI-WI diagram.
Energies 13 01196 g011
Table 1. Proximate analysis and micro-fracture analysis of selected coals from Sangjiang-Muling coal-bearing basins.
Sample No.BasinGA%R maxCoal Petrography CompositionProximate AnalysisMicro-Fractures (per 9 cm2)
VILMMC,adH,adM,adA,adABCDTotal
NE1JixiK10.4977.58.513.60.470.944.872.0610.850031619
NE7HegangK10.6178.310.311.10.374.887.761.489.8122185274
NE10JixiK10.7776.817.54.80.971.64.51.4313.420129119149
NE6BoliK10.873.719.66.20.582.214.860.864.4102193253
NE11BoliK10.8175.95.618.20.376.285.051.0210.1402266391
NE26HegangK10.8393.64.81.20.465.14.011.1822.03*****
NE18JixiK10.8789.21.37.5257.483.881.1630.6701292151
NE19JixiK10.93462.71.71.671.54.040.72180324213240
NE14BoliK10.9579.719.10.70.567.53.750.9221.810066773
NE13BoliK11.0577.115.97075.784.40.7712.7202155168
NE12BoliK11.1481.516.11.50.974.274. 00.915. 300142539
NE5BoliK11.494.7203.364.583.480.6527.5400153550
NE3BoliK11.690.56.403.185.143.420.187.540349312364
* = No data; GA = geological age; K1 = early Cretaceous; %R max = mean maximum vitrinite reflectance under oil immersion. V = vitrinite; I = inertinite; L = liptinite.
Table 2. Pore analysis and mercury porosimetry results of the selected coal samples.
Sample No.Porosity (%)IMS (%)EMS (%)PTM (μm)Total Volume (cm3)Pore Volume Distribution (%)Type of IMC
V1V2V3
NE 11.864.926.8690.1210.2672.0721.26.73
NE 3168.8216.410.0610.6979.813.127.08
NE 4170.6918.160.111.773.7218.028.27
NE 61.469.3114.550.18.2378.4814.157.37
NE 71.784.0239.230.079.5853.2113.0333.76
NE 94.960.8939.950.0710.5363.1211.225.68
NE 103.352.2325.130.1710.6675.8114.729.47
NE 111.970.8319.320.128.0673.4920.665.85
NE 123.283.0255.380.031148.448.7542.81
NE 132.756.9328.940.049.6272.869.0218.12
NE 141.563.6516.010.0610.2979.3112.538.16
NE 164.266.3840.310.3610.6465.3223.6411.05
NE 191.834.9920.870.1110.5774.2817.328.4
NE 383.391.8662.370.1610.2340.2429.2630.46
IMS = Injection of mercury saturation (%); EMS = Extrusion of mercury saturation (%); PTM = Pore throat mean (μm); IMC = Injection of mercury curves; V1 = Pore diameter smaller than 100 nm; V2 = Pore diameter ranges from 102 to 103 nm; V3 = Pore diameter ranges larger than 103 nm.
Table 3. Coal facies indexes and coal facies type in Sangjiang-Muling coal-bearing basins.
Sample No.BasinGACoal Petrography CompositionCoal Face IndexesCoal Facies Types
VILMMTPIGIWIGWI
NE1JixiK177.58.513.60.49.99.1130.01Type Ⅰ
NE2JixiK1953.701.319.125.7380.01Type Ⅲ
NE3BoliK190.56.403.113.114.18.80.08Type Ⅰ
NE4BoliK191.85.802.412.915.8360.03Type Ⅰ
NE5BoliK194.7203.326.247.4250.05Type Ⅲ
NE6BoliK173.719.66.20.57.84.3100.05Type Ⅰ
NE7HegangK178.310.311.10.30.37.60.20.04Type Ⅰ
NE8JixiK178.14.114.833.924.74.20.14Type Ⅰ
NE9JixiK184.112.130.85.376.40.01Type Ⅰ
NE10JixiK176.817.54.80.96490.04Type Ⅰ
NE11BoliK175.95.618.20.31414140Type Ⅰ
NE12BoliK181.516.11.50.94570.03Type Ⅰ
NE13BoliK177.115.9704540.02Type Ⅰ
NE14BoliK179.719.10.70.55490.02Type Ⅰ
NE15BoliK182.112.650.36770.03Type Ⅰ
NE16BoliK17721.801.274280.05Type Ⅰ
NE17JixiK190.21.508.3196050.26Type Ⅲ
NE18JixiK189.21.37.522269330.02Type Ⅲ
NE19JixiK13462.71.71.67190.05Type Ⅰ
NE20HegangK183.97.38.30.551350.04Type Ⅰ
NE21HegangK181.112.75.80.4127140.02Type Ⅰ
NE22BoliK1851203127220.04Type Ⅰ
NE23BoliK182.81.313.42.51583160.06Type Ⅲ
NE24BoliK195.11.430.52368270.03Type Ⅲ
NE25BoliK188.810.400.85970.03Type Ⅰ
NE26HegangK193.64.81.20.43320260.03Type Ⅲ
NE27JixiK193.94.80.80.51220160.01Type Ⅰ
NE28JixiK186.15.262.7917110.04Type Ⅰ
NE29JixiK185.29.92.32.6119170.03Type Ⅰ
NE30JixiK195.10.92.71.327106300.01Type Ⅲ
NE31JixiK193.94.201.94722560.04Type Ⅱ
NE32JixiK187.99.602.5189580.09Type Ⅱ
NE33JixiK158.432.58.90.22230.04Type Ⅰ
NE34JixiK192.81.850.43552180.04Type Ⅲ
NE35JixiK165.623.19.91.42330.14Type Ⅰ
NE36JixiK184.58.23.34810150.09Type Ⅰ
NE37JixiK177.315.26.80.73630.01Type Ⅰ
NE38HegangK170.611.617.20.66770.07Type Ⅰ
GA = geological age; K1 = early Cretaceous; V = vitrinite; I = inertinite; L = liptinite; MM = syngenetic minerals matter; TPI = Tissue preservation index; GI = Gelification index; WI = Wood index; GWI = Groundwater influence index.

