Article

A New Approach for Fault Detection, Location and Diagnosis by Ultrasonic Testing

by
Fausto Pedro García Marquez
1 and
Carlos Quiterio Gómez Muñoz
2,*
1
Ingenium Research Group, Castilla-La Mancha University, 13001 Ciudad Real, Spain
2
School of Architecture, Engineering and Design, Universidad Europea de Madrid, 28670 Villaviciosa de Odón, Spain
*
Author to whom correspondence should be addressed.
Energies 2020, 13(5), 1192; https://doi.org/10.3390/en13051192
Submission received: 27 January 2020 / Revised: 25 February 2020 / Accepted: 27 February 2020 / Published: 5 March 2020
(This article belongs to the Special Issue Maintenance Management of Wind Turbines)

Abstract

:
Wind turbine blades are constantly submitted to different types of particles such as dirt, ice, etc., as well as all the different environmental parameters that affect the behaviour and efficiency of the energy generation system. These parameters can cause faults to the wind turbine blades, modifying their behaviour due, for example, to the turbulence. A new method is presented in this paper based on cross-correlations to determine the presence of delamination in the blades. The experiments were conducted in two real wind turbine blades to analyse the fault and non-fault blades using ultrasonic guided waves. Finally, the energy analysis of the signal based on wavelet transforms allowed to determine energies abrupt changes in the correlation of the signals and to locate the faults.

1. Introduction

Wind energy is a growing renewable energy due to greater heights and powers of current wind turbines, with new and moderns installations [1]. It is expected new installations, with more than 55 GW every year until 2023 for onshore and offshore (Figure 1) [2]. Offshore installations are increasing its capacity with the associated technical issues in installation and maintenance. It is predicted to reach 2182 TW by 2030.
A wind turbine is composed of several subsystems, transforming wind energy into electric energy [3]. The wind induces the movement into the wind turbine blades (WTBs), and the main shaft transmits the mechanical energy into the gearbox. The main shaft is supported by bearings and it is connected to the generator. Different subsystems are designed for supporting the normal behaviour of the wind turbine, e.g., the meteorological unit, for controlling the pitch and brake systems. Wind farms are located in remote areas under the severe weather conditions and, consequently, each wind turbine presents problems related to ice and snow deposition on the WTBs, breakage of WTBs by impact of objects, etc. [4,5]. The wind turbine rotor, electrical devices, plant control system, hydraulic and sensors have more than 50% of total failures [6,7].
The maintenance operations have high costs, risks for workers, and energy production losses due to downtimes [8]. The wind turbine operation and maintenance (O&M) costs are between 10–25% of the total costs [9]. The efficiency and security of O&M activities are reduced due to the working conditions, and novel failure prediction techniques are required to avoid downtimes and increasing the reliability of the installations [10].
In recent years, there is an important evolution in designs, materials, mechanical electronic, electrical and control of wind turbines [11]. The short-term objective of renewable energies is to increase their participation in total energy production. It is necessary to improve productivity and profitability [1,12]. The new advances in renewable energy technologies lead to this industry to be more competitive in the energy market by reducing the operation and maintenance costs. The industry requires also to improve the reliability, availability, maintainability and safety of the systems [13]. Novel technological solutions are needed to increase the competitiveness based on the maintenance cost reduction for ensuring the efficient positioning of this technology in the energy market [14]. The improvement in the maintenance management operations will help to reach the competitiveness in wind power in terms of reliability, lifetime and availability [15]. Other key factor for the evolution of an industry is the cost reduction and the system efficiency by new strategies based on advance analytics [16,17], for example, the optimization of maintenance resources or the correct use of them [18,19]. Maintenance management is considered as transcendental to improve the benefit margin [20].
The wind farm maintenance management is also complex due to the machine locations and meteorological conditions [21]. These preventive and corrective works are done over the time [22,23], but they are expensive and generate risk for the operators, working in high altitude. The generation of false alarm or deceptive signals of the monitorization system is being a fundamental issue in the management [24,25,26].
WTB are generally made with sandwich materials that are introduced inside its structure. These materials are based on composite skins, with the core being composed of lightweight and isotropic materials. The WTBs need to be designed according to their complexity with low weight and good mechanical properties. The WTBs must have a high resistance to fatigue, wear and tear, as well as low thermal expansion and conductivity. The WTBs are considered one of the essential components, which are subject to heavy loads and weather conditions. The WTB failures are expensive, and they can damage other WTBs or other parts of the wind turbine. It has been demonstrated that efficient non-destructive tests (NDT) processes should increase the WTB life cycle and reduce the probability of failure occurrence. The composite material is formed by long fibres that are set within a matrix, which is responsible of binding the fabrics. The composite materials depend on the order in which the fibres are stacked, the orientation, as well as their own physical properties. The sandwich structures are made up by two outer coatings covering a lightweight material called the core. They are designed to provide high rigidity whilst being lightweight. The core function is to prevent undesired movement of the outer coatings and has higher thickness and lower density compared to them.
The main interest in maintenance management is being able to employ a condition monitoring system (CMS) capable to predict failures [27,28]. The wind turbine components are exposed to physical efforts such as stress or compression, and chemical or environmental conditions such as erosion or surface degeneration [29]. They can facilitate the appearance of mechanical, electrical and structural failures [30]. It needs a correct maintenance plan and CMS to prevent almost the main failures [31].
CMS by ultrasonic guided waves is essential for the maintenance management of WTB. This system needs computing systems for continuous supervision of the main parameters to determine the condition. To achieve a correct CMS, it is required: Data acquisition: reading the physical behaviour and to convert it in a digital format to be computerized; Data processing: conversion of digital data into useful information about the condition of the WTB; Detection: determining whether the condition indicators are “normal” or “abnormal” by pattern recognition or signal processing; Diagnosis: setting the location and the severity of the fault in the WTB; Prognosis: analysing the life cycle of the fault before a failure and maintain the WTB functionality before replacement; Maintenance Management: to set what are the maintenance and correction actions to be taken and the way how they should be achieved.
Ultrasonic guided waves are employed in this paper as NDT for the WTB. They are considered to guarantee the operability of WTBs. There are different methods and algorithms that have been developed to monitor the condition of WTBs that use guided waves. Other NDT methods used in WTBs are, for example, radiography, optics, thermography and acoustics.
The tests have been designed in this paper in order to detect delamination in a real WTB. Delamination in WTBs is a structural issue that increase downtimes and costs. It consists in the separation of layers of the WTB, knowing that the WTB is made from composite materials. This separation produces points within the WTB of stress concentration, i.e., these areas are working with more traction and compression forces under normal working conditions. It would lead to cracks, and, therefore, partial or total failure in the WTB. The early detection of this phenomena is needed to prevent failures/faults in the WTB. This paper proposed ultrasonic guided waves to measure the WTB condition.
A novel approach that uses correlation analysis between a real damaged and undamaged WTB is employed for pattern recognition. The diagnosis is performed by wavelet transforms. The approach leads to detect and diagnosis faults, such as delamination, with a high accuracy.

2. Ultrasonic Testing Applied for CMS in WTBs

2.1. Non-Destructive Testing

NDT consists of non-invasive inspection techniques that are used to analyse the condition of the component studied. The techniques are also utilized to detect faults, e.g., corrosion or cracks. NDT is a safe, reliable and cost-effective inspection method of the components without damaging the part to be examined. The NDT may be carried out during or after the manufacturing process. In the case of manufacturing, inspections can determine if the parts tested are suitable for a desired function. NDT inspections can also be used to assess the current condition of equipment with faults, or to monitor any faulty parts. It allows decisions based on the information to optimize maintenance and to evaluate the remaining useful life of the equipment.

2.2. Ultrasonic Testing

Ultrasonic Testing is a technique that uses high frequency sound energy to do experiments and make measurements. Common uses for the ultrasonic inspection are in fault detection, dimensional measurements, the characterization of materials, etc. Ultrasonic inspection system consists of devices with a pulser and a receiver, which is able to produce high electrical voltage pulses to the transducers. The transducer generates high frequency ultrasonic energy that is induced and propagated in the form of waves through the material. In the case of detecting a fault within the material, e.g., a crack in the wave path, part of the signal energy will be reflected from the fault within the material. The reflected wave signal is transformed into an electrical signal by the transducer that is sent to a computer to be analysed. This technique has the origin with the sound waves through water, where it was observed the reflected echoes to characterize submerged objects.

2.3. Long Range Ultrasonic Testing

Long Range Ultrasonic Testing (LRUT) is a cutting-edge NDT technique that is used for studying large volumes of material from a single test point. It leads to reduce the time needed to carry out multiple tests. LRUT does not require the existence of couplant gels or liquids between the transducers and the tested surface. Therefore, this technique is widely used in pipeline and plates inspections for corrosion and other fault types. The LRUT working procedure consists of fixing the transducer and generating a set of low frequency guided waves. The waves are then reflected back to the transducer whenever they reach a variation in the thickness of the wall of the plate or pipe, which would indicate the existence of corrosion, metal loss or other faults mechanisms. The LRUT has been employed because: it is sensitive to surface and subsurface discontinuities; it has high depth penetration for fault detection; it presents good accuracy for finding the reflector position, size and shape in the tested material; it requires a minimal preparation needed for testing; it gives results in real time; and the equipment is portable.

3. Case Study and Results

Two identical real WTBs have been employed in the experiments. One WTB has induced a set of delamination in the manufacturing process. The WTB has been inspected by placing the transmitter transducer on the tip and placing the transducer receiver every 100 mm along the length of the WTB. Figure 2 illustrates the WTBs on which the non-destructive tests have been conducted.
This is performed on both WTBs in order to analyse them completely. The WTBs have a length of 4000 mm and they have a honeycomb core within them.
The method employed to collect the ultrasonic signals is pitch and catch. The transducers used were Macro Fibre Composites (MFC) [14,32], specifically, the model M2814-P1 from Smart Material, and they were attached on the surface. A transducer serving as transmitter is located on the tip of the WTB. The position of the transmitter does not change, while the receiver is placed at different distances along the WTB (Figure 3). The first position of the receiver is 100 mm from the transmitter, and the experiments were done increasing the distance 100 mm until 3800 mm (38 different locations). d in Figure 3 is the distance between the transmitter and the sensor.
The signal generated by the transducer was a five cycles sinusoidal shaped signal, modulated by a Hanning window. At each position, a frequency sweep was deployed from 10 kHz to 100 kHz, with steps of 5 kHz, but only 50 kHz frequencies were selected because they had the best signal to noise ratio for this material. The aim of this work is to find evidence in the signal that may determine that there is a defect in the WTB, analysing the guided waves that travel through the faults.
The 50 kHz signals of the 38 distances were pooled to analyse the correlation between them. Figure 4 shows the location of the sandwich and faults locations that have been induced in the damaged WTB.
The approach is based on the following steps:
(1)
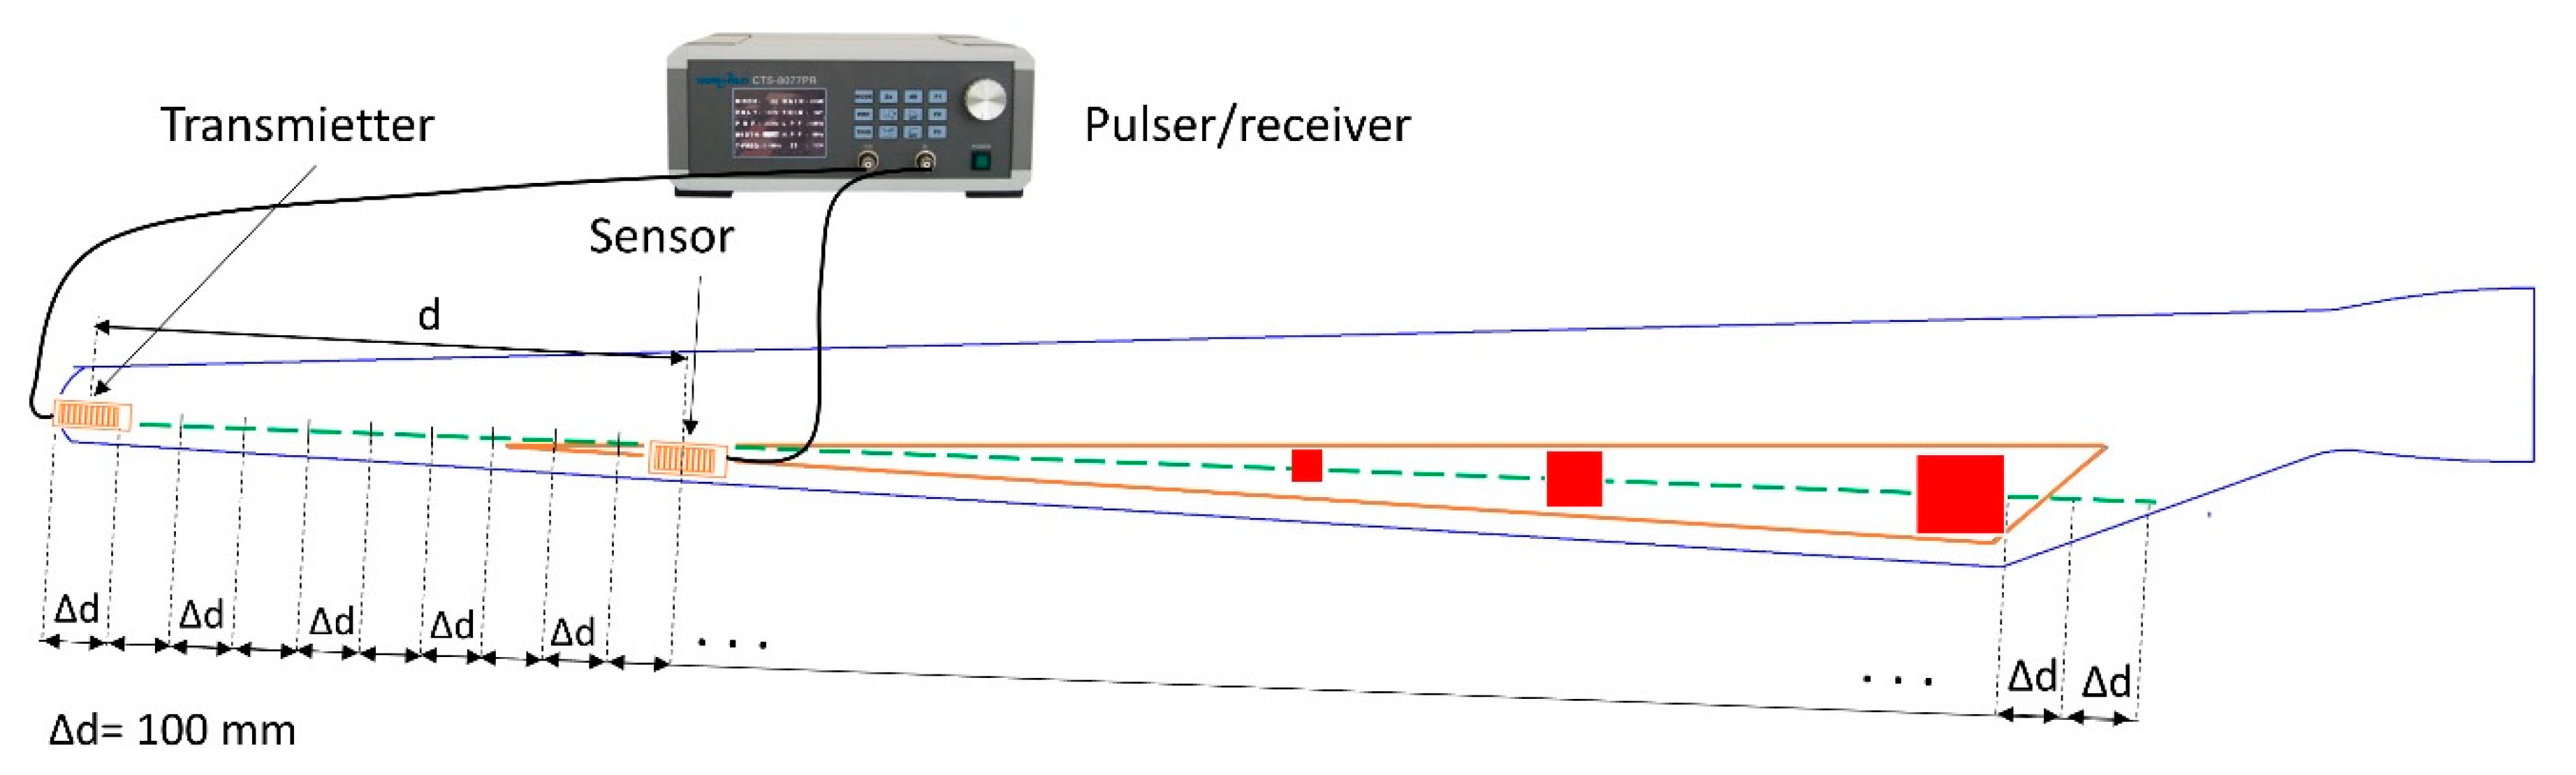
Firstly, an autocorrelation is performed between each pair of adjacent signals, for example, the first pair are those that are located to 100 and 200 mm from the tip, the next pair are 200 and 300 mm from the tip, etc. If there are no faults on the WTBs, the shape of the contiguous signals will be almost the same and with a high correlation. However, if between two adjacent signals there is a delamination that modifies the shape of the ultrasonic wave, then there will be a lower correlation between the signals. It will indicate the possibility of the existence of a defect in the WTB. This procedure has been performed for both the healthy and the faulty WTB.
(2)
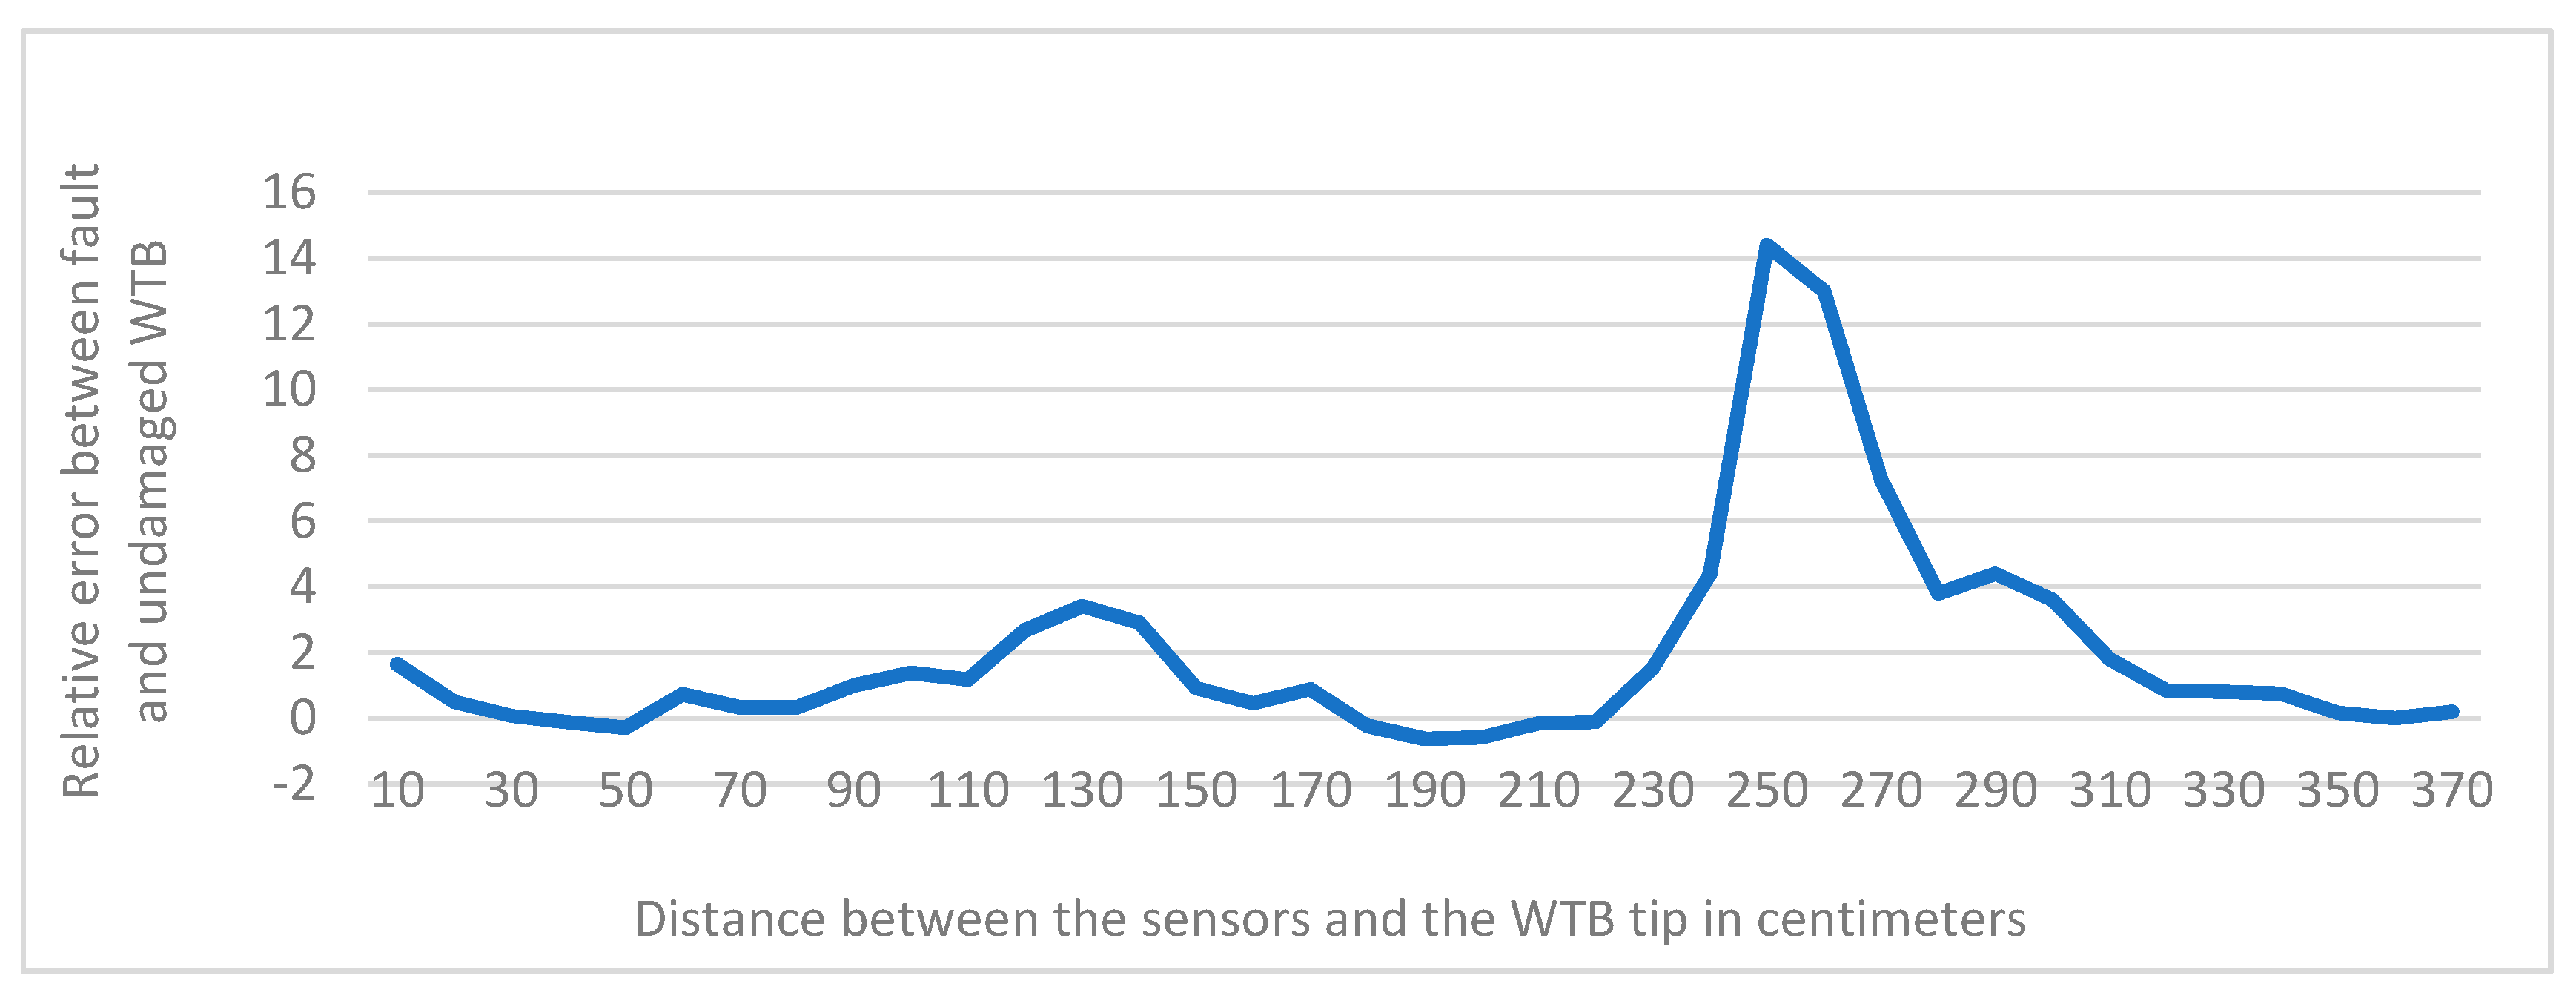
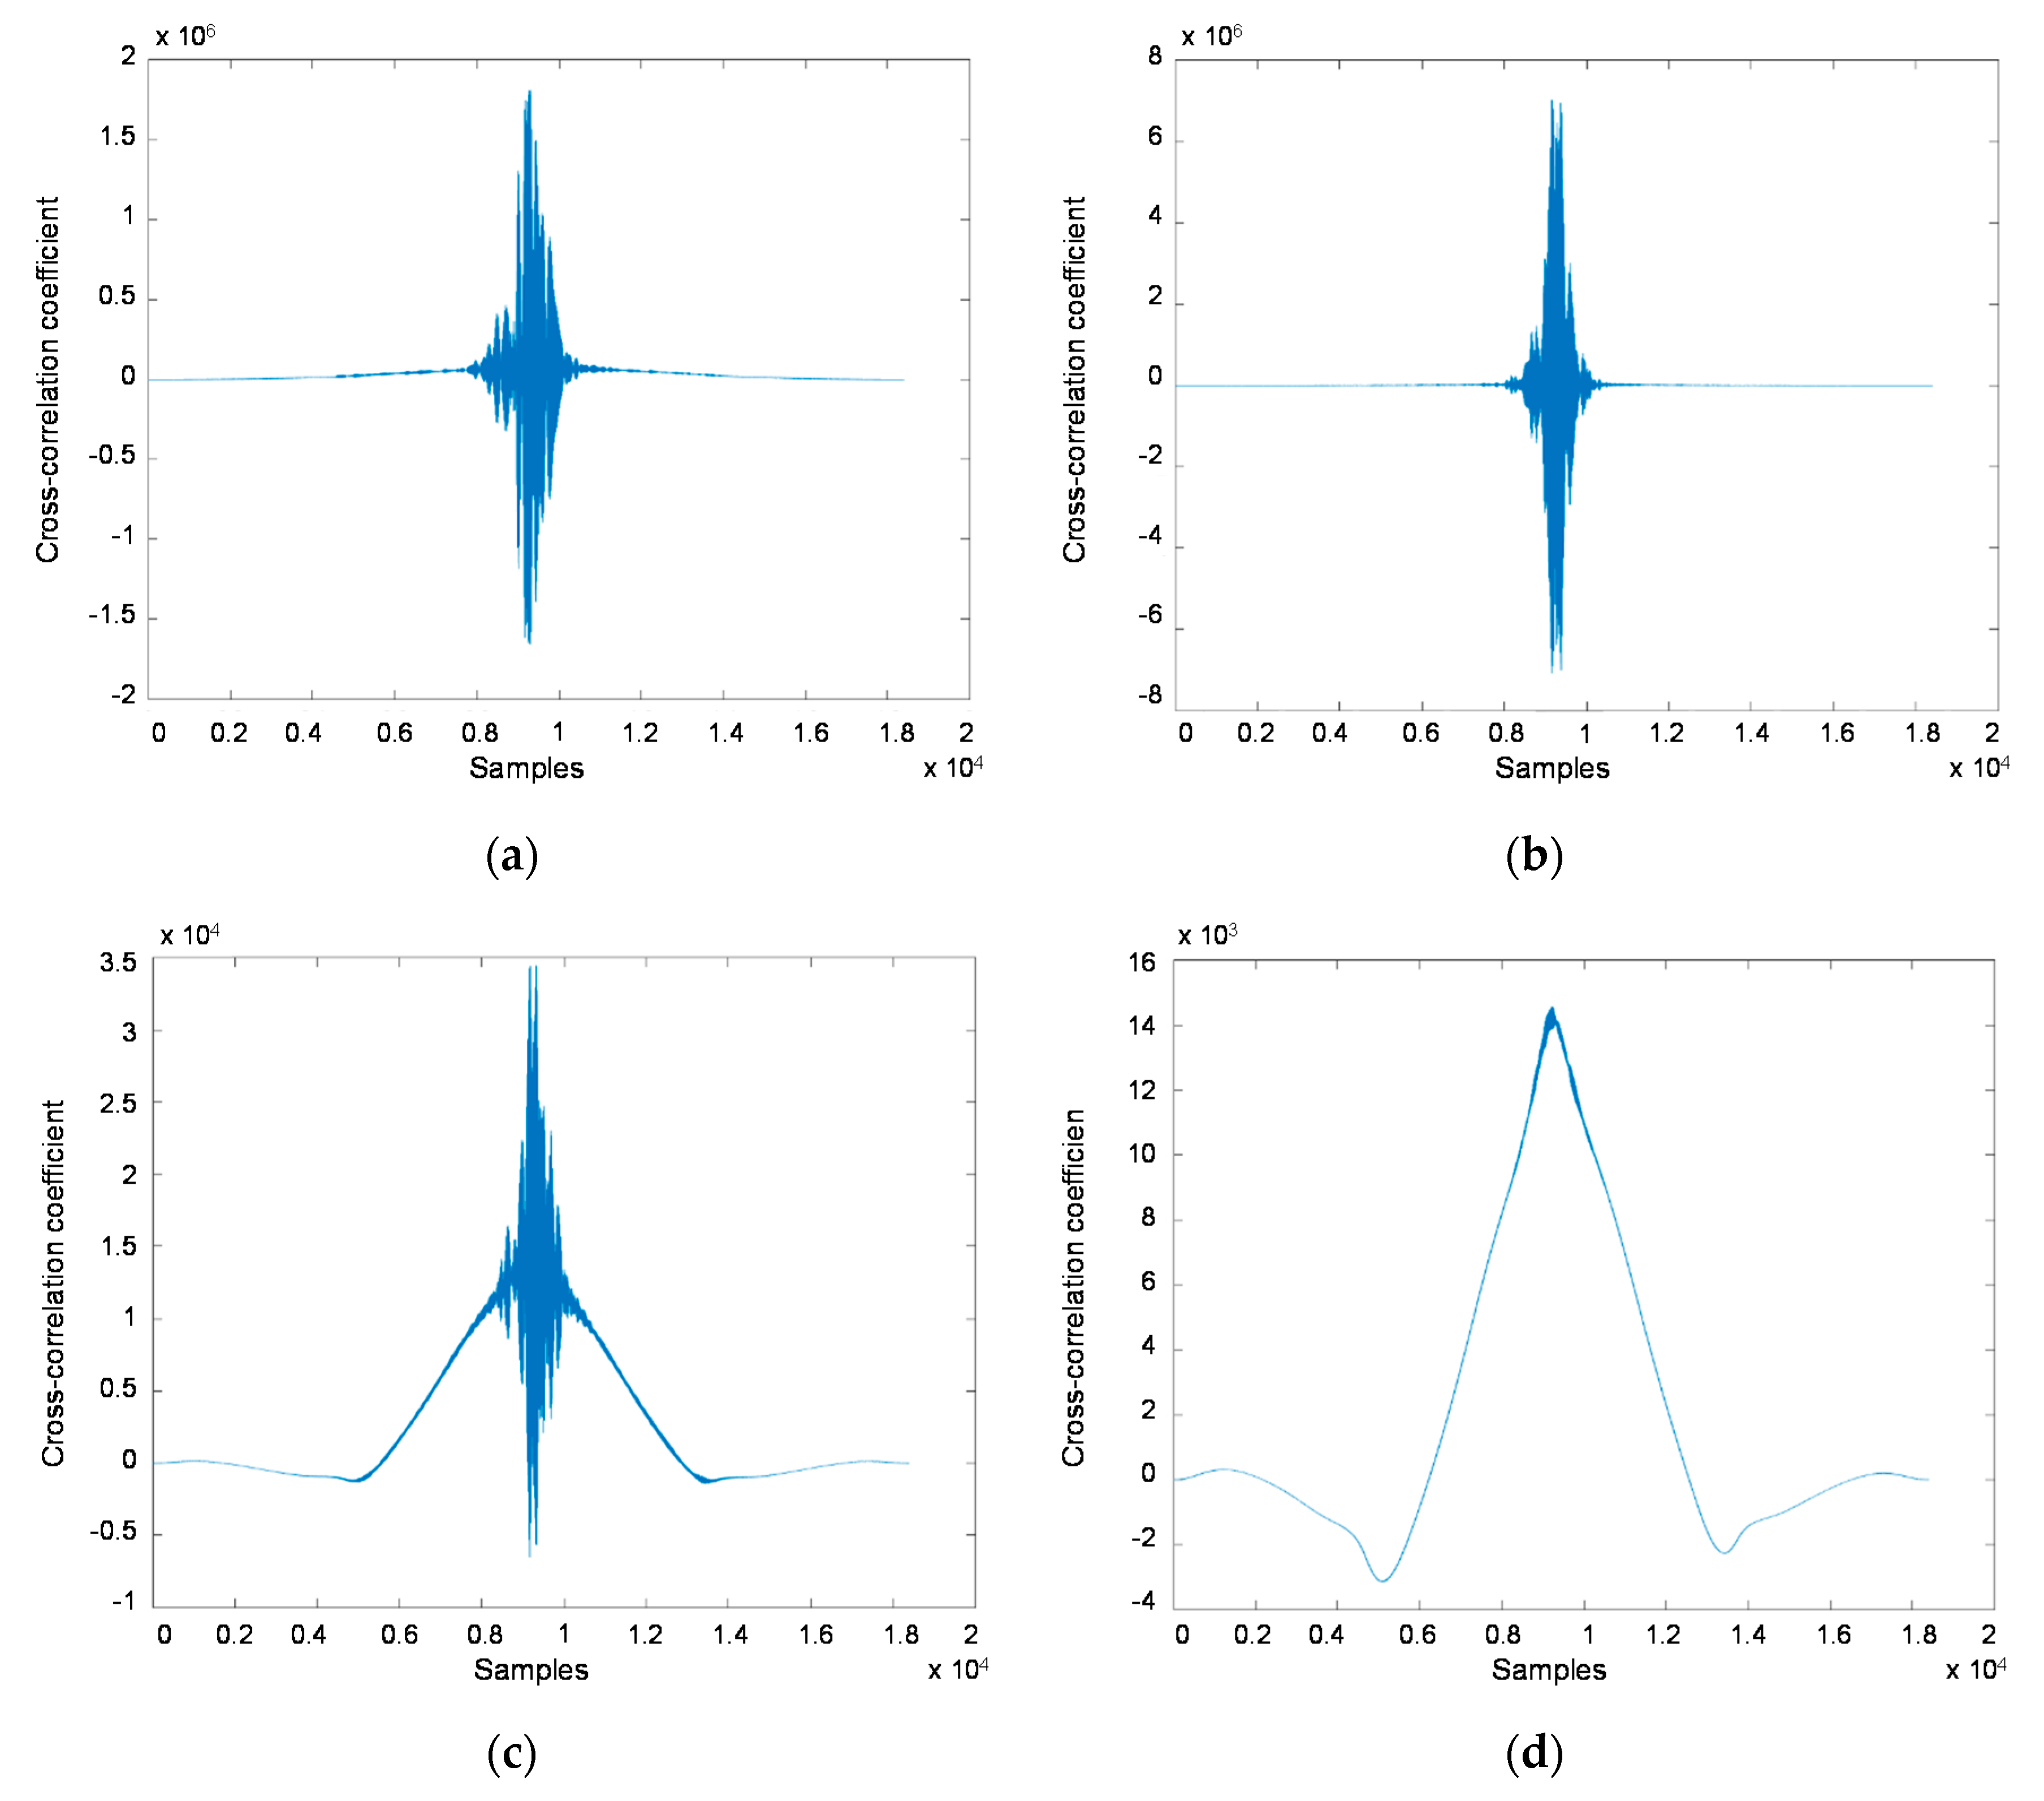
Secondly, a new cross correlation was made between the signals obtained in the previous section to study the results between both WTBs. Every WTB is analysed together with WTB free of faults and, if the correlation between both areas of the WTB is high, it indicates that the WTB is healthy. On the contrary, if there is a low correlation between an area and the homologous zone of the healthy WTB, where it indicates that there is a discontinuity in that area that could be a delamination defect.
(3)
Finally, the diagnosis of the delamination is done employing wavelet transforms. The energies of both healthy and unhealthy WTBs are studied together.
The flowchart of the approach is shown in Figure 5.

3.1. Undamaged WTB

The distance set between the sensors was 100 mm, and 38 acquisitions were made for each WTB. Four significant signals are shown in Figure 6.
Figure 6a shows the signal obtained between 200 and 300 mm. The signals present a high similarity due to the absence of any fault. Figure 6b also shows great similarity because of the autocorrelation signals have been performed on the signals that were acquired at 700 and 800 mm from the tip. They are located just before the beginning of the sandwich area. This similarity is found by high cross-correlation coefficients. The cross-correlation coefficients between the signals at 700 and 800 mm are even greater than those obtained at the signals collected at 200 and 300 mm from the tip (Figure 6a). This is due to the signals closest to the transmitter transducer (Figure 6a) are affected by phenomena inherent in the generation of guided waves, e.g., ringing, that slightly decrease their cross-correlation coefficients. Figure 6c shows that the similarity level presents some differences and loss of energy due to the inherent imperfections of the WTB. There are some energy losses due to the attenuation of the elastic wave. Figure 6d shows that the similarity level is different and presents energy loss because of the distance travelled by the signals. Nevertheless, the changes in the degree of similarity only occurs as a consequence of the imperfections within the WTB and not by a fault.

3.2. Damaged WTB

This section presents the main results found analysing damaged WTB. The experiments were conducted to validate the location and severity of the WTB delamination. Figure 7a shows that the signals have similar patterns between the healthy and damage WTB because there is not any fault. Figure 7b is similar to Figure 6b because this location is just before the start of the sandwich, and the ultrasonic waves have not crossed any delamination zone in any WTB. Figure 7c shows the first defect within the WTB, being the closest to the WTB tip. It has been detected due to the correlation is less compared to the WTB without fault. The correlation shown in Figure 7d is lower due to the faults and the waves are attenuated by the distance travelled.
Figure 8 presents the relative error between the maximum of each correlation according to the position of the sensor in the WTB. The maximum relative error is found where the first fault is located.

3.3. Cross-Correlation between Healthy and Damaged WTBs

The autocorrelation of each pair of signals is analysed together with the damage and undamaged WTB. The attenuation effect is partially eliminated, since each pair of signals is compared between both WTBs. Figure 9 presents the main results.
Figure 9a shows a high similarity because the WTB areas studied are free of faults. It is found in the experiments where there is not faults. The signals presented in Figure 9b are related to the beginning of the sandwich in both WTBs, where they are similar because of the sandwich properties are the same in both WTBs. Figure 9c shows the signals where the first defect is located, being the correlation lower due to the delamination. Figure 9d is related to the second fault, being lower than the signals showed in Figure 9c.

3.4. Energy Analysis by Wavelet Transforms

The graphic representation is not useful for a deep study of an acoustic characterization [33]. For this reason, it is necessary to support this work with a mathematical treatment. The acoustic is a non-periodic deterministic signal, characterized with a sinusoidal pulse and defined by wavelength, amplitude, frequency. The acoustic signal can be analysed mathematically in time-frequency [34], therefore, the signal analysis can be studied by mathematical tools such as Fourier Transform (FT) [35,36]. The advantages of the wavelet transform prove that this technique is efficient for acoustic signals [37]. It is defined by Equation (1).
S ( τ , a ) = + s ( t ) 1 a Ψ ( t τ a ) dt
The conjugate of the mother wavelet Ψ* is obtained, moved and scaled point to point to detect the levels of contrast of the signal s(t), being f(t) the digitized signal in the time domain, a = f/f0 (a ≠ 0) the magnitude factor or delay of the wavelet, with f0 as central frequency and τ the translation in time [38]. Another common expression in acoustic representation is a frequency domain spectrum to study the frequency distribution range of the signal [39].
The wavelet transform is employed to obtain the signal energy decomposition divided in levels with the pyramidal algorithm and the decomposition tree. This method is employed for acoustics characterization and filtering [14,40]. There are various wavelet transforms modes, e.g., discrete or continuous [32,41]. The choice of the wavelet family is imposed by the characteristics of the signal and the nature of the application, being Dauchebies family one of the most used in the acoustic signal processing [42,43].
Signals are divided, therefore, into low frequency approximations (A) and high frequency details (D), where the sum of A and D is always equal to the original signal. The division is done using low pass and high pass filters. In order to reduce the computational and mathematical costs due to the data duplication, a sub-sampling is usually implemented, containing the half of the collected information from A and D without losing information.
In the case of the multi-level filters, they repeat the filtering process with the output signals from the previous level. This leads to the wavelet decomposition trees (Figure 10). Additional information is obtained by filtering at each level. However, more decompositions levels do not always mean more accurate results. References [44,45] show more details about the decomposition level using wavelet transform.
The objective of the signal pre-processing is to extract the most important information of the original signal before carrying out the signal de-noising. It generates new signals adjusted for the application of filters, providing more robust results and greater similarity between signals obtained under different conditions.
The energy of the signals has been calculated by wavelet transforms. The energies have been employed to study the severity of the faults. Figure 11 shows that there is a high correlation between the signals obtained from the WTBs in the first two areas analysed. However, when the ultrasonic waves reach the location of the first fault in the damaged WTB, the correlation between the healthy WTB and the damaged WTB decreases and, therefore, decreases its energy.
The accuracy of the results has been calculated analysing them with the real scenarios according to ISO 5725-1. It has been estimated as 92%, because in certain cases the fault detection was not clear enough.
It cannot be concluded that it can be applied to WTBs in operations because it has not been tested. Nevertheless, the results have been validated in cases where they are pre-installed.

4. Conclusions

Wind turbine blades are submitted to severe mechanical and environment conditions and, therefore, they present a high failure rate and downtimes by faults/failures. Novel and robust maintenance procedures are required. This paper presents a condition monitoring system based on ultrasonic guided waves to study the structure heath monitoring. A guided wave inspection has been conducted from the tip of the blades, acquiring the signals every 100 mm. The approach is based on correlations analysis between a damaged and undamaged real wind turbine blades. Finally, the diagnosis is done by wavelet transforms. The main conclusions are:
  • The approach leads to detect and diagnose faults such as delamination with a high accuracy.
  • The autocorrelation of each pair of signals is analysed together with the damage and undamaged wind turbine blade. The attenuation effect is partially eliminated because of each pair of signals is compared between both blades.
  • The pattern recognition presents a high correlation when a fault is not found. On the other side, the correlation found is lower when a delamination is found.
  • The wavelet transform is employed to obtain the signal energy decomposition divided in levels with the pyramidal algorithm and the decomposition tree.
  • The choice of the wavelet family was Dauchebies family due to they provide accuracy results in the acoustic signal processing.
  • The energies have been employed to study the severity of the faults.
  • The accuracy of the results has been calculated analysing them with the real scenarios. It has been estimated as 92%, due to certain cases not having a clear enough fault detection.

Author Contributions

All authors formulated the problem and methodology. F.P.G.M. contributed in the design of the tests, the analysis and writing. C.Q.G.M. performed the tests and wrote the draft of the paper. All authors have read and agreed to the published version of the manuscript.

Funding

The work reported herewith has been financially by the Dirección General de Universidades, Investigación e Innovación of Castilla-La Mancha, under Research Grant ProSeaWind project (Ref.: SBPLY/19/180501/000102).

Conflicts of Interest

The authors declare no conflict of interest.

References

  1. Muñoz, C.Q.G.; Márquez, F.P.G. Future maintenance management in renewable energies. In Renewable Energies; Springer: Berlin/Heidelberg, Germany, 2018; pp. 149–159. [Google Scholar]
  2. Council, G.W.E. Global Wind Report; Global Wind Energy Council: Brussels, Belgium, 2019. [Google Scholar]
  3. Polinder, H.; Ferreira, J.A.; Jensen, B.B.; Abrahamsen, A.B.; Atallah, K.; McMahon, R.A. Trends in wind turbine generator systems. IEEE J. Emerg. Sel. Top. Power Electron. 2013, 1, 174–185. [Google Scholar] [CrossRef]
  4. Muñoz, C.Q.G.; Márquez, F.P.G. Wind Energy Power Prospective. In Renewable Energies; Springer: Berlin/Heidelberg, Germany, 2018; pp. 83–95. [Google Scholar]
  5. Jiménez, A.A.; Muñoz, C.Q.G.; Márquez, F.P.G. Dirt and mud detection and diagnosis on a wind turbine blade employing guided waves and supervised learning classifiers. Reliab. Eng. Syst. Saf. 2019, 184, 2–12. [Google Scholar] [CrossRef] [Green Version]
  6. Tchakoua, P.; Wamkeue, R.; Ouhrouche, M.; Slaoui-Hasnaoui, F.; Tameghe, T.A.; Ekemb, G. Wind turbine condition monitoring: State-of-the-art review, new trends, and future challenges. Energies 2014, 7, 2595–2630. [Google Scholar] [CrossRef] [Green Version]
  7. García Márquez, F.; Marugán, A.P.; Pérez, J.M.P.; Hillmanse, S.; Papaelias, M. Optimal dynamic analysis of electrical/electronic components in wind turbines. Energies 2017, 10, 1111. [Google Scholar] [CrossRef] [Green Version]
  8. Walford, C.A. Wind Turbine Reliability: Understanding and Minimizing Wind Turbine Operation and Maintenance Costs; 2006. Available online: https://pdfs.semanticscholar.org/03dd/65b6a56a87fb9bd8e323b092b160d70c666f.pdf (accessed on 25 February 2020).
  9. Irena, I. Renewable Energy Technologies: Cost Analysis Series; IRENA Innovation Technology Center: Dubai, UAE, 2012; Volume 13, p. 2016. [Google Scholar]
  10. Pliego Marugán, A.; Márquez, F.P.G.; Lev, B. Optimal decision-making via binary decision diagrams for investments under a risky environment. Int. J. Prod. Res. 2017, 55, 5271–5286. [Google Scholar] [CrossRef]
  11. Njiri, J.G.; Soeffker, D. State-of-the-art in wind turbine control: Trends and challenges. Renew. Sustain. Energy Rev. 2016, 60, 377–393. [Google Scholar] [CrossRef]
  12. Spiess, H.; Lobsiger-Kägi, E.; Carabias-Hütter, V.; Marcolla, A. Future acceptance of wind energy production: Exploring future local acceptance of wind energy production in a Swiss alpine region. Technol. Forecast. Soc. Chang. 2015, 101, 263–274. [Google Scholar] [CrossRef]
  13. Stapelberg, R.F. Handbook of Reliability, Availability, Maintainability and Safety in Engineering Design; Springer-Verlag London: London, UK, 2009. [Google Scholar]
  14. De la Hermosa González, R.R.; Márquez, F.P.G.; Dimlaye, V. Maintenance management of wind turbines structures via MFCs and wavelet transforms. Renew. Sustain. Energy Rev. 2015, 48, 472–482. [Google Scholar] [CrossRef]
  15. Pérez, J.M.P.; Márquez, F.P.G.; Hernández, D.R. Economic viability analysis for icing blades detection in wind turbines. J. Clean. Prod. 2016, 135, 1150–1160. [Google Scholar] [CrossRef] [Green Version]
  16. Petković, D.; Pavlović, N.T.; Ćojbašić, Ž. Wind farm efficiency by adaptive neuro-fuzzy strategy. Int. J. Electr. Power Energy Syst. 2016, 81, 215–221. [Google Scholar] [CrossRef]
  17. Márquez, F.P.G.; Lev, B. Advanced Business Analytics; Springer: Berlin/Heidelberg, Germany, 2015. [Google Scholar]
  18. Sarker, B.R.; Faiz, T.I. Minimizing maintenance cost for offshore wind turbines following multi-level opportunistic preventive strategy. Renew. Energy 2016, 85, 104–113. [Google Scholar] [CrossRef]
  19. Pliego Marugán, A.; Márquez, F.P.G. Advanced analytics for detection and diagnosis of false alarms and faults: A real case study. Wind Energy 2019, 22, 1622–1635. [Google Scholar] [CrossRef]
  20. Shafiee, M.; Sørensen, J.D. Maintenance optimization and inspection planning of wind energy assets: Models, methods and strategies. Reliab. Eng. Syst. Saf. 2019, 192, 105993. [Google Scholar] [CrossRef]
  21. Tavner, P.; Gindele, R.; Faulstich, S.; Hahn, B.; Whittle, M.W.G.; Greenwood, D.M. Study of effects of weather & location on wind turbine failure rates. In Proceedings of the European wind energy conference EWEC, Warsaw, Poland, 20–23 April 2010. [Google Scholar]
  22. Pérez, J.M.P.; Asensio, E.S.; Márquez, F.P.G. Economic viability analytics for wind energy maintenance management. In Advanced Business Analytics; Springer: Berlin/Heidelberg, Germany, 2015; pp. 39–54. [Google Scholar]
  23. Marquez, F.G.; Singh, V.; Papaelias, M. A Review of Wind Turbine Maintenance Management Procedures. In Proceedings of the Eighth International Conference on Condition Monitoring and Machinery Failure Prevention Technologies, Cardiff, Wales, 20–22 June 2011. [Google Scholar]
  24. Marugán, A.P.; Chacón, A.M.P.; Márquez, F.P.G. Reliability analysis of detecting false alarms that employ neural networks: A real case study on wind turbines. Reliab. Eng. Syst. Saf. 2019, 191, 106574. [Google Scholar] [CrossRef] [Green Version]
  25. Márquez, F.P.G. A new method for maintenance management employing principal component analysis. Struct. Durab. Health Monit. 2010, 6, 89–99. [Google Scholar]
  26. Pedregal, D.J.; García, F.P.; Roberts, C. An algorithmic approach for maintenance management based on advanced state space systems and harmonic regressions. Ann. Oper. Res. 2009, 166, 109–124. [Google Scholar] [CrossRef]
  27. Marquez, F.G. An Approach to Remote Condition Monitoring Systems Management. In Proceedings of the IET International Conference on Railway Condition Monitoring, Birmingham, UK, 29–30 November 2006. [Google Scholar]
  28. Márquez, F.P.G.; Pedregal, D.J. Applied RCM 2 algorithms based on statistical methods. Int. J. Autom. Comput. 2007, 4, 109–116. [Google Scholar] [CrossRef]
  29. Qiao, W.; Lu, D. A Survey on Wind Turbine Condition Monitoring and Fault Diagnosis—Part I: Components and Subsystems. IEEE Trans. Ind. Electron. 2015, 62, 6536–6545. [Google Scholar] [CrossRef]
  30. Pérez, J.M.P.; Márquez, F.P.G.; Tobias, A.; Papaelias, M. Wind turbine reliability analysis. Renew. Sustain. Energy Rev. 2013, 23, 463–472. [Google Scholar] [CrossRef]
  31. Benmessaoud, T.; Mohammedi, K.; Smaili, Y. Influence of maintenance on the performance of a wind farm. Przegląd Elektrotech. 2013, 89, 174–178. [Google Scholar]
  32. De la Hermosa Gonzalez, R.R.; Márquez, F.P.G.; Dimlaye, V.; Ruiz-Hernández, D. Pattern recognition by wavelet transforms using macro fibre composites transducers. Mech. Syst. Signal Process. 2014, 48, 339–350. [Google Scholar] [CrossRef]
  33. Gómez Muñoz, C.Q.; Jimenez, A.A.; Marquez, F.P.G.; Kogia, M.; Cheng, L.; Mohimi, A.; Papaelias, M. Cracks and welds detection approach in solar receiver tubes employing electromagnetic acoustic transducers. Struct. Health Monit. 2018, 17, 1046–1055. [Google Scholar] [CrossRef]
  34. Hammond, J.; White, P. Fundamentals of Signal Processing; Springer: Berlin/Heidelberg, Germany, 2016; p. 145. [Google Scholar]
  35. Portnoff, M. Time-frequency representation of digital signals and systems based on short-time Fourier analysis. IEEE Trans. Acoust. Speech Signal Process. 1980, 28, 55–69. [Google Scholar] [CrossRef]
  36. Weller, H. Fourier Analysis; 2015. Available online: http://www.met.reading.ac.uk/~sws02hs/teaching/Fourier/Fourier_2_student.pdf (accessed on 25 February 2020).
  37. Zhang, D. Wavelet Transform, in Fundamentals of Image Data Mining; Springer: Berlin/Heidelberg, Germany, 2019; pp. 35–44. [Google Scholar]
  38. Zhang, D. Wavelet Transform, in Fundamentals of Image Data Mining: Analysis, Features, Classification and Retrieval; Springer International Publishing: Cham, Switzerland, 2019; pp. 35–44. [Google Scholar]
  39. Pandarakone, S.E.; Mizuno, Y.; Nakamura, H. Distinct Fault Analysis of Induction Motor Bearing Using Frequency Spectrum Determination and Support Vector Machine. IEEE Trans. Ind. Appl. 2017, 53, 3049–3056. [Google Scholar] [CrossRef]
  40. Gokgoz, E.; Subasi, A. Comparison of decision tree algorithms for EMG signal classification using DWT. Biomed. Signal Process. Control 2015, 18, 138–144. [Google Scholar] [CrossRef]
  41. Goudarzi, M.; Vahidi, B.; Naghizadeh, R.A.; Hosseinian, S.H. Improved fault location algorithm for radial distribution systems with discrete and continuous wavelet analysis. Int. J. Electr. Power Energy Syst. 2015, 67, 423–430. [Google Scholar] [CrossRef]
  42. Sheikh, J.A.; Parah, S.A.; Akhtar, S.; Bhat, G.M. Compression and denoising of speech transmission using Daubechies wavelet family. Int. J. Wirel. Mob. Comput. 2017, 12, 313–334. [Google Scholar] [CrossRef]
  43. Muñoz, C.Q.G.; Jiménez, A.A.; Márquez, F.P.G. Wavelet transforms and pattern recognition on ultrasonic guides waves for frozen surface state diagnosis. Renew. Energy 2018, 116, 42–54. [Google Scholar] [CrossRef]
  44. Rahim, A.A.A.; Abdullah, S.; Singh, S.S.K.; Nuawi, M.Z. Selection of the optimum decomposition level using the discrete wavelet transform for automobile suspension system. J. Mech. Sci. Technol. 2020, 34, 137–142. [Google Scholar] [CrossRef]
  45. Srivastava, A.; Bhateja, V.; Shankar, A.; Taquee, A. On Analysis of Suitable Wavelet Family for Processing of Cough Signals. In Frontiers in Intelligent Computing: Theory and Applications; Springer: Singapore, 2020; pp. 194–200. [Google Scholar]
Figure 1. Wind energy capacity and projection. Data from Council, G.W.E. Global wind report [2].
Energies 13 01192 g001
Figure 2. Wind turbine blades (WTBs) with delamination and without delamination in which the guided ultrasound wave tests were applied.
Energies 13 01192 g002
Figure 3. Location of the transducers along the WTB.
Energies 13 01192 g003
Figure 4. Defect locations in the faulty WTB. A, B and C areas are the disbonds between the honeycomb and the skin.
Energies 13 01192 g004
Figure 5. Approach for delamination detection in WTBs.
Energies 13 01192 g005
Figure 6. Cross-correlation between adjacent signals of undamaged WTB: (a) 200–300 mm; (b) 700–800 mm; (c) 2,300–2,400 mm; and (d) 2,900 and 3,000 mm.
Energies 13 01192 g006
Figure 7. Cross-correlation between adjacent signals of damaged WTB: (a) 200–300 mm; (b) 700–800 mm; (c) 2,300–2,400 mm; and (d) 2,900 and 3,000 mm.
Energies 13 01192 g007
Figure 8. Relative error between damaged and undamaged WTB for each location of the sensor.
Energies 13 01192 g008
Figure 9. Cross-correlation between undamaged and damaged WTB: (a) 200–300 mm; (b) at 700–800 mm; (c) at 2,300–2,400 mm; and (d) 2,900–3,000 mm.
Energies 13 01192 g009
Figure 10. Wavelet decompositions tree.
Energies 13 01192 g010
Figure 11. Evolution of energy throughout the WTBs.
Energies 13 01192 g011

