The Effect of Air leakage through the Air Cavities of Building Walls on Mold Growth Risks

 ,
,  , and
, and
Abstract
1. Introduction
2. Experimental Setup
2.1. Survey
2.2. Monitoring
3. Simulation
3.1. Governing Equations
3.2. Simulated Room and Wall Structure
4. Measurement Results and Discussion
4.1. Weather Conditions
4.2. Next Rooms and the Outdoors
4.3. Comparison among the Rooms
4.4. Monitored Room
4.4.1. Air Temperature and Humidity
4.4.2. Surface Temperature
4.4.3. Surface Water Content
4.5. Mold Growth Risk Analysis
5. Simulation Results and Discussion
5.1. Validation of the Proposed Hygrothermal Model
5.2. Comparison between cases with/without Air Leakage through the Air Cavity
5.3. Hygrothermal Conditions of the Air Cells
5.4. Mold Growth Risk of Wall Cells
6. Conclusions
Author Contributions
Funding
Conflicts of Interest
References
- Hens, H. IEA Annex 14: Condensation and Energy. J. Build. Phys. 1992, 3, 261–273. [Google Scholar]
- Adan, O.; Brocken, H.; Carmeliet, J. Determination of Liquid Water Transfer Properties of Porous Building, Materials and Development of Numerical Assessment Methods: Introduction to the EC, HAMSTAD Project. J. Build. Phys. 2004, 27, 253–260. [Google Scholar] [CrossRef]
- Becker, R. Condensation and Mold Growth in Dwellings—Parametric and Field Study. Build. Environ. 1984, 19, 243–250. [Google Scholar] [CrossRef]
- World Health Organization Regional Office for Europe. Guidelines on Indoor Air Quality: Dampness and Mold; Druckpartner Moser: Berlin, Germany, 2009. [Google Scholar]
- Hirota, K.; Shibuya, S.; Sakamoto, S.; Kashima, S. A Methodology of Estimation on Air Pollution and Its Health Effects in Large Japanese Cities. Air Quality—Monitoring and Modeling; University Library of Munich: Munich, Germany, 2012. [Google Scholar]
- World Health Organization. Development of WHO Guidelines for Indoor Air Quality: Dampness and Mold; Report on a working group meeting Bonn; WHO: Bonn, Germany, 2007. [Google Scholar]
- World Health Organization. Indoor Air Pollutants: Exposure and Health Effects. In Working Group on Assessment and Monitoring of Exposure to Indoor Pollutants; WHO: Nordlingen, Germany, 1983. [Google Scholar]
- Sharpe, R.A.; Bearman, N.; Thornton, C.R.; Husk, K.; Osborne, N.J. Indoor fungal diversity and asthma: A meta-analysis and systematic review of risk factor. J. Allergy Clin. Immunol. 2015, 135, 110–122. [Google Scholar] [CrossRef] [PubMed]
- Biagini, J.M.; LeMasters, G.K.; Ryan, P.H.; Levin, L.; Reponen, T.; Bernstein, D.; Villareal, M.; Khurana, H.G.K.; Burkle, J. Environmental risk factors of rhinitis in early infancy. Pediatric Allergy Immunol. 2010, 17, 278–284. [Google Scholar] [CrossRef] [PubMed]
- Crook, B.; Burton, N.C. Indoor molds, sick building syndrome and building related illness. Fungal Biol. Rev. 2010, 24, 106–113. [Google Scholar] [CrossRef]
- Mudarri, D.; Fisk, W.J. Public health and economic impact of dampness and mold. Indoor Air 2007, 17, 226–235. [Google Scholar] [CrossRef]
- Lu, C.; Deng, Q.; Li, Y.; Sundell, J.; Norback, D. Outdoor air pollution, meteorological conditions and indoor factors in dwellings in relation to sick building syndrome (SBS) among adults in China. Sci. Total Environ. 2016, 560–561, 186–196. [Google Scholar] [CrossRef]
- Adan, O. On the fungal defacement of interior finishes. Ph.D. Thesis, Technische Universiteit Eindhoven, Eindhoven, The Netherlands, 1994. [Google Scholar]
- Becker, R.; Puterman, M. Verhutung von Schimmelbildung in Gebauden. Teil 2: Einflus der Oberflachenmaterialien. Bauphysik 1987, 4, 107–110. [Google Scholar]
- Grinbergs, L.; Hyppel, A.; Hoglund, I.; Ottoson, G. Wet-room wall systems—Mold resistance. Proceedings of the International Symposium Energy Efficient Buildings (Design, Performance and Operation) of the CIB Working Commission W67 “Energy Conservation in the Built Environment” and IEA-SHC Working Task Group XIII “Low Energy Buildings”; IRB Verlag: Stuttgart, Germany, 1993. [Google Scholar]
- Krieger, J.; Jacobs, D.E.; Ashley, P.E.; Baeder, A.; Chew, C.L.; Dearborn, H.; Hynes, H.P.; Miller, J.D.; Morley, R.; Rabito, F. Housing interventions and control of asthma-related indoor biologic agents: A review of the evidence. J. Public Health Manag. Pract. 2010, 16, s11–s20. [Google Scholar] [CrossRef]
- Vereecken, E.; Roels, S. Review of mold prediction models and their influence on mold risk evaluation. Build. Environ. 2012, 51, 296–310. [Google Scholar] [CrossRef]
- Ayerst, G. The effect of moisture and temperature on growth and spore germination in some fungi. J. Stored Prod. Res. 1969, 5, 127–141. [Google Scholar] [CrossRef]
- Smith, S.L.; Hill, S.T. Influence of temperature and water activity on germination and growth of Aspergillus restrictus and A. versicolor. Trans. Br. Mycol. Soc. 1982, 79, 558–560. [Google Scholar] [CrossRef]
- Sedlbauer, K.; Krus, M.; Zillig, W.; Kunzel, H.M. Mold growth prediction by computational simulation. Journal of the Society of Materials Science Japan 2014, 42, 1265–1270. [Google Scholar]
- Clarke, J.A.; Johnstone, C.M.; Kelly, N.J.; McLean, R.C.; Anderson, J.A.; Rowan, N.J. A technique for the prediction of the conditions leading to mold growth in buildings. Build. Environ. 1999, 34, 515–521. [Google Scholar] [CrossRef]
- Rowan, N.; Johnstone, C.; Craig, R.; Anderson, J.; Clarke, J. Prediction of toxigenic fungal growth in buildings by using a novel modelling system. Appl. Environ. Microbiol. 1999, 65, 4814–4821. [Google Scholar] [CrossRef]
- Ojanen, T.; Peuhkuri, R.; Viitanen, H.; Lähdesmäki, K.; Vinha, J.; Salminen, K. Classification of material sensitivity: A new approach for mold growth modeling. In Proceedings of the 9th Nordic Symposium on Building Physics, Tampere, Finland, 2011; pp. 867–874. [Google Scholar]
- Abe, K.; Nagao, Y.; Nakada, T.; Sakuma, S. Assessment of indoor climate in an apartment by use of a fungal index. Appl. Environ. Microbiol. 1996, 62, 959–963. [Google Scholar] [CrossRef]
- Hukka, A.; Viitanen, H.A. A mathematical model of mold growth on wooden material. Wood Sci. Technol. 1999, 33, 475–485. [Google Scholar] [CrossRef]
- Sedlbauer, K. Prediction of mold fungus formation on the surface of and inside building components. Ph.D. Thesis, Universitat Stuttgart, Stuttgart, Germany, 2014. [Google Scholar]
- Guo-Jie, C.; You-Ming, C.; Xiang-Wei, L.; Xing-Guo, G. Mold germination risk evaluation inside the hygroscopic wall in south of China. J. Saf. Environ (in Chinese). 2017, 17, 730–734. [Google Scholar]
- Masaru, A. Moisture Stress of Wind-Driven Rain on Building Enclosures. Ph.D. Thesis, KU Leuven, Leuven, Belgium, 2009. [Google Scholar]
- Franzoni, E. Rising damp removal from historical masonries: A still open challenge. Constr. Build. Mater. 2014, 54, 123–136. [Google Scholar] [CrossRef]
- Biseniece, E.; Žogla, G.; Kamenders, A.; Purviņš, R.; Kašs, K.; Vanaga, R.; Blumberga, A. Thermal performance of internally insulated historic brick building in cold climate: A long term case study. Energy Build. 2017, 152, 577–586. [Google Scholar] [CrossRef]
- Walker, R.; Pavía, S. Thermal and moisture monitoring of an internally insulated historic brick wall. Build. Environ. 2018, 133, 178–186. [Google Scholar] [CrossRef]
- Harrestrup, M.; Svendsen, S. Full-scale test of an old heritage multi-storey building undergoing energy retrofitting with focus on internal insulation and moisture. Build. Environ. 2015, 85, 123–133. [Google Scholar] [CrossRef]
- Xinyuan, D.; Shuichi, H.; Yonghui, L.; Changchang, X.; Ma, Y. Evaluation of mold growth risks due to air leakage through air cavity of the building walls. In Proceedings of the MATEC Web of Conferences, Prague, Czech, 2019; Volume 282, p. 02060. [Google Scholar] [CrossRef]
- Zhijian, L.; Shengyuan, M.; Guoqing, C.; Chong, M.; Bao-Jie, H. Distribution characteristics, growth, reproduction and transmission modes and control strategies for microbial contamination in HVAC systems: A literature review. Energy Build. 2018, 177, 77–95. [Google Scholar]
- Zhijian, L.; Haotian, N.; Rui, R.; Guoqing, C.; Bao-Jie, H.; Qihong, D. An experiment and numerical study of resuspension of fungal spore particles from HVAC ducts. Sci. Total Environ. 2020, 708, 134742. [Google Scholar]
- Ebbehøj, N.E.; Meyer, H.W.; Würtz, H.; Suadicani, P.; Valbjørn, O.; Sigsgaard, T.; Gyntelberg, F. Molds in floor dust, building-related symptoms, and lung function among male and female schoolteachers. Indoor Air 2005, 15, 7–16. [Google Scholar] [CrossRef]
- Karagiozis, H. Impact of air leakage on the thermal and moisture performance of the building envelope; Office of Scientific & Technical Information Technical Reports; Oak Ridge National Laboratory: Tennessee, TN, USA, 2001. [Google Scholar]
- Synnefa, A.; Vasilakopoulou, K.; Masi, R.F.D.; Kyriakodis, G.E.; Londorfos, V.; Mastrapostoli, E.; Theoni Karlessia, T.; Santamouris, M. Transformation through renovation: An energy efficient retrofit of an apartment building in Athens. Procedia Eng. 2017, 180, 1003–1014. [Google Scholar] [CrossRef]
- Ri, N.; Shengmao, L.; Zhigang, S.; Linxia, G. Evaluating Energy Loss through Recessed Lighting Fixtures (RLF) in Residential Buildings through a Case Study. In Proceedings of the Computing in Civil and Building Engineering, 2014 International Conference on Computing in Civil and Building Engineering, Orlando, FL, USA, 2014. [Google Scholar]
- Gaëlle, G.; Geoffroy, H.; Ondarts, M.; Léna, M.; Woloszyn, M. Modelling the impact of multizone airleakage on ventilation performance and indoor air quality in low-energy homes. Build. Simul. 2019, 2, 1–19. [Google Scholar]
- Coulter, J.; Davis, B.; Dastur, C.; Malkin-Weber, M.; Dixon, T. Liabilities of Vented Crawl Spaces and Their Impacts on Indoor Air Quality in Southeastern U.S. Homes. In Proceedings of the Clima 2007 Well Being Indoors (9th REHVA World Congress): the Influence of Blinds on Temperatures and Air Flows within Ventilated, Helsinki, Finland, 2007. [Google Scholar]
- Prahl, D.; Shaffer, M. Moisture Risk in Unvented Attics Due to Air Leakage Paths; U.S. Department of Energy: Washington, DC, USA, 2014.
- Matsumoto, M. Simultaneous Heat and Moisture Transfer and Moisture Accumulation in Buildings. Ph.D. Thesis, Kyoto University, Kyoto, Japan, 1978. [Google Scholar]
- Yonghui, L.; Daisuke, O.; Shuichi, H.; Takeshi, I. Effects of emergency preservation measures following excavation of mural paintings in Takamatsuzuka Tumulus. J. Build. Phys. 2012, 36, 117–139. [Google Scholar]
- Xie, H. Analysis of performance degradation of the Chinese traditional blue bricks based on the theory of heat and moisture transfer. Master Thesis, Southeast University, Nanjing, China, 2015. [Google Scholar]
- Shuichi, H.; Tetsuro, I.; Nitta, K. Building Environment Engineering Ⅱ: Heat, Moisture and Ventilation; Asakura store: Tokyo, Japan, 2002; Volume 37. [Google Scholar]
- Abe, K. Assessment of home environments with a fungal index using hydrophilic and xerophilic fungi as biologic sensors. Indoor Air 2012, 22, 173–185. [Google Scholar] [CrossRef]


| NO. | Position | Purposes |
|---|---|---|
| #D | Monitored room—Door | Validation |
| #C | Monitored room—Corner, near the air cavity | Comparison |
| #W | Monitored room—Windowsill | Comparison |
| #O | Outdoors | Boundary conditions |
| #1C | Corridor | Boundary conditions |
| #B1 | Basement | Boundary conditions |
| #2F | Next room on the second floor | Boundary conditions |
| #1L | Next room on the left (on the first floor) | Comparison |
| #1R | Next room on the right (on the first floor) | Comparison |
| NO. | Position |
|---|---|
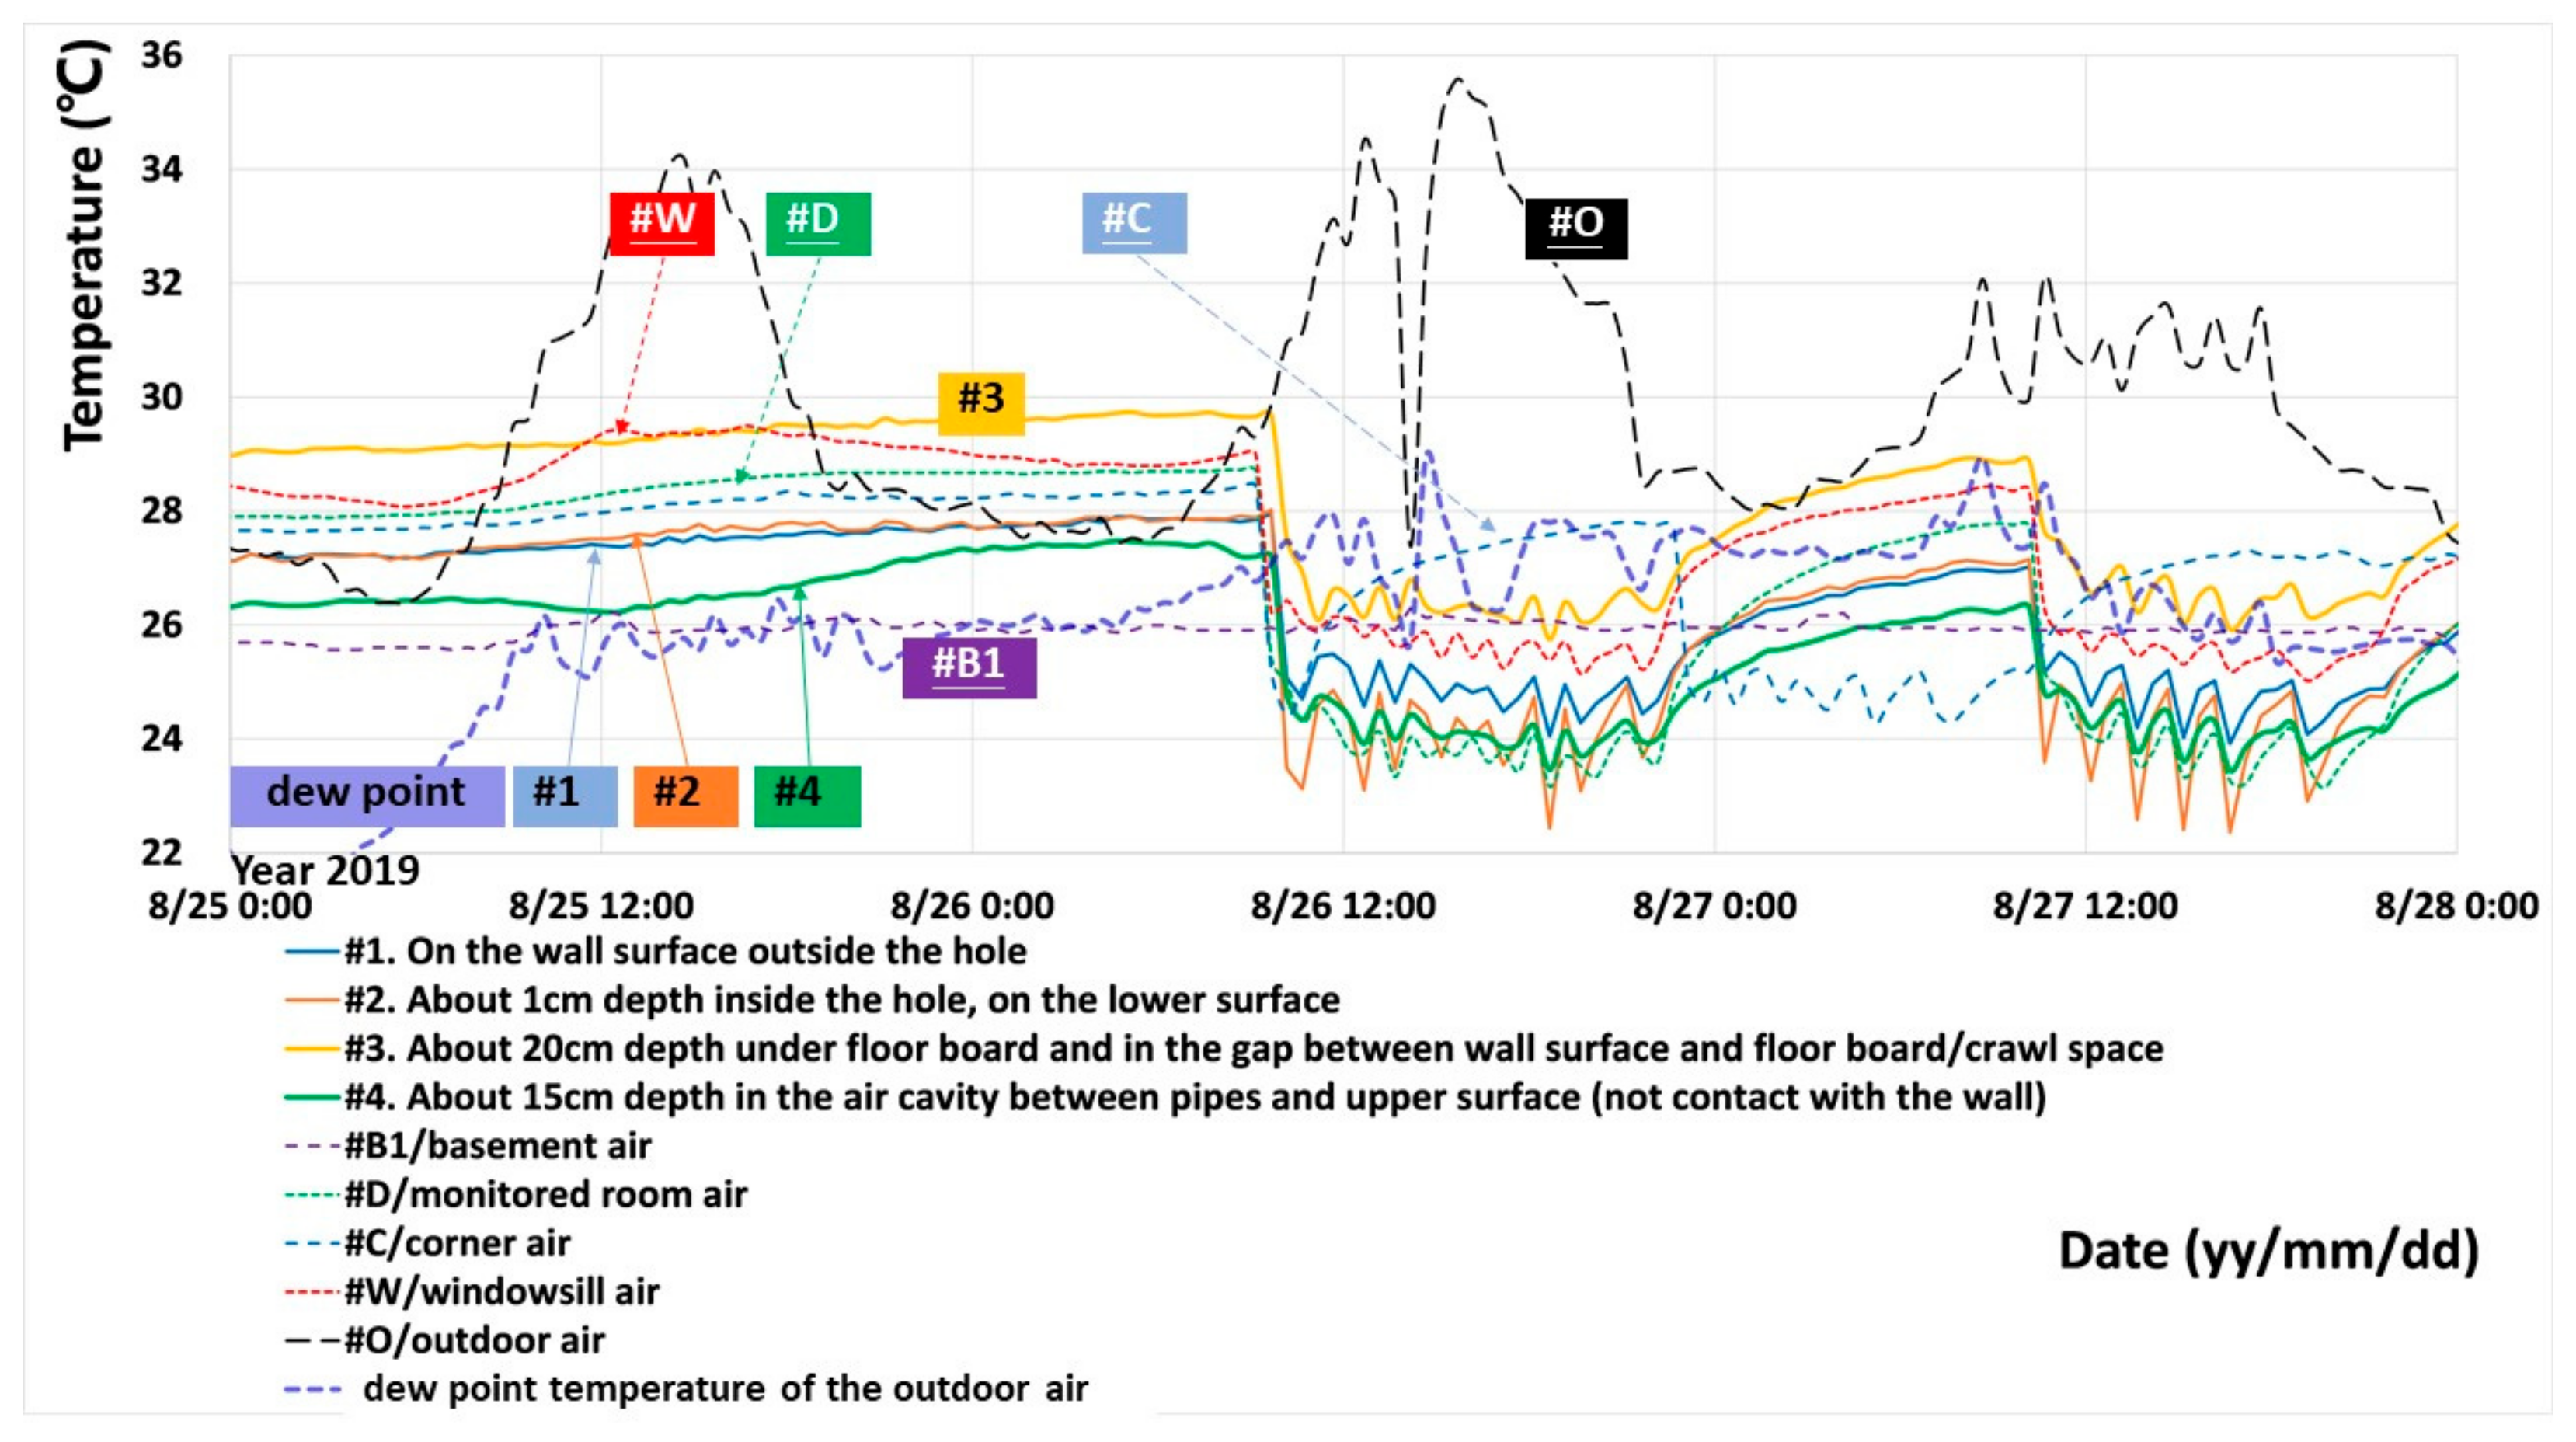
| #1 | On the wall surface near the hole |
| #2 | About 1cm deep inside the hole, on the lower surface |
| #3 | About 20 cm deep under floorboard and in the gap between wall surface and floor board/crawl space |
| #4 | About 15 cm deep in the air cavity between pipes and upper surface (not contact with the wall) |
| #10 | On the surface of drainage pipe (outdoor) |
| #11 | On the surface of floor board |
| Item | Value (unit) |
|---|---|
| Indoor combined (convection + radiative) heat transfer coefficient () | 10 |
| Outdoor combined (convection + radiative) heat transfer coefficient () | 18 |
| Moisture transfer coefficient () | |
| Heat capacity of the air () | 1255.8 |
| Moisture capacity of brick () |
© 2020 by the authors. Licensee MDPI, Basel, Switzerland. This article is an open access article distributed under the terms and conditions of the Creative Commons Attribution (CC BY) license (http://creativecommons.org/licenses/by/4.0/).
Share and Cite
Li, Y.; Dang, X.; Xia, C.; Ma, Y.; Ogura, D.; Hokoi, S. The Effect of Air leakage through the Air Cavities of Building Walls on Mold Growth Risks. Energies 2020, 13, 1177. https://doi.org/10.3390/en13051177
Li Y, Dang X, Xia C, Ma Y, Ogura D, Hokoi S. The Effect of Air leakage through the Air Cavities of Building Walls on Mold Growth Risks. Energies. 2020; 13(5):1177. https://doi.org/10.3390/en13051177
Chicago/Turabian StyleLi, Yonghui, Xinyuan Dang, Changchang Xia, Yan Ma, Daisuke Ogura, and Shuichi Hokoi. 2020. "The Effect of Air leakage through the Air Cavities of Building Walls on Mold Growth Risks" Energies 13, no. 5: 1177. https://doi.org/10.3390/en13051177
APA StyleLi, Y., Dang, X., Xia, C., Ma, Y., Ogura, D., & Hokoi, S. (2020). The Effect of Air leakage through the Air Cavities of Building Walls on Mold Growth Risks. Energies, 13(5), 1177. https://doi.org/10.3390/en13051177