1. Introduction
The use of renewable energy has been a growing trend in the world for many years, especially since the Paris Agreement, where all parties have pledged to keep the global temperature below 2 °C [
1]. However, the rising global population and the advancement of technology have led human beings to consume more energy, and therefore, there is an urgent need to find a sustainable solution [
2]. A green scenario has been set up by the International Energy Agency (IEA). The scenario recommends mitigation, countermeasures, and actions to reduce CO
2 emission in the atmosphere to below 450 ppm through several policies regarding the use of fossil fuels, and supporting the sales of hybrid cars and electric vehicles (EVs), which have been projected to increase by approximately 40% by 2030 [
3].
The trend of EV adoption is believed to be one of the solutions for a green solution in the transportation sector. In general, EVs include plug-in hybrid electric vehicles (PHEVs), battery electric vehicles (BEVs), and fuel cell electric vehicles (FCEVs) [
4]. The penetration of these vehicles increases because of their beneficial characteristics compared to internal combustion engine vehicles (ICEVs), including low maintenance, high performance and efficiency, and zero tailpipe emission, especially when they are integrated with renewable energy resources [
5]. Furthermore, some researchers have studied the utilization of an EV battery as energy storage in the power system, especially to balance demand and supply, while maintaining the quality and stability of the grid [
6,
7]. However, the high interest in EVs leads to a high demand in electricity when EVs are charged massively at the same time (dumb charging, uncoordinated charging), causing an imbalance in the power system [
8]. Conversely, if both charging and discharging can be coordinated and scheduled, EVs can potentially support the grid, as they can be considered huge energy storage. Thus, the management of EV charging and discharging has become an important issue for developing a smart energy system utilizing mobile energy storage in the near future.
The adoption of renewable energy in power grids has had a positive impact on emissions reduction. However, it also potentially leads to a significant problem due to instability, as most renewable energies have unpredictable fluctuations [
9]. The Indonesian government has set a target of a high portion of renewable energy, of approximately 27% by 2030, including geothermal, wind, biomass, and solar energies. However, at the same time, the government has also accelerated the construction of coal-based power plants to match fast-growing economic growth [
10,
11]. Moreover, the peak of daily electricity demand still occurs at a certain time (evening to night), causing a large gap between peak and valley in the load profile [
12]. The difference between peak and off-peak becomes an oversupply problem that can threaten the electricity market between power producers and transmission system operators (TSO) [
13]. The utilization of EVs together with the adoption of renewable energy and feed-in tariffs (FIT) in power grid management are estimated to increase the popularity of the vehicle-to-grid (V2G) concept currently popular in several European countries and the US. Implementation of V2G in Indonesia is considered challenging and attractive, as Indonesia is a developing country with several limitations in the power grid [
14]. V2G affects the possible synergetic gain for both the vehicles and the grid. For the grid utilities and operator, EVs are expected to supply the back-up electricity, shift the electricity load, and respond quickly to balance the grid.
Compared to other EVs, the BEV generally has a significantly larger battery capacity. Batteries represent excellent energy storage, having high energy efficiency and a faster response time than a pumped hydropower plant [
15]. Currently, BEVs commonly adopt lithium-ion batteries, owing to their high energy efficiency (minimum energy loss) and energy density for facilitating a longer travel distance [
16]. There are several advantages of lithium-ion batteries compared to other types of batteries, including high energy density, effective dimensions, low self-discharge, and a longer lifespan [
17]. However, the number of instances of charging and discharging potentially impacts battery degradation, leading to a decrease in battery lifetime. This is one of the most challenging issues in the application of V2G [
18]. Uddin et al. [
19] studied this issue and stated that with the advancement of technology and intelligent control systems of V2G, the battery degradation could be reduced, leading to a relatively long lifetime of lithium-ion batteries. Their study is a response to another study conducted by Dubarry et al. [
20] that studied the durability and degradation of the battery caused by bi-directional charging and discharging, including ancillary services provision.
In several countries, energy storage has already existed. For example, a pumped storage power plant pumps water from any low to high reservoirs when the demand is low, and then utilizes this water to generate electricity during high demand, as well as to balance the power grid when imbalances occur in the grid from fluctuating renewable energy, etc. [
21]. However, there are issues related to pumped storage, as it is limited by geographical conditions, and only a few of the pumped storages can respond quickly to the grid imbalances [
22]. A power system frequently requires a very fast response that is better than that of pumped hydroelectricity, which can be covered by other solutions, such as a flywheel [
23]. Compressed-air energy storage (CAES) is also another idea to level the gaps in peak and off-peak demands [
24]. However, CAES also faces some problems related to low energy efficiency and response time. Several developing countries have an insufficient capacity of installed power storage in addition to low capabilities for controlling power plants, leading to difficulties to balance the power grid responsively. The massive adoption of BEVs in the future opens an opportunity to utilize them to provide ancillary services (e.g., V2G). The aggregating and scheduling strategies for widely-distributed EVs are considered as important keys to the success of V2G [
25].
Several possible ancillary services include load leveling, frequency regulation, energy storage, voltage regulation, and congestion mitigation at transmission and distribution lines. Nunes and Brito [
26] found that EVs have great potential to replace the gas-based power plants to balance the grid. Many studies have evaluated ancillary services utilizing EVs, especially in developed countries, including France [
27], Denmark [
28], Germany [
29], and the USA [
30]. However, to the best of the authors’ knowledge, it is very hard to find a study focusing on efforts to evaluate the opportunity of V2G application in developing countries, including Indonesia. Dhar et al. [
31] assessed the long-term benefits of EV adoption in the case of India. However, their study mainly focused on the environmental impacts, rather than the application of V2G. In addition, Li et al. [
32] investigated the energy, environmental, and economic implications of EVs in China. They found that the controlled charging and discharging of EVs are advantageous in terms of environmental impacts. However, these impacts will be insignificant if not followed by any decarbonization in the energy sector. Although their study is very interesting in terms of the environmental and economic points of view, they did not cover the technological applications of ancillary services using EVs.
This study focuses on the techno-economic analysis of V2G application in the Indonesian power grid as a representative of developing countries. The characteristics of the power grid in Indonesia are significantly different from those of many developed countries. Both load leveling and frequency regulation are evaluated in terms of applicability, environmental impacts (CO
2 reduction), and economy. The actual data (load profile and frequency) used and analyzed is based on an Indonesian state-owned electric company (PLN). The conditions of the Indonesian electricity system, including the electricity growth, energy mix, frequency fluctuation, and V2G system, are also initially explained in
Section 2. The methodology used in this study to analyze the techno-economic performance of V2G in the Indonesian power grid is described in
Section 3. Next,
Section 4 explains several conditions and parameters adopted in this study, including technical parameters, driving patterns, and electricity market. The results of this study are explained and discussed in
Section 5. Lastly,
Section 6 summarizes the findings from this study. In general, the main contributions of this work can be summarized as follows:
Analysis of the Indonesian power grid, especially the condition of frequency fluctuation, which clarifies the demand for balancing service with fast response.
Evaluation of V2G opportunity in supporting or balancing the Indonesian power grid, especially the opportunity of load-leveling (including peak shaving) utilizing EVs.
Environmental and economic assessments of load-leveling adopting EVs in the Indonesian power grid. This also includes how far the fuel consumption for balancing service can be reduced due to the employment of V2G for load-leveling.
2. Condition of Power System in Indonesia
Electricity demand is strongly influenced by economic activities, population, and lifestyle (including seasonal conditions). Therefore, it can be considered as a sign of national economic growth [
3]. In Indonesia, PLN is the main decision-maker for the entire development of electricity infrastructure, as it has a monopoly on electricity transmission and distribution, as well as most of the power generation. PLN has a plan to achieve security of supply by increasing the electrification ratio and setting a reserve margin of 25–30% in the Java-Madura-Bali (JAMALI) area, and of 35–40% in the rest of the country. In addition, a commitment to higher safety and lower production costs are also projected [
33].
To meet the future demand and encourage investment from the private sector, PLN is offering future revenue through power purchase agreements (PPAs), in which PLN guarantees a long-term power demand to independent power providers (IPPs) [
33]. The forecast of demand depends on the economic situation and other aspects that affect consumption behavior [
16]. Indonesia has a significantly growing investment in power generation, with a target that by 2027 approximately 63% of the generation capacity is supplied by IPPs, with an expectation of 6–7% of economic growth [
33]. Unfortunately, after several years of this program, the economic situation did not meet expectations and PLN reduced the target. Still, it is obligated to pay for on-going contracts under the PPA’s take-or-pay agreement. In this agreement, the capacity payment is used as a basis on which the IPP will receive payment as long as the power capacity is available, even if the demand is low or dispatched [
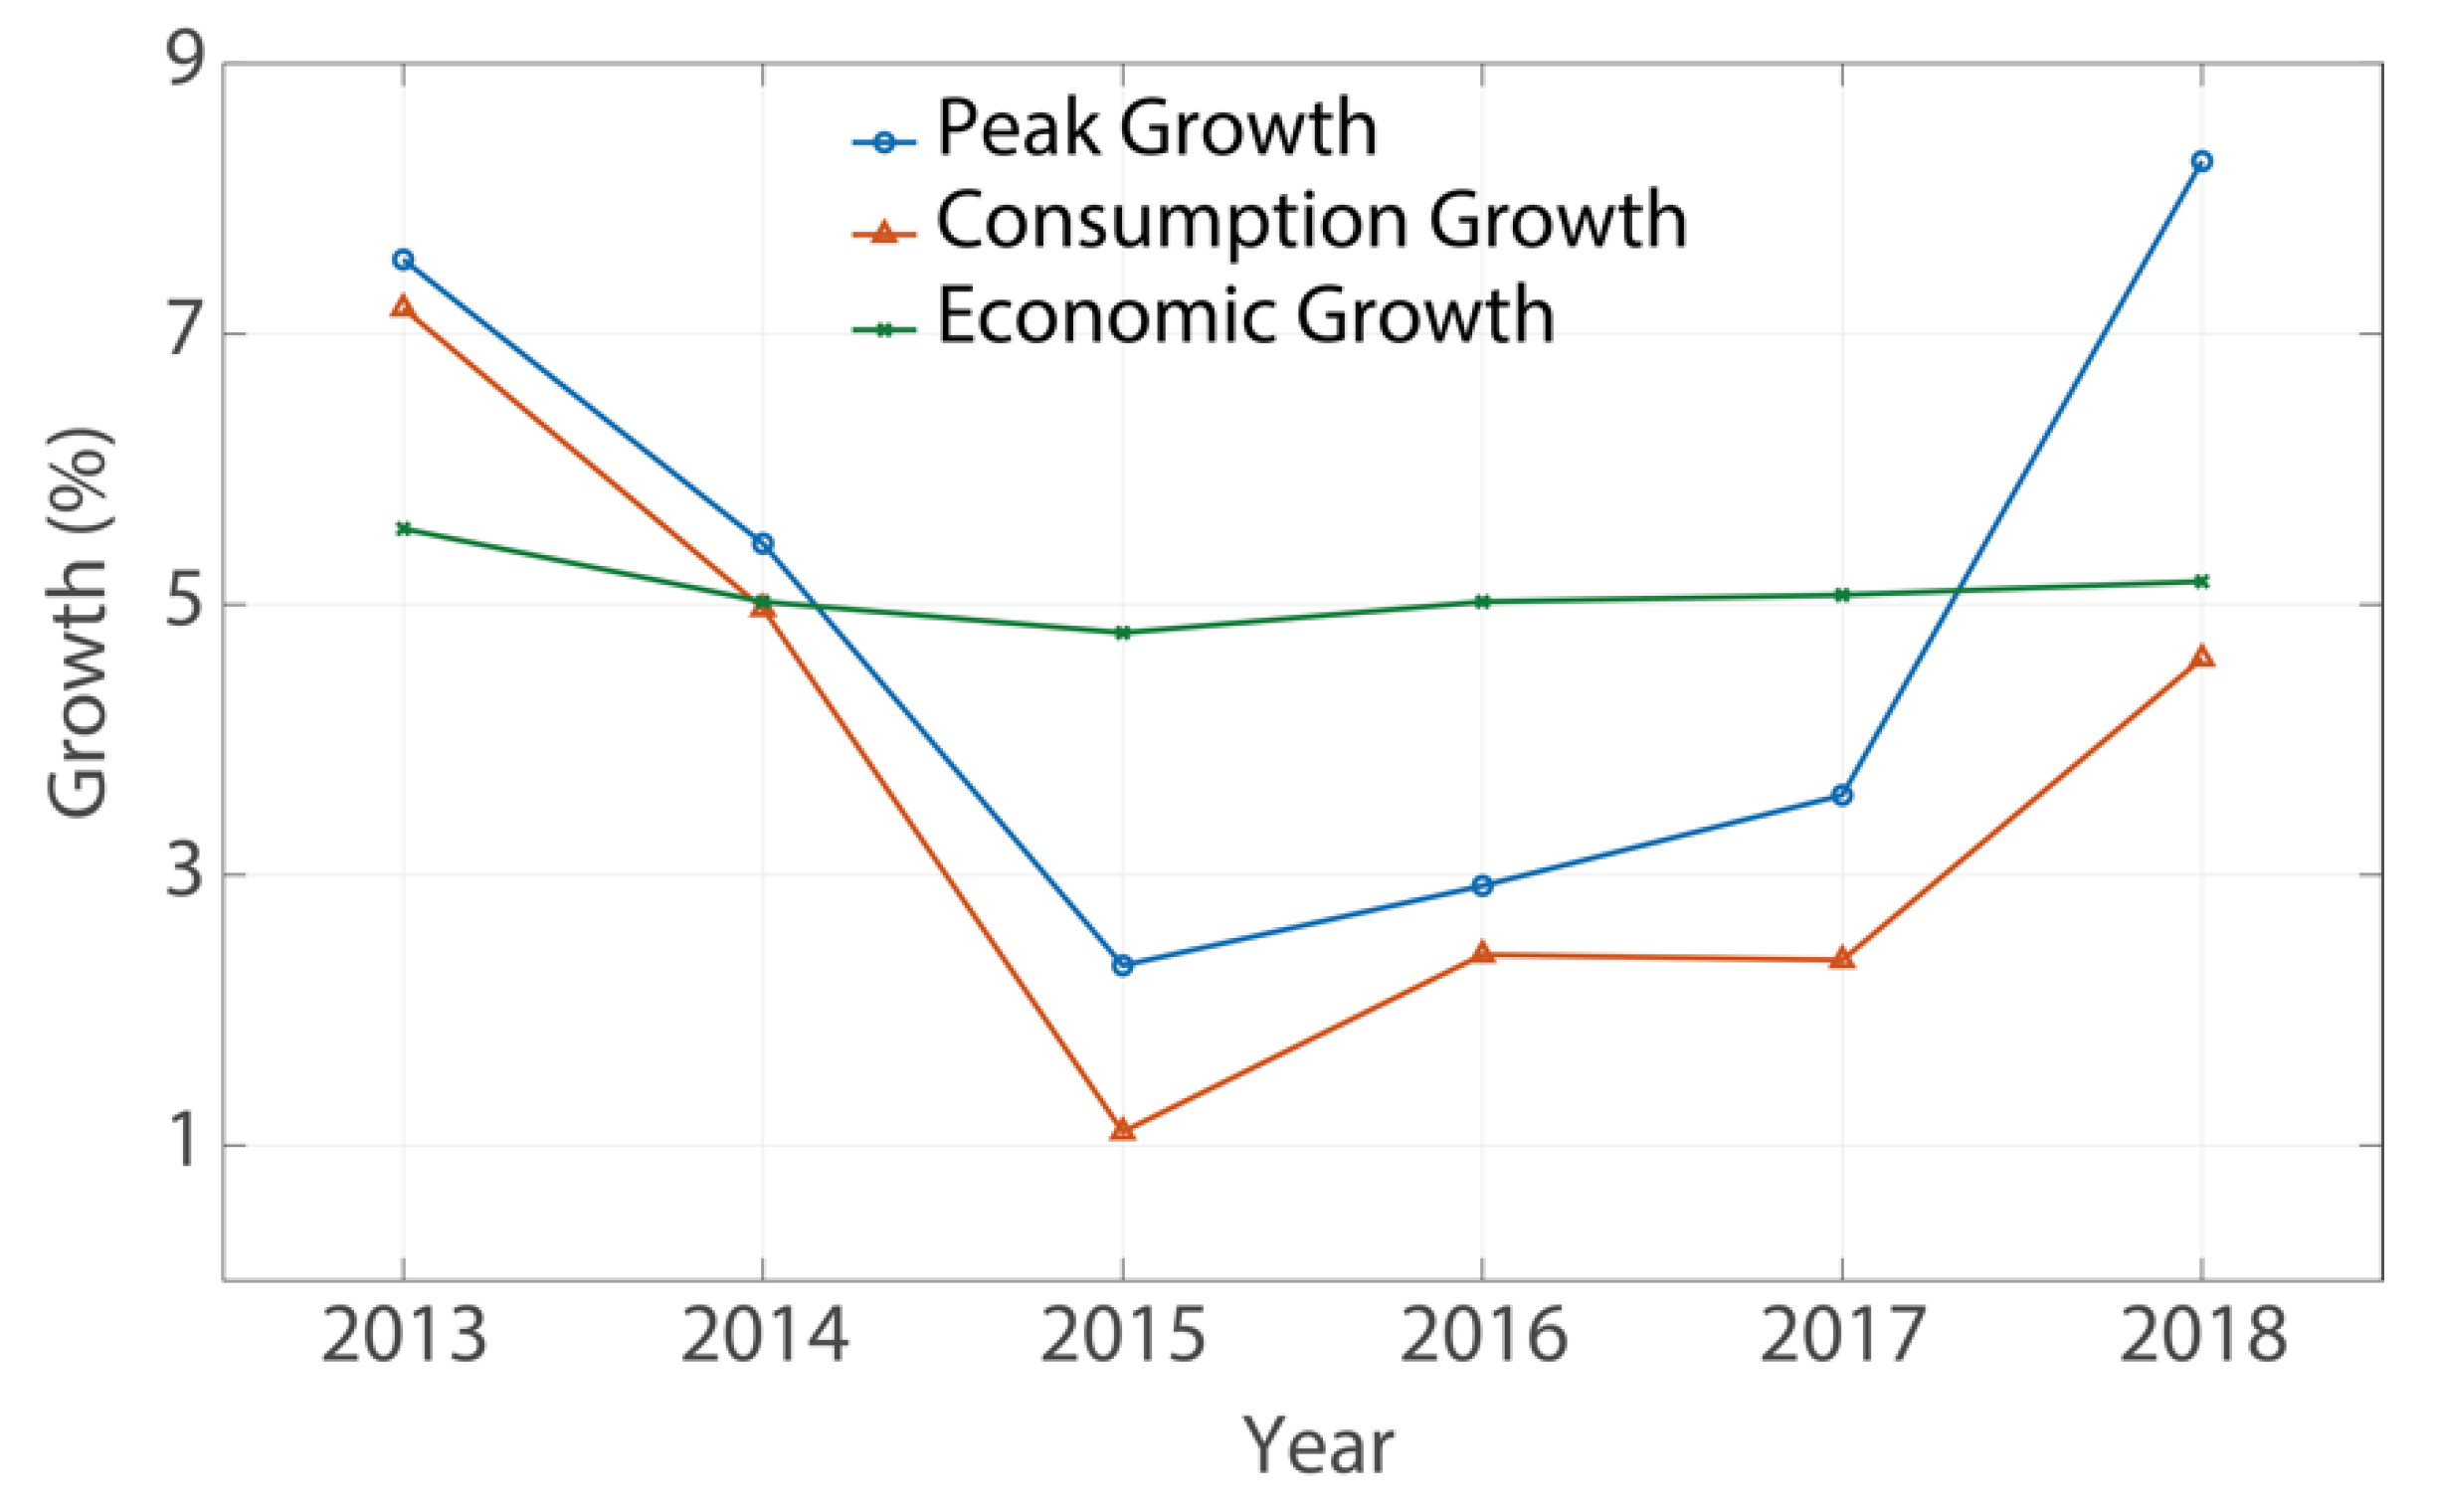
13]. In contrast, the peak consumption is increasing gradually year by year, leading to significant load gaps between peak and off-peak times, as shown in
Figure 1 [
34,
35,
36]. This analysis shows the potential risk in overpaying for unutilized power generation, and an increase in the peak follower investment cost to meet the demand to achieve the targeted energy security and reserve margin [
13].
As Indonesia is a very large country having approximately 17,000 islands, the power grid is divided into several local power grids. Among them, the JAMALI grid is the biggest power grid with approximately 70% of the total national capacity, owing to its larger population and higher economic activities as compared with other areas. In this study, the JAMALI power grid is analyzed in the context of the possibility and feasibility to utilize EVs for load leveling and secondary regulation control. Currently, the power demand in this power grid is mainly covered by geothermal and coal-fired steam power plants [
36]. However, the load fluctuation must be covered by a high ramp-rate power generator to return the frequency to its normal value (50.00 Hz) [
34]. In addition, the peak load basically occurs twice in a day, caused by high demand from several sectors, including industrial (noon peak) and residential (night peak) activities. As the primary regulation, governor-free regulation is adopted to stabilize the frequency, with a deadband range (Δ
f) of +36 mHz. However, there is a high possibility of disturbance of the power system (higher and lower than +36 mHz) owing to technical or non-technical problems [
10].
Figure 2 shows the total number of frequency fluctuations occurring in corresponding times during weekdays for two months (December 2017 and January 2018). It is higher than the nominal frequency deadband (+36 mHz), and the corresponding fluctuations occurred for longer than 1 min in the JAMALI power grid. In general, the number of frequency fluctuations is higher in the morning and evening, owing to high demand and changes in the residential sector. This fluctuation leads to several technical and economic problems, including low energy efficiency, high operating cost, and high environmental impacts caused by using fossil fuels such as gas and coal. As of today, Indonesia has no large-scale power storage, such as pumped hydroelectricity, which is able to balance the grid responsively. Therefore, grid balancing depends heavily on the marginal capacity and peaking power generators.
The concept developed in this study is to utilize the batteries of EVs to both deliver and absorb electricity to and from the grid, respectively. EVs can deliver their electricity during the peak time (high demand), or when the grid frequency is lower than the nominal value. In addition, they also can absorb electricity from the grid when there is any surplus power in the grid (such as during the night), or when the frequency is lower than its nominal value. Therefore, distributed EVs can be considered as a bundled energy storage when they are appropriately managed [
12]. Hence, in case that the demand is very low, the grid operator can potentially dispatch the stand-by generators to stop spinning. In addition, one can allow the wind and solar power systems to deliver their optimum power generation capacity to the grid. Energy storage can manage the active power generated from intermittent renewable energy sources, such as wind and solar, to prevent any grid disturbance [
37]. By plugging the EVs into bidirectional charging points, it is possible to introduce more unpredictable renewable energy into the electricity supply mix, and therefore, reduce the carbon emission. The EV drivers can set both the maximum and minimum values of the battery’s state-of-charge (SOC) during these ancillary services. The ancillary service market can be conducted through any automatic auction technology, and an aggregator of EVs can calculate and optimize the possible revenue for the EVs taking part in the ancillary services.
In the current condition of the Indonesian grid system, the adoption of renewable energy is still very limited. In the future, especially up to 2040, although the share of renewable energy is predicted to increase, the main contribution to power generation is still dominated by coal and natural gas [
38]. This is due to the fast-growing economy, which is demanding a significant capacity of power generation to cover this fast-growing demand. As the current condition, although the intermittent power generation (solar and wind) still has a very limited contribution to the Indonesian power system, the Indonesian grid has suffered a power imbalance leading to very low power quality. These phenomena are caused by several problems, including insufficient power supply, poor supply-side protection system, significant distribution system disturbance by natural disaster, and slow response-ability to adjust the demand.
Figure 2 shows that the frequency fluctuation is caused due to some factors, including the changes in the usage behavior, uncontrolled activity, and use of electricity during the peak time. The purple bar indicates the largest change of frequency (∆
f) compared to the normal condition (50 Hz). The increase of demand causes the frequency (
f) to drop less than 50 Hz; therefore, the system needs to increase its supply to normalize the frequency. If the demand drops suddenly, the system can reduce its supply from the power plants through several mechanisms, including a governor control (primary regulation).
V2G is considered as an innovative idea for solving the current problems in the Indonesian power grid.
Figure 3 shows a conceptual diagram of V2G, for providing ancillary services to the grid. In addition, several drawbacks of EVs can potentially be minimized and even evaded through the advent of improved technologies in the future [
39].
5. Results and Discussion
The utilization of EVs has significant advantages, owing to its significantly faster response and higher accuracy in the stabilization of the power system as compared to conventional power generation, such as gas turbines and steam turbines (coal-fired) [
47]. However, among the above three frequency regulations, secondary reserves occur more frequently than others, although their capacity is relatively small. The results are discussed and analyzed from two different points of view: technical and economic, as mentioned in
Section 3.
5.1. Technical Analysis
5.1.1. V2G for Load Leveling
As energy storage, EVs can cover the high ramp rate in the peak period via V2G and can be dispatched to supply electricity to the grid when the demand is high, both during noon and evening. In addition, they can also absorb the electricity when the demand is low, such as from midnight to morning.
Table 3 shows the possible contribution to the peak reduction via V2G in all evaluated cases. As can be observed, there is a clear potential reduction of energy demand during the peak period (MWh) in Indonesia via V2G, especially in the JAMALI power system. Case 5, where the EVs are available for both charging (electricity absorption) and discharging (electricity delivery) during weekdays, it can provide the largest peak load reduction as compared to the other cases (2.8% for coal and 8.8% for gas).
5.1.2. Emission Reduction
V2G implementation in the power system also has the potential to reduce the consumption of fossil fuels in specific periods [
48]. Therefore, it significantly impacts the decrease in greenhouse gas (GHG) emissions. The reduction of GHG can be calculated by using an emission factor, generally explained in an energy outlook (coal: 92.8 t-CO
2/TJ, and gas: 54.3 t-CO
2/TJ).
Figure 8 shows a comparison of the potential amount of CO
2 reduction for each case, with coal and gas replacement by V2G during the peak load hours. Case 5 shows the highest potential for both coal and gas because of its significantly longer availability, especially during weekdays. Furthermore, Case 3 follows in second for both coal and gas replacement. The comparison of fossil fuel consumption between peak and off-peak hours was not proportional, depending on the demand response issued by the TSO. In contrast, the grid supply during the off-peak period (night time) is relatively stable and proportional and is able to meet a predictable demand, as it is mostly not fluctuating.
5.2. Economic Analysis
The calculation of cost and potential revenue is conducted using the tariff assumptions explained in
Section 3. These tariffs also include some incentives from the TSO or the aggregator to increase participation in V2G and to avoid additional demand from EVs charging during the peak period. As a result of the calculations, the charging cost and potential revenue of V2G are different for each case, depending on the driving pattern and usage tariffs from
Section 4.3. Each tariff has been compared, including cost and revenue for every respected case. The EVs that participated in V2G have similar parameters and numbers. This comparation is considered as the first evaluation effort for V2G study in Indonesia.
Figure 9 shows the comparison of both cost and revenue during the implementation of V2G. The charging cost decreases owing to a low tariff when charging is conducted during the night, because of the lower electricity price. This study also concluded that V2G could reduce the charging cost when EVs are parked and connected to charging stations.
The economic analysis shows that Cases 3 and 5 have a high potential benefit from the cost reduction, as the EVs are mostly parked during the weekdays. From the comparison of the different tariffs, the natural tariff is considered to have significant potential to reduce the charging cost in all cases, as well as to maximize revenue from V2G participation. All of these cases are optional for the EV owners, depending on their conditions for utilizing EVs.
Table 4 shows the potential reduction of charging costs for all cases with different tariffs. However, the percentage of cost reduction is similar among all the tariffs, the natural tariff results in the highest reduction.
The results from the economic analysis clearly show that the number of participants and the electricity market has significant impacts on the economic performance of EVs. They also potentially reduce the total cost of ownership (TCO), which is strongly related to the concerns of EV owners in the future.
Table 5 shows the potential revenue improvement for the power company (operator) for different tariff options. Case 5, with a natural tariff and gas replacement, leads to the largest annual improvement of approximately 3.65% for the electric company as compared to other cases. It is caused by the longest V2G participation time as compared to other cases, as the cost of gas fuel, which was reduced, is more expensive than the cost of V2G. Massive EV adoption and participation in the V2G program can be considered as a potential way to achieve a high quality of electricity during weekdays with a stable regulatory framework. Coal replacement is not profitable for an electric company, because the generation cost is still cheaper for producing electricity.
However, there are several challenges and barriers that must be clarified. The number of EVs in the future is predicted to increase gradually, and the potential of EVs for ancillary services is also increasing accordingly. The assumed general barriers in V2G are: (1) an EV aggregator should be available on a large scale, and should have advanced technology to cover the requested functions during V2G; (2) the lifetime of an EV battery potentially degrades because of continuous EV operation; (3) the ancillary services market using EVs has not yet been well-established; (4) the knowledge and motivation to participate in the V2G program by early adopters remain low, (5) the policies, incentives, and tax systems must be improved and applied to facilitate and increase participation, (6) further developments in technologies and supporting infrastructures, including chargers and batteries, are urgently required; and (7) several environmental impacts, such as battery recycling caused by high battery degradation, must be clarified and developed. The economic value of V2G can be improved if there are optimization and incentives on charging and discharging following V2G participation in the ancillary services. As a future study, an optimization with a genetic algorithm method is considered to be capable of providing a clear analysis. The utilization of a non-traditional optimization technique (genetic algorithms) which suits a large-scale problem to optimally decide and perform charging and discharging to achieve high power quality. It is expected that the proposed framework can help the EV owners and power company to make appropriate decisions that ensure a sustainable operation, achieve a minimum battery degradation, and optimize the revenue of the standby EVs, with the least cost and optimum operational condition.
In the real application, the value and impacts of V2G depend strongly on the charging and driving behaviors of EV drivers and owners. The policy and regulation, as well as incentives, set by the government in order to drive EV drivers and owners to participate in V2G services or fulfill their commitment in providing the services, are strongly expected. In addition, an objective and accurate measurement for both charging and discharging are urgently required, increasing the trust of all involved players, including owners, drivers, operators, and utilities. A clear and single tax system in V2G is also demanded, therefore, the economic performance of V2G may be improved.
6. Conclusions
A revolution in the transportation sector will take place in the next decade. This change impacts the overall energy cycle directly and indirectly, including the fossil fuels, which are currently mainly used for internal combustion engine vehicles. The use of EVs is not only limited to the primary use in transportation but also includes the electricity sector. This study focuses on the potential use of EVs in the Indonesian power grid, especially for load leveling and frequency regulation. Initially, both charging and discharging behaviors of EVs owners were analyzed.
The gap between the highest and lowest loads is very high, leading to inefficient generator operation, and large frequency fluctuation. Massive EV adoption and participation in V2G programs can be considered as a potential method for achieving a high quality of electricity in the country. The results show that the peak supply from fossil fuels is effectively reduced by up to 2.8% (for coal) and 8.8% (for gas) in Case 5, i.e., EVs that stay home the entire day except on the weekends, as representative of commuter behavior in a metropolitan city. The driving pattern of Case 4 is one option, as commuting workers with EVs reduce the fossil generation supply by approximately 2.4% (for coal) and 7.5% (for gas).
From the economic assessment, there are conclusions from two perspectives, showing that both the power company and EV owner can receive a benefit from V2G implementation. For the EV owners, the charging cost of EVs can be reduced by up to 60.15%, in Case 4 with a natural tariff. Meanwhile, the power company gets the benefit of increasing the power consumption, owing to EVs charging in the night (off-peak period), and of reducing the cost of fossil fuels, which only peaks in certain periods. The calculation shows that when the V2G is used to replace the supply from fossil fuel partly, the power company (PLN) can improve its revenue by at least 3.65% from the reduction in gas consumption in Case 5 with a natural tariff.
The recurrent and large fluctuation in frequency urgently demands a very responsive regulator (service provider), such as EVs or a battery. Several challenges and barriers related to the use of EVs for grid ancillary services need to be analyzed and solved urgently, as the number of EVs is increasing sharply.


