Abstract
Power system parameter matching is one of the key technologies in the development of hybrid electric vehicles. The power source is the key component of the power system which composed of engine, motor, and battery. Reasonable power source parameters are conducive to improve the power, fuel economy, and emission performance of vehicles. In this paper, regarding the problem that the plug-in hybrid electric vehicle (PHEV) parameter matching needs to weigh different design objectives, a multi-objective optimization and matching method based on a genetic algorithm is proposed. The vehicle dynamic model is established based on MATLAB/Simulink (Mathworks in Natick, Massachusetts, USA), and the feasibility of the model is verified by simulation. The main performance parameters of the power source are matched by theoretical analysis, and the PHEV integrated optimization simulation platform is established based on Isight(Dassault Systemes in Paris, France) and MALTAB/Simulink. Power source components are optimized considering fuel economy and lightweight objectives under the performance constraints. Firstly, the optimal matching results under different weights are obtained by transforming different objectives into single objective, and the multi-island genetic algorithm is used to obtain the optimal matching results in which the equivalent fuel consumption of 100km is reduced by 1%. Then the Pareto solution is obtained using the NSGA-II algorithm. The optimal matching results can be found after determining the weights of different design objectives, which proves the effectiveness and superiority of the multi-objective optimization matching method. The optimization results show that compared with the original vehicle, the fuel economy effect is increased by 2.26% and the lightweight effect is increased by 8.26%.
1. Introduction
Nowadays, the number and annual production of internal combustion engine vehicles are increasing rapidly, resulting in energy crisis, urban air pollution, and other issues that are becoming increasingly serious [1]. Pure electric vehicles are subject to current power battery technology and current infrastructure imperfections, and driving ranges and charging times bring great troubles to consumers [2]. Plug-in hybrid electric vehicle (PHEV) takes into account the advantages of traditional hybrid vehicles and pure electric vehicles. Compared with traditional hybrid vehicles, PHEV power battery packs have a larger capacity, a longer driving range, and can be charged by an external power grid, as well as better fuel economy and emission performance; it is a research hotspot in the field of new energy vehicles [3,4,5]. As the PHEV is equipped with two power source components: A traditional internal combustion engine and a driving motor, reasonable power source parameters matching is very necessary [6].
The parameter matching of hybrid electric vehicle’s power system has the characteristics of non-linearity, multi-parameter and multi-degree of freedom. The whole matching process is complicated and cumbersome. It has been one of the hot topics in the research of hybrid electric vehicles [7].
Zeng et al. [8] presents the design method of a hybrid degree for parallel hybrid electric vehicles. The design of total power of power source satisfies the dynamic constraints. Then the design of hybrid degree is simplified by total power matching. Finally, the design variables are exhausted within the reasonable range of hybrid degree from 12.5% to 37.5%. The relationship between fuel economy improvement and hybrid degree is obtained by least square curve fitting. The optimum mixing design scheme is selected based on the lowest fuel consumption per kilometer. In Reference [9], combined with the development process of fuel cell bus power system, the simulation is carried out by adding the driving cycles of NYCC (New York City Cycle), ECE (Economic Commission for Europe), and New York BUS in the ADVISOR library. Under the condition of constant total power, the exhaustive mixing degree variable is used to select the optimal power system matching scheme with the objective of minimum fuel consumption. Exhaustion method is the simplest and most feasible method to optimize the matching problem, but it wastes time and computer costs. When the number of optimization variables increases, the number of optimization times increases exponentially, and the degree of optimization results depends on the minimum increment of variables. Wang et al. [10] used the basic orthogonal test method and comprehensive orthogonal test method to optimize the power system with orthogonal factors such as mixing degree, battery voltage, battery capacity, and main deceleration ratio. The results showed that the fuel economy of the optimized power system improved by 4.1% in urban conditions of China and 8.7% in urban conditions of Wuhan. Orthogonal test method can effectively reduce the number of optimization times and improve the optimization efficiency under the same number of optimization variables, but the overall optimization time is still long, and the optimization accuracy is not high.
In Reference [11], a constrained non-linear optimization model for the fuel cell hybrid power system is established. The design variables are the rated power of fuel cell, the number of power accumulator units, the initial and objective values of SOC (state of charge), and the transmission ratio of the gearbox and main reducer. Sequential quadratic programming (SQP) is applied to optimize the hybrid power system with the lowest hydrogen consumption being the objective, and the influence of design variables on the fuel economy of the vehicle is analyzed. Zhao et al. [12] also uses SQP to match the power system parameters of four-wheel drive fuel cell hybrid electric vehicle, but the objective function is the size of power transmission system components. By optimization of the design, the battery power is increased, the driving time and starting frequency of fuel cell are reduced, and the size of each component is optimized. Hu et al. [13] discusses the optimal matching problem of hybrid energy storage system (HESS) for fuel cell hybrid buses, a convex programming method is proposed to optimize HESS parameters and energy management strategy parameters synchronously. A dynamic battery life state (SOH) model is integrated to quantitatively evaluate the impact of battery replacement strategy on HESS parameters and fuel economy. The impact is based on the total cost of life cycle, and the battery SOH is the constraint to obtain the optimal HESS system and energy management strategy. Gao et al. [14] compares the matching effect of the DIRECT algorithm, simulated annealing algorithm, genetic algorithm and particle swarm optimization algorithm on the hybrid power system. The results show that DIRECT algorithm and simulated annealing algorithm are the most effective, but also the most time-consuming, and needs to spend 100 hours on PAST. It is suggested to combine the characteristics of the non-gradient algorithm and gradient algorithm to establish a hybrid algorithm for optimal matching, which can achieve global optimization and fast convergence. In Reference [15], the fuel consumption, CO, HC and NOx indicators are weighted. And the four indicators are standardized since the units and magnitudes are different. On the basis of Reference [15], Wu et al. [16] increases the cost of replacing batteries in the future of the objective function. Omar et al. [17,18] selected the fuel cell and supercapacitor cost of fuel cell electric vehicles as well as battery weight and volume factors as the objective function to establish a detailed cost model. In Reference [19], aimed at the shortcomings of genetic algorithm, which is characterized by premature convergence and low search efficiency in the later evolution stage, the simulated annealing principle with strong local search ability is introduced into genetic algorithm to obtain adaptive genetic algorithm. The power system parameters and control parameters are optimized simultaneously. Compared with a conventional genetic algorithm, the comprehensive performance of fuel consumption and emission can be improved by 4%.
As mentioned above, optimal matching method is widely used in power system parameter matching because of its high efficiency and high precision. However, most studies focus on single-objective optimization with optimum fuel economy or minimum cost, and few studies focus on multi-objective optimization with both fuel economy and lightweight. The lightweight of power system component is to reduce the power system total power so that to reduce the component size, reduce the weight of power system and balance the cost of the whole vehicle. In this paper, a PHEV integrated optimization simulation platform is established based on Isight and MALTAB/Simulink software for plug-in hybrid electric bus. The power system components are optimized by weight method and non-normalization method (Pareto mechanism) respectively considering fuel economy and lightweight, and the corresponding optimal matching results are obtained.
2. Powertrain Model of PHEV
In this paper, a single-shaft parallel plug-in hybrid electric bus is selected as the research object to study the matching and optimization of the power source of the hybrid power system. The powertrain of the system is shown in Figure 1. The single-shaft parallel hybrid power system consists of an engine, a clutch, a motor, a power battery, a gearbox, a final drive, and associated controllers. A hybrid electric bus with this configuration can achieve a variety of working modes (as shown in Figure 2), including pure electric mode, engine driving mode, hybrid driving mode, charging mode and braking energy recovery mode, which can effectively improve the fuel economy.
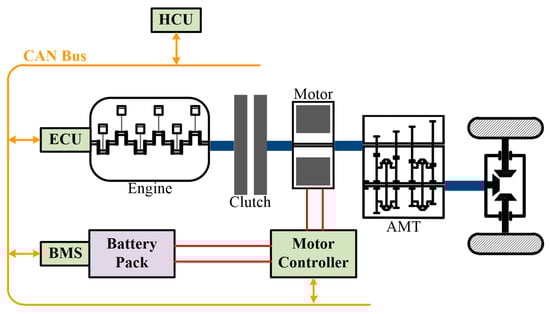
Figure 1.
Configuration of the studied hybrid powertrain.
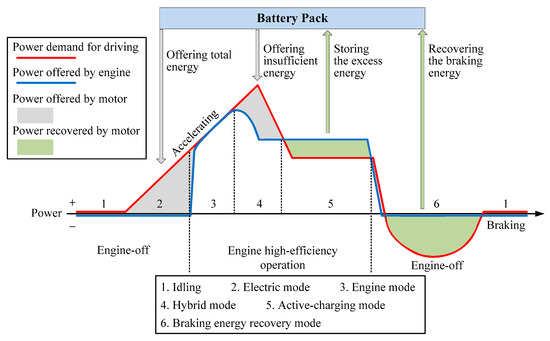
Figure 2.
Working modes of the plug-in hybrid electric vehicle (PHEV).
The vehicle type equipped with this hybrid system is a low-floor bus, and Table 1 shows the basic parameters and performance indexes of the vehicle, which is also the design goal of matching and optimization in this paper.

Table 1.
Main parameters of PHEV.
2.1. Engine Model
It is very complex and inefficient to establish a non-linear model which can characterize the internal dynamic characteristics of the engine. In this paper, the experimental modeling method is adopted, which focuses only on the input and output characteristics of the engine, ignores the fuel consumption caused by the dynamic migration of the engine working point, and uses the steady-state test data of the bench test to establish the engine’s model [20].
The engine torque is expressed as Equation (1):
The fuel consumption per unit time is expressed as Equation (2):
, is fuel consumption rate [g/(kWh)], is fuel density (kg/L), and is acceleration of gravity (m/s2).
The engine fuel consumption is expressed as Equation (3):
2.2. Driving Motor Model
The establishment of driving motor’s model is similar to that of the engine. It pays no attention to the electromagnetic and thermodynamic characteristics of the motor body, but only to the dynamic characteristics of the motor [2]. The external characteristics and working efficiency of the motor are measured by bench test.
The working efficiency of the motor is expressed as Equation (4):
is the demand torque of the motor (Nm), and is the current speed of the motor (rpm).
The actual output torque of the motor is expressed as Equation (5):
and are respectively the maximum driving torque and braking torque of the motor, which are related to the current motor speed.
The output power of the motor is expressed as Equation (6):
2.3. Power Battery Model
The power battery system is one of the sources of energy for hybrid electric vehicles, and its performance directly affects the power performance and fuel economy of the vehicle. The lithium-ion battery is used in the researched PHEV for its superior high specific energy and specific power performance [21]. In this paper, the equivalent circuit model is used to establish the battery model (as shown in Figure 3), is the open circuit voltage, is the equivalent internal resistance, is the load voltage, and is the charge-discharge current.
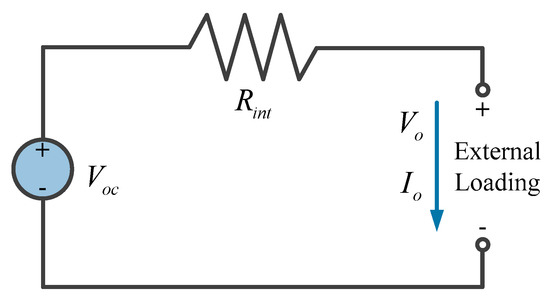
Figure 3.
Equivalent circuit diagram of power battery model.
According to Ohm’s law, the battery load voltage and load power are expressed as Equation (7):
The battery charge–discharge current is expressed as Equation (8):
The SOC in the battery model is calculated by the ampere–time integral method, as shown in Equation (9):
is the SOC of the battery at k time, and is the battery capacity (Ah).
2.4. Longitudinal Dynamic Model
This paper mainly studies the longitudinal dynamic model of vehicle driving process, ignoring the influence of lateral dynamics on vehicle. The driving torque and braking torque acting on the drive shaft accelerate or decelerate the vehicle.
According to the automobile theory [22], when the vehicle is driving:
when the vehicle is braking:
is the vehicle driving force (N), is the power source driving torque (Nm), is the gear ratio of the transmission, is the gear ratio of the main reducer, is the powertrain efficiency, is the wheel rolling radius (m), and is the vehicle braking force (N), which is the sum of the electric braking force and the mechanical braking force . is the rolling resistance (N), is the rolling resistance coefficient, and the specific value can be expressed as a function of vehicle speed, which is , is the vehicle speed (km/h), is the vehicle mass (kg), is the ramp angle of the road (rad), is the air resistance (N), is the air resistance coefficient, is the windward area (m/s2), is the air density (kg/m3), is the relative vehicle speed (m/s), is the gradient resistance (N), is the acceleration resistance (N), and is the vehicle rotation mass conversion factor, which is calculated as Equation (13):
is the vehicle rotational inertia (), is the engine rotational inertia (), and is the driving motor rotational inertia ().
The research object of this paper is a plug-in hybrid electric bus, which mainly runs in city driving cycle, so the simulation is based on Chinese Bus Driving Cycle (CBDC). The simulation result is shown in Figure 4. The difference between the actual speed and the expected speed is within 1 km/h, which can track the speed of driving cycle well and meet the accuracy requirements.
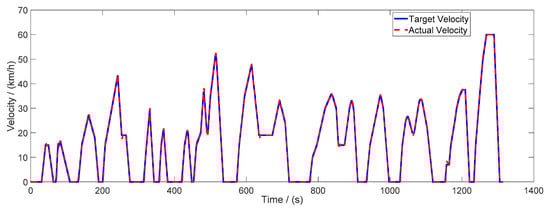
Figure 4.
Simulation result of vehicle speed in Chinese Bus Driving Cycle (CBDC).
3. Optimization and Matching Design Method of PHEV
According to the performance constraints of PHEV, the fuel economy and lightweight optimization targets are selected to optimize and determine the design parameters of the PHEV main power components, including engine power , motor power and battery capacity . The optimization and matching process of PHEV power sources is shown in Figure 5.
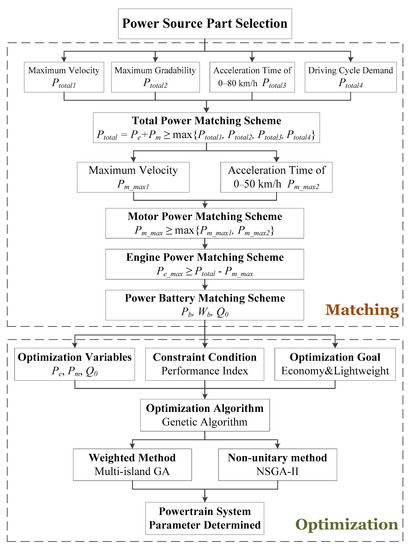
Figure 5.
Optimization and matching design process of PHEV power sources.
3.1. Analysis of Power Unit Parameters
The parameter selection of the plug-in hybrid system is related to the power performance, the fuel economy, the manufacturing cost and the use cost. In the initial stage of vehicle design, it is necessary to select the main performance parameters of the power system from the performance requirements of the vehicle, so as to provide a basis for establishing a more accurate simulation model and optimization analysis.
3.1.1. Determination of Power Source Total Power
PHEV has two power sources: Engine and motor. It is not necessary to use engine alone to improve peak power when considering vehicle power performance requirements. Therefore, compared with traditional internal combustion engine vehicles, PHEV mainly considers power performance requirements of power sources under hybrid driving mode, including maximum vehicle speed, maximum climbing degree, acceleration power demand and driving cycle demand.
(1) Power demand of maximum vehicle speed:
where is the maximum vehicle speed under hybrid driving mode.
(2) Power demand of maximum climbing degree:
where is the vehicle maximum climbing degree.
(3) Power demand of acceleration under hybrid driving mode:
where is the final vehicle speed during acceleration under hybrid driving mode (km/h), is the acceleration time (s), and is the iteration step, usually 0.1s.
(4) Power demand of driving cycle:
The instantaneous driving power demand of the vehicle for the power system at t time of the target driving cycle is:
where and are respectively the instantaneous vehicle speed in target driving cycle at t and t−1 time, the power demand of driving cycle is shown as Equation (18):
The total power should be greater than the maximum power of the four indicators mentioned above:
3.1.2. Determination of Motor and Engine Power
For the traditional hybrid electric vehicles, the motor mainly provides the required peak power to the electric drive system. The acceleration performance of the vehicle and the peak power of the load in the driving cycle are its main concerns. However, in the driving process of PHEV, due to the existence of pure electric driving mode, the power of the motor needs to meet the power demand of the driving cycle when the motor drives the vehicle separately, including the power demand of maximum vehicle speed and acceleration under pure electric driving mode.
(1) Power demand of maximum vehicle speed under pure electric driving mode:
where is the maximum vehicle speed under pure electric driving mode.
(2) Power demand of acceleration under pure electric driving mode:
where is the final vehicle speed during acceleration under pure electric driving mode (km/h).
According to the maximum power calculated by the dynamic indexes mentioned above, the driving motor power must satisfy the following requirements:
Meanwhile, the sum of motor and engine power must meet the design requirements described in Section 3.1.1:
Therefore, the engine power must satisfy:
3.1.3. Determination of Power Battery Parameters
As the power source of motor, the performance parameters of power battery mainly consider two factors: Power demand and energy demand. The battery pack should ensure that the peak discharge power of the battery is higher than the maximum power of the motor, and the total energy of the battery can meet the driving range requirements.
(1) Power demand of the power battery:
is the discharging efficiency of the power battery, is the motor efficiency.
(2) Energy demand of the power battery:
is the power of the vehicle running at constant speed (km/h); is the driving range under pure electric driving mode (km); and are respectively the maximum and minimum values of battery SOC applicable range.
Therefore, the rated capacity of the power battery pack must satisfy:
3.2. Construction of Optimization Model
For PHEV, it is hoped that fossil fuels will be replaced as much as possible by grid power. At the same time, the hybrid electric city bus is usually focused on the optimization of vehicle fuel economy. Therefore, the optimization problem of PHEV power system is to find the best fuel economy power system scheme [23] on the premise of satisfying the dynamic index constraints. Its mathematical model is described as Equation (28):
is the objective function, is the optimization variables; is the constraint conditions, is the number of constraints; is the parameter to be optimized, and are respectively the lower and upper limits of ith parameter to be optimized, is the number of optimization variables.
3.2.1. Optimization Variables
In the optimization problem, the selection of design variables is the basis of the optimization design. The design variables should not only represent the power components, but also update the characteristic curve of the power components when the design variables are updated. For engines and motors, the power parameter is often selected as the design variable [24]; for batteries, battery capacity is proportional to the charge-discharge power and the number of batteries, therefore battery capacity is chosen as the design variable.
Consequently, the maximum engine power , the maximum motor power , and the battery capacity are selected as design variables, as shown in Equation (29).
In the process of parameter optimization, it is necessary to update the design variables continuously through the optimization algorithm, and then evaluate the objective function value under the design variables. Therefore, the component model should be extensible, that is, when the design variables are updated, the component model should be updated accordingly so that the corresponding component optimization can be performed. Linear extended model is widely used in commercial software because of its simplicity and convenience. The nonlinear extended model is complex and computationally intensive, and the results obtained by linear extended method are not much different from those obtained by non-linear extended method [25]. Therefore, the linear extended model is adopted for all parts of power system in this paper, and the component model established in Chapter 2 is used for reference model.
3.2.2. Constraint Conditions
The optimization and matching of PHEV power sources must satisfy the system development objectives, the system development objectives and other component constraints constitute the constraints of the optimization. This paper does not discuss vehicle emissions, so there are three main dynamic indicators: Maximum vehicle speed, acceleration time, and maximum climbing degree, and one economic indicator: Equivalent fuel consumption per hundred kilometers. Meanwhile, the design variables of reference models should be adjusted by the analysis in Section 3.1, as shown in Table 2.
Table 2.
Constraint conditions of optimization and matching.
3.2.3. Selection of Energy Management Strategy
PHEV mainly has the following several energy management modes: Charge-depleting mode, charge-sustaining mode, pure engine mode, and pure electric mode. In this paper, the energy management strategy in reference [26] is adopted. The control strategy consists of three parts: Pure electric mode (EV), charge-depleting mode (CD), and charge-sustaining (CS). In EV mode, the motor drives the vehicle separately, and all the driving power comes from the power battery pack. In CD mode, the SOC of the power battery pack decreases gradually when the motor and the engine drive the vehicle together, and because the engine participates in the power output, the speed of SOC decreases slower than that of EV mode. In CS mode, the engine provides most of the power output required for driving the vehicle, and SOC is maintained in a suitable range until parking. The switching control rules of PHEV working modes are shown in Figure 6. is the SOC threshold from EV mode to CD mode, and is the SOC threshold from CD mode to CS mode.
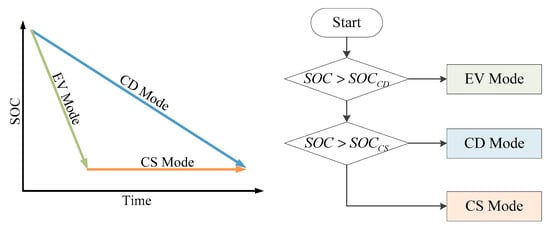
Figure 6.
Switching control rules of PHEV working modes.
3.2.4. Optimization Platform
The structure of the PHEV integrated optimization platform based on Matlab/Simulink and Isight is shown in Figure 7. The PHEV model in the MATLAB/Simulink environment is invoked through the interface module of Isight, and the parameters of PHEV to be optimized in the model are modified. Then, under the Isight environment, the global optimization algorithm program and PHEV model are simulated to solve the power performance and fuel economy, and the results are fed back to Isight, so that the iteration steps are repeated until the preset iteration steps are completed or the preset accuracy is achieved.
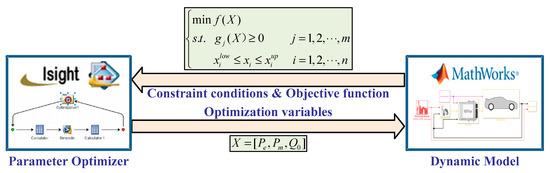
Figure 7.
Integrated optimization platform based on Isight.
4. Multi-Objective Optimization Considering Fuel Economy and Lightweight
Aiming at the problem that parameter matching needs to weigh different design objectives, a multi-objective optimization matching method is proposed. When matching power sources, factors of lightweight, fuel economy, power performance, emission and cost are usually considered. This paper does not consider emission performance, the cost is achieved through lightweight. When the engine, motor and battery are lightweight, the mass is smaller, and the cost is lower. Therefore, this paper adopts weight method and non-normalization method respectively, and considers fuel economy and lightweight as the objectives to optimize PHEV power source components.
The fuel economy of vehicle is usually measured by the fuel consumption of 100 kilometers under certain operating conditions. However, PHEV can provide power either from fuel or from battery, the equivalent fuel consumption of 100 kilometers is used to measure the fuel economy of PHEV. Electricity equivalent fuel consumption is converted into fuel consumption through Equation (30) [27]:
is fuel btu (J/kg), is engine efficiency, is engine efficiency, is variation of SOC, and is the energy converted for electricity consumption.
Equivalent fuel consumption of electricity consumption plus actual fuel consumption is equivalent fuel consumption of vehicles. Equivalent fuel consumption of 100 km is shown as Equation (31):
is the equivalent fuel consumption of 100 kilometers (L/100 km), is fuel consumption (g), is fuel density (kg/L), and is the distance of driving cycle (m).
Hybrid electric system consists of engine, motor, battery pack, and other components. The mass variations of vehicle can be estimated by the following mass model. The vehicle power system mass [28] can be described as Equation (32):
, , , , are fit coefficients, which are obtained by linear fitting of the mass, power and energy relationships of engine, motor and power battery; is power system mass of PHEV (kg), is the engine mass (kg), is the motor mass (kg), and is the power battery mass (kg). Through Equation (32), it can be seen that the mass of the vehicle power system has a linear relationship with the power of the power system, that is to say, reducing the system power can reduce the mass of the vehicle power system and achieve lightweight.
4.1. Weighted Method
Weighted method is a commonly used method to deal with multi-objective problems, which can transform multi-objective problem into single-objective problem. The optimization objectives considering fuel economy and lightweight can be expressed as Equation (33):
By weighting and normalizing, the objective function is shown as:
The objective function value of the original vehicle is 1.0, which facilitates the comparison between the matching results and the original vehicle parameters. Four different weight combinations (as shown in Table 3) are selected. Among them, combination 1 gives priority to engine lightweight, combination 2 gives priority to motor lightweight, combination 3 gives priority to battery lightweight, and combination 4 balances the lightweight and economy of power components.
Table 3.
Values of weight coefficients.
The multi-island genetic algorithm (MIGA) is used to optimize the power system parameters in the optimization platform established in Section 3.2.4. The MIGA is developed on the basis of traditional genetic algorithm (GA). It inherits the basic ideas of GA. The biggest difference between them is that MIGA divides many populations into several sub-populations, performs GA selection, crossover, and mutation operations in sub-populations, and periodically performs targeted immigration operations among different populations [29]. The evolutionary process of its two adjacent generations is shown in Figure 8.
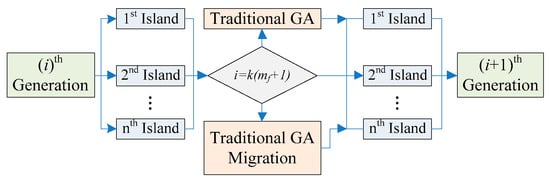
Figure 8.
Evolutionary process of the multi-island genetic algorithm (MIGA).
Considering the optimization time and the accuracy of the results, the parameters of the multi-island genetic algorithm are set as follows: the total population size is 50, the number of evolutionary generations is 500, the crossover probability is 0.9, and the mutation probability is 0.01.
The results of different weight combination optimizations are listed in Table 4. Combination 1 indicates that the engine of the original vehicle has much room for lightweight. Combination 2 and 3 show that the motor and battery parameters of the original vehicle are close to the minimum value of the constraints. Because of the power constraint between the motor and battery capacity, the maximum power of the motor or the battery capacity will be reduced while the value of another parameter is reduced, so the optimal matching results of combination 2 and 3 are close.
Table 4.
Optimal matching results using weight method.
The optimal matching result of combination 1 is that the maximum engine power is 72.4 kW, the maximum motor power is 165.5 kW, and the battery capacity is 67.3 Ah. When the priority is given to the lightweight of the engine, the maximum power of the engine is determined by the lowest speed of the engine driving mode, and the maximum power of the engine is 39.67% lower than that of the original vehicle. Meanwhile, other dynamic and fuel economy indexes are satisfied by increasing motor power and battery capacity. The maximum power of motor increases by 10.33% and battery capacity increases by 12.17%. The optimal matching result of combination 2 is that the maximum engine power is 102.3 kW, the maximum motor power is 136.4 kW, and the battery capacity is 54.3 Ah. When the priority is given to the lightweight of the motor, the power of the motor is determined by the requirement of pure electric driving mode acceleration time for motor power. The engine power decreases compared with the original vehicle. The optimal matching result of combination 3 is that the maximum engine power is 97.8 kW, the maximum motor power is 143.9 kW, and the battery capacity is 56.1 Ah. When the priority is given to the lightweight of the power battery, the matching result is determined by the requirement of motor power for battery power, so the matching result is not much different from that of combination 2. The optimal matching result of combination 4 is that the maximum engine power is 80.5 kW, the maximum motor power is 141.2 kW, and the battery capacity is 57.7 Ah. When considering lightweight and economy, all design objectives are improved, and better matching results can be obtained in all aspects of indicators. The equivalent fuel consumption of 100 km is decreased by about 1%.
4.2. Non-Normalized Method
The non-normalized method is used to solve multi-objective optimal problem, without setting the weight of each target in advance, and the Pareto mechanism is adopted. Pareto frontier and optimal solution set can be obtained by the non-dominated sorting genetic algorithms with elite strategy (NSGA-II), and the optimal solution [30] can be obtained under any preference for the optimal objective.
Since the multi-objective algorithm has lower accuracy for solving problems with more than four design goals and above, the solution speed is slow, and it is difficult to process the optimization results, the design goal of Section 3.2.1. needs to be reduced. The maximum discharge power of the battery is equal to the maximum power of the motor, and the design variables are only engine power and motor power. Then, the goal of lightweight is unified into the total power of engine and motor. The transformed multi-objective problem can be expressed as:
represents the total power of the power system.
In this section, the multi-objective optimization algorithm NSGA-II based on Pareto mechanism is adopted. The implementation step is shown as Figure 9.
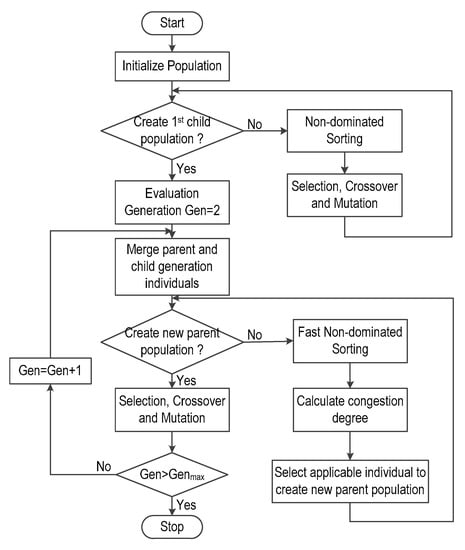
Figure 9.
The non-dominated sorting genetic algorithms with elite strategy (NSGA-II) algorithm optimization step.
Then multi-objective optimization is performed by the NSGA-II algorithm, and the number of individuals per generation is 72, the number of evolutionary generations is 300, the crossover probability is 0.9, and the mutation probability is 0.01. Figure 10 shows the results of multi-objective optimization matching considering fuel economy and lightweight. The smaller the total power value of power system, the better the lightweight, and the smaller the equivalent 100 km fuel consumption, the better the fuel economy. It can be seen from Figure 10 that the lightweight and fuel economy of the power components are conflicting, and the lightweight will inevitably lead to an increase in fuel consumption. So, how to balance lightweight and fuel economy is very important. As can be seen from Figure 10, the design point of the original vehicle is not at the Pareto frontier, and there is much room for improvement in both lightweight and fuel economy.
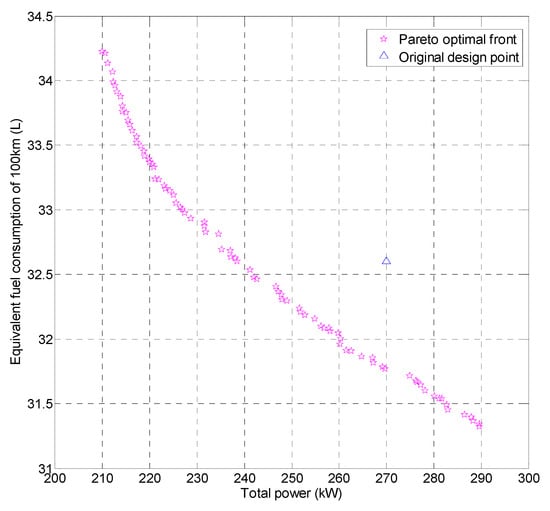
Figure 10.
Multi-objective optimization results considering lightweight and fuel economy.
Considering the lightweight and fuel economy of power system components, the points on Pareto frontier should be selected to obtain better results than other matching combinations. The Pareto frontier in Figure 10 is extracted and 3rd order polynominal fitting is carried out to obtain cubic curve with higher fitting accuracy, as shown in Figure 11. The fitting curve equation is as follows:
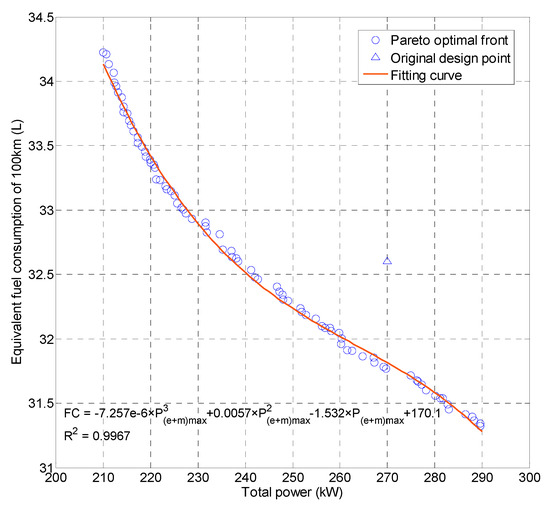
Figure 11.
Fitting curve of the Pareto frontier.
According to the Pareto frontier fitting curve, the optimal relationship between the total power of the power system and the equivalent fuel consumption of 100 km is estimated. If the economy of the equivalent fuel consumption of 100 kilometers is 32.5 L, the minimum total power of the power system is 243.2 kW. Figure 11 shows that increasing the total system power can reduce fuel consumption, but reducing the fuel consumption of 1L requires more power increasing. Since the curve of fuel consumption and total power per 100 km is convex, the power cost of reducing fuel consumption is also increasing. Moreover, when the total power of the system exceeds 290 kW, the equivalent fuel consumption per 100 km is almost no longer reduced and the optimal fuel economy is achieved.
Figure 12 shows the distribution points of the design variables in the multi-objective optimization matching results considering fuel economy and lightweight. It can be seen that the maximum power of motor selected in the range of 140 kW to 215 kW can satisfy all constraints and obtain feasible solutions; and the maximum power of engine selected in the design range can obtain feasible solutions. But in order to get the best matching result, the maximum power of engine and motor can only be selected in limited space. The Pareto solution set of Figure 12 is divided into two sections and respectively fitted to obtain the relationship between the maximum power of the motor and the maximum power of the engine as shown in Equation (37):
Figure 12.
Design variable distribution of multi-objective optimization results.
Figure 13 is a three-dimensional point map of multi-objective optimization results considering fuel economy and lightweight. The optimal lightweight and economy can be obtained by selecting the power system assembly according to Equation (37).
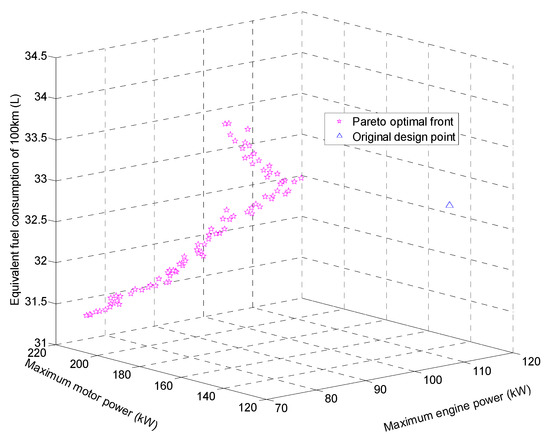
Figure 13.
3D point of multi-objective optimization results.
20 sets of Pareto solutions superior to the original vehicle in terms of lightweight and fuel economy are selected, as shown in Table 5. The choice of the power system can be determined by the designer’s different preferences for the two objectives. If the largest lightweight effect and the smallest volume are to be achieved, the first group of matching results should be chosen, where the lightweight effect is increased by 8.26%; if the best fuel economy is to be achieved, the 20th group of matching results should be chosen, where the fuel economy effect is increased by 2.26%.
Table 5.
Optimal matching results using NSGA-II algorithm.
5. Conclusions
In this paper, regarding the problem that PHEV parameter matching needs to weigh different design objectives, a multi-objective optimization matching method based on genetic algorithm is proposed. This method is not only suitable for plug-in hybrid electric buses, but also for other types of hybrid electric vehicles, traditional vehicles, and pure electric vehicles. The vehicle dynamic model is established based on MATLAB/Simulink, and the feasibility of the model is verified by simulation. The main performance parameters of the power system are matched by theoretical analysis, and the PHEV integrated optimization simulation platform is established based on Isight. Power source components are optimized considering fuel economy and lightweight objectives under the constraints of dynamic indicators. The weight method is adopted the by transforming multi-objective problems into single-objective problems, and the multi-island genetic algorithm is used to obtain the optimal matching results. The results show that the weight method can obtain optimal matching results, and the equivalent fuel consumption of 100 km is reduced by 1%. Then, the four design objectives are reduced to two design objectives by removing the constraints, and the Pareto optimal solution set is obtained by using the NSGA-II algorithm. The optimization results show that compared with the original vehicle, the lightweight effect is increased by 8.26% and the fuel economy effect is increased by 2.26%.
Author Contributions
Conceptualization, P.S. and Y.L.; Project administration, Y.L.; Software, P.S. and Y.F.; Writing-original draft, P.S.; Writing-review and editing, Y.F. All authors have read and agreed to the published version of the manuscript.
Funding
This research was funded by The National Key R&D Program of China (2016YFB0101402) and The Science and Technology Planning Project of Jilin Province (20180520071JH).
Conflicts of Interest
The authors declare no conflict of interest.
References
- Al-Alawi, B.M.; Bradley, T.H. Total cost of ownership, payback, and consumer preference modeling of plug-in hybrid electric vehicles. Appl. Energy 2013, 203, 488–506. [Google Scholar] [CrossRef]
- Khayyam, H.; Bab-Hadiashar, A. Adaptive intelligent energy management system of plug-in hybrid electric vehicle. Energy 2014, 69, 319–335. [Google Scholar] [CrossRef]
- Bashash, S.; Moura, S.J.; Forman, J.C.; Fathy, H.K. Plug-in hybrid electric vehicle charge pattern optimization for energy cost and battery longevity. J. Power Sources 2011, 196, 541–549. [Google Scholar] [CrossRef]
- Li, G.; Zhang, X.P. Modeling of plug-in hybrid electric vehicle charging demand in probabilistic power flow calculations. IEEE Trans. Smart Grid 2012, 3, 492–499. [Google Scholar] [CrossRef]
- Peng, J.K.; Fan, H.; He, H.W.; Pan, D. A rule-based energy management strategy for a plug-in hybrid school bus based on a controller area network bus. Energies 2015, 8, 5122–5142. [Google Scholar] [CrossRef]
- Amjad, S.; Rudramoorthy, R.; Neelakrishnan, S.; Sri Raja Varman, K.; Arjunan, T.V. Evaluation of energy requirements for all-electric range of plug-in hybrid electric two-wheeler. Energy 2011, 36, 1623–1629. [Google Scholar] [CrossRef]
- Wang, X.M. Optimization Study on Powertrain Matching and System Control for Plug-in Hybrid Electric Urban Bus. Ph.D. Thesis, Beijing Institute of Technology, Beijing, China, 2015. [Google Scholar]
- Zeng, X.H.; Wang, Q.N.; Wang, W.H. Study on design method for DOH of HEV. Trans. Chin. Soc. Agric. Mach. 2006, 12, 8–12. [Google Scholar]
- Yun, H.T.; Wan, G.; Sun, Z.C. A study on configuration and parameters optimization of drive-train for fuel cell vehicle. Automot. Eng. 2006, 8, 729–733. [Google Scholar]
- Wang, B.H.; Jin, Y.; Luo, Y.G. Parametric optimization of EQ6110HEV hybrid electric bus based on orthogonal experiment design. Int. J. Automot. Technol. 2010, 11, 119–125. [Google Scholar] [CrossRef]
- Wei, Y.Y.; Zhan, W.Z.; Lin, Y. A study on the matching and optimization of FCHEV powertrain. Automot. Eng. 2008, 10, 918–922. [Google Scholar]
- Zhao, Y.E.; Zhang, J.W. Parameter matching and optimization for the powertrain of a FWD fuel cell electric vehicle. Automot. Eng. 2007, 05, 409–414. [Google Scholar]
- Hu, X.S.; Johannesson, L.; Murgovski, N.; Egardt, B. Longevity-conscious dimensioning and power management of the hybrid energy storage system in a fuel cell hybrid electric bus. Appl. Energy 2015, 137, 913–924. [Google Scholar] [CrossRef]
- Gao, W.Z.; Mi, C. Hybrid vehicle design using global optimisation algorithms. Int. J. Electr. Hybrid Veh. 2007, 1, 57–69. [Google Scholar] [CrossRef]
- Wu, X.L.; Cao, B.G.; Wen, J.P.; Wang, Z.B. Application of particle swarm optimization for component sizes in parallel hybrid electric vehicles. In Proceedings of the IEEE World Computational Intelligence, Hong Kong, China, 1–6 June 2008. [Google Scholar]
- Wu, J.; Zhang, C.H.; Cui, N.X. PSO algorithm based parameter optimization for HEV powertrain and its control strategy. Int. J. Automot. Technol. 2008, 9, 53–69. [Google Scholar] [CrossRef]
- Hegazy, O.; Van Mierlo, J. Particle swarm optimization for optimal powertrain component sizing and design of fuel cell hybrid electric vehicle. In Proceedings of the 12th International Conference on Optimization of Electrical and Electronic Equipment, Brasov, Romania, 20–22 May 2010. [Google Scholar]
- Hegazy, O.; Van Mierlo, J.; Barrero, R.; Omar, N.; Lataire, P. PSO algorithm-based optimal power flow control of fuel cell/supercapacitor and fuel cell/battery hybrid electric vehicles. COMPEL Int. J. Comput. Math. Electr. Electron. Eng. 2012, 31, 86–106. [Google Scholar] [CrossRef]
- Wu, G.Q.; Chen, H.Y. Multi-objective optimization of HEV parameters based on genetic algorithm. Automot. Eng. 2009, 31, 60–64. [Google Scholar]
- Geng, B.; Mills, J.K.; Sun, D. Energy management control of microturbine-powered plug-in hybrid electric vehicles using the telemetry equivalent consumption minimization strategy. IEEE Trans. Veh. Technol. 2011, 60, 4238–4248. [Google Scholar] [CrossRef]
- Sun, F.; Xiong, R. A novel dual-scale cell state-of-charge estimation approach for series-connected battery pack used in electric vehicles. J. Power Sources 2015, 274, 582–594. [Google Scholar] [CrossRef]
- Yu, Z.S. Automobile Theory, 5th ed.; China Machine Press: Beijing, China, 2009; pp. 2–18. [Google Scholar]
- Liu, Y.G.; Li, J.; Ye, M.; Qin, D.T.; Zhang, Y.; Lei, Z.Z. Optimal energy management strategy for a plug-in hybrid electric vehicle based on road grade information. Energies 2017, 10, 412. [Google Scholar] [CrossRef]
- Ba, T. Energy Conservation Analysis and Evaluation for Typical Series-Parallel Hybrid Electric Bus. Ph.D. Thesis, Jilin University, Changchun, China, 2016. [Google Scholar]
- Wu, L.H.; Wang, Y.N.; Yuan, X.F.; Chen, Z.L. Multiobjective optimization of HEV fuel economy and emissions using the self-adaptive differential evolution algorithm. IEEE Trans. Veh. Technol. 2011, 60, 2458–2470. [Google Scholar] [CrossRef]
- Peng, J.K.; He, H.W.; Xiong, R. Rule based energy management strategy for a series–parallel plug-in hybrid electric bus optimized by dynamic programming. Appl. Energy 2017, 185, 1633–1643. [Google Scholar] [CrossRef]
- Zhan, S. Energy Management Strategy of Hybrid Electric Vehicle Based on the Recognition of Driving Cycle and Driving Style. Ph.D. Thesis, Chongqing University, Chongqing, China, 2016. [Google Scholar]
- Markel, T.; Simpson, A. Cost-benefit analysis of plug-in hybrid electric vehicle technology. World Electr. Veh. J. 2007, 1, 294–301. [Google Scholar] [CrossRef]
- Hu, X.Z.; Chen, X.Q.; Zhao, Y.; Yao, W. Optimization design of satellite separation systems based on multi-island genetic algorithm. Adv. Space Res. 2014, 53, 870–876. [Google Scholar] [CrossRef]
- Deng, T.; Liu, C.S.; Li, Y.N.; Lu, R.Z. A multi-objective optimization method for energy management control of hybrid electric vehicles using NSGA-II algorithm. J. Xian Jiaotong Univ. 2015, 10, 23. [Google Scholar] [CrossRef]


© 2020 by the authors. Licensee MDPI, Basel, Switzerland. This article is an open access article distributed under the terms and conditions of the Creative Commons Attribution (CC BY) license (http://creativecommons.org/licenses/by/4.0/).