Abstract
Horizontal well drilling is a highly effective way to develop marine gas hydrate. During the drilling of horizontal wells in the marine gas hydrate layer, hydrate particles and cutting particles will migrate with the drilling fluid in the horizontal annulus. The gravity of cuttings is easy to deposit in the horizontal section, leading to the accumulation of cuttings. Then, a cuttings bed will be formed, which is not beneficial to bring up cuttings and results in the decrease of wellbore purification ability. Then the extended capability of the horizontal well will be restricted and the friction torque of the drilling tool will increase, which may cause blockage of the wellbore in severe cases. Therefore, this paper establishes geometric models of different hole enlargement ways: right-angle expansion, 45-degree angle expansion, and arc expanding. The critical velocity of carrying rock plates are obtained by EDEM and FLUENT coupling simulation in different hydrate abundance, different hydrate-cuttings particle sizes and different drilling fluid density. Then, the effects of hole enlargement way, particle size, hydrate abundance and drilling fluid density on rock carrying capacity are analyzed by utilizing an orthogonal test method. Simulation results show that: the critical flow velocity required for carrying cuttings increases with the increase of the particle size of the hydrate-cuttings particle when the hydrate abundance is constant. The critical flow velocity decreases with the increase of drilling fluid density, the critical flow velocity carrying cuttings decreases with the increase of hydrate abundance when the density of the drilling fluid is constant. Orthogonal test method was used to evaluate the influence of various factors on rock carrying capacity: hydrate-cuttings particle size > hole enlargement way > hydrate abundance > drilling fluid density. This study provides an early technical support for the construction parameter optimization and well safety control of horizontal well exploitation models in a marine natural gas hydrate reservoir.
1. Introduction
Natural gas hydrate is a kind of white crystalline clathrate compound formed by hydrocarbon molecules such as methane and water molecules under low temperature and high pressure. It looks like ice and is commonly called “combustible ice” [1,2]. Natural gas hydrate is characterized by high density, high calorific value and wide distribution [3]. Its carbon content is equivalent to twice the total carbon content of proven fossil energy sources in the world, which would be used as an unconventional and clean energy to replace the global oil and gas [4]. In the 21st century, as a clean energy source, natural gas hydrates are mainly distributed in the terrestrial permafrost and waters with a depth of 300–3000 m, about 90% of which are stored in deep sea areas [5]. According to incomplete statistics [6], the total amount of natural gas hydrate resources in the world is about 2.1 × 10¹⁶ m3, while the total amount of natural gas hydrate in China is about 80.1 × 10¹² m3. Among these, the content of the South China sea, the East China sea, the Qinghai-Tibet Plateau and the Northeast permafrost are 64.2 × 10¹² m3, 3.38 × 10¹² m3, 12.5 × 10¹² m3 and 2.8 × 10¹² m3 respectively [4,7]. Given such a huge amount of resources, how to efficiently and safely develop marine natural gas hydrates has always been a research hotspot in China and the world.
During the drilling of horizontal wells in the marine gas hydrate layer, hydrate particles and cutting particles will migrate with the drilling fluid in the horizontal annulus. Due to gravity, it is easy to deposit in the horizontal section, leading to the accumulation of cuttings. Then a cuttings bed will be formed, which is not beneficial to bring up cuttings and results in the decrease of wellbore purification ability. Then the extended capability of the horizontal well will be restricted and the friction torque of the drilling tool will increase, which may cause blockage of the wellbore in severe cases [8,9,10,11].
At present, a large number of domestic and foreign research on carrying cuttings rule are mainly aimed at drilling and production in conventional oil and gas fields. In the 1970s, the drilling project team of Tulsa University begun to study the movement of cuttings in inclined wells, and found that there are significant differences in the rules of cuttings migration between inclined wells and vertical wells [12]. In the early 1980s, foreign research scholars had some perceptual understanding of wellbore purification. In the late 1980s, scientific research institutions such as Tulsa University, Heriot-Watt University, BP exploration center and the French Petroleum Research Institute established experimental equipment for studying the rule of carrying cuttings. The data measured by this experimental equipment laid an important foundation for the formulation of the model [13,14,15,16]. In the 1990s, Gavignet and Sobey [17] established a double-layer model of cuttings migration and predicted the cuttings migration model. Bassal [18] studied the effect of drill string rotation on cuttings migration in slope wells after integrating the action of cuttings particle size, drilling fluid velocity, drilling tool operation mode and rheological properties of drilling fluid. Yuejin Luo [19] et al. established a physical model of wellbore purification by analyzing cuttings force and dimensionless parameters. T.I.Larsena et al. carried out a large number of cuttings migration experiments under the condition of drilling fluid migration critical velocity and subcritical flow velocity through the 12.7 cm flow loop of TUDRP. The experiment shows that the cuttings bed begins to form when the velocity is below the critical value, and stops growing when the velocity is higher than the critical value. In 2000, Hyun C and Subhash N S [20] established a three-stage hydraulic model for cuttings transportation in horizontal and slope Wells. In 2002, Jawad RH [21] established a design model for drilling fluid carrying capacity for directional wells taking into consideration the actual mechanism of cutting transport through an inclined eccentric annulus. In 2008, Ozbayoglu EM and Saasen A [22] investigated the effect of pipe rotation on hole cleaning for horizontal and directional wells at METU Cuttings Transport Flow Loop. In 2012, Ali P and Issham I [23] indicated the results of an experimental study that was carried out to evaluate cuttings removal efficiency using three types of drilling fluid.
The research on carrying cuttings in drilling in China started at the end of the 20th century. In 1993, Wang Haige, Liu Xisheng and Ding Gang created the mechanical model of cuttings migration by means of probability statistical analysis of experimental data, summed up the physical modes of different cuttings migration and described the cuttings migration patterns under different reverse velocity [24]. In 1997, Luo Guiming and Liu Yongjian analysed the migration rule of cuttings in high deflecting well and horizontal well, and built solids carrying theoretical model of two-phase flow in drilling fluid [25]. In 2004, Wang Zhiming and Zhang Zheng created a new two-layer time-dependent model for cuttings transport which is based on Martins’model [26]. In 2010, Dong Changyin and Deng Shan developed the critical velocity model for grains at bed surface in highly deviated well under the analysis of torque equilibrium considering the gravity, buoyant weight, fluid thrust force [27]. In 2014, Wei Na et al. studied the cuttings stress, migration form and dynamic migration law by using a large-scale multi-phase flow experiment platform to conduct a visualization experiment of cuttings migration in the horizontal Wells [28]. In 2017, Wei Na et al. established the critical velocity model of drilling fluid during cuttings rolling and jumping, and studied the migration law of solid phase particles of NGH with different abundance in horizontal section under multi-phase flow conditions [29,30].
At present, the research on the rule of carrying cuttings in conventional oil and gas field drilling has been relatively mature at home and abroad, but there are few studies on the problem of carrying cuttings in the development of deep sea gas hydrate. Therefore, this paper refers to the influencing factors of carrying cuttings in the conventional oil and gas field drilling process, using FLUENT simulation technology to simulate the hydrate-carrying capacity of right-angle expansion, 45-degree angle expansion and arc expanding. This paper mainly studies the critical velocity of carrying rock under the condition of different hydrate abundance, different hole enlargement ways, different hydrate-cuttings particle sizes and different drilling fluid density. Moreover, the influence order and optimal combination of each influencing factor are determined by orthogonal test analysis method, which provides early technical support for the optimization of operation parameters and well control safety of horizontal well exploitation mode of marine gas hydrate reservoir.
2. Modeling
2.1. Geometric Model
Using Creo2.0 software, the geometric model of the horizontal pipe section with a length of 4.35 m, inner diameter of 0.127 m and outer diameter of 0.216 m is established. The lengths and diameters of right-angle, 45-degree angle and arc expanding section are all 1 m and 0.32 m, respectively, and the expanding ratio is 1.5 times.
The geometric models of the right-angle, 45-degree angle and arc expansion are respectively imported into Meshing in Workbench 15.0 for mesh division, and the changes of physical parameters in the boundary region are not taken into account. Among them, the right-angle hole enlargement model partitioning grid number is 869,988, node number is 172,672; the 45-degree angle hole enlargement model partitioning grid number is 865,937, node number is 171,835; the grid number of arc expanding is 831,509, the number of nodes is 165,028. The drilling fluid inlet, outlet, inner wall and outer wall are named respectively. The geometry schematic diagrams of the right-angle, 45-degree angle and arc expansion geometry are shown in Figure 1, Figure 2 and Figure 3.
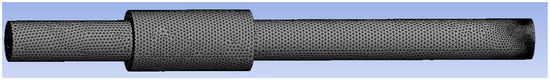
Figure 1.
Schematic diagram of right-angle expansion model in horizontal section.
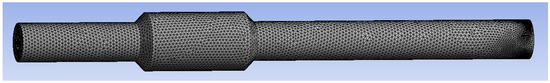
Figure 2.
Schematic diagram of 45-degree angle expansion model in horizontal section.
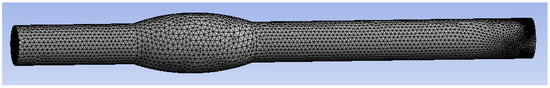
Figure 3.
Schematic diagram of arc expansion model in horizontal section.
2.2. Basic Assumptions and Physical Models
The basic assumptions made in the modeling process are as follows:
- (1)
- The flow process conforms to the continuous medium principle, the hydrate particles are all continuous media.
- (2)
- The transfer of interphase mass in the hydrate slurry is not considered, the formation and decomposition of hydrate are ignored.
- (3)
- Ignoring that the fluid is a compressible medium.
- (4)
- The law of conservation of mass, momentum and energy all are satisfied in the flow process of the pipeline.
Based on these basic assumptions, the physical models used are mainly multi-phase flow model and turbulence model.
The multi-phase flow model adopts particle quasi-fluid model, also known as the Euler-Euler model, which is composed of continuity equation, momentum equation, energy equation and fluid composition equation.
Continuity equation
Momentum equation:
Energy equation:
Fluid composition equation:
where: , , , are the density of gas, drilling fluid, cuttings and hydrate, respectively, kg/m3; , , , are the velocity of gas output, drilling fluid and hydrate, respectively, m/s; is cuttings formation rate, kg/s; is the volume fraction of the produced gas, dimensionless; A is annulus area, m2; is the decomposition rate of the hydrate layer per unit length, kg/(s·m); is the mass fraction of natural gas in gas hydrates, dimensionless; is the rate of formation of gas hydrate particles per unit length, kg/(s·m); is hole drift angle, rad; is annulus friction, Pa; is annulus pressure, Pa. h is enthalpy, it’s made up of internal energy and pressure energy; are the mass flow of gas and liquid phase, respectively, kg/s; , are the volume fraction of gas and liquid phase, respectively, dimensionless; , are the temperature of annulus and drill pipe, respectively, °C.
The turbulence model is the standard model.
2.3. Parameter Setting and Model Solving
The geometric model was imported into FLUENT to set boundary parameters: (1) The hydrate density is 950 kg/m3, and the cuttings density is 2600 kg/m3 (2) It is assumed that the hydrate particle abundance is 10%, 20% and 30% respectively. Then, the corresponding hydrate-debris particle density is calculated as 2435 kg/m3, 2270 kg/m3 and 2105 kg/m3 by weighted average. As the temperature and pressure change little while moving in the horizontal section, the decomposition amount of the hydrate particles is very small, so the decomposition rate is approximately zero.
Firstly, the geometric model with parameters was imported into FLUENT15.0, and then the coupling interface EDEM2.7 was imported into FLUENT15.0. The k-epsilon model was selected; seawater drilling fluid and methane gas were set in the FLUENT15.0. Among them, the operation steps of EDEM2.7 are:
- (1)
- Importing the model, setting the material steel and particle.
- (2)
- Setting the particle diameter to 4 mm, and the particle size was randomly generated according to 1 ± 0.05 times of diameter during simulation.
- (3)
- Setting the rotational speed of the horizontal segment model to 30 rad/s.
- (4)
- The virtual area, the area of generating particles, set as four symmetric small circles with a radius of 35 mm.
- (5)
- Coupling Server coupling switch, click Start to start coupling.
3. Numerical Simulation Analysis
3.1. The Critical Flow Velocity of Hydrate Abundance 10% and Particle Size 4 mm
Gas hydrate abundance, particle size, generation speed, rotating speed and bit size are set as 10%, 4mm, 3000 particle/s, 30 rad/s and 215.9 mm, respectively. After 10 s simulation time, the particle distribution maps of different flow velocities after carrying rock for 10 s are shown in Figure 4, Figure 5 and Figure 6 respectively.
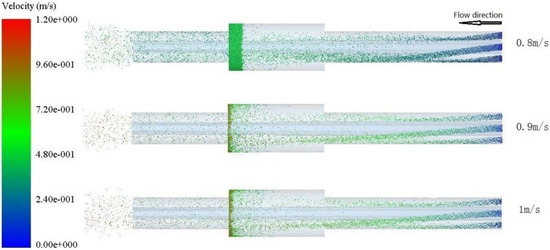
Figure 4.
Particle distribution map after 10 s simulation time with different velocity under right-angle expansion.
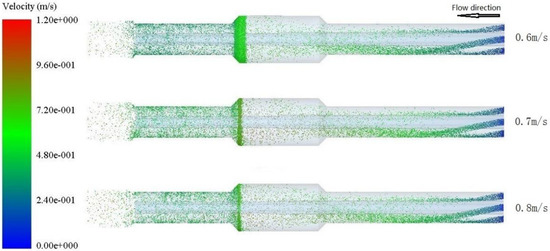
Figure 5.
Particle distribution map after 10 s simulation time with different velocity under 45-degree angle expansion.
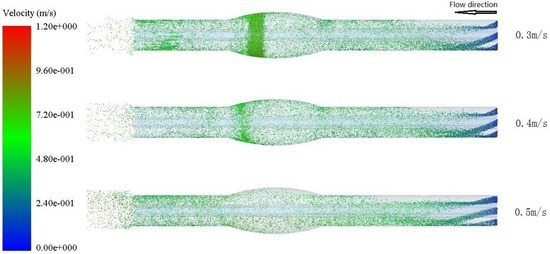
Figure 6.
Particle distribution map after 10 s simulation time with different velocity under arc expansion.
As indicated in Figure 4, when the drilling fluid velocity is 0.8 m/s, a large number of particles are accumulated on the left. When the drilling fluid velocity increase to 0.9 m/s, the particles are piled on the left side have been significantly reduced. When its rate reaches 1 m/s, the number of particles packing is basically the same as that of particles at 0.9 m/s.
In Figure 5, when the drilling fluid velocity is 0.6 m/s, large quantities of particles are accumulated on the left. However, the particles are significantly reduced by at half while the drilling fluid velocity rise to 0.7 m/s, and the particle situation of 0.7 m/s are the basically same as 0.8 m/s. Compared with the right-angle expansion, the 45 degree angle is more inclined than the right-angle, the cuttings particles more easily effusing from the 45 degree angle hole enlargement section.
In Figure 6, when the drilling fluid velocity is 0.3 m/s, large quantities of particles are accumulated on the left under arc expansion. When the drilling fluid velocity increases to 0.4 m/s, the volume of the left part is greatly reduced. When its rate reaches 1 m/s, there is substantially no particle accumulation at arc expansion section.
Therefore, the critical carrying cuttings flow velocity of drilling fluid for the right-angle expansion, 45-degree angle expansion and arc expansion are 0.9 m/s, 0.7 m/s and 0.4 m/s respectively.
3.2. The Critical Flow Velocity Plate of Different Hydrate Abundance and Particle Size
The four particle sizes of 2 mm, 4 mm, 6 mm and 8 mm are respectively simulated under the condition of the hydrate abundance of 10%, 20% and 30%, that is, each hydrate abundance value should be simulated for the corresponding four particle sizes. The critical flow velocity plate could be obtained, as shown in in Figure 7, Figure 8 and Figure 9 respectively under three different hole enlargement ways.
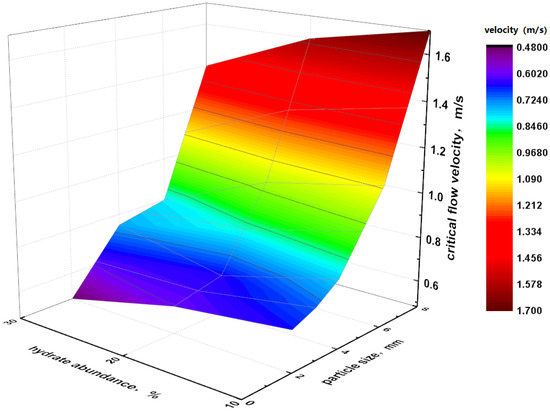
Figure 7.
The critical flow velocity plate of different hydrate abundance and particle size under right-angle expansion.
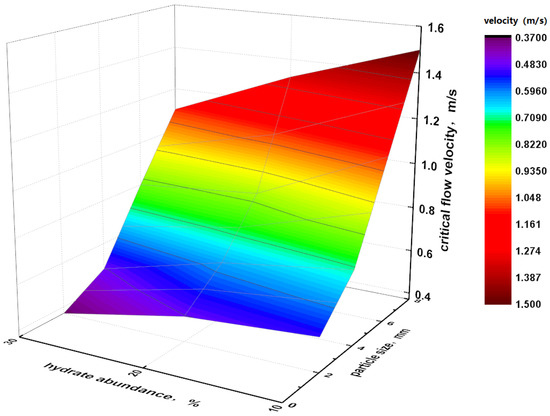
Figure 8.
The critical flow velocity plate of different hydrate abundance and particle size under 45-degree angle expansion.
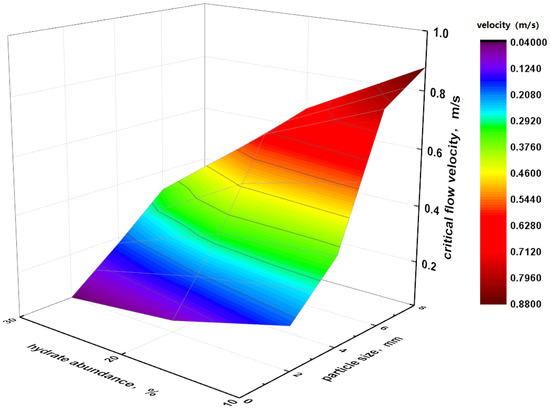
Figure 9.
The critical flow velocity plate of different hydrate abundance and particle size under arc expansion.
It can be seen from Figure 7, Figure 8 and Figure 9 that in the three hole enlargement way, the critical flow velocity for carrying cuttings increases with the increase of the particle size of the hydrate-rock debris when the hydrate abundance is constant; the critical fluid velocity decreases with the increase of hydrate abundance when the particle size of the hydrate-rock debris is constant. When the hydrate abundance and the particle size of the hydrate-rock debris are both constant, the carrying cuttings capacity in right-angle expansion method is the poorest, the carrying cuttings capacity in 45-degree angle expansion method is medium, and the carrying cuttings capacity in arc expanding method is the best. The reasons for this phenomenon are as follows: (1) Because of the increase of hydrate abundance, the density of cuttings decreases and the critical velocity of carrying rock decreases. (2) As the particle size increases, the ability to jump again decreases after collision between particles and pipe wall, and between particles and pipe wall. The increase of particle size also increases its gravity, and the drag force of the drilling fluid carrying particles increases, therefore the critical flow velocity is increased in the expansion section.
3.3. The Critical Flow Velocity Plate of Different Hydrate Abundance and Drilling Fluid Density
The four drilling fluid densities of 1030 kg/m3, 1130 kg/m3, 1230 kg/m3 and 1330 kg/m3 are respectively simulated under the condition of the hydrate abundance of 10%, 20% and 30%, that is, each hydrate abundance value should be simulated for the corresponding four drilling fluid densities. The critical flow velocity plate could be obtained as shown in in Figure 10, Figure 11 and Figure 12 respectively under three different hole enlargement ways.
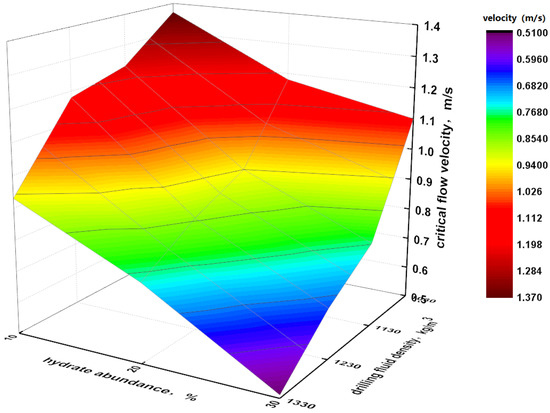
Figure 10.
The critical flow velocity plate of different hydrate abundance and drilling fluid density under right-angle expansion.
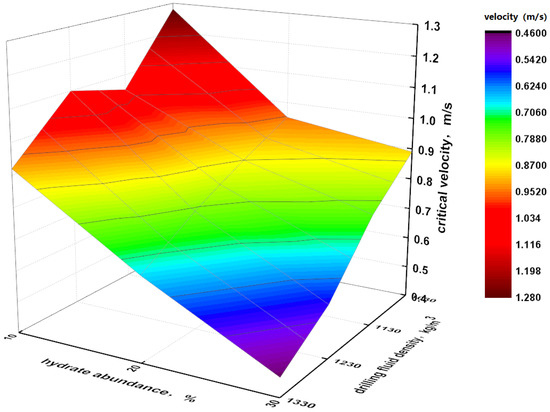
Figure 11.
The critical flow velocity plate of different hydrate abundance and drilling fluid density under 45-degree angle expansion.
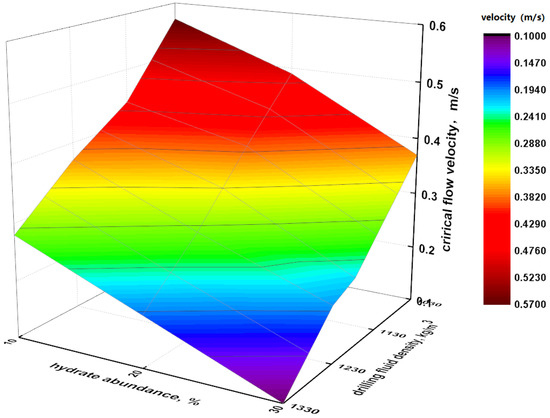
Figure 12.
The critical flow velocity plate of different hydrate abundance and drilling fluid density under arc expansion.
It can be seen from Figure 10, Figure 11 and Figure 12 that the critical flow velocity of carrying cuttings decreases with the increase of the drilling fluid density when the hydrate abundance is constant. Moreover, the critical fluid velocity decreases with the increase of hydrate abundance when the density of the drilling fluid is constant. When the hydrate abundance and drilling fluid density are both constant, the carrying cuttings capacity in right-angle expansion method is the poorest, 45-degree angle expansion method is medium, and arc expanding method is the best. The reasons for this phenomenon are as follows: (1) Because of the increase of hydrate abundance, the density of cuttings decreases and the critical velocity of carrying rock decreases. (2) As the drilling fluid density increases, the drag force of the drilling fluid carrying particles increases, therefore the critical flow velocity is increased in the expansion section.
4. Orthogonal Test Analysis
Orthogonal test method is a method to study multi-factor and multi-level problems. The influence level of each factor can be determined by the statistical analysis of experimental results by orthogonal test method. The orthogonal test method can comprehensively analyze the influence of various factors on rock carrying capacity, and the influence magnitude can be sorted to get the best combination.
In this orthogonal test, four experimental factors are selected, which are expansion mode, hydrate-cuttings particle size, hydrate abundance and drilling fluid density, and three levels are selected for each factor. The critical velocity of carrying rock is taken as the test index. Under the horizontal wells drilling in marine gas hydrates, the factors influencing of the rock carrying capacity are shown in Table 1 and the results of the analysis are shown in Table 2.

Table 1.
Factors influencing and levels of rock carrying capacity.
Table 2.
Results of orthogonal test analysis on rock carrying capacity.
As shown in Table 2, the test results of no. 8 A3B2C1D3 showed the minimum critical velocity (0.1 m/s), which was the best of all the 9 tests. This is the optimal level combination selected from the experiment. Hydrate-cuttings particle size is the most important factors influencing of horizontal wells drilling in marine gas hydrate, which should be considered in practical operation. The order of the four factors is: hydrate-cuttings particle size > expansion mode > hydrate abundance > drilling fluid density. The optimal combination under the simulated working condition is: arc expansion, hydrate abundance 20%, hydrate-cuttings particle size 2 mm, drilling fluid density 1230 kg/m3.
Since the orthogonal test is only 1/9 all the 34, 81 experiments, it is necessary to verify whether A3B2C1D3 is optimal by using the trend chart of the influence of various factors on critical flow velocity of carrying rock.
In order to judge intuitively, the factors influencing are used as the abscissa, and the average value of the index are used as the ordinate according of the data in Table 2. Then, the trend chart of the influence of various factors is drawn on critical flow velocity of carrying cuttings, as shown in Figure 13. When comparing Ki values, the minimum Ki level is taken as the optimal level. Among them, Ki is the sum of indicators and data of repeated tests at all levels; ki is the average of the indicators.
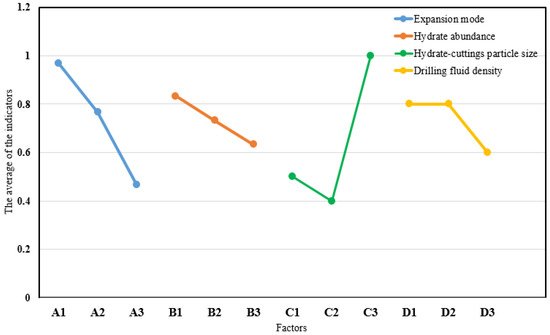
Figure 13.
Trend chart of the influence of various factors on the critical velocity.
In the influence trend chart, the magnitude of the rise and fall of the horizontal change point indicate the influence degree of this factor on the critical velocity of carrying rock. As shown in Figure 13, hydrate-cuttings particle size has changed radically, which shows that hydrate-cuttings particle size plays a major role in influencing the critical rock-carrying velocity; the change range of expansion mode is also large, followed by the influence. The order of the four factors is: hydrate-cuttings particle size > expansion mode > hydrate abundance > drilling fluid density, which is consistent with the quantitative discussion results of the above test.
5. Experimental Simulation Verification
In order to further verify the accuracy of simulation, referring to Experimental research on horizontal circulation pipeline of hydrate slurry by my experimental team [31], the rule of carrying cuttings in horizontal well drilling of marine natural gas hydrate was obtained.
Since the whole experimental device has only arc section, only the experimental results and numerical simulation results of rock carrying in the arc section are verified.
5.1. Experimental Research on Horizontal Circulation Pipeline of Hydrate Slurry
In the experimental research on horizontal circulation pipeline of hydrate slurry, the displacement of governor pump gear is gradually increased from 0, and the solid phase particle migration in the horizontal pipeline is monitored in real time. Then, recording the displacement of solid particles at the critical start-up, the experimental data under different solid particle sizes and different hydrate volume fractions are shown in Table 3 and Table 4, respectively.
Table 3.
The experimental data under different solid particle sizes.
Table 4.
The experimental data under different hydrate volume fractions.
5.2. Comparisons of Simulation with Experiment
By comparing the experimental data with the numerical simulation, the experimental and theoretical correlation curve of the critical start-up velocity under different solid particle sizes and different hydrate volume fractions are shown in Figure 14 and Figure 15, respectively.
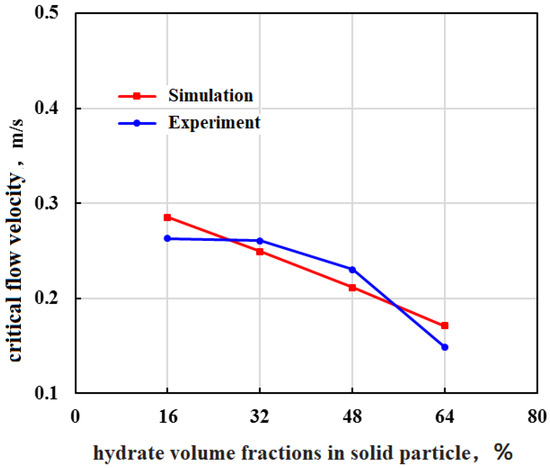
Figure 14.
The experimental and theoretical curves of the critical velocity of particles under different solid particle sizes.
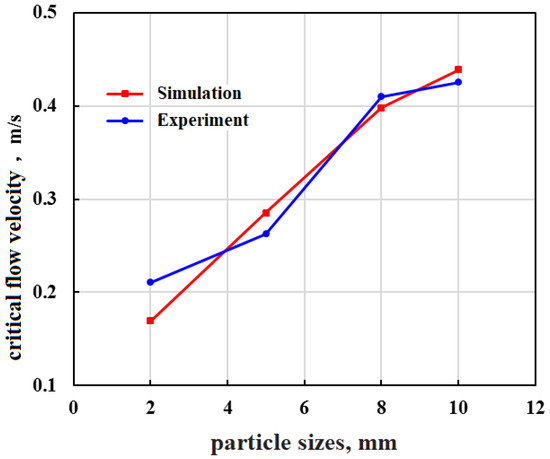
Figure 15.
The experimental and theoretical curves of the critical velocity of particles under different hydrate volume fraction.
It can be seen from Figure 14, with the increase of solid particle size, the critical starting flow velocity increases. The numerical simulation results are consistent with the experimental results that the error is less than 9.62%. From Figure 15, with the increase of volume fraction of hydrate in solid particles, the critical starting flow velocity decreases. The numerical simulation results are consistent with the experimental results that the error is less than 8.52%. By comparing the numerical simulation with the experiment, the accuracy of the establishment of the critical flow velocity plate of marine gas hydrate is verified.
6. Conclusions
- (1)
- This paper establishes three different hole enlargement way models: right-angle expansion method, 45-degree angle expansion method, and arc expanding method. Coupling simulations with EDEM and FLUENT are carried out to obtain the critical flow velocity plate required in the carrying cuttings.
- (2)
- In the three different expansion methods, the critical flow velocity required for carrying cuttings increases with the increase of the particle size of the hydrate-cuttings particle when the hydrate abundance is constant. The critical flow velocity decreases with the increase of drilling fluid density, the critical flow velocity carrying cuttings decreases with the increase of hydrate abundance when the density of the drilling fluid is constant.
- (3)
- According to the analysis of orthogonal test, the order of the factors influencing the carrying capacity is as follows: hydrate-cuttings particle size > expansion mode > hydrate abundance > drilling fluid density.
- (4)
- Compared with the experimental results, the numerical simulation results are consistent with the experimental result, the accuracy of the establishment of the critical flow velocity plate of Marine gas hydrate is verified.
Author Contributions
Data curation, Y.L.; Funding acquisition, Z.C.; Methodology, L.J.; Software, W.S.; Supervision, H.X. and X.W.; Visualization, T.Q.; Writing—original draft, Y.L.; Writing—review & editing, N.W. All authors have read and agreed to the published version of the manuscript.
Funding
This research was funded by the National Key Research and Development Program (No. 2018YFC0310203 and No. 2016YFC0304008), Strategic Research Program of Chinese Academy of Engineering in Science and Technology Medium and Long-Term Development Strategy Research Field (No. 2017-ZCQ-5), Basic Applied Research Key Projects of Science and Technology Department of Sichuan Province (No. 2019YJ0419), National Natural Science Foundation Item of China (No. 51874252), and Open Fund Project of State Key Laboratory of Oil and Gas Reservoir Geology and Exploitation (No. PLN201816).
Conflicts of Interest
The authors declare no conflict of interest.
References
- Feng, J.C.; Li, X.S.; Li, G.; Li, B.; Chen, Z.Y.; Wang, Y. Numerical investigation of hydrate dissociation performance in the South China Sea with different horizontal well configurations. Energies 2014, 7, 4813–4834. [Google Scholar] [CrossRef]
- Liu, B.; Yuan, Q.; Su, K.H.; Yang, X.; Wu, B.C.; Sun, C.Y.; Chen, G.J. Experimental simulation of the exploitation of natural gas hydrate. Energies 2012, 5, 1–28. [Google Scholar] [CrossRef]
- Wei, N.; Sun, W.; Meng, Y.; Liu, A.; Zhao, J.; Zhou, S.; Li, Q. Multiphase non equilibrium pipe flow behaviors in the solid fluidization exploitation of marine natural gas hydrate reservoir. Energy Sci. Eng. 2018, 6, 760–782. [Google Scholar] [CrossRef]
- Wei, N.; Sun, W.; Meng, Y.; Liu, A.; Zhao, J.; Xu, C.; Li, H.; Jian, L.; Xu, H. Change mechanism of transient gas-liquid two-phase flow in wellbore during marine natural gas hydrate reservoir drilling. Therm. Sci. 2019, 23, 2179–2187. [Google Scholar] [CrossRef]
- Kezirian, M.T.; Phoenix, S.L. Natural gas hydrate as a storage mechanism for safe, sustainable and economical production from offshore petroleum reserves. Energies 2017, 10, 828. [Google Scholar] [CrossRef]
- Wei, N.; Sun, W.T.; Meng, Y.F.; Liu, A.Q.; Zhou, S.W.; Guo, P.; Lv, X. Analysis of decomposition for structure I methane hydrate by molecular dynamic simulation. Russ. J. Phys. Chem. A 2018, 92, 840–846. [Google Scholar] [CrossRef]
- Wei, N.; Sun, W.T.; Meng, Y.F.; Zhou, S.W.; Li, G.; Guo, P.; Dong, K.; Li, Q.P. Sensitivity analysis of multiphase flow in annulus during drilling of marine natural gas hydrate reservoirs. J. Nat. Gas Sci. Eng. 2016, 36, 692–707. [Google Scholar] [CrossRef]
- Wei, N.; Xu, C.; Meng, Y.; Li, G.; Ma, X.; Liu, A. Numerical simulation of gas-liquid two-phase flow in wellbore based on drift flux model. Appl. Math. Comput. 2018, 338, 175–191. [Google Scholar] [CrossRef]
- Jill, M.D.S.; Richard, D. Towards commercial gas production from hydrate deposits. Energies 2011, 4, 215–238. [Google Scholar]
- Wei, N.; Meng, Y.; Li, G.; Wan, L.; Xu, Z.; Xu, X.; Zhang, Y. Cuttings transport models and experimental visualization of underbalanced horizontal drilling. Math. Probl. Eng. 2013, 10, 1024–1230. [Google Scholar] [CrossRef]
- LI, Y.; Bjorndalen, N.; Kuru, E. Numerical modelling of cuttings transport in horizontal wells using conventional drilling fluids. J. Can. Pet. Technol. 2013, 46, 103–107. [Google Scholar]
- Wei, N.; Meng, Y.F.; Li, G. Cuttings-carried theories and erosive energy laws in annular in gas drilling horizontal well. Therm. Sci. 2014, 18, 1695–1698. [Google Scholar] [CrossRef]
- Iyoho, A.W. Finite-Difference Resistivity Modeling for Arbitrarily Shaped Two-Dimensional Structures; The University of Tulsa: Tulsa, OK, USA, 1980. [Google Scholar]
- Becker, T.E. Correlations for Drill-Cuttings Transport in Directional-well Drilling; The University of Tulsa: Tulsa, OK, USA, 1987. [Google Scholar]
- Meno Silva, W.J. Experimental Study of Shale Cuttings Transport in an Inclined Annulus Using Mineral Oil-Base Mud; University of Tulsa: Tulsa, OK, USA, 1987. [Google Scholar]
- Pickup, G.E.; Sorbie, K.S. The Scaleup of two-phase flow in porous media using phase permeability tensors. SPE J. 1996, 1, 369–382. [Google Scholar] [CrossRef]
- Davies, J.M.; Addy, J.M.; Blackman, R.A. Environmental effects of the use of oil-based drilling muds in the North Sea. Mar. Pollut. Bull. 1984, 15, 363–370. [Google Scholar] [CrossRef]
- Gavignet, A.A.; Sobey, I.J. Model aids cuttings transport prediction. J. Pet. Technol. USA 1989, 41, 916–921. [Google Scholar] [CrossRef]
- Sanchez, R.A.; Azar, J.J.; Bassal, A.A. Effect of drillpipe rotation on hole cleaning during directional-well drilling. SPE J. 1999, 4, 101–108. [Google Scholar] [CrossRef]
- James, M.P.; Luo, Y.J. Settling velocity of variously shaped particles in drilling and fracturing fluids. SPE Drill. Eng. 1987, 2, 337–343. [Google Scholar]
- Hyun, C.; Subhash, N.S.; Osisanya, S.O. A three-segment hydraulic model for cuttings transport in horizontal and deviated wells. In Proceedings of the SPE/CIM International Conference on Horizontal Well Technology, Society of Petroleum Engineers, Calgary, AB, Canada, 6–8 November 2000; pp. 6–8. [Google Scholar]
- Jawad, R.H. Carrying capacity design for directional wells. In IADC/SPE Asia Pacific Drilling Technology; Publisher: Jakarta, Indonesia, 2002. [Google Scholar]
- Ozbayoglu, E.M.; Saasen, A.; Sorgun, M. Effect of pipe rotation on hole cleaning for water-based drilling fluids in horizontal and deviated wells. In Proceedings of the IADC/SPE Asia Pacific Drilling Technology Conference and Exhibition, Jakarta, Indonesia, 25–27 Augest 2008. [Google Scholar]
- Piroozian, A.; Ismail, I.; Yaacob, Z.; Babakhani, P.; Ismail, A.S.I. Impact of drilling fluid viscosity, velocity and hole inclination on cuttings transport in horizontal and highly deviated wells. J. Pet. Explor. Prod. Technol. 2012, 2, 149–156. [Google Scholar] [CrossRef]
- Chen, J.; Liu, X.S. Experimental study of cuttings-carrying in horizontal well. J. Univ. Pet. China 1992, 16, 23–26. [Google Scholar]
- Luo, G.M.; Liu, Y.J. Solids carrying theoretical model of dual flow in drilling fluid of high deflecting well and horizontal well. J. Daqing Pet. Inst. China 1997, 21, 139–142. [Google Scholar]
- Wang, Z.M.; Zhang, Z. A two-layer time-dependent model for cuttings transport in extended-reach horizontal wells. J. Hydrodyn. China 2004, 19, 677–681. [Google Scholar]
- Aiping, D.C.D.S.L.; Long, Z.S.W. Research of critical condition for grains at bed surface in highly deviated wells. Pet. Drill. Tech. China 2010, 3, 22–26. [Google Scholar]
- Wei, N.; Meng, Y.F.; Li, G.; Li, Y.J.; Xu, Z.Y.; Li, H.T. Transient flow characteristics of gas lift in underbalanced drilling. Acta Pet. Sin. 2014, 35, 166–171. [Google Scholar]
- Wei, N.; Meng, Y.F.; Li, G.; Guo, P.; Liu, A.Q.; Xu, T.; Sun, W.T. Foam drilling in natural gas hydrate. Therm. Sci. 2015, 19, 1403–1405. [Google Scholar] [CrossRef]
- Jinzhou, Z.; Haitao, L.; Liehui, Z.; Wantong, S.; Kaisong, W.; Qingping, L. Large-scale physical simulation experiment of solid fluidization exploitation of marine gas hydrate. Nat. Gas Ind. 2018, 10, 76–83. [Google Scholar]
© 2020 by the authors. Licensee MDPI, Basel, Switzerland. This article is an open access article distributed under the terms and conditions of the Creative Commons Attribution (CC BY) license (http://creativecommons.org/licenses/by/4.0/).