Energy Efficiency of Kazakhstan Enterprises: Unexpected Findings


Abstract
1. Introduction
2. State of the Art
2.1. Increasing of Energy Efficiency of Industrial System
- Let us include legal norms of legislative regulation of business entities into the compulsory measures. Their implementation is possible in countries with an established legal culture of population and business representatives, for example, in the countries of the European Union. In EU, such regulations are gradually evolving on the basis of national technical regulations (e.g., UNI-CEI-EN 16001: 2009), which are being transformed into supranational standards (EN 15900 and ISO 50001). At the international level, we can cite the example of the Kyoto Protocol (localized in Europe by Directive 2006/32/CE), which declares the need to clearly define goals, mechanisms, and incentives aimed at improving energy efficiency of national enterprises of the signatory states.
- Incentive events involve exposure to the manufacturer. In countries that actively use this method, financial incentive instruments as well as PR tools are used. It must be recognized that the domestic market of Kazakhstan is quite limited, which makes it less attractive for international companies with high labor productivity, protecting this way national producers. However, national producers need to increase labor productivity by improving the quality of the workforce. Kazakhstani workers and specialists still do not have the necessary competencies to generate internal resources for productivity growth and cost reduction.
- Educational methods imply an impact directly on the consumer, the formation of a new consumer culture based on careful environmental management, and a conscious choice of energy-saving technologies. In turn, consumer demand determines that supply—manufacturers—introduce “green” solutions to meet the wishes of customers.
2.2. Connection of Energy Efficiency with Value Engineering for Customer
3. Materials and Methods
3.1. Kazakhstan Energy Data
3.2. Methods
- The electricity tariff is a variable part that will provide a recoupment of costs for the production of electric energy.
- The capacity tariff is the permanent part, which will ensure the return on investment in the construction of new powerplants, while updating, modernizing, reconstructing, and expaning the existing ones.
4. Results
5. Discussion
- connection (disconnection) of electrical installations to electrical networks of energy-transmitting organizations;
- connection to heat networks of an energy transmission (energy producing) organization;
- connection of electrical installations to electric networks of energy-transmitting organizations of NMH according to the requirements reflected in the technical conditions of NMH;
- connection of heat consumption systems to heat networks of a power transmission (energy producing) organization according to the requirements of technical conditions for connecting heat energy consumers issued by NMH;
- obtaining permits from NMH when carrying out work related to changing the electricity metering scheme;
- payment of the costs of extraordinary verification of a commercial meter for electric energy for connection (if the consumer is disconnected for violation of the terms of the power supply agreement);
- payment of the costs of extraordinary verification of a commercial water meter and connection (if the consumer is disconnected for violation of the terms of the contract);
- payment of costs for the extraordinary verification of a commercial meter for thermal energy and for connection (if the consumer is disconnected for violation of the terms of the heat supply agreement); and
- costs associated with obtaining information about the availability of free capacities of natural monopolies (information costs for electricity, heat, and water).
- Small business interest in developing energy management and improving corporate energy efficiency.
- The declarative interest of the state and a small movement in the real implementation of the model of energy management systems (ISO 50001: 2011), which is a guide for organizations. Additionality in the world division of labor, world trade and, therefore, global competition suggests the possibility of further research on obtaining non-trivial conclusions for national enterprises.
6. Conclusions
Author Contributions
Funding
Conflicts of Interest
References
- Caffal, C. Energy Management in Industry; Centre for the Analysis and Dissemination of Demonstrated Energy Technologies (CADDET): Sittard, The Netherlands, 1995; Analyses series Volume 17. [Google Scholar]
- Dobes, V. New Tool for Promotion of Energy Management and Cleaner Production on No Cure, No Pay Basis. J. Clean. Prod. 2013, 39, 255–264. [Google Scholar] [CrossRef]
- Bunse, K.; Vodicka, M.; Schönsleben, P.; Brülhart, M.; Ernst, F.O. Integrating Energy Efficiency Performance in Production Management—Gap Analysis between Industrial Needs and Scientific Literature. J. Clean. Prod. 2011, 19, 667–679. [Google Scholar] [CrossRef]
- Strielkowski, W.; Lisin, E.; Astachova, E. Economic Sustainability of Energy Systems and Prices in the EU. Entrep. Sustain. Issues 2017, 4, 591–600. [Google Scholar] [CrossRef]
- Amundsen, A. Joint Management of Energy and Environment. J. Clean. Prod. 2000, 8, 483–494. [Google Scholar] [CrossRef]
- Dudin, M.N.; Frolova, E.E.; Protopopova, O.V.; Mamedov, O.; Odintsov, S.V. Study of Innovative Technologies in the Energy Industry: Nontraditional and Renewable Energy Sources. Entrep. Sustain. Issues 2019, 6, 1704–1713. [Google Scholar] [CrossRef]
- Petrenko, E.; Pizikov, S.; Mukaliev, N.; Mukazhan, A. Impact of Production and Transaction Costs on Companies’ Performance According Assessments of Experts. Entrep. Sustain. Issues 2018, 6, 398–410. [Google Scholar] [CrossRef]
- Brunke, J.-C.; Johansson, M.; Thollander, P. Empirical Investigation of Barriers and Drivers to the Adoption of Energy Conservation Measures, Energy Management Practices and Energy Services in the Swedish Iron and Steel Industry. J. Clean. Prod. 2014, 84, 509–525. [Google Scholar] [CrossRef]
- Fleiter, T.; Hirzel, S.; Worrell, E. The Characteristics of Energy-Efficiency Measures—A Neglected Dimension. Energy Policy 2012, 51, 502–513. [Google Scholar] [CrossRef]
- Carbon Trust. Energy Management—A Comprehensive Guide to Controlling Energy Use; The Carbon Trust: London, UK, 2013. [Google Scholar]
- Singh, J.; Singh, H. Continuous Improvement Approach: State-of-Art Review and Future Implications. Int. J. Lean Six Sigma 2012, 3, 88–111. [Google Scholar] [CrossRef]
- Ni, W.; Sun, H. The Relationship among Organisational Learning, Continuous Improvement and Performance Improvement: An Evolutionary Perspective. Total Qual. Manag. Bus. Excell. 2009, 20, 1041–1054. [Google Scholar] [CrossRef]
- Jeyaraman, K.; Teo, L.K. A Conceptual Framework for Critical Success Factors of Lean Six Sigma: Implementation on the Performance of Electronic Manufacturing Service Industry. Int. J. Lean Six Sigma 2010, 1, 191–215. [Google Scholar] [CrossRef]
- Albliwi, S.; Antony, J.; Lim, S.A.H.; van der Wiele, T. Critical Failure Factors of Lean Six Sigma: A Systematic Literature Review. Int. J. Qual. Reliab. Manag. 2014, 31, 1012–1030. [Google Scholar] [CrossRef]
- Faulkner, W.; Badurdeen, F. Sustainable Value Stream Mapping (Sus-VSM): Methodology to Visualize and Assess Manufacturing Sustainability Performance. J. Clean. Prod. 2014, 85, 8–18. [Google Scholar] [CrossRef]
- Morvay, Z.K.; Gvozdenac, D.D. Fundamentals for Analysis and Calculation of Energy and Environmental Performance. In Applied Industrial Energy and Environmental Management; John Wiley & Sons, Ltd.: Hoboken, NJ, USA, 2008. [Google Scholar]
- Capobianchi, S.; Andreassi, L.; Introna, V.; Martini, F.; Ubertini, S. Methodology Development for a Comprehensive and Cost-Effective Energy Management in Industrial Plants. Energy Manag. Syst. 2011. [Google Scholar] [CrossRef]
- Svensson, A.; Paramonova, S. An Analytical Model for Identifying and Addressing Energy Efficiency Improvement Opportunities in Industrial Production Systems—Model Development and Testing Experiences from Sweden. J. Clean. Prod. 2017, 142, 2407–2422. [Google Scholar] [CrossRef]
- Alvandi, S.; Li, W.; Schönemann, M.; Kara, S.; Herrmann, C. Economic and Environmental Value Stream Map (E2VSM) Simulation for Multi-Product Manufacturing Systems. Int. J. Sustain. Eng. 2016, 9, 354–362. [Google Scholar] [CrossRef]
- Herring, H. Is Energy Efficiency Good for the Environment? Some Conflicts and Confusion. In The UK Energy Experience: A Model or a Warning; Mackerron, G., Pearson, P., Eds.; Imperial College Press: London, UK, 1996; pp. 327–338. [Google Scholar]
- Sarma, U.; Karnitis, G.; Zuters, J.; Karnitis, E. District Heating Networks: Enhancement of the Efficiency. Insights Reg. Dev. 2019, 1, 200–213. [Google Scholar] [CrossRef]
- Iysaouy, L.E.; Idrissi, N.E.A.E.; Tvaronavičienė, M.; Lahbabi, M.; Oumnad, A. Towards Energy Efficiency: Case of Morocco. Insights Reg. Dev. 2019, 1, 259–271. [Google Scholar] [CrossRef]
- Hirst, E.; Brown, M. Closing the Efficiency Gap: Barriers to the Efficient Use of Energy. Resour. Conserv. Recycl. 1990, 3, 267–281. [Google Scholar] [CrossRef]
- Backlund, S.; Thollander, P.; Palm, J.; Ottosson, M. Extending the Energy Efficiency Gap. Energy Policy 2012, 51, 392–396. [Google Scholar] [CrossRef]
- Laitner, J.A.; McDonnell, M.T.; Keller, H.M. Shifting Demand: From the Economic Imperative of Energy Efficiency to Business Models that Engage and Empower Consumers. Energy Effic. 2013, 445–470. [Google Scholar] [CrossRef]
- Piper, J.E. Operations and Maintenance Manual for Energy Management; Sharpe Professional: Armonk, NY, USA, 1999; p. 368. [Google Scholar]
- Klugman, S.; Karlsson, M.; Moshfegh, B. A Scandinavian Chemical Wood Pulp Mill. Part 1. Energy Audit Aiming at Efficiency Measures. Appl. Energy 2007, 84, 326–339. [Google Scholar] [CrossRef]
- Shen, B.; Price, L.; Lu, H. Energy Audit Practices in China: National and Local Experiences and Issues. Energy Policy 2012, 46, 346–358. [Google Scholar] [CrossRef]
- Fleiter, T.; Gruber, E.; Eichhammer, W.; Worrell, E. The German Energy Audit Program for Firms-a Cost-Effective Way to Improve Energy Efficiency? Energy Effic. 2012, 5, 447–469. [Google Scholar] [CrossRef]
- Giacone, E.; Mancò, S. Energy Efficiency Measurement in Industrial Processes. Energy 2012, 38, 331–345. [Google Scholar] [CrossRef]
- German Energy Agency. Handbook for Corporate Energy Management—Systematically Reducing Energy Costs; German Energy Agency: Berlin, Germany, 2010. [Google Scholar]
- Capehart, B.L.; Turner, W.C.; Kennedy, W.J. Guide to Energy Management: International Version; The Fairmont Press: Lilburn, GA, USA, 2008. [Google Scholar]
- Petrecca, G. Industrial Energy Management: Principles and Applications. In Industrial Energy Management: Principles and Applications XXXIII; Springer Science+Business Media: New York, NY, USA, 1993; p. 430. [Google Scholar]
- Capehart, B.L.; Turner, W.C.; Kennedy, W.J. Guide to Energy Management; CRC Press: Boca Raton, FL, USA, 2005. [Google Scholar]
- Park Dahlgaard, S.M. The Human Dimension in TQM—Learning, Training and Motivation; Lund University Publications: Lund, Sweden, 2002. [Google Scholar]
- Soltani, E.; Lai, P.-C.; Javadeen, S.R.S.; Gholipour, T.H. A Review of the Theory and Practice of Managing TQM: An Integrative Framework. Total Qual. Manag. Bus. Excell. 2008, 19, 461–479. [Google Scholar] [CrossRef]
- Yukl, G. Leadership in Organizations; Pearson Education Limited: Edinburg, England, 2013; p. 528. [Google Scholar]
- The ENERGY STAR Guidelines for Energy Management. Available online: https://www.energystar.gov/buildings/reference/guidelines (accessed on 15 January 2020).
- Lackner, P.; Holanek, N. Step by Step Guidance for the Implementation of Energy Management. In BESS Project Handbook; Austrian Energy Agency: Vienna, Austria, 2007; p. 84. [Google Scholar]
- Vesma, V. Energy Management Principles and Practice—A Companion to BS en 16001:2009; Hive House Publishing: Manchester, UK, 2017; p. 178. [Google Scholar]
- Conti, T. Quality Thinking and Systems Thinking. TQM Mag. 2006, 18, 297–308. [Google Scholar] [CrossRef]
- Cronemyr, P.; Danielsson, M. Process Management 1–2–3—A Maturity Model and Diagnostics Tool. Total Qual. Manag. Bus. Excell. 2013, 24, 933–944. [Google Scholar] [CrossRef]
- Cooremans, C. Investment in Energy Efficiency: Do the Characteristics of Investments Matter? Energy Effic. 2012, 5, 497–518. [Google Scholar] [CrossRef]
- International Standard Cost Model Manual—OECD.org. Available online: http://www.oecd.org/gov/regulatory-policy/34227698.pdf (accessed on 15 January 2020).
- Petrenko, E.; Iskakov, N.; Metsyk, O.; Khassanova, T. Ecosystem of Entrepreneurship: Risks Related to Loss of Trust in Stability of Economic Environment in Kazakhstan. Entrep. Sustain. Issues 2017, 5, 105–115. [Google Scholar] [CrossRef]
- Doing Business. 2019. Available online: https://www.doingbusiness.org/en/reports/global-reports/doing-business-2019 (accessed on 15 January 2020).
- Introna, V. Comparative Analysis of Maturity Models. In Project Management Maturity (Maturità Nella Gestione Progetti); PMI: Newtown Square, PA, USA, 2009; pp. 163–173. [Google Scholar]
- Official Site. President of the Republic of Kazakhstan. Available online: http://www.akorda.kz/en/addresses/addresses_of_president/state-of-the-nation-address-by-the-president-of-the-republic-of-kazakhstan-nursultan-nazarbayev-january-10–2018 (accessed on 16 January 2020).


| № | Costs | Manufacturing Sector | Services Sector |
|---|---|---|---|
| 1 | Raw materials | 48 | 33 |
| 2 | Salary of production workers | 31 | 23 |
| 3 | Salary of auxiliary workers | 18 | 16 |
| 4 | Depreciation | 37 | 20 |
| 5 | Auxiliary materials | 22 | 14 |
| 6 | Social package for workers | 15 | 11 |
| 7 | Fuel | 50 | 27 |
| 8 | Transportation | 38 | 22 |
| 9 | Electricity | 39 | 35 |
| 10 | Heating | 26 | 34 |
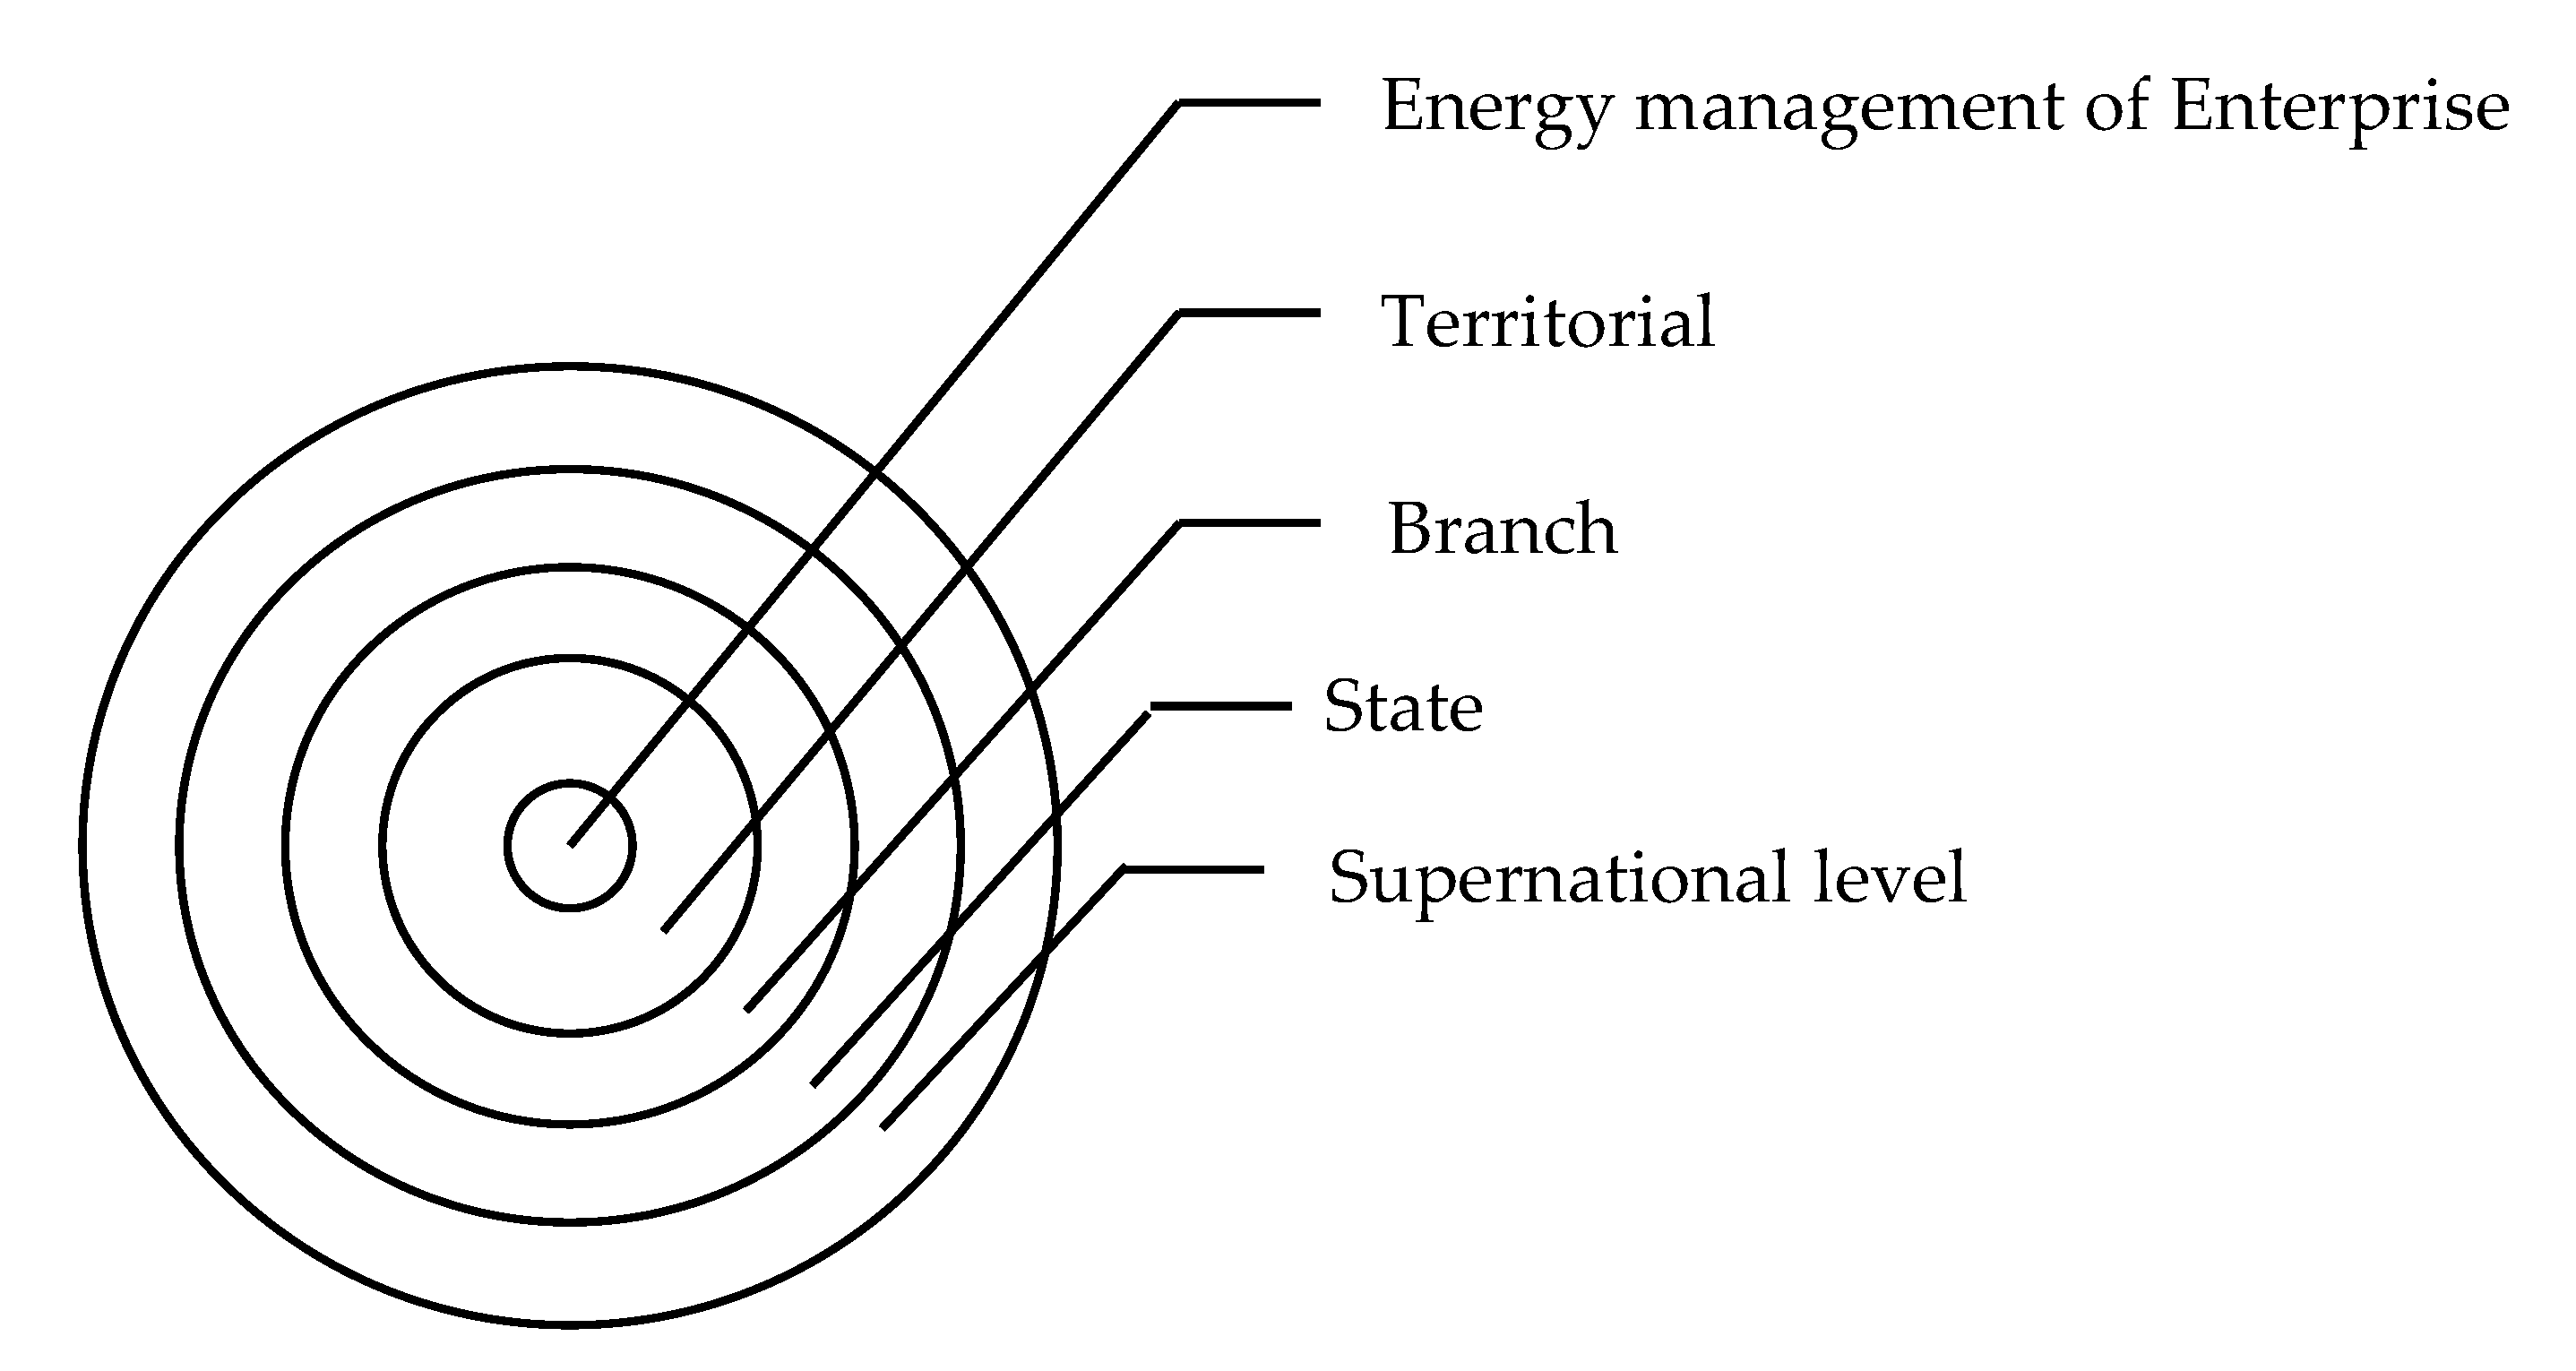
| Levels | Factors and Instruments of Influence |
|---|---|
| Supranational | Dominant and innovative technologies, global market conditions, international agreements (quotas, norms, sanctions, etc.) |
| State | Laws, standards, tariffs, energy and environmental policies, social programs |
| Branch | The existing infrastructure, industry-specific management models, internal cooperation. |
| Territorial | Territorial infrastructure, resource availability, local statutory regulation |
| Enterprise | Production technology, control system |
| Regions | Akmola region | Aktubinsk region | Almata region | Atyrau region | West-Kazakhstan region | Zhambyl region | Karagnda region | Kostanay region |
|---|---|---|---|---|---|---|---|---|
| Portion | 5.7 | 6.5 | 5.6 | 9.7 | 7.5 | 2.5 | 10.1 | 7.7 |
| Regions | Kyzylorda region | Mangistau region | South-Kazakhstan region | Pavlodar region | North-Kazakhstan region | East-Kazakhstan region | Astana city | Almaty city |
| Portion | 9.1 | 8.7 | 8.0 | 15.9 | 4.6 | 5.7 | 5.1 | 2.8 |
| Electricity Costs | Agro-Processing | The Making of Cars | Production of Building Materials | Raw Material Processing | Building | Agricultural Industry (Culture) | Mining Industry | Processing Industry | Consumer Goods Production | Other Type of Activities |
|---|---|---|---|---|---|---|---|---|---|---|
| Portion of cost summary,% | 6.2 | 6.9 | 9.3 | 6.9 | 6.9 | 6.9 | 10.5 | 6.4 | 6.9 | 7.9 |
| Portion of answers affects strongly and more, % | 37 | 72 | 44 | 55 | 41 | 31 | 61 | 31 | 45 | 26 |
| Electricity Costs | Transport, Logistics | IT | Trading | Public Catering | Health Care | Art, Fun, Relaxation | Accommodation and Food Services | Finance | Real Estate Operations | Other Type of Activities |
|---|---|---|---|---|---|---|---|---|---|---|
| Portion of cost summary, % | 5.2 | 13.8 | 9.3 | 5.7 | 6.9 | 7.2 | 6.9 | 6.9 | 6.9 | 6.3 |
| Portion of answers “affects strongly and more”, % | 33 | 14 | 26 | 57 | 36 | 51 | 58 | 24 | 19 | 38 |
| X Portion of Cost Summary, % | Y Portion of Answers “Affects Strongly and More”, % | Rank X, dx | Rank Y, dy |
|---|---|---|---|
| 5.19 | 33 | 1 | 5 |
| 13.78 | 14 | 10 | 1 |
| 9.3 | 26 | 9 | 4 |
| 5.67 | 57 | 2 | 9 |
| 6.94 | 36 | 4 | 6 |
| 7.2 | 51 | 8 | 8 |
| 6.94 | 58 | 4 | 10 |
| 6.94 | 24 | 4 | 3 |
| 6.94 | 19 | 4 | 2 |
| 6.33 | 38 | 3 | 7 |
| Transactional Corruption Costs | Answers “Affects Strnogly”. % | |
|---|---|---|
| Production | Services | |
| Bribery to the officer of state | 13% | 16% |
| Bribery to the bank representative of the second level | 10% | 13% |
| Bribery to the representative of natural monopoly holder (NMH) | 10% | 9% |
| Level | Maturity Measurement | ||||
|---|---|---|---|---|---|
| Awarness, knowledge, skills | Methodological approach | Energy characteristics of leadership | Organizational structure | Strategy and alignment | |
| 5 | Optimized | Optimized and used | Optimized and used | Optimized and used | Optimized and used |
| 4 | High-technology | Energy management system used | Improved, Stable and Used | Improved, Stable and Used | all justification |
| 3 | considerable progress | project-based approach in usage | Standardised and used | project organization | Considerable progress (general progress) |
| 2 | Basic | Random Identification Intervention | Basic | Appointment of a responsible person for the energy sector | Policymaking and Public Information Campaign |
| 1 | Segmental | It does not exist | It does not exist | Scattered (nonexistent) | It does not exist |
© 2020 by the authors. Licensee MDPI, Basel, Switzerland. This article is an open access article distributed under the terms and conditions of the Creative Commons Attribution (CC BY) license (http://creativecommons.org/licenses/by/4.0/).
Share and Cite
Petrenko, Y.; Denisov, I.; Koshebayeva, G.; Biryukov, V. Energy Efficiency of Kazakhstan Enterprises: Unexpected Findings. Energies 2020, 13, 1055. https://doi.org/10.3390/en13051055
Petrenko Y, Denisov I, Koshebayeva G, Biryukov V. Energy Efficiency of Kazakhstan Enterprises: Unexpected Findings. Energies. 2020; 13(5):1055. https://doi.org/10.3390/en13051055
Chicago/Turabian StylePetrenko, Yelena, Igor Denisov, Gaukhar Koshebayeva, and Valeriy Biryukov. 2020. "Energy Efficiency of Kazakhstan Enterprises: Unexpected Findings" Energies 13, no. 5: 1055. https://doi.org/10.3390/en13051055
APA StylePetrenko, Y., Denisov, I., Koshebayeva, G., & Biryukov, V. (2020). Energy Efficiency of Kazakhstan Enterprises: Unexpected Findings. Energies, 13(5), 1055. https://doi.org/10.3390/en13051055