Abstract
The deployment of renewable energy sources (RES) is considered to be an important objective for the energy sector in the European Union (EU). The EU Directive adapted in 2009 fixed mandatory national targets for the use of renewable energy in transport as well as for the share of RES in the gross final energy consumption. Contrary to previous studies, this paper does not examine the link between the RES and economic growth but rather focuses on real gross domestic product (GDP) and the implementation of national renewable energy targets. We employ panel data models for the case of the EU-28 countries covering the period between 2007 and 2017 that yield a low and positive relationship between the impact of GDP per capita and the share of RES in the final consumption. Our results show that there is a significant causality only from real GDP per capita to the share of renewable energy in final consumption, marking the potential of developed countries to consume more RES. We list some groups of countries according to these variables using a cluster analysis approach. Starting from the proposed panel data models, we constructed the scenarios for the 2020 for various shares of RES and different EU Member States. Overall, it appears that more attention should be attributed to policy proposals in which funding opportunities would be dependent on the achievements of national targets and economic benefits should be given to countries with very good performance in achieving high shares of renewable energy in their final energy consumption.
1. Introduction
One important global concern nowadays is related to the adverse effects of the climate change and to the belief that it should be stopped. One of the solutions for this impending problem is the reduction of the emissions of greenhouse gases (GHG) that could be made by replacing the fossil fuels with renewable energy sources (RES) [1]. There are infinite sources of energy on Earth represented by the sun, wind, stream, and sea that could protect the environment and reduce the emissions of GHG. Moreover, prior to the Industrial Revolution, all energy was obtained from renewable sources, which supports the hypothesis that energy is an important input factor for production. However, due to the growing demand for energy in the 21st century, better technology should be used to exploit RES and provide energy at a lower price.
The EU emissions trading system (EU ETS) is an important tool for reducing the level of GHGs and it represents an important part of the EU’s policy for managing climate change. This system is applied in the EU countries, including United Kingdom, but also in Norway, Liechtenstein, and Iceland. It established limits for the emissions from airlines between these countries and from more than 11,000 installations that intensively use energy. Some targets were proposed for 2020 and for 2030. The target for 2020 will be surpassed (emissions in the targeted sectors are by 21% lower than the level in 2005), while the target for 2030 was raised to 43% compared to 2005. The EU ETS rules were revised in 2018 to allow power sector and industry to implement innovation and make investments for low-carbon transition. Moreover, free allocation of allowances continued to ensure competitiveness and to reflect technological progress. The Market Stability Reserve was reinforced and the pace of annual reduction in allowances was fixed at 2.2% starting from 2021.
The concern about a sustainable future and the use of RES is also prevalent in the European Union (EU). Here, renewable energy could be obtained from various sources with each country having a dominant source. For example, one could find wind turbines in Germany, hydro power plants in Austria, nuclear power plants in France, biomass in the Netherlands, wind power in Denmark and in the North Sea [2]. In general, there are two types of renewable energy sources in existence:
- -
- Traditional RES (e.g., hydro energy, or biomass);
- -
- New renewable sources (solar, wind, geothermal energy, etc.) [3]
The energetic potential of the European Union and the consumption of renewable energy considerably affect its economy and, consequently, the standard of living for all its citizens. In addition, the energy strategy developed by the EU focuses on more directions that should be analyzed in the frame of sustainable development:
- -
- securing the energy supply and costs;
- -
- ensuring that energy costs do make Europe less energy dependent;
- -
- protecting the environment and mitigating climate change;
- -
- improving energy networks [4].
RES should be analyzed from a macroeconomic point of view, given the fact that sustainable development is a goal of the EU. In this context, all sectors of the economy should converge to an evolution that supports the pillars of sustainable development (economic development, social development, and environmental protection). At a macroeconomic level, one should focus on the relationship between output and aspects related to RESs that might support economic growth which constitutes a goal for any given economy. Therefore, our research question is related to the role of RESs in supporting economic development. GDP per capita is considered a good proxy for the economic development that also determines the standard of living in any given country. Within this context, the main objective of our paper is to study the share of renewable energy consumption in relation to the GDP per capita in the EU in the period 2007–2017 using a panel data approach that can also capture the differences between the countries in an overall framework.
Apart from the connection between RES and the economy, RES could be linked to the environmental challenges. An important issue is related to RES volatility. This issue is determined by the nature of the RES technologysince RES can only produce electricity when the wind is blowing and the sun is shining. According to Sinn, the best strategy to buffer the RES volatility supposes demand management, pumped storage, and structures that retain traditional plants and grid expansions [5]. Pumped storage plants ensure a better energy management. Big storage needs are required by the volatility of power consumption. Nuclear power plants and lignite plants might also be used to address volatility.
An important advantage of the renewable energy is related to the reduction of harmful emissions. This type of energy has the capacity to decrease the greenhouse gas (GHG) emissions. However, a more stable legal framework and supportive financing conditions should be ensured [6].
A European Directive adapted in 2009 prescribes the implementation of the National Action Plans for renewable energy (National Renewable Energy Action Plans-NREAPs) that was submitted by all the EU Member States to the European Commission (EC) [7]. The Directive provides details about the policy of regional planning, facilitating and equal access to electricity, nature and environment protection, requiring a fast adaptation to the new energy sources. Each EU country established own targets to introduce legislation for achieving the required goals. All EU Member States must customize the existing regulations of established goals [8].
The European Central Bank (ECB) supports investment in renewable energy projects, while commercial banks finance mature technologies that present less risk (e.g., wind farms). The EU funds are also allocated to the research and development of the new technologies and test of the energy potential of these technologies, innovation in technological processes, smart grids, and pilot plants [9].
Article 194 of the EU Treaty makes RES development and promotion the key objectives for the EU energy sector. Moreover, Directive 2009/28/EC fixes mandatory national targets for the RES shares in transport and in the gross final energy consumption [10]. These mandatory national targets correspond with the EU’s objective of reaching the 20% of RES in the gross final energy consumption by 2020 and at least 10% of transport fuel production covered by the renewable sources.
The development and promotion of energy savings and energy efficiency should be achieved in cooperation with the EU Member States and third countries (Directive 2009/28/EC). A progress report with information on the promotion and utilization of RES should be delivered by each EU country once every two years [11]. By 2030, the share of RES in the gross final energy consumption should increase to a minimum of 27% as the 2030 Climate and Energy Policy Framework stated. In the Energy Union strategy, renewable energies contribute to the decarbonisation of the energy system. The EU Cohesion Policy (2014–2020) makes investments of EUR 29 billion in sustainable energy which include renewable energy, energy efficiency, smart energy infrastructure and innovation as well as the research into low-carbon future [12].
In general, the renewables share in the gross final energy consumption is perceived to be one of the main indicators of the Europe 2020 target. It indicates the degree of the utilization of renewable energy and the extent to which fossil and/or nuclear fuels were substituted by RES on the way to the EU decarbonisation. Several EU Member States already reached this target before 2020 while the others are aiming at achieving it by 2020 [13].
The final energy consumption in the EU Member States relies upon such factors as economic development, structure of energy system, and the availability of RES. Eurostat [14] defines energy consumption in a number of ways at the national levels.
The gross final energy consumption is defined as the energy used by the end consumers plus the self-consumption of power plants and grid losses. The Renewable Energy Directive (2009/28/EC) estimates the gross final energy consumption as a sum of energy commodities intended for energy purposes and aimed at the final consumers (transport, services, industry, households, agriculture, and fisheries and forestry), consumption of heat and electricity by the heat and electricity production sectors, as well as losses of heat and electricity during the distribution and transmission [15].
Gross inland consumption represents the amount of energy required for covering the inland consumption of a given region. Gross inland consumption consists of primary product receipts, indigenous production, direct use from imports, stock changes. However, exports and international marine bunkers are not included. Gross inland energy consumption describes the overall energy demand of a region or a country. It represents the volume of energy for satisfying inland consumption of the analysed region. Gross inland energy consumption includes the final energy consumption by the end users, consumption by the energy sector, transformation and distribution losses, and the statistical differences [16].
Most of the previous papers covering the research on this topic address the energy consumption in relation to the other macroeconomic indicators. However, the analysis of the share of RES and their consumption in final consumption of energy was not carried out a lot before. This indicator (which is defined by Eurostat) is computed at the final gross energy consumption, including the final energy consumption. Our analysis provides some new insights since it offers the empirical evidence on the share of renewable energy consumption in relation to the GDP per capita. To be best of our knowledge, the majority of the previous studies connected the indicator only to the economic growth and neglected the connection between the share of renewable energy consumption and the GDP per capita.
From a certain economic point of view, the differences in RES supply are explained by the regional gaps in costs. For example, wind is cheaper on coastal regions and in the Northern Europe, while PV has comparative advantage in the South. Regions with more forests can provide cheap biomass. Regions with mountains and lots of moving water ensure cheaper hydro. Without omitting these regional gaps, our paper does not focus on regional gaps since official regional data are not available for assessing economic costs. We focus on the relationship between the real gross domestic product (GDP) per capita and the share of renewable energy in final energy consumption because these data at national levels are available.
Our paper is organized as follows: Section 2 provides details on theoretical background with references from the research literature, while the methodology and the empirical model are presented briefly in Section 3. In Section 4, we report the results of the empirical model estimations. Section 5 provides some relevant comments and insights on the obtained results. Finally, in the last section (Section 6), we present conclusions, implications, and highlight pathways for further research.
2. Literature Review
In sum, final energy consumption from all available resources consists of RES, as well as oil products, gas, solid fuels, nuclear heat, electrical energy, and waste. It embraces the total energy consumption in the transport, industry, and other energy sectors [17]. Final energy consumption from RES includes solar energy (photovoltaic, thermal, and concentrate), wind energy, hydroelectric power, geothermal energy, tidal power, biofuels, as well as the renewable part of waste.
EU Member States closely watch the final energy consumption from all traditional and renewable sources in order to assess the 40% GHG emission reduction by 2030 target [18]. This commitment makes the EU states to introduce different measures aimed at encouraging the deployment of RES.
With regard to the above, Sadorsky described two empirical models for assessing the relationship between the consumption of renewable energy and income in the emerging economies [19]. He detected a cointegration relationship and demonstrated that the real per capita income growth yielded a positive and significant relationship with the per capita renewable energy consumption. He confirmed that if the real income per capita rises by 1% in the long run, the renewable energy per capita consumption in the emerging economies also rises by 3.5%.
There is a plethora of studies [20,21,22,23,24,25,26,27,28] that focus upon the relationship between renewable energy consumption and different macroeconomic variables applying various perspectives and methodologies. More studies investigated the connection between RES and economic growth mainly attributed to the GDP. The majority of these papers revealed a long-run relationship between economic growth and the volumes of used RESs. Few publications showed the significant role of RES to economic growth or attempted to determine the variables that stimulate the others. In most of the cases, GDP acts like dependent variable, while RES consumption, labor force gross and fixed capital formation (GFCF) are the most frequent predictors (see Svenfelt et al. [29], Aslan [30], Sasana and Ghozali [31] or Destek and Aslan [32]).
Some of the papers mentioned above came up with a renewable energy sustainability index which was computed for the EU-15 countries with various levels of the final energy consumption and economic development [20]. Another interesting study focused on studying the per capita energy in the case of 19 Eurozone countries [21]. Moreover, there are many studies explaining the relationship between the energy consumption and a number of macroeconomic indicators, such as the economic growth (in the case of EU-28 countries [22], new EU member states [23], Gulf Cooperation Council (GCC) countries [24], 42 developing countries [25], leading countries with the highest shares of RES in the entire world [26], a sample of the 15 ex-Communist countries [27], nine South and Southeast Asian countries [28], China [33], Algeria [34]), capital and labour (new EU member states [35]), technological innovation (China [36]), urbanization (China [37]), carbon dioxide emissions and financial development (Gulf Cooperation Council (GCC) countries [38]), residential sector [39]). Liddle and Lung [40] identified few groups of countries according to energy consumption and GDP using data for countries with different degree of development. In a previous study, a comparison between all EU countries according to their share of energy from renewable sources in gross final consumption was made using different mathematical models [8]. The countries’ performance appears to be different: Finland and Sweden reached their target for the gross final energy consumption, while in the same time Denmark, Austria, and Latvia reached the 2020 target for the share of energy obtained from RES in their gross final consumption. Some EU countries have minimum changes to achieve the 2020 targets (Netherlands, Luxembourg, France, Belgium, UK). Other studies provided forecasts on energy consumption considering based on the relationship with economic growth, import, export, financial development, and capital in Japan [41], or China [37].
The different effects of renewable and non-renewable energy consumption are considered in the case of OECD countries [42], some OIC countries [43], and China [44]. The benefits of renewable energy technologies are mostly analysed for emerging countries [23].
We used GDP per capita as a proxy for economic development while other studies employed other variables: economic growth [22,23,24,25] and GDP [19]. We employ the share of renewable energy consumption in final energy consumption, while other studies proposed other proxies for the renewable energy consumption: gross final energy consumption [8], renewable energy consumption [19], per capita renewable energy consumption [20], or the and renewable energy sustainability index [21].
Considering the EU Commission’s commitment to increase the share of RES consumption in the final energy consumption, the objective of our paper is to analyse the evolution of the share of final energy consumption from RES in the connection with the GDP per capita used as a measure of living standard and income in the EU between 2007 and 2017. Even though the advantages of RES for the environmental protection and reduction of GHG emissions are quite obvious, our research investigates the impact of GDP per capita (as the independent variable) on the share of renewable energy consumption in the final energy consumption (dependent variable). We achieve this by carrying out the empirical research in two main directions: i) the explanation of the share of the renewable energy consumption in the final energy consumption based on the GDP per capita using panel data models and checking Granger causality on the stationary panel data, and ii) the study of the groups of the EU countries according to their share of the renewable energy consumption in the final energy consumption using the cluster analysis.
3. Methodology and Empirical Model
As described above, in this paper we focus on the share of RES in the final consumption relative to the real GDP per capita in all EU-28 countries. Our empirical approach is based on two main methods: (i) different panel data models that contain a study of the causality in the panel, and (ii) cluster analysis aimed at unveiling the groups of countries grouped by their shares of renewable energy in the final consumption and their levels of economic development expressed by the GDP per capita.
In order to achieve that we employ some traditional panel data models: fixed-effects model, random-effects model, and the model based on generalized estimating equation (with the latter being used to describe the structure of the within-panel correlation). The last model corresponds with a population-averaged (or marginal) model from the panel-data literature.
The fixed-effects model can be presented in the following general form:
where Y is the dependent variable, X—exogenous variables, i—index for country, t—index for year, νit—idiosyncratic error, and μi—the error term for cross-sections
Yit = α + X1it·β1 + … + XKit·βK + μi + νit
Here, the fixed-effect model makes the following assumptions:
- -
- unobservable individual effects are seen as the fixed parameters;
- -
- the exogenous variables are uncorrelated with idiosyncratic error , but correlated with fixed individual effects;
- -
- independent and identically distributed idiosyncratic errors vit(iid(0, σ2v)).
In addition, the random-effects model has the following assumptions:
- -
- unobservable individual effects are seen as random variables;
- -
- the exogenous variables are uncorrelated with idiosyncratic error or with individual effects;
- -
- independent and identically distributed idiosyncratic errors vit (iid(0, σ2v)).
For one explanatory variable, the model can be presented as follows:
Yit = α + Xit·β + μi + vit
We compute the mean time as the following:
average(Yi.) = α + average(Xi)·β + μi + average(vi)
With the difference between the two equations above calculated as follows:
Yit − average(Yi.) = (Xit − average(Xi))·β+(vit −average(vi.))
It becomes apparent that this internal transformation is required for computing the fixed-effect estimator. We apply the least squares method in the model (4) to determine the estimators for β with fixed effects. In addition, we check the Granger causality in panel data starting from the following regression:
Yit = αi + ∑Yi(t-k)·βik + ∑Xi(t-k)γik + εit
It is established that the data series for the two variables for which the causality is checked have to be stationary. The coefficients have to vary across countries (in this case, t is the index for time, i is the index for countries) however otherwise remain constant over time. The lag order is K and it does not change remaining the same for all the countries in the balanced panel. We employ the Granger causality test for identifying the significant effects of the previous values of one variable on the actual values of the second variable. The null hypothesis can be represented as follows:
where N represents the number of cross-sections (in this case, countries)
H0: γi1 = γi2 = … = γiK = 0 i = 1,2,…,N;
We employ the cluster analysis for classifying the groups of countries by the GDP per capita and their shares of RES in their final consumption. In order to do so, we apply a non-hierarchical classification with K-mean clusters. The k-average method starts with the k values that are used to form the groups. The distance to the cluster is determined based on the Ward method that can be explained as follows:
- -
- for each variable, the sum of the squares for deviations of each country in the cluster from average is calculated, in order to minimize the square of error squares (for example, to minimize the loss of information);
- -
- at any step, the pair of countries that could be joined in a particular cluster is analysed and the pair are unified as to have minimum loss of information.
We do not possess a strong statistical criterion in order to compute the number of clusters that should be considered with a certain probability. Thence, we select the optimal number of clusters based on the aspects such as: results of variance analysis, theoretical motivation, previous utilisation of non-hierarchical methods, and graphical representation of the countries. The k-means methods are carried out following the four consecutive steps:
- (1)
- k initial classes are considered (there is one class for each country);
- (2)
- a country is relocated in that cluster for which the average is the closest;
- (3)
- the average is recomputed for the two clusters in which that country was;
- (4)
- the previous two steps are redo until changes are made.
4. Model Estimations and Results
Our approach uses the share of renewable energy in the final consumption (%) as dependent variable and GDP per capita (constant 2010 US dollars) as independent variable. The data on these variables was collected for the sample of the EU-28 countries covering the period 2007–2017. The RES share of renewable energy in final consumption data was obtained from Statista, while the data on GDP per capita values was collected from the World Bank.
All EU countries registered a tendency for the growth in the GDP per capita in the period 2007–2017. However, Greece faced some difficulties in 2016 when GDP per capita decreased by 2.47% compared to previous year, but the increase was resumed in 2017 when GDP per capita grew by 2.03% compared to 2016. The austerity measures brought Greece into one of the deepest economic depression in its entire modern history. The hard austerity is also supported by the improvement in primary fiscal balance by more than 14% of GDP in the period 2009–2017 despite the economic recession. The Greek economy returned to its growth only in 2017. As expected, Luxembourg registered the highest value for GDP per capita in 2015. This country has the most competitive economy in the world due to diversified industrialization and intensive export.
Our two main objectives were reached by using the following empirical analysis:
- -
- Investigating the relationship between the share of renewable energy in final consumption (dependent variable) and the GDP per capita (explanatory variable) using panel data models and the Granger causality;
- -
- Classifying groups of the EU-28 countries according to their share of renewable energy in final consumption and GDP per capita in 2007–2017.
In the beginning, the panel data were checked for stationarity and the Levin-Lin-Chu showed stationary data for both variables at 10% level of significance. Then, we constructed more panel data models in order to explain the RES shares in the EU-28 final consumption during 2007–2017, as we can see in Table 1. Random-effects and fixed-effects models, as well as generalized linear model were applied. All the models confirmed that an increase in the GDP per capita by one unit determined an increase in the RES share in the final consumption by almost 0.0005 percentage points. To put it differently, an increase in the GDP per capita by 10,000 constant 2010 US dollars is necessary to increase the share of renewable energy in the final consumption by 5 percentage points. This result showed that some other factors have to influence the growth of the share of renewable energy in the final consumption maintaining the concern for the growing GDP per capita. These factors might be represented by: progress in the transport sector, market conditions (costs, resource availability, diversity etc.), policy decisions, including the financial support to make renewable energy cost-competitive. We introduced covariates like degree of urbanization and environmental taxes as a share of GDP as covariates in the model, but these variables did not have a significant impact on the dependent variable (the share of renewable energy in final consumption).

Table 1.
Panel data models to explain the share of renewable energy in final consumption in the EU-28 countries (2007–2017).
Nevertheless, the Granger causality test on stationary panel data showed that the real GDP per capita was an actual cause for changes in the share of renewable energy in final consumption. Moreover, the increase of RES in the electricity did not cause an increase in the living standard in the EU-28 countries (with a GDP per capita used as a proxy). The Granger causality test is run on stationary data sets at 5% level of significance and the results are presented in Table 2. If p-value is lower than 0.05, the null hypothesis is rejected. In this case, the p-values are higher than 0.05 and the null hypothesis is not rejected in both cases.
Table 2.
Granger causality test to check the relationship between the share of renewable energy in final consumption in the EU-28 countries and GDP per capita (2007–2017).
It becomes apparent from Figure 1 that Sweden remains the country with the highest share of RES in the final consumption in 2007 and 2017. It is followed by Latvia in 2007 and Finland in 2017. Malta had the lowest share of renewable energy in electricity in 2007 (0.2%), followed by the UK with a share of 1.5% in 2007. However, after 10 years, all the countries improved their share of RES in the final energy consumption.
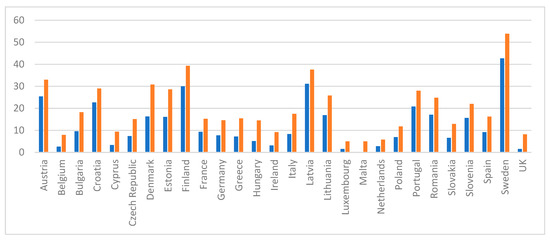
Figure 1.
Share of renewable energy in final consumption in 2007 and 2017 in the EU-28 countries (blue-2007, orange-2017). Source: Own results.
More groups of countries were identified according to share of renewable energy in the final consumption and GDP per capita (Table 3 and Table 4) in 2007 and 2017.
Table 3.
Countries clusters according to the share of RES in the final consumption in the EU-28 in 2007 (k-means method).
Table 4.
Clusters of countries according to the share of renewable energy in the final consumption in the EU-28 in 2017 (k-means method).
According to Table 3, two groups of countries were identified based on the values of the share of renewable energy in the final consumption in the EU-28 in 2007 (the k-means method was used to build the groups). The first group includes countries with high shares of renewable energy in the final consumption: Austria, Croatia, Portugal, Latvia, Finland, and Sweden. For these countries, the share is more than 20%, the highest share being registered by Sweden (42.7%) [45].
More than 50% of the energy used in Sweden is based on the renewable energy sources. In 2012, this country achieved the target of 50% that was established by the government for 2020. Sweden is the country that succeeded in combining high energy consumption with low carbon emissions. This performance is due to the rich supply of moving water and biomass. The most used renewable sources in Sweden are water, mostly for electricity production, and bioenergy mostly for heating. Austria is the first European country in hydropower utilization, offering a dynamic business environment to innovative firms. Bioenergy is the most important renewable energy source in Austria [46]. Sweden promoted renewable electricity by applying a subsidy scheme, quota system, and specific tax regulation mechanisms. Renewable heating is stimulated in Sweden by the tax exemptions. The same incentives are used in transport sector for promoting the use of biofuels. In Sweden, electricity generation systems have to be connected to the grid. Companies in the field are obliged to connect a heating plant. In case of lack of any agreement, the operator of district heating network has to ensure usual grid access to this heat generation plant. In the domain of wind energy, Sweden promotes policies for the construction, installation and utilization of RES installations.
Biofuel (wood) appears to be the most crucial individual energy source in Finland. The expansion of this source might be due to the waste wood from the forest industry and burning of its by-products. In the total energy consumption, the wind power has a low share in Finland, lower than biofuels in road transport [47]. Quota system is also applied in Finland in transport sector. Cost effective development of RES in Finland is promoted by tender based premium scheme. Moreover, state subsidies are offered to enhance the investment in RES. “Heat bonus” is provided for CHP plants based on wood fuel and biogas. Policies were developed to support the acquisition and utilization of RES installations.
In Portugal, renewable source that produced more electricity is represented by wind, being followed by water, sun and biofuels [48]. The consumption of electricity based on hydropower is conditioned by weather conditions. A feed-in tariff (FiT) is used in Portugal to promote electricity from renewable sources from plants. Tax exemption applies to small producers of biofuels and quota system is used for biofuels. What concerns the access of electricity from RES to grid shall, priority is given to this type of electricity to the detriment of traditional one, excepting hydro plants having a capacity higher than 30 MW.
Croatia stipulated that the share of renewables in gross final consumption of energy would reach 20% by 2020, but this target was already surpassed before 2020. In Croatia, wind and solar PV energy developed faster than hydropower and solar thermal [49]. A guaranteed feed-in tariff and a premium tariff are used in Croatia to promote electricity from RES. Special provisions are assigned to electricity from wind power plant. RES installers benefited from a training program to promote electricity and heating based on RES.
Latvia has hydropower and biomass as its most frequently used renewable energy sources. However, wind power and solar energy should be developed more in the future. A complex support system is applied in Latvia to promote electricity based on RES. This system includes quota system, feed-in tariff, and tenders. However, high suspicions of corruption eliminated the feed-in tariff since January 2020. Two policies were implemented to support the installation and utilization of RES installations. Different tax benefits are assigned to cooling and heating based on RES. Companies are obliged to sell diesel and oil mixed with biofuels.
In 2017, Finland does not appear anymore in the group of countries with the high share of renewable energy in the final energy consumption. However, considerable progress was made by Denmark, Romania and Lithuania. Denmark is among the countries of the world with the highest consumption of energy coming from wind power, while hydropower still needs exploitation in this country [50].
The natural potential of Romania in producing and consuming energy based on renewable sources is justified by its geographic location and climate. The sources are represented by the biomass resources that account the highest share in renewable energy consumption, wind and solar PV power plants, wind with opportunity to build offshore wind farms, and the solar potential [51]. Romania uses quota system to promote electricity from RES. The financial support for the new installations in this field ceased at the end of 2016 because of significant financial losses registered by producers. Emergency ordinances were emitted to eliminate legal uncertainties and to promote transparency of the support scheme based on Green Certificate. Other policies promote RES-H infrastructure development and training programs for RES installers.
Starting from the proposed panel data, some scenarios were made for the share of renewables in gross final consumption of energy in 2020. The final scenario is an average of the scenarios corresponding to the three panel data models. For providing the forecasts for the share of renewable energy in the final consumption, we used predictions for GDP per capita for 2020 made by Trading Economics (see Table 5).
Table 5.
Scenarios for the share of renewable energy in final consumption (%) in the EU-28 in 2020.
As we initially expected, many countries are going to have difficulties in achieving the required EU targets. An increase in the share of renewable energy in final consumption is expected in 2020 compared to 2017, but other measures are necessary to accelerate the growth. Countries that have already achieved the targets will continue to yield increase, but low performers need to revise the measures to achieve the national targets.
5. Discussion of Results
RES play a strategic role in the European sustainable agenda. This paper comes up with the quantitative analysis that might be useful for the decision-makers. Usually, the performance of RES is evaluated by benefits related to the environment protection and less to the GHG emissions. However, these effects should also be analysed by the means of real GDP per capita. The validity of our results is confirmed using the historical data as well as some advanced statistical methods. Our work stresses the importance of using larger amounts of RES for improving the living standards [52,53,54,55,56,57].
The EU countries were divided into two groups with respect to their share of renewable energy in the final energy consumption. This research indicates that two urgent measures should be taken. One measure might be a policy action to support the expansion of RES in the countries with the lower shares of renewable energy in the final energy consumption. The second measure should emphasize that RES and energy efficiency determine the evolution to a low-carbon society. The levels of energy based on RES should be in accordance with the citizens’ and firms’ needs from the economic point of view, without neglecting the environmental effects.
One important strategy for the EU is to lower the final energy consumption. This represents an objective that might be reached by improving the energy efficiency and increasing the share of RES in final energy consumption. If the final energy consumption is reduced, the other goals are achieved: progress in sustainable development, more environment protection, less global warming, and the decrease in the dependence on energy imports.
Our main outcome is that EU’s energy consumption based on RES has been continually and significantly growing. This represents the fact that made us to accept the decrease in the traditional energy consumption, which might arrive below the established target in 2020. Even if the EU countries increased their share of the renewable energy consumption in their final energy consumption, there would be different patterns for various European countries.
Therefore, every EU country established its own 2020 target which was based on specific characteristics, economic performance, and the potential for the use of renewable sources in consumption [56,57,58]. As a result, starting from 2007, the share of energy from RES in the final energy consumption has been rising for all EU Member States. It becomes obvious that many EU states have to increase their share of RES in order to achieve their national energy consumption targets in order to comply with the EU strategy. Some changes in the national renewable energy action plans and policies are needed without neglecting the essential support from the EU. If this is not done, the gaps between the EU countries might intensify and only some countries would continue to increase their shares of RES in their final energy consumption. It is apparent that the immediate consequences are related to the distortion and fragmentation of the national energy market which might results in the higher costs and lower usage of RES in the EU as a whole [59].
Considering the actual energy market architecture, some authors explain that the renewable energy will be less scalable and more expensive in the future [60,61,62,63,64,65]. The established goal (100% transition to renewable electricity sector) will not be achieved. An increase in the market share of renewable energy required a successful co-existence between the fossil fuels and the renewable energy [66].
6. Conclusions and Implications
All in all, it can be established that starting from 2010, the increase in the renewable energy consumption has become quite significant. This was the time when massive investments into the development of RES were made in the EU Member States after the EU Directive that was accepted just a year earlier. Even if all the EU Member States are following the upward trend, reaching the 2020 target is not certain because since 2015 the investment in RES production has halted. Countries like Spain and Belgium focused more on RES for generating their electricity with the rest of the energy consumption based on traditional carbon fuels. Poland made important progress in the consumption of RES but needs to develop the production from RES further to achieve the 2020 target. For Austria, Finland, Denmark, and Sweden RES occupy an important place in their energy mix. All these countries have climatic conditions and lack of fossil fuel resources that impose on the society and industry the pressing need to minimize the energy consumption. New EU commitments were established in the Directive (EU) 2018/844/ for 2030: GHGs reduction by at least 40% compared to the values registered in 1990, improvement in EU competitiveness, energy security and sustainability, more energy savings, and the increase in the share of RES consumption. Within this context, consistent efforts should be made by all EU countries. In the United Kingdom, significant efforts were made to increase the production of RES, especially by expending the technologies for solar power, but in spite of this the EU target seems to be far away. The uncertainties generated by the Brexit detracted the interest for the renewable growth among Brits. The political rhetoric and practical decision-making focused more on the issue of coal. Germany is a country that made formidable development in the consumption of fossil and nuclear fuels, but even there problems prevail. However, the urgency of phasing out coal in Germany has been ignored for many years. Oei et al. (2020) showed that in 2007, Integrated Energy and Climate Programme (Integrierte Energie-und Klimaprogramm) became the main reference in climate policy in Germany. It fixed as target the reduction of emissions by 40% in 2020 [67]. Moreover, it should be mentioned that France and Italy experience serious issues with achieving the EU 2020 RES targets. The Netherlands also report some problems due to the fact that its final energy consumption is largely based on a natural gas network with the gas being cheap at the moment. Furthermore, government RES subsidies are not attractive and are lower in comparison with the Scandinavian countries. On the other side of the EU, Portugal pumped funding into RES, but the costs were high and prevented a high increase in the share of energy from the renewable sources from one year to another. Czech Republic, Hungary, and Romania all boast high shares of RES and even increased their efforts to meet the EU targets after their EU accession in 2004.
Nevertheless, there are also some EU countries in which the RES 2020 target in gross final consumption was exceeded: Czech Republic since 2013, Sweden and Bulgaria since 2012, Hungary and Estonia since 2011, and Romania, Lithuania, Italy, and Finland since 2014. One important objective of this paper was the study of the relationship between the share of the renewable energy in the final energy consumption and real GDP per capita. Many previous studies only considered the relationship between economic growth and (RES) energy consumption. We selected the GDP per capita instead of economic growth because we consider the GDP per capita to be an indicator that better describes the long-run development. The economic growth presents high fluctuations, especially in the times of the economic crisis but the standard of living of population is more stable without high fluctuations from one year to another. Moreover, this indicator is followed not only by all citizens, but also by the governments and the firms. One important result following from our study is that the real GDP per capita was a real cause for the growth in the share of the renewable energy in the final energy consumption. This means that countries with high GDP per capita will have a higher share of renewable energy in the final consumption. All the panel data models indicated a positive but also small impact of GDP per capita on the share of renewable energy in the final consumption. If wealthier countries used more RES in proportion to their total energy consumption, their energy security would be improved and the sustainable development would be consolidated. This involves the access to more sustainable, reliable and modern energy. The sustainability of a country has been a priority in line with the goal to reduce the dependency on the non-renewable sources of energy.
The results of this research confirmed that higher standard of living in a country could enhance the energy consumption based on RES. However, other latent factors could contribute to the intensive utilization of RES in energy production and consumption. Some of these factors related to social and fiscal aspects, like urbanization and environmental taxes, were not relevant in explaining energy consumption based on RES. Other factors did not have quantitative measures that could be introduced in the econometric models, but they had a strong impact on RESs. One relevant example could be the specific policies in the field that were applied in each EU country. Appropriate policies to promote RES were described for the countries with the high share of renewable energy in the final energy consumption. For example, quota system is intensively applied in Sweden, Finland, Latvia, Romania and in Portugal only for biofuels. A feed-in tariff was implemented in Portugal, Croatia and Latvia. In all these countries investments were made to promote the acquisition and utilization of RES installations. Sweden obtained the best performance, because more types of incentives were applied. Some of these incentives refer to all RESs (subsidy scheme, quota system, and specific tax regulation mechanisms) while other ones focus on specific RESs (tax exemptions for renewable heating and biofuels production). However, improvements should also be brought to these policies in order to achieve the new targets for 2030.
It appears that a considerable increase in the GDP per capita is required in order to increase the share of RES in the final energy consumption. The scenarios for 2020 revealed notorious difficulties represented by the low performances in achieving a significant increase of RES in the final consumption and the expectations are confirmed, since some EU countries are not capable to achieve the EU required targets set up for 2020.
The pathways for the future research might continue in two main directions: First of all, there might arise some policy proposals for establishing funding opportunities for the EU countries according to the progress in achieving the national targets. Secondly, setting a rule is necessary for directing more economic benefits to those countries with high performance in achieving the RES target share in the final energy consumption. Following the first proposal, we should focus more on the economic, social, environmental, political, and technological factors regarding string and weak points and the capacity for using more RES. Following the second proposal, we should analyse more the situation of the states with the best performance. All in all, it is necessary to evaluate the effect of more factors on RES development: internal energy production, technological development, investment in research and development, foreign dependence, community policies, subsidy policy, industrial know-how, as well as citizens’ openness to doing business and protecting environment [64,65,66,67,68,69,70,71,72,73,74,75,76,77,78,79,80].
Author Contributions
Conceptualization, M.S., W.S. and M.T.; methodology, M.S. and M.T.; formal analysis, M.S. and W.S.; resources, M.S. and M.T.; data curation, M.S. and W.S.; writing—original draft preparation: M.S., W.S. and M.T.; project administration, M.S.; funding acquisition, M.T. and W.S. All authors have read and agreed to the published version of the manuscript.
Funding
The research was partly supported by European Union’s Horizon 2020 project H2020-MSCA-RISE-2014 CLUSDEVMED Grant Agreement Number 645730730.
Conflicts of Interest
The authors declare no conflict of interest.
References
- Pfenninger, S.; Keirstead, J. Renewables, nuclear, or fossil fuels? Scenarios for Great Britain’s power system considering costs, emissions and energy security. Appl. Energy 2015, 152, 83–93. [Google Scholar] [CrossRef]
- Wu, Q.; Zhou, J.; Liu, S.; Yang, X.; Ren, H. Multi-objective Optimization of Integrated Renewable Energy System Considering Economics and CO2 Emissions. Energy Procedia 2016, 104, 15–20. [Google Scholar] [CrossRef]
- European Parliament. Renewable Energy Sources. 2016. Available online: http://www.europarl.europa.eu/ftu/pdf/lv/FTU_5.7.4.pdf (accessed on 3 December 2018).
- Šahović, N.; da Silva, P.P. Community Renewable Energy-Research Perspectives. Energy Procedia 2016, 106, 46–58. [Google Scholar] [CrossRef]
- Sinn, H.W. Buffering volatility: A study on the limits of Germany’s energy revolution. Eur. Econ. Rev. 2017, 99, 130–150. [Google Scholar] [CrossRef]
- Cucchiella, F.; Adamo, I.; Gastaldi, M. Biomethane: A renewable resource as vehicle fuel. Resources 2017, 6, 58. [Google Scholar] [CrossRef]
- Sari, A.; Akkaya, M. Contribution of renewable energy potential to sustainable employment. Procedia Soc. Behav. Sci. 2016, 229, 316–325. [Google Scholar] [CrossRef][Green Version]
- Cucchiella, F.; D’Adamo, I.; Gastaldi, M.; Miliacca, M. Efficiency and allocation of emission allowances and energy consumption over more sustainable European economies. J. Clean. Prod. 2018, 182, 805–817. [Google Scholar] [CrossRef]
- Frankfurt School UNEP Centre; Bloomberg New Energy Finance (BNEF). Global Trends in Renewable Energy Investment. Frankfurt School-UNEP Centre, 2016. Available online: http://fs-unep-centre.org/sites/default/files/attachments/press_release_gtr_2016_in_english.pdf (accessed on 27 October 2019).
- Blazejczak, J.; Braun, F.G.; Edler, D.; Schill, W.P. Economic effects of renewable energy expansion: A model-based analysis for germany. Renew. Sustain. Energy Rev. 2014, 40, 1070–1080. [Google Scholar] [CrossRef]
- IEA. Energy and Climate Change, World Energy Outlook Special Report. Available online: https://www.iea.org/publications/freepublications/publication/WEO2015SpecialReportonEnergyandClimateChange.pdf (accessed on 7 November 2019).
- Thellufsen, J.Z.; Lund, H. Cross-border versus cross-sector interconnectivity in renewable energy systems. Energy 2017, 124, 492–501. [Google Scholar] [CrossRef]
- Ruggiero, S.; Lehkonen, H. Renewable energy growth and the financial performance of electric utilities: A panel data study. J. Clean. Product. 2017, 142, 3676–3688. [Google Scholar] [CrossRef]
- Eurostat Statistics Explained. Available online: http://ec.europa.eu/eurostat/statistics-explained/index.php/Glossary:Gross_inland_energy_consumption (accessed on 16 November 2018).
- EUR-Lex. Directive 2009/28/EC of the European Parliament and of the Council of 23 April 2009 on the Promotion of the Use of Energy from Renewable Sources and Amending and Subsequently Repealing Directives 2001/77/EC and 2003/30/EC. Available online: http://eur-lex.europa.eu/legal-content/EN/TXT/PDF/?uri=CELEX:32009L0028&from=RO (accessed on 30 September 2018).
- Soava, G.; Mehedintu, A.; Sterpu, M.; Raduteanu, M. Impact of renewable energy consumption on economic growth: Evidence from European Union countries. Technol. Econ. Dev. Econ. 2018, 24, 1197–1215. [Google Scholar] [CrossRef]
- Engelken, M.; Römer, B.; Drescher, M.; Welpe, I.M.; Picot, A. Comparing drivers, barriers, and opportunities of business models for renewable energies: A review. Renew. Sustain. Energy Rev. 2016, 60, 795–809. [Google Scholar] [CrossRef]
- Council of the European Union. Tackling Climate Change, the 2030 Climate and Energy Framework, Brussels. Available online: http://data.consilium.europa.eu/doc/document/ST-169-2014-INIT/en/pdf (accessed on 22 September 2018).
- Sadorsky, P. Renewable energy consumption and income in emerging economies. Energy Policy 2009, 37, 4021–4028. [Google Scholar] [CrossRef]
- Collins, S.; Deane, J.P.; Ó Gallachóir, B. Adding value to EU energy policy analysis using a multi-model approach with an EU-28 electricity dispatch model. Energy 2017, 130, 433–447. [Google Scholar] [CrossRef]
- European Commission. A Policy Framework for Climate and Energy in the Period from 2020 to 2030; European Commission: Juba, South Sudan, 2014; Eurostat. Statistics Database; Available online: Http://ec.Europa.Eu/eurostat/data/database (accessed on 22 October 2018).
- García-Álvarez, M.T.; Moreno, B.; Soares, I. Analyzing the environmental and resource pressures from european energy activity: A comparative study of EU member states. Energy 2016, 115, 1375–1384. [Google Scholar] [CrossRef]
- Cucchiella, F.; D’Adamo, I.; Gastaldi, M.; Koh, S.C.L.; Rosa, P. A comparison of environmental and energetic performance of european countries: A sustainability index. Renew. Sustain. Energy Rev. 2017, 78, 401–413. [Google Scholar] [CrossRef]
- Štreimikienė, D.; Balezentis, T. Kaya identity for analysis of the main drivers of ghg emissions and feasibility to implement eu “20–20–20” targets in the Baltic States. Renew. Sustain. Energy Rev. 2016, 58, 1108–1113. [Google Scholar] [CrossRef]
- Armeanu, D.; Vintilă, G.; Gherghina, Ş. Does renewable energy drive sustainable economic growth? Multivariate panel data evidence for EU-28 countries. Energies 2017, 10, 381. [Google Scholar] [CrossRef]
- Liobikienė, G.; Butkus, M. The European Union possibilities to achieve targets of Europe 2020 and Paris agreement climate policy. Renew. Energy 2017, 106, 298–309. [Google Scholar] [CrossRef]
- D’Adamo, I.; Rosa, P. Current state of renewable energies performances in the European Union: A new reference framework. Energy Convers. Manag. 2016, 121, 84–92. [Google Scholar] [CrossRef]
- Capros, P.; Paroussos, L.; Fragkos, P.; Tsani, S.; Boitier, B.; Wagner, F.; Busch, S.; Resch, G.; Blesl, M.; Bollen, J. Description of models and scenarios used to assess European decarbonisation pathways. Energy Strategy Rev. 2014, 2, 220–230. [Google Scholar] [CrossRef]
- Svenfelt, Å.; Engström, R.; Svane, Ö. Decreasing energy use in buildings by 50% by 2050—A backcasting study using stakeholder groups. Technol. Forecast. Soc. Chang. 2011, 78, 785–796. [Google Scholar] [CrossRef]
- Aslan, A. The causal relationship between biomass energy use and economic growth in the United States. Renew. Sustain. Energy Rev. 2016, 57, 362–366. [Google Scholar] [CrossRef]
- Destek, M.A.; Aslan, A. Renewable and non-renewable energy consumption and economic growth in emerging economies: Evidence from bootstrap panel causality. Renew. Energy 2017, 111, 757–763. [Google Scholar] [CrossRef]
- Sasana, H.; Ghozali, I. The impact of fossil and renewable energy consumption on the economic growth in Brazil, Russia, India, China and South Africa. Int. J. Energy Econ. Policy 2017, 7, 194–200. [Google Scholar] [CrossRef]
- Resch, G.; Gephart, M.; Steinhilber, S.; Klessmann, C.; del Rio, P.; Ragwitz, M. Coordination or harmonisation? Feasible pathways for a European res strategy beyond 2020. Energy Environ. 2013, 24, 147–170. [Google Scholar] [CrossRef]
- Klessmann, C.; Rathmann, M.; de Jager, D.; Gazzo, A.; Resch, G.; Busch, S.; Ragwitz, M. Policy options for reducing the costs of reaching the European renewables target. Renew. Energy 2013, 57, 390–403. [Google Scholar] [CrossRef]
- Markaki, M.; Belegri-Roboli, A.; Sarafidis, Y.; Mirasgedis, S. The carbon footprint of Greek households (1995–2012). Energy Policy 2017, 100, 206–215. [Google Scholar] [CrossRef]
- Eurostat. Energy from Renewable Sources (Summary-Results-Shares-2014). Available online: http://ec.Europa.Eu/eurostat/web/energy/data/shares (accessed on 5 February 2020).
- Rezitis, A.N.; Ahammad, S.M. The relationship between energy consumption and economic growth in South and Southeast Asian countries: A panel vector autoregression approach and causality analysis. Int. J. Energy Econ. Policy 2015, 5, 704–715. [Google Scholar] [CrossRef]
- Fumon, N.; Biswas, M.A.R. Regression analysis for prediction of residential energy consumption. Renew. Sustain. Energy Rev. 2015, 47, 332–343. [Google Scholar] [CrossRef]
- Salim, R.A.; Shafiei, S. Urbanization and renewable and non-renewable energy consumption in OECD countries: An empirical analysis. Econ. Model. 2014, 38, 581–591. [Google Scholar] [CrossRef]
- Anwar, A.; Arshed, N.; Kousar, N. Renewable Energy Consumption and Economic Growth in Member of OIC Countries. Eur. Online J. Nat. Soc. Sci. 2017, 6, 111–129. [Google Scholar] [CrossRef]
- Liu, Y. Exploring the relationship between urbanization and energy consumption in China using ARDL (autoregressive distributed lag) and FDM (factor decomposition model). Energy 2009, 34, 1846–1854. [Google Scholar] [CrossRef]
- Tzeng, G.H.; Shiau, T.A.; Lin, C.Y. Application of multicriteria decision making to the evaluation of new energy system development in Taiwan. Energy 1992, 17, 983–992. [Google Scholar] [CrossRef]
- Pappas, S.S.; Ekonomou, L.; Karamousantas, D.C.; Chatzarakis, G.; Katsikas, S.; Liatsis, P. Electricity demand loads modeling using AutoRegressive Moving Average (ARMA) models. Energy 2008, 33, 1353–1360. [Google Scholar] [CrossRef]
- Ozturk, S.; Ozturk, F. Forecasting Energy Consumption of Turkey by Arima Model. J. Asian Sci. Res. 2018, 8, 52–60. [Google Scholar] [CrossRef]
- Barak, S.; Sadegh, S. Forecasting energy consumption using ensemble ARIMA–ANFIS hybrid algorithm. Electr. Power Energy Syst. 2016, 82, 92–104. [Google Scholar] [CrossRef]
- Official Statistics of Finland (OSF): Energy supply and consumption [e-publication]. ISSN=1799-7976. 4th quarter 2017. Helsinki: Statistics Finland. Available online: http://www.stat.fi/til/ehk/2017/04/ehk_2017_04_2018-03-28_tie_001_en.html (accessed on 10 December 2018).
- APREN. Renewable Electricity in Portugal. 2017. Available online: https://apren.pt/.../06-renewable-electricity-in-portugal-2.pdf (accessed on 10 December 2018).
- Borozan, D. Exploring the relationship between energy consumption and GDP: Evidence from Croatia. Energy Policy 2013, 59, 373–381. [Google Scholar] [CrossRef]
- Lund, H. Renewable energy strategies for sustainable development. Energy 2007, 32, 912–919. [Google Scholar] [CrossRef]
- Câmpeanu, V.; Pencea, S. Renewable energy sources in Romania: From a “paradise” of investors to a possible abandon or to another boom? The impact of a new paradigm in Romanian renewable sources policy. Procedia Econ. Financ. 2014, 8, 129–137. [Google Scholar] [CrossRef][Green Version]
- Yuan, C.; Liu, S.; Fang, Z. Comparison of China’s primary energy consumption forecasting by using ARIMA (the autoregressive integrated moving average) model and GM(1,1) model. Energy 2016, 100, 384–390. [Google Scholar] [CrossRef]
- Tsai, S.B.; Xue, Y.; Zang, J.; Chen, Q.; Liu, Y.; Zhou, J.; Dong, W. Models for forecasting growth trends in renewable energy. Renew. Sustain. Energy Rev. 2017, 77, 1169–1178. [Google Scholar] [CrossRef]
- Würzburg, K.; Labandeira, X.; Linares, P. Renewable generation and electricity prices: Taking stock and new evidence for Germany and Austria. Energy Econ. 2013, 40, S159–S171. [Google Scholar] [CrossRef]
- Rubins, M.; Pilvere, I. Development of renewable energy policy in Latvia. Econ. Sci. for Rural Dev. Conf. Proc. 2017, 44, 281–291. [Google Scholar]
- Blecich, P.; Petrić, M.; Franković, B. Renewable energy in Croatia: A review of present state and future development. In Proceedings of the 11th ISES Eurosun Conference, Palma, Spain, 11–14 October 2016. [Google Scholar]
- McCollum, D.L.; Zhou, W.; Bertram, C.; De Boer, H.S.; Bosetti, V.; Busch, S.; Fricko, O. Energy investment needs for fulfilling the Paris Agreement and achieving the Sustainable Development Goals. Nat. Energy 2018, 3, 589–612. [Google Scholar] [CrossRef]
- Cucchiella, F.; D’Adamo, I.; Gastaldi, M. Future trajectories of renewable energy consumption in the European Union. Resources 2018, 7, 10. [Google Scholar] [CrossRef]
- Wang, D.D.; Sueyoshi, T. Climate change mitigation targets set by global firms: Overview and implications for renewable energy. Renew. Sustain. Energy Rev. 2018, 94, 386–398. [Google Scholar] [CrossRef]
- Proença, S.; Aubyn, M.S. Hybrid modeling to support energy-climate policy: Effects of feed-in tariffs to promote renewable energy in Portugal. Energy Econ. 2013, 38, 176–185. [Google Scholar] [CrossRef]
- Kamran, M. Current status and future success of renewable energy in Pakistan. Renew. Sustain. Energy Rev. 2018, 82, 609–617. [Google Scholar] [CrossRef]
- Stefanelli, R.D.; Walker, C.; Kornelsen, D.; Lewis, D.; Martin, D.H.; Masuda, J.; Castleden, H. Renewable energy and energy autonomy: How Indigenous peoples in Canada are shaping an energy future. Environ. Rev. 2019, 27, 95–105. [Google Scholar] [CrossRef]
- Burke, M.J.; Stephens, J.C. Political power and renewable energy futures: A critical review. Energy Res. Soc. Sci. 2018, 35, 78–93. [Google Scholar] [CrossRef]
- Blazquez, J.; Fuentes-Bracamontes, R.; Bollino, C.A.; Nezamuddin, N. The renewable energy policy Paradox. Renew. Sustain. Energy Rev. 2018, 82, 1–5. [Google Scholar] [CrossRef]
- Lund, H.; Mathiesen, B.V. Energy system analysis of 100% renewable energy systems—The case of Denmark in years 2030 and 2050. Energy 2009, 34, 524–531. [Google Scholar] [CrossRef]
- Chirila, N. Renewable energy in Romania. Flanders Invest. Trade 2013, 3, 1–56. [Google Scholar]
- Shah, I.H.; Hiles, C.; Morley, B. How do oil prices, macroeconomic factors and policies affect the market for renewable energy? Appl. Energy 2018, 215, 87–97. [Google Scholar] [CrossRef]
- Oei, P.Y.; Hermann, H.; Herpich, P.; Holtemöller, O.; Lünenbürger, B.; Schult, C. Coal phase-out in Germany–Implications and policies for affected regions. Energy 2020, 196, 117004. [Google Scholar] [CrossRef]
- Şener, Ş.E.C.; Sharp, J.L.; Anctil, A. Factors impacting diverging paths of renewable energy: A review. Renew. Sustain. Energy Rev. 2018, 81, 2335–2342. [Google Scholar] [CrossRef]
- Zhao, Z.Y.; Chen, Y.L. Critical factors affecting the development of renewable energy power generation: Evidence from China. J. Clean. Prod. 2018, 184, 466–480. [Google Scholar] [CrossRef]
- Tvaronavičienė, M.; Baublys, J.; Raudeliūnienė, J.; Jatautaitė, D. Chapter 1—Global energy consumption peculiarities and energy sources: Role of renewables. In Energy Transformation towards Sustainability; Tvaronavičienė, M., Ślusarczyk, B., Eds.; Elsevier: Amsterdam, The Netherlands, 2020; pp. 1–49. ISBN 9780128176887. [Google Scholar] [CrossRef]
- Dudin, M.N.; Frolova, E.E.; Protopopova, O.V.; Andrey Alievich Mamedov, A.A.; Odintsov, S.V. Study of innovative technologies in the energy industry: Nontraditional and renewable energy sources. Entrep. Sustain. Issues 2019, 6, 1704–1713. [Google Scholar] [CrossRef]
- Andriushchenko, K.; Buriachenko, A.; Rozhko, O.; Lavruk, O.; Skok, P.; Hlushchenko, Y.; Muzychka, Y.; Slavina, N.; Buchynska, O.; Kondarevych, V. Peculiarities of sustainable development of enterprises in the context of digital transformation. Entrep. Sustain. Issues 2020, 7, 2255–2270. [Google Scholar] [CrossRef]
- Chehabeddine, M.; Tvaronavičienė, M. Securing regional development. Insights Reg. Dev. 2020, 2, 430–442. [Google Scholar] [CrossRef]
- Masood, O.; Tvaronavičienė, M.; Javaria, K. Impact of oil prices on stock return: Evidence from G7 countries. Insights Reg. Dev. 2019, 1, 129–137. [Google Scholar] [CrossRef]
- Sarma, U.; Karnitis, G.; Zuters, J.; Karnitis, E. District heating networks: Enhancement of the efficiency. Insights Reg. Dev. 2019, 1, 200–213. [Google Scholar] [CrossRef]
- El Iysaouy, L.; El Idrissi, N.E.; Tvaronavičienė, M.; Lahbabi, M.; Oumnad, A. Towards energy efficiency: Case of Morocco. Insights Reg. Dev. 2019, 1, 259–271. [Google Scholar] [CrossRef]
- Pechancová, V.; Hrbáčková, L.; Dvorský, J.; Chromjaková, F.; Stojanovic, A. Environmental management systems: An effective tool of corporate sustainability. Entrep. Sustain. Issues 2019, 7, 825–841. [Google Scholar] [CrossRef]
- Tyo, A.; Jazykbayeva, B.; Ten, T.; Kogay, G.; Spanova, B. Development tendencies of heat and energy resources: Evidence of Kazakhstan. Entrep. Sustain. Issues 2019, 7, 1514–1524. [Google Scholar] [CrossRef]
- Rogalev, A.; Komarov, I.; Kindra, V.; Zlyvk, O. Entrepreneurial assessment of sustainable development technologies for power energy sector. Enterp. Sustain. Issues 2018, 6, 429–445. [Google Scholar] [CrossRef]
- Böhringer, C. Two decades of European climate policy: A critical appraisal. Rev. Environ. Econ. Policy 2014, 8, 1–17. [Google Scholar] [CrossRef]

© 2020 by the authors. Licensee MDPI, Basel, Switzerland. This article is an open access article distributed under the terms and conditions of the Creative Commons Attribution (CC BY) license (http://creativecommons.org/licenses/by/4.0/).