Article

Optimal Design and Comparison of High-Frequency Resonant and Non-Resonant Rotary Transformers †

Department of Electrical Engineering, Electromechanics and Power Electronics, Eindhoven University of Technology, 5600 MB Eindhoven, The Netherlands
*
Author to whom correspondence should be addressed.
This paper is an extended version of our paper published in Bastiaens, K.; Krop, D.C.J.; Jumayev, S.; Lomonova, E.A. Design and Comparison of High-Frequency Resonant and Non-Resonant Rotating Transformers. In Proceedings of the 21st International Conference on Electrical Machines and Systems (ICEMS), Jeju, South-Korea, October 2018; pp. 1703–1708.
Energies 2020, 13(4), 929; https://doi.org/10.3390/en13040929
Submission received: 20 January 2020 / Revised: 14 February 2020 / Accepted: 17 February 2020 / Published: 19 February 2020
(This article belongs to the Special Issue Modelling of Wireless Power Transfer)

Abstract

:
This paper concerns the optimal design and comparative analysis of resonant and non-resonant high-frequency GaN-based rotating transformers. A multi-physical design approach is employed, in which magnetic, electrical, and thermal models are coupled. The results are verified by experiments. Two different optimization objectives are considered; firstly, the efficiency of two standard core geometries is maximized for a required output power level. Secondly, a geometrical optimization is performed, such that the core inertia is minimized for the desired output power level. The results of both design optimizations have shown large improvements in terms of output power and core inertia as a result of applying series–series resonant compensation.

1. Introduction

Wireless power transfer (WPT) is widely employed in applications that require reliable power transfer to rotating parts, e.g., in battery charging and robotic applications [1,2], as well as an alternative to slip rings or brushes in electric machines [3,4]. Generally, a cylindrical transformer is used, which has a rotary and stationary side separated by a small air gap in either the radial or axial direction. Figure 1 shows an example of such a cylindrical transformer geometry, specifically a pot core transformer. A high magnetic coupling is achieved by the application of core material that has a high permeability [5]. Furthermore, a high-frequency power supply is typically applied, such that the transfer of power and efficiency are enhanced, whereas the volume of the transformer is reduced [6]. Gallium-Nitride (GaN) transistors have gained popularity in WPT applications, since switching frequencies in the range of several megahertz (MHz) are realized. Moreover, in comparison to conventional Silicon devices, the switching losses are lower, whereas the power density is higher [7]. Additionally, the leakage inductance is often compensated by the application of resonant techniques. Therefore, capacitors are placed parallel to, or in series with, the transformer winding on either or both the primary and secondary side, in doing so enhancing the transfer of power [8]. In low-voltage systems resonant techniques might be undesirable, since high voltages across the capacitors can occur [9].
The optimal design of a high-frequency rotary WPT system can be challenging, since different physical domains (i.e., magnetic, electrical, and thermal) and various design parameters have to be considered. Several design studies and methodologies are available in literature [10,11,12,13,14,15,16]. The design and analysis are often performed for a fixed electrical frequency and core geometry [10,11]. Furthermore, typically either series–series resonant compensation [10,12,13] or non-resonant systems are considered [11,14]. In [10], a WPT system based on a pot core transformer was designed and a prototype was realized, which at an electrical frequency of 50 kHz achieved an output power of 1.3 kW. The multi-physical design approach that was applied in this work, consists of equivalent circuit analysis for the electrical, magnetic, and thermal domains. Series–series resonance was applied in the design approach and prototype. In [11], a comparable WPT system was designed for the same electrical frequency. The design approach consists of an electrical circuit model simulated in commercial software (i.e., MATLAB Simulink), a magnetic equivalent circuit model, and the thermal model applies a Finite Element Method (FEM) model. Resonant techniques were not considered in this work. Alternatively, design studies often consider a limited or low frequency range [12,13,14]. In [12], two different winding topologies for a rotating pot core transformer were compared in terms of core volume and power losses. A design optimization was performed for frequencies in the range of 1 kHz–200 kHz. The multi-physical design approach proposed in this paper is based on equivalent circuit models for the electrical, magnetic, and thermal domain. Experimental results were obtained for both winding configurations. Series–series resonance was applied in the design approach and prototype. In [13], three different winding topologies for a rotating WPT system were proposed and the performance was measured for varying frequencies in the range of 440 kHz–612 kHz. A GaN half-bridge inverter and series–series resonance were applied in the system. A maximum output power of 20 W and an efficiency of 89.7% were realized. In [14], two different non-resonant cylindrical transformer topologies were compared by means of a design optimization. The multi-physical design model is based on equivalent circuit models for both the magnetic and thermal domains, whereas the electrical circuit model is simulated using commercial software (i.e., MATLAB SimPowerSystem Toolbox). Furthermore, design studies often only investigate the behavior of the system in the magnetic and electrical domains [13,15,16]. In [15], a three-phase rotary WPT system was designed by means of a magnetic equivalent circuit model. A similar system was designed in [16], in this work the design was carried out using a FEM magnetic model. However, the optimal design is also influenced by the temperature distribution and the corresponding constraints. Multi-physical design approaches are discussed in literature [10,11,12]. These design methodologies typically apply magnetic equivalent circuit models [10,11,12] and thermal equivalent circuit models [10,12], which are capable of realizing computationally efficient design routines. Equivalent circuit models provide adequate accuracy in most cases, however compared to the most commonly applied numerical method, i.e., the FEM, the accuracy is generally lower [17]. Therefore, research on a full system approach, in which all physical domains are covered (i.e., magnetic, electrical, and thermal) and a wide design space is investigated (i.e., geometrical, frequency, and both series–series and non-resonant circuits) is lacking.
In this paper, a multi-physical design approach for the optimal design of both resonant and non-resonant high-frequency rotary transformers is presented. The design approach couples both a magnetic and thermal FEM model as well as a Spice electrical circuit model. The design approach can be applied to any arbitrary objective function and rotary transformer topology, in this paper the design approach is applied to two different optimization problems. First, the efficiency of two fixed pot core geometries is maximized for a desired output power level of at least 100 W. A frequency range up to and including 1 MHz is considered, by the application of a GaN half-bridge inverter. Second, the core inertia is minimized for the desired output power level. In both cases a comparative analysis of the resonant and non-resonant designs is performed. The optimal design resulting from the first optimization problem is prototyped for the purpose of experimental verification.

2. Materials and Methods

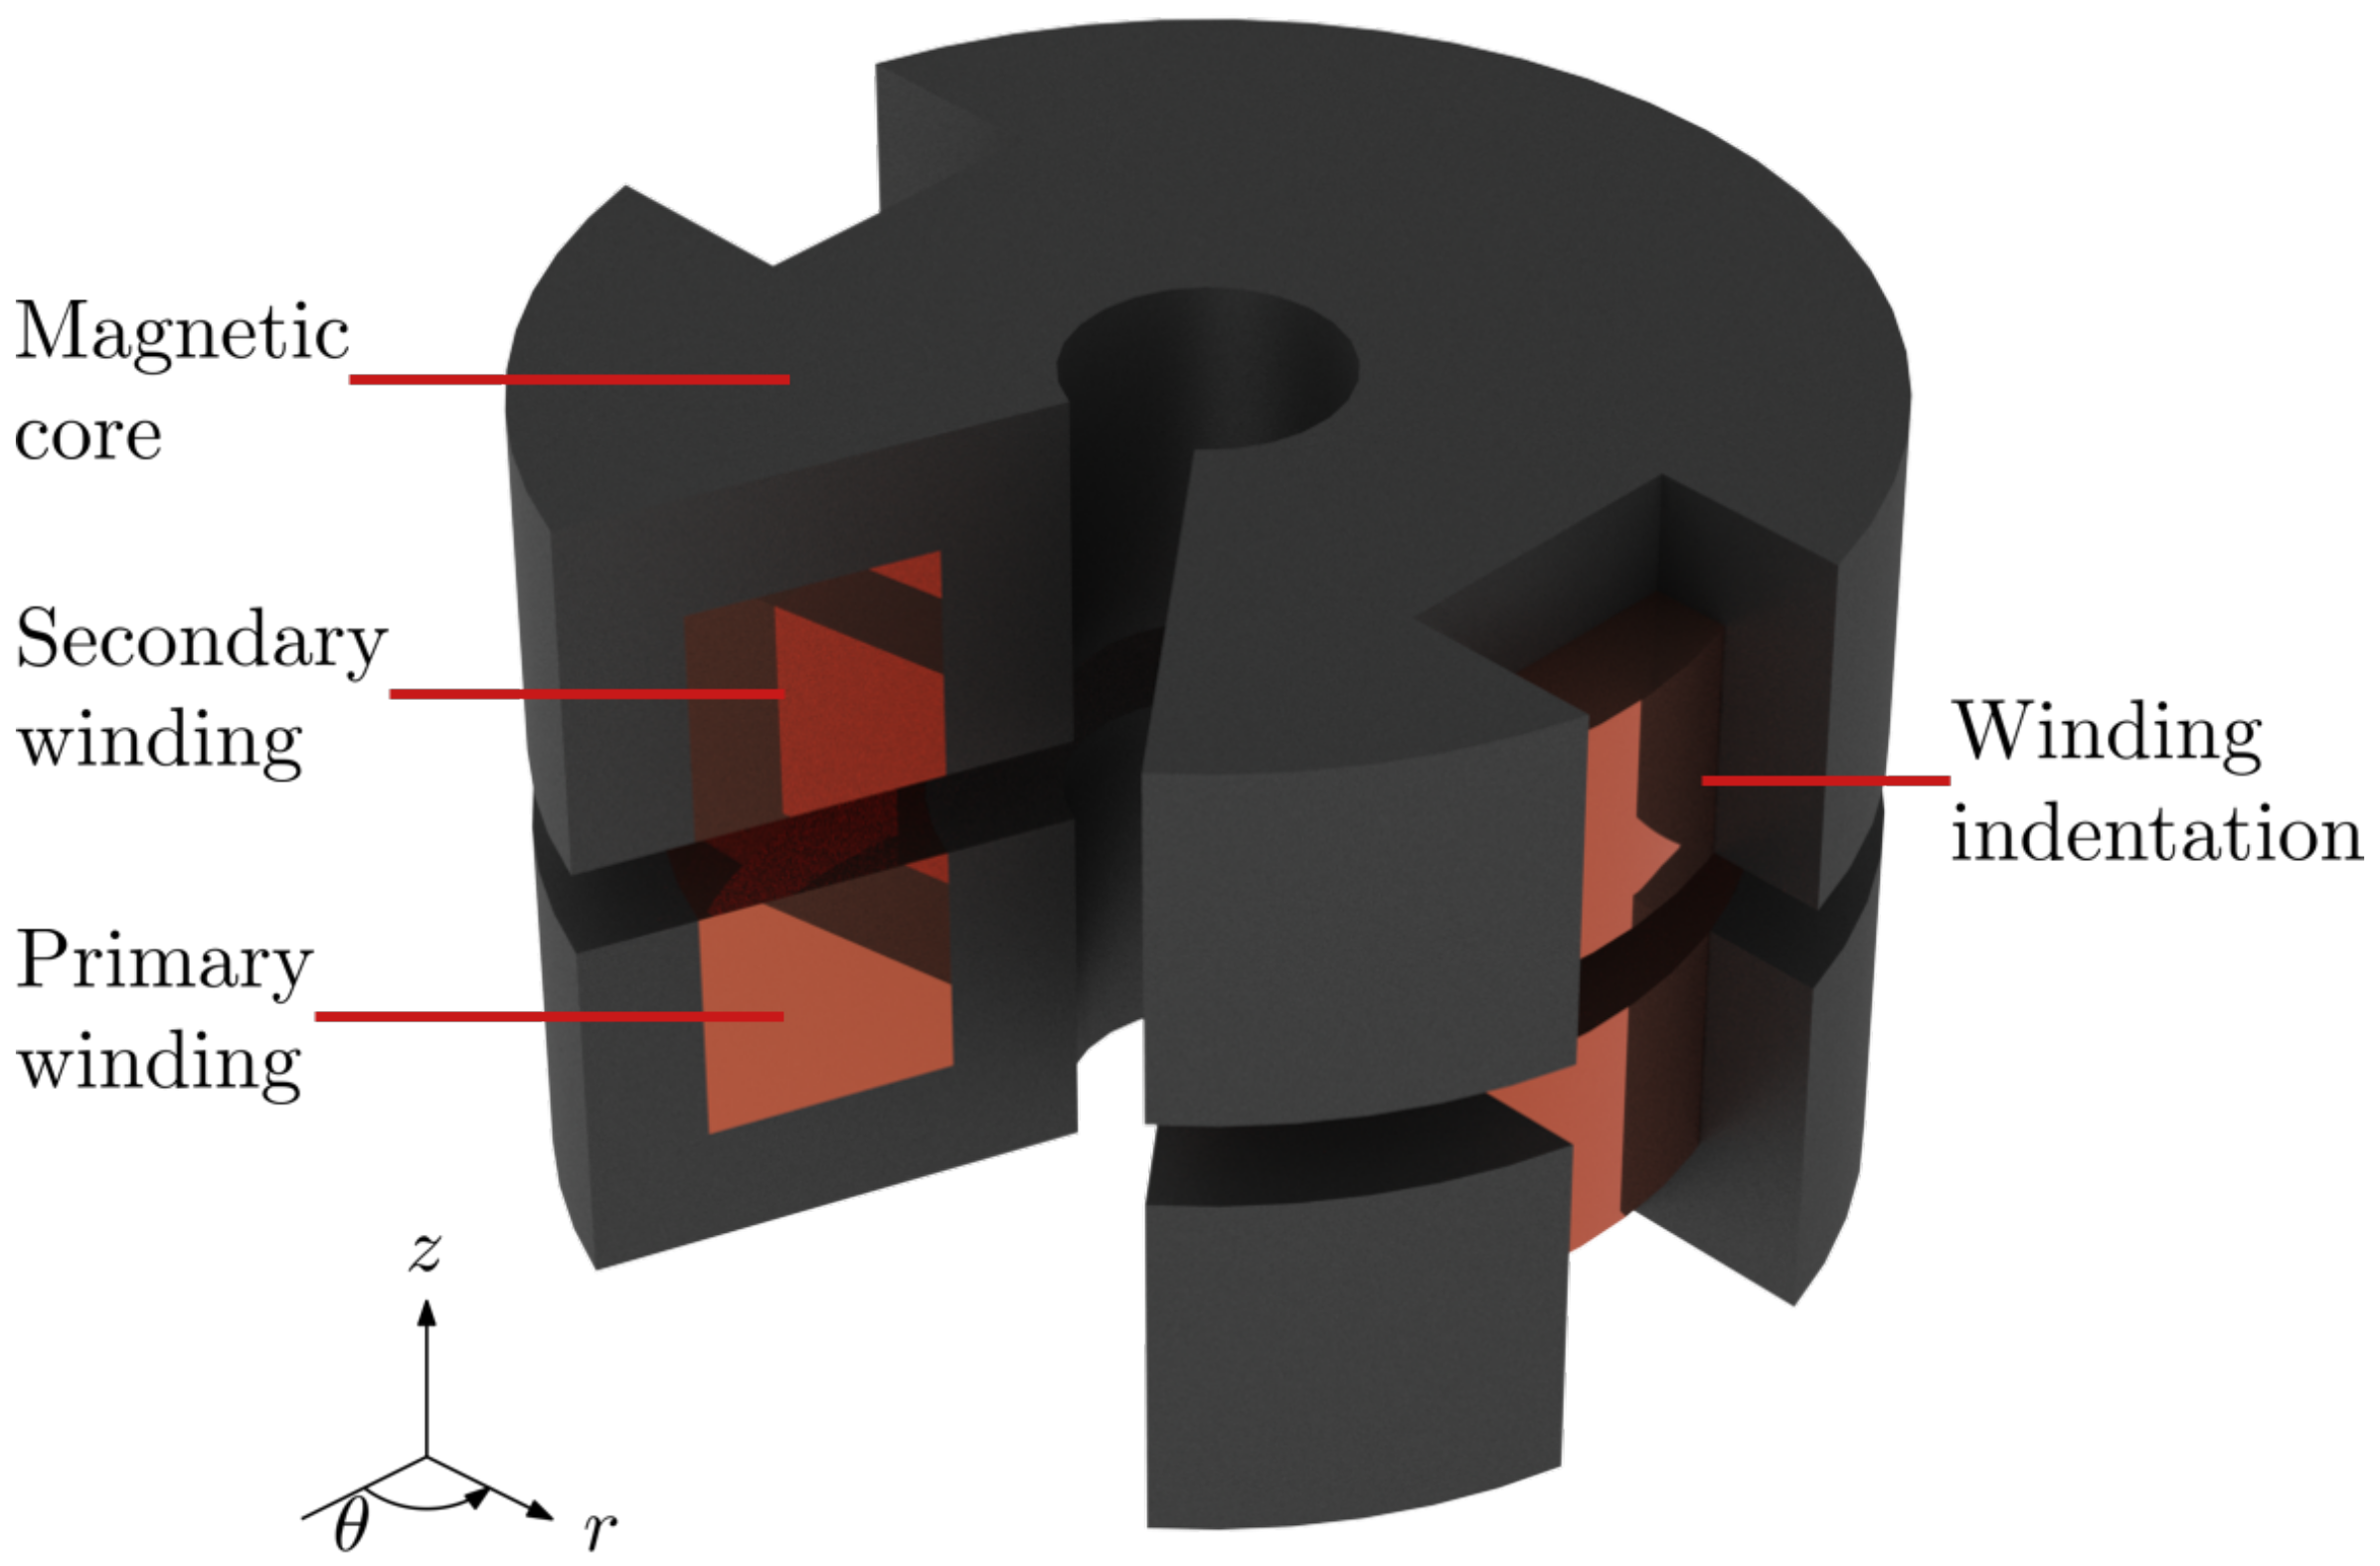
2.1. Wireless Power Transfer System

The high-frequency WPT system under consideration in this paper consists of a 48 V dc supply, a dc/ac half-bridge converter, the WPT coils (each of which is placed inside a magnetic pot core separated by an air gap), and a single-phase rectifier including load. The pot core geometry, as shown in Figure 1, is selected to be the rotating transformer topology under investigation. In the pot core transformer, the power is transferred in the axial direction, thus is referred to as the axially gapped topology. Alternatively, the power can also be transferred in the radial direction, by changing the air gap configuration, i.e., radially gapped topology. However, with respect to the radially gapped topology, the axially gapped topology is favorable in terms of magnetic coupling and losses [14]. Furthermore, each coil is placed in a separate core half, as shown in Figure 1, which is typically referred to as the adjacent coil configuration. Alternatively, the coils can be arranged in the coaxial configuration, in which one coil rotates inside the other. However, the adjacent configuration is favorable in terms of losses [12]. The high-frequency WPT system is designed by the application of coupled magnetic, electrical, and thermal models.

2.2. Magnetic Model

The magnetic model employs a two-dimensional FEM steady state ac model in the axisymmetrical plane, which is solved by commercial software, i.e., Altair Flux [18]. The modeled geometry is shown in Figure 2. The magnetic model is used to calculate the magnetizing and leakage inductances, which serve as inputs to the electrical model. The magnetizing and leakage inductances are calculated as:
L l k p = L p N p N s M ,
L l k s = L s N s N p M ,
L m = N p N s M ,
where L l k is the leakage inductance, L is the self inductance, N is the number of turns, M is the mutual inductance, L m is the magnetizing inductance, and the subscripts p and s are used to indicate the primary and secondary side, respectively. Under the assumption that the transformer is magnetically linear, the self- and mutual inductances are calculated from the apparent inductance according to:
L p = N p ϕ p I p ,
L s = N s ϕ s I s ,
M p s = N s ϕ s I p = M s p = N p ϕ p I s = M ,
where I p and I s are the root-mean-square (rms) values of the primary and secondary current, respectively, ϕ p and ϕ s are the flux in the primary and secondary coil, respectively (obtained from the FEM model), M p s is the mutual inductance between the primary and secondary coil, and M s p is the mutual inductance between the secondary and primary coil. The magnetic coupling coefficient (k) is obtained from the mutual and self inductances according to:
k = M p s L p L s .
The magnetic coupling coefficient represents the degree of magnetic coupling, thus a coefficient equal to one represents perfect coupling (i.e., zero leakage inductance) [19].
Additionally, the magnetic model is employed for the calculation of the iron losses in the transformer core. Therefore, both sides of the core geometry are divided into five regions, as shown in Figure 2. In every region the iron losses ( P F e ) are calculated, which serve as inputs to the thermal model and efficiency calculation. The iron losses are calculated according to Steinmetz’s equation, given by:
P F e = V i C m f α B i β d V i ,
where C m [W·s α /T β /m 3 ], α [-], and β [-] are empirical parameters, which in this case are set to 10.6, 1.3, and 2.7, respectively [20], f is the electrical frequency, B i and V i are the magnetic flux density and volume, respectively of the corresponding region i [21]. Steinmetz’s equation is valid for sinusoidal excitation, which has been assumed in the magnetic model. However, for the non-resonant transformer, the half-bridge converter induces non-sinusoidal currents. Consequently, discrepancies in the iron losses and peak magnetic flux density are introduced. However, as a result of the Joule losses being dominant with respect to the iron losses, the effect of this assumption on the temperature rise and efficiency is negligible.

2.3. Electrical Model
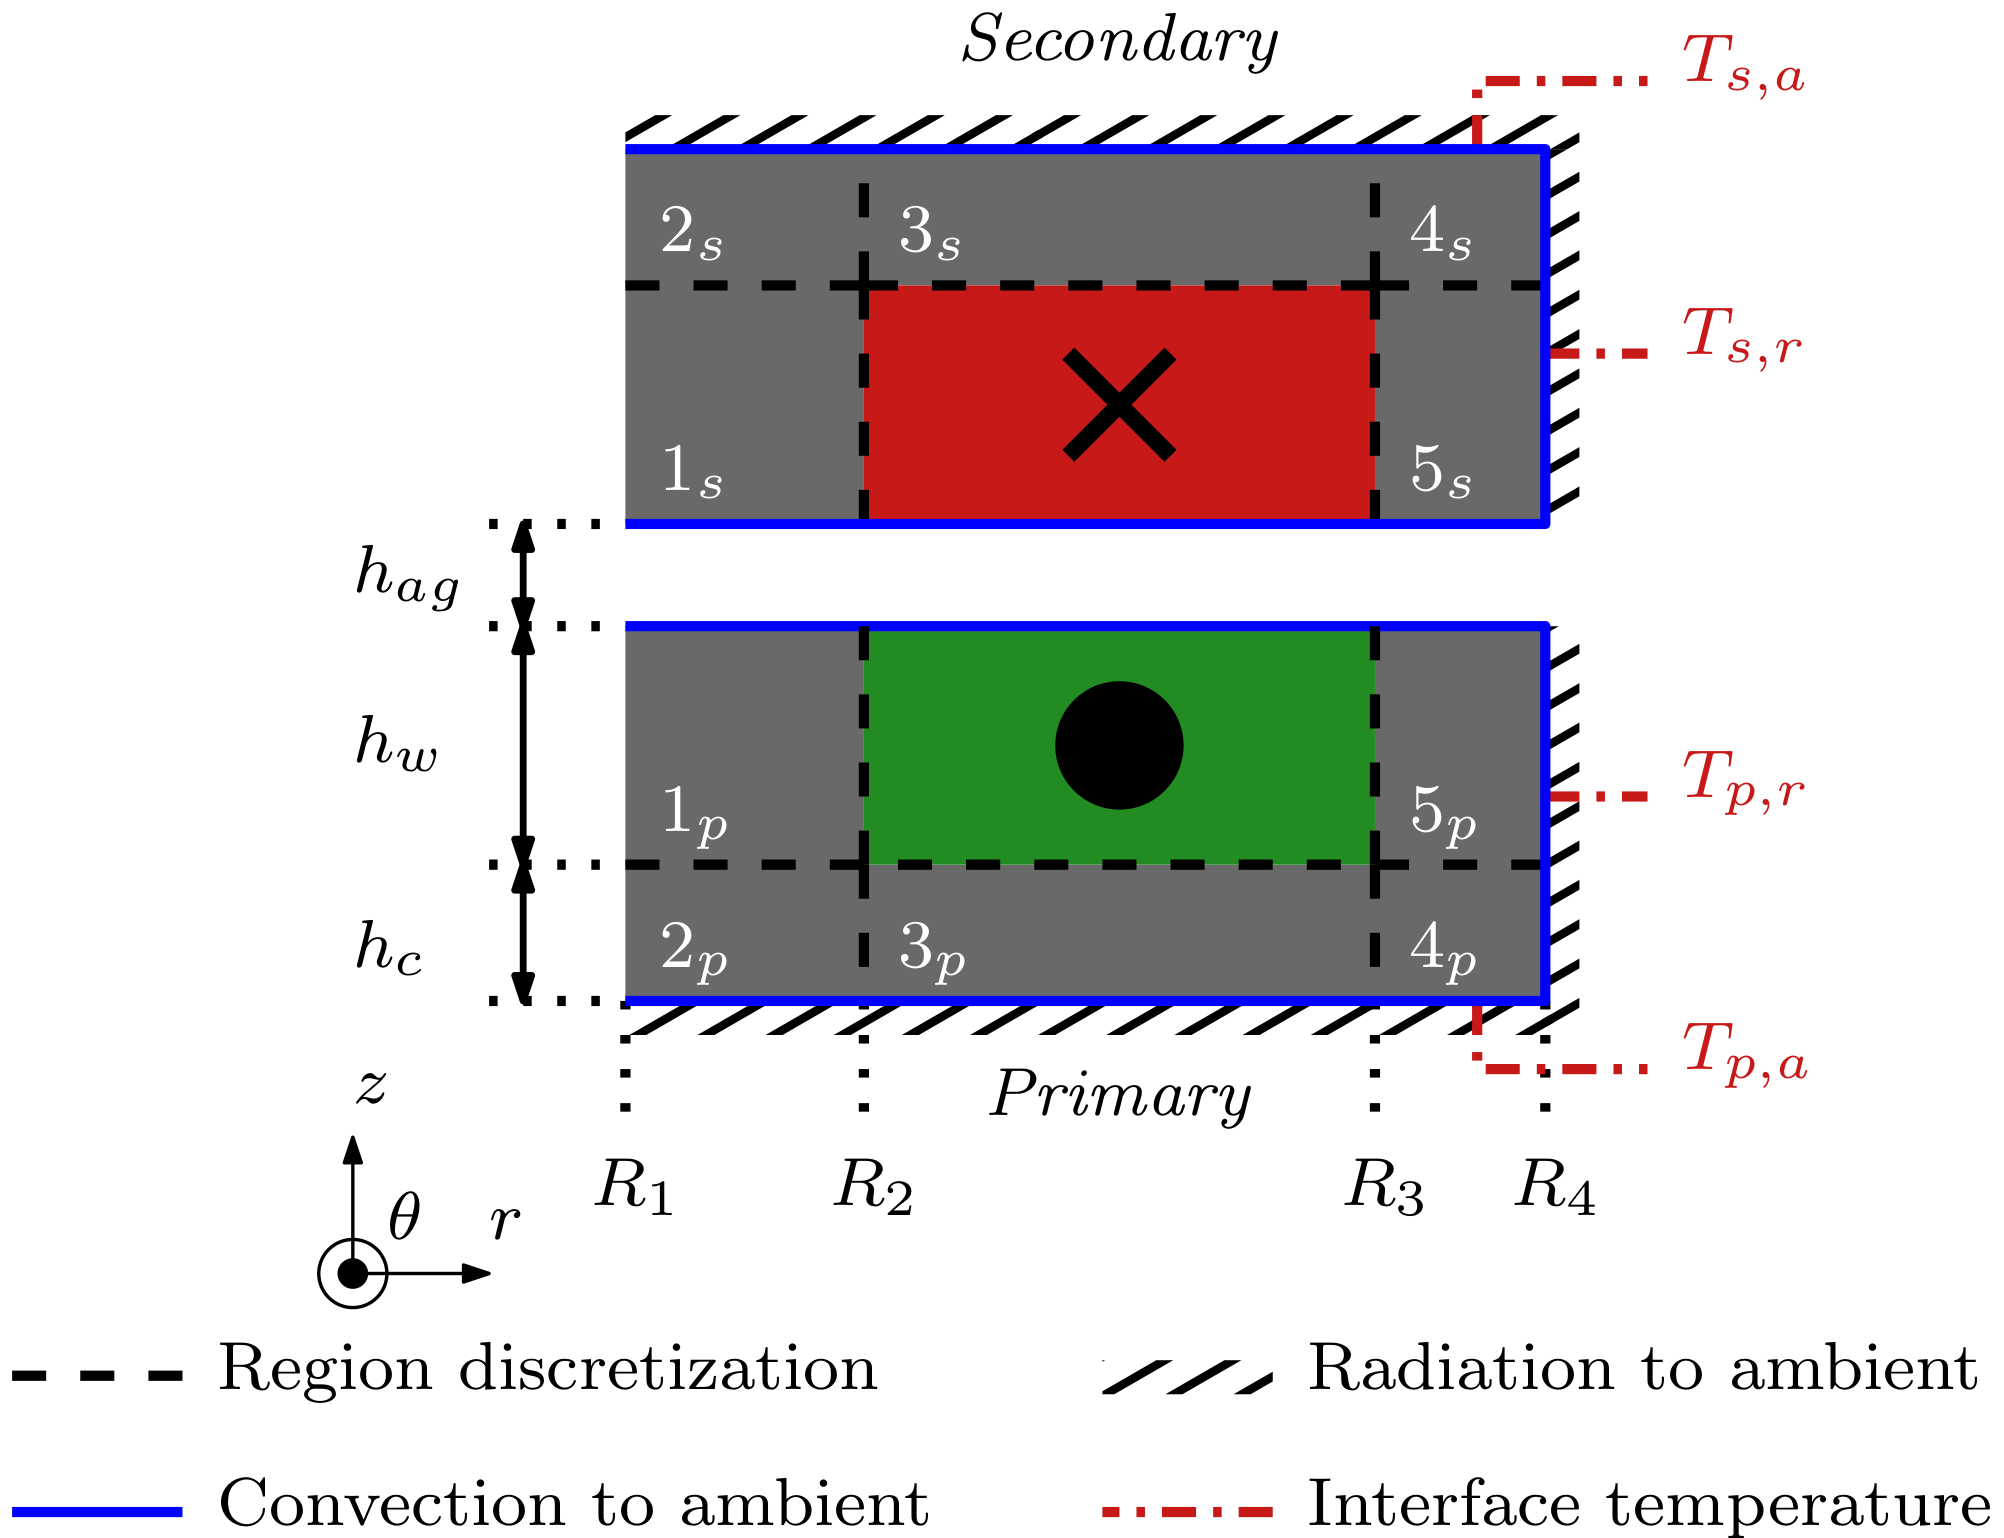
The electrical equivalent circuit model of the WPT system is shown in Figure 3. The circuit model is based on the transformer T-model, which consists of the magnetizing inductance, leakage inductances, and the coil resistances [19]. The contribution of the core losses is included in the efficiency calculation, however the effect of the iron losses is assumed to be negligible in the electrical equivalent circuit model. The components on the secondary side of the circuit, are reflected to the primary side through the winding ratio according to:
Z = Z N p N s 2 ,
where Z is the impedance on the secondary side, and Z is the reflected impedance [19]. Both non-resonant and series–series resonant electrical circuits, which is the most commonly used technique, are considered in the model. The primary and secondary capacitance, which are required to compensate the leakage inductances, are calculated according to:
C p = 1 ( 2 π f ) 2 L l k p ,
C s = 1 ( 2 π f ) 2 L l k s ,
where C p and C s are the primary and secondary capacitances, respectively.
The dc/ac half-bridge converter selected in the circuit model is the EPC9035 development board from Efficient Power Conversion Corporation [22], which employs GaN transistors, such that frequencies up to and including 1 MHz can be investigated. In order to account for the high electrical frequencies, PMEG6030ETP Schottky diodes from Nexperia [23], which have a short reverse recovery time of 12 ns, are used in the single-phase rectifier. Additionally, in order to improve the power dissipation in the single-phase rectifier and reduce the thermal load per diode, two diodes are placed in parallel.
Litz wire is employed in the transformer windings, such that the losses caused by the skin- and proximity-effect are minimized. The additional losses caused by these effects are approximated in the design model by the ac resistance ( R a c ), which is obtained by scaling the dc resistance according to:
R a c = R d c 1 k s 1 + β R 2 192 + β R 2 ,
k s = 1 , if δ r s , r s 2 ( r s 2 δ ) 2 r s 2 , otherwise ,
β R = 2 μ 0 f R d c ,
R d c = ρ l w A w ,
where R d c is the dc resistance of the wire, δ is the skin-depth, r s is the strand radius [24,25,26], ρ is the resistivity of copper, l w is the length of the wire, and A w is the effective copper area of the wire. The parameters of the litz wire, from Pack Litz Wire, considered in the design analysis are shown in Table 1 [27]. In order to minimize the skin-effect losses, the strand diameter of the litz wire is chosen such that it is always smaller than the skin depth. As a result of the litz wire having a relatively small outer diameter, the fill-factor (the ratio between the effective copper area and total available winding area) is maximized by placing wires in parallel. The maximum fill-factor is assumed to be equal to 0.16 and in case wires are placed in parallel, the maximum fill-factor is reduced to 0.13, since the wires are braided in order to minimize the proximity effect losses.
The electrical circuit model is solved using the LT-Spice circuit simulator [28], in which the non-ideal device models of the Schottky diodes and GaN transistors are included [23,29]. Finally, once the model has reached a steady-state, the input power ( P i n ), output power ( P o ), efficiency ( η ), and power losses in the coils ( P c ), switches ( P s w ) and diodes ( P d ) are extracted from the model according to:
P i n = V d c I d c ,
P o = 1 T 0 T v o ( t ) i o ( t ) d t ,
η = P o P i n + P F e × 100 % ,
P c = 1 T 0 T i p ( t ) 2 R p , a c + i s ( t ) 2 R s , a c d t ,
P s w = i = 1 N s w 1 T 0 T v D S , i ( t ) i D , i ( t ) + v G S , i ( t ) i G , i ( t ) d t ,
P d = i = 1 N d 1 T 0 T v d , i ( t ) i d , i ( t ) d t ,
where V d c and I d c are the dc bus voltage and current, respectively, T is the time period, v o ( t ) and i o ( t ) are the output current and voltage, respectively, i p ( t ) and i s ( t ) are the primary and secondary current, respectively, R p , a c and R s , a c are the ac resistances of the primary and secondary coil, respectively, N s w is the number of switches, v D s , i ( t ) and i D , i ( t ) are the drain-to-source voltage and drain current in switch i, respectively, v G S , i ( t ) and i G , i ( t ) are the gate-to-source voltage and gate current, respectively, N d is the number of diodes, v d , i ( t ) and i d , i ( t ) are the voltage and current across diode i. The Joule losses in the coils serve as an input to the thermal model.

2.4. Thermal Model

As a result of the Joule losses in the windings and the iron losses in the core, a temperature rise is generated in the magnetic pot core. In order to approximate this temperature rise, a two-dimensional FEM thermal model is employed. The thermal model includes the heat transfer by means of conduction between the various regions. The heat transfer through convection and radiation to the ambient environment is incorporated on the boundaries of the geometry, where the former is also included in the air gap region. The shaft or mounting point, which is typically present at the inner radial boundary, is assumed to have the same thermal properties as air. Furthermore, in order to evaluate a worst-case scenario, the effect of rotation is neglected. The thermal boundary conditions are included in Figure 2. The emissivity coefficient is assumed to be equal to 0.31, which is a typical value for dark-gray iron surfaces [30]. The convection coefficient (h) is given by:
h = N u ¯ k a X ,
where k a is the thermal conductivity of the ambient air, X is the characteristic length (given by 1.8 R o and 2 R o at the axial and radial boundaries, respectively), and N u ¯ is the overall Nusselt number, which is given by:
N u ¯ = C 1 ( G r P r ) 1 4 , if   G r 10 5 ( laminar flow ) , C 2 ( G r P r ) 1 3 , otherwise ( turbulent flow ) ,
where G r and P r are the Grashof and Prandtl number, respectively, C 1 and C 2 are empirical coefficients, which at the radial boundaries are set to 0.47 and 0.10, respectively, and at the axial boundaries the coefficients are set to 0.54 and 0.14, respectively. The Grashof number is dependent on the temperature at the interface (i.e., the axial and radial interfaces on both the primary and secondary core; T p , a , T p , r , T s , a , T s , r ) and is given by:
G r = g β T i T X 3 ν a 2 ,
where g is the gravitational acceleration, β is the coefficient of thermal expansion (assuming an ideal gas; β = T 1 ), T i is the interface temperature, T is the temperature of the ambient air, and ν a is the kinematic viscosity of the ambient air [31]. Furthermore, the resistivity of the copper is a function of the coil temperature, given by:
ρ ( T c ) = ρ 0 1 + α T c T 0 ,
where ρ 0 is the resistivity at temperature T 0 , T c is the coil temperature, and α is the temperature coefficient [32]. As a result of the temperature dependence shown in (24) and (25), the thermal model is solved in an iterative manner, recalculating the coil resistances and heat transfer coefficients at every iteration until a steady-state is reached.

2.5. Pot Core Design Optimization

A design optimization is performed, in which the standard P14/8 [20] and P18/11 [20] pot core geometries, from Fair-Rite Products, for both non-resonant and resonant compensation are considered. The volume of a core half and inertia of the P14/8 pot core are equal to 0.365 cm 3 and 49.3 g·mm 2 , respectively, whereas for the P18/11 pot core the quantities are equal to 0.821 cm 3 and 181.6 g·mm 2 , respectively. The resulting optimal design is constructed, and measurements are performed in order to verify the design models and results. The objective of the design optimization is to maximize the efficiency for an output power level of at least 100 W, whilst satisfying the constraints. The optimization problem is given by:
maximize : x η ( x ) , where : x = { f , N p , N s } , subject to : P o ( x ) 100 W , B ^ i ( x ) 350 mT , T i ( x ) 100 C , T w ( x ) 150 C , I p ( x ) 25.0 A , I s ( x ) 3.00 A , V c , i ( x ) 48.0 V ,
where η is the efficiency, x is the set of design variables, which consists of the electrical frequency (f), the number of primary ( N p ) and secondary turns ( N s ), respectively, P o is the output power, B ^ i and T i are the maximum value of the magnetic flux density and average value of the temperature in the various core regions, T w is the average winding temperature, I p and I s are the rms-values of the primary and secondary current, respectively, and V c , i is the rms-value of the voltage across the resonant capacitors. The ambient temperature is assumed to be equal to 20 C . Furthermore, the axial height of the air gap that separates the primary and secondary core ( h a g ) and load resistance are fixed to 0.5 mm and 23.5 Ω , respectively.
The optimization problem, shown in (26), is solved by applying the parametric search method. The frequency is varied from 50 kHz up to and including 1 MHz in incremental steps of 25 kHz. For the number of turns, incremental steps of one turn are taken in the range starting at one and stopping at the point where the maximum allowable fill factor is exceeded. At every iteration, the design closest to the output power constraint and satisfying all other constraints is stored.

2.6. Experimental Verification

For the purpose of experimentally verifying the design approach, a stationary prototype of the optimal design resulting from (26) is realized. The prototype was used for the measurement of the input and output quantities. Furthermore, the core temperatures were measured by thermocouples fixed to the axial and radial interfaces with the ambient air. The thermocouples were mounted on both the primary and secondary side of the pot core. The various interface temperatures (T) are indicated in red in Figure 2, where the subscripts p and s denote the primary and secondary side, respectively, while the subscripts a and r are used to mark the axial and radial interface, respectively. The measured quantities are compared to the simulation results.

2.7. Geometrical Optimization

Alternatively to optimizing a fixed core geometry, as shown in (26), the required core inertia for realizing the desired output power level can also be minimized within the investigated frequency range. In this situation, the optimization problem is given by:
minimize : x J c ( x ) , where : x = { f , N p , N s , R 2 , R 3 , h w } , subject to : P o ( x ) 100 W , h c = R 2 2 R 1 2 R 3 + R 2 , R 4 = R 2 2 R 1 2 + R 3 2 , { h c , R 2 R 1 , R 4 R 3 } 1.00 mm , { h w , R 3 R 2 } 2.00 mm ,
where J c is the inertia of the core, excluding the winding, R 2 and R 3 are the inner and outer radius of the winding area, respectively, and h w is the axial height of the winding area. The inertia of the core is calculated as:
J c = 1 2 π h c + h w ρ m R 2 4 R 1 4 + 1 2 π h c ρ m R 3 4 R 2 4 + 1 2 π h c + h w ρ m R 4 4 R 3 4 ,
where ρ m is the mass density of the ferrite, which in this case is equal to 4800 kg/m 3 [20]. For the sake of reducing the number of design variables, the axial height of the bottom core part ( h c ) is calculated in such a way that, the cross-sectional area of region 3 at the average radius is equal to the cross-sectional area of region 1. The minimum axial height of the bottom core part ( h c ) is equal to 1.0 mm. The outer radius of the core ( R 4 ) is calculated such that the cross-sectional areas of regions 1 and 5 are equal to each other, and the radial depth of region 5 is at least equal to 1.0 mm, which is the minimum radial depth for all regions. Consequently, an approximately equal magnetic flux density is obtained in regions 1, 3, and 5. The inner radius of the core ( R 1 ) is fixed to 1.60 mm, which is the same value as for the P18/11 pot core. The minimum axial height and radial thickness of the winding area are equal to 2.0 mm, such that sufficient space for fitting and gluing the winding is realized. The core regions and geometrical variables are indicated in Figure 2. The constraints on the maximum value of the magnetic flux density, average value of the core and winding temperature, rms-values of the primary and secondary current, and rms-values of the voltage across the resonant capacitors remain equal to the constraints shown in (26) and are therefore not repeated in (27). Additionally, the ambient temperature, air gap height and load resistance are unchanged.
The optimization problem is solved by a gradient-based algorithm (i.e., interior-point from MATLAB [33]) for five different initial points, where the first initial point is the P18/11 pot core geometry and the other four are generated at random (by means of the Multistart algorithm from MATLAB [33]). Within the optimization problem, again both non-resonant and resonant compensation are considered. The winding ratio is determined in an internal parametric search loop, as these variables are discrete. In this internal loop, the primary and secondary number of turns are incrementally changed in order find the combination closest to the output power constraint, while respecting the maximum copper fill factor.

3. Results

3.1. Pot Core Design Optimization Results

The resulting output power as a function of the electrical frequency for both core geometries, non-resonant, and resonant compensation are shown in Figure 4. From the results, the average increase in output power by applying series–series resonance is calculated according to:
Δ P = P r ( f ) P n r ( f ) P n r ( f ) ¯ × 100 % ,
where P r and P n r are the output power for the resonant and non-resonant designs as a function of the frequency (f), respectively. Equation (29) is only evaluated for the frequencies at which both a resonant and non-resonant transformer design is obtained, i.e., the frequency ranges 275 kHz–1 MHz and 125 kHz–1 MHz for the P14/8 and P18/11 cores, respectively. Consequently, as a result of applying series–series resonance within the optimization problem, an average increase in output power of 39.7% and 45.5% is observed for the P14/8 and P18/11 pot cores, respectively. For electrical frequencies below the evaluated ranges, the constraint on the peak magnetic flux density is not satisfied.
The constraint on the output power (at least 100 W of output power) is only realized by the P18/11 pot core in combination with resonant compensation within the frequency range of 325 kHz–1 MHz. The efficiency corresponding to the feasible frequency range is shown in Figure 5. The optimum is located at an electrical frequency of 500 kHz, at which the overall system efficiency is equal to 92.8%. As a result of the discrete step in the winding ratio, and the rounding of the resonant capacitances, the output power and efficiency as function of frequency characteristics have non-smooth behavior.
The separation of the power losses into the various components (i.e., Joule, iron, switch, and diode losses, respectively) for the optimal transformer design is shown in Figure 6. The largest portion of the losses occurs in the diodes, whereas the iron losses give a negligible contribution (approximately equal to 0.1 W). Additionally, the figure demonstrates the high efficient operation of the GaN half-bridge inverter. The ratio between the Joule and the iron losses for the optimal transformer design is approximately thirteen, therefore the assumption that has been made in the magnetic model on the dominance of the Joule losses is validated.

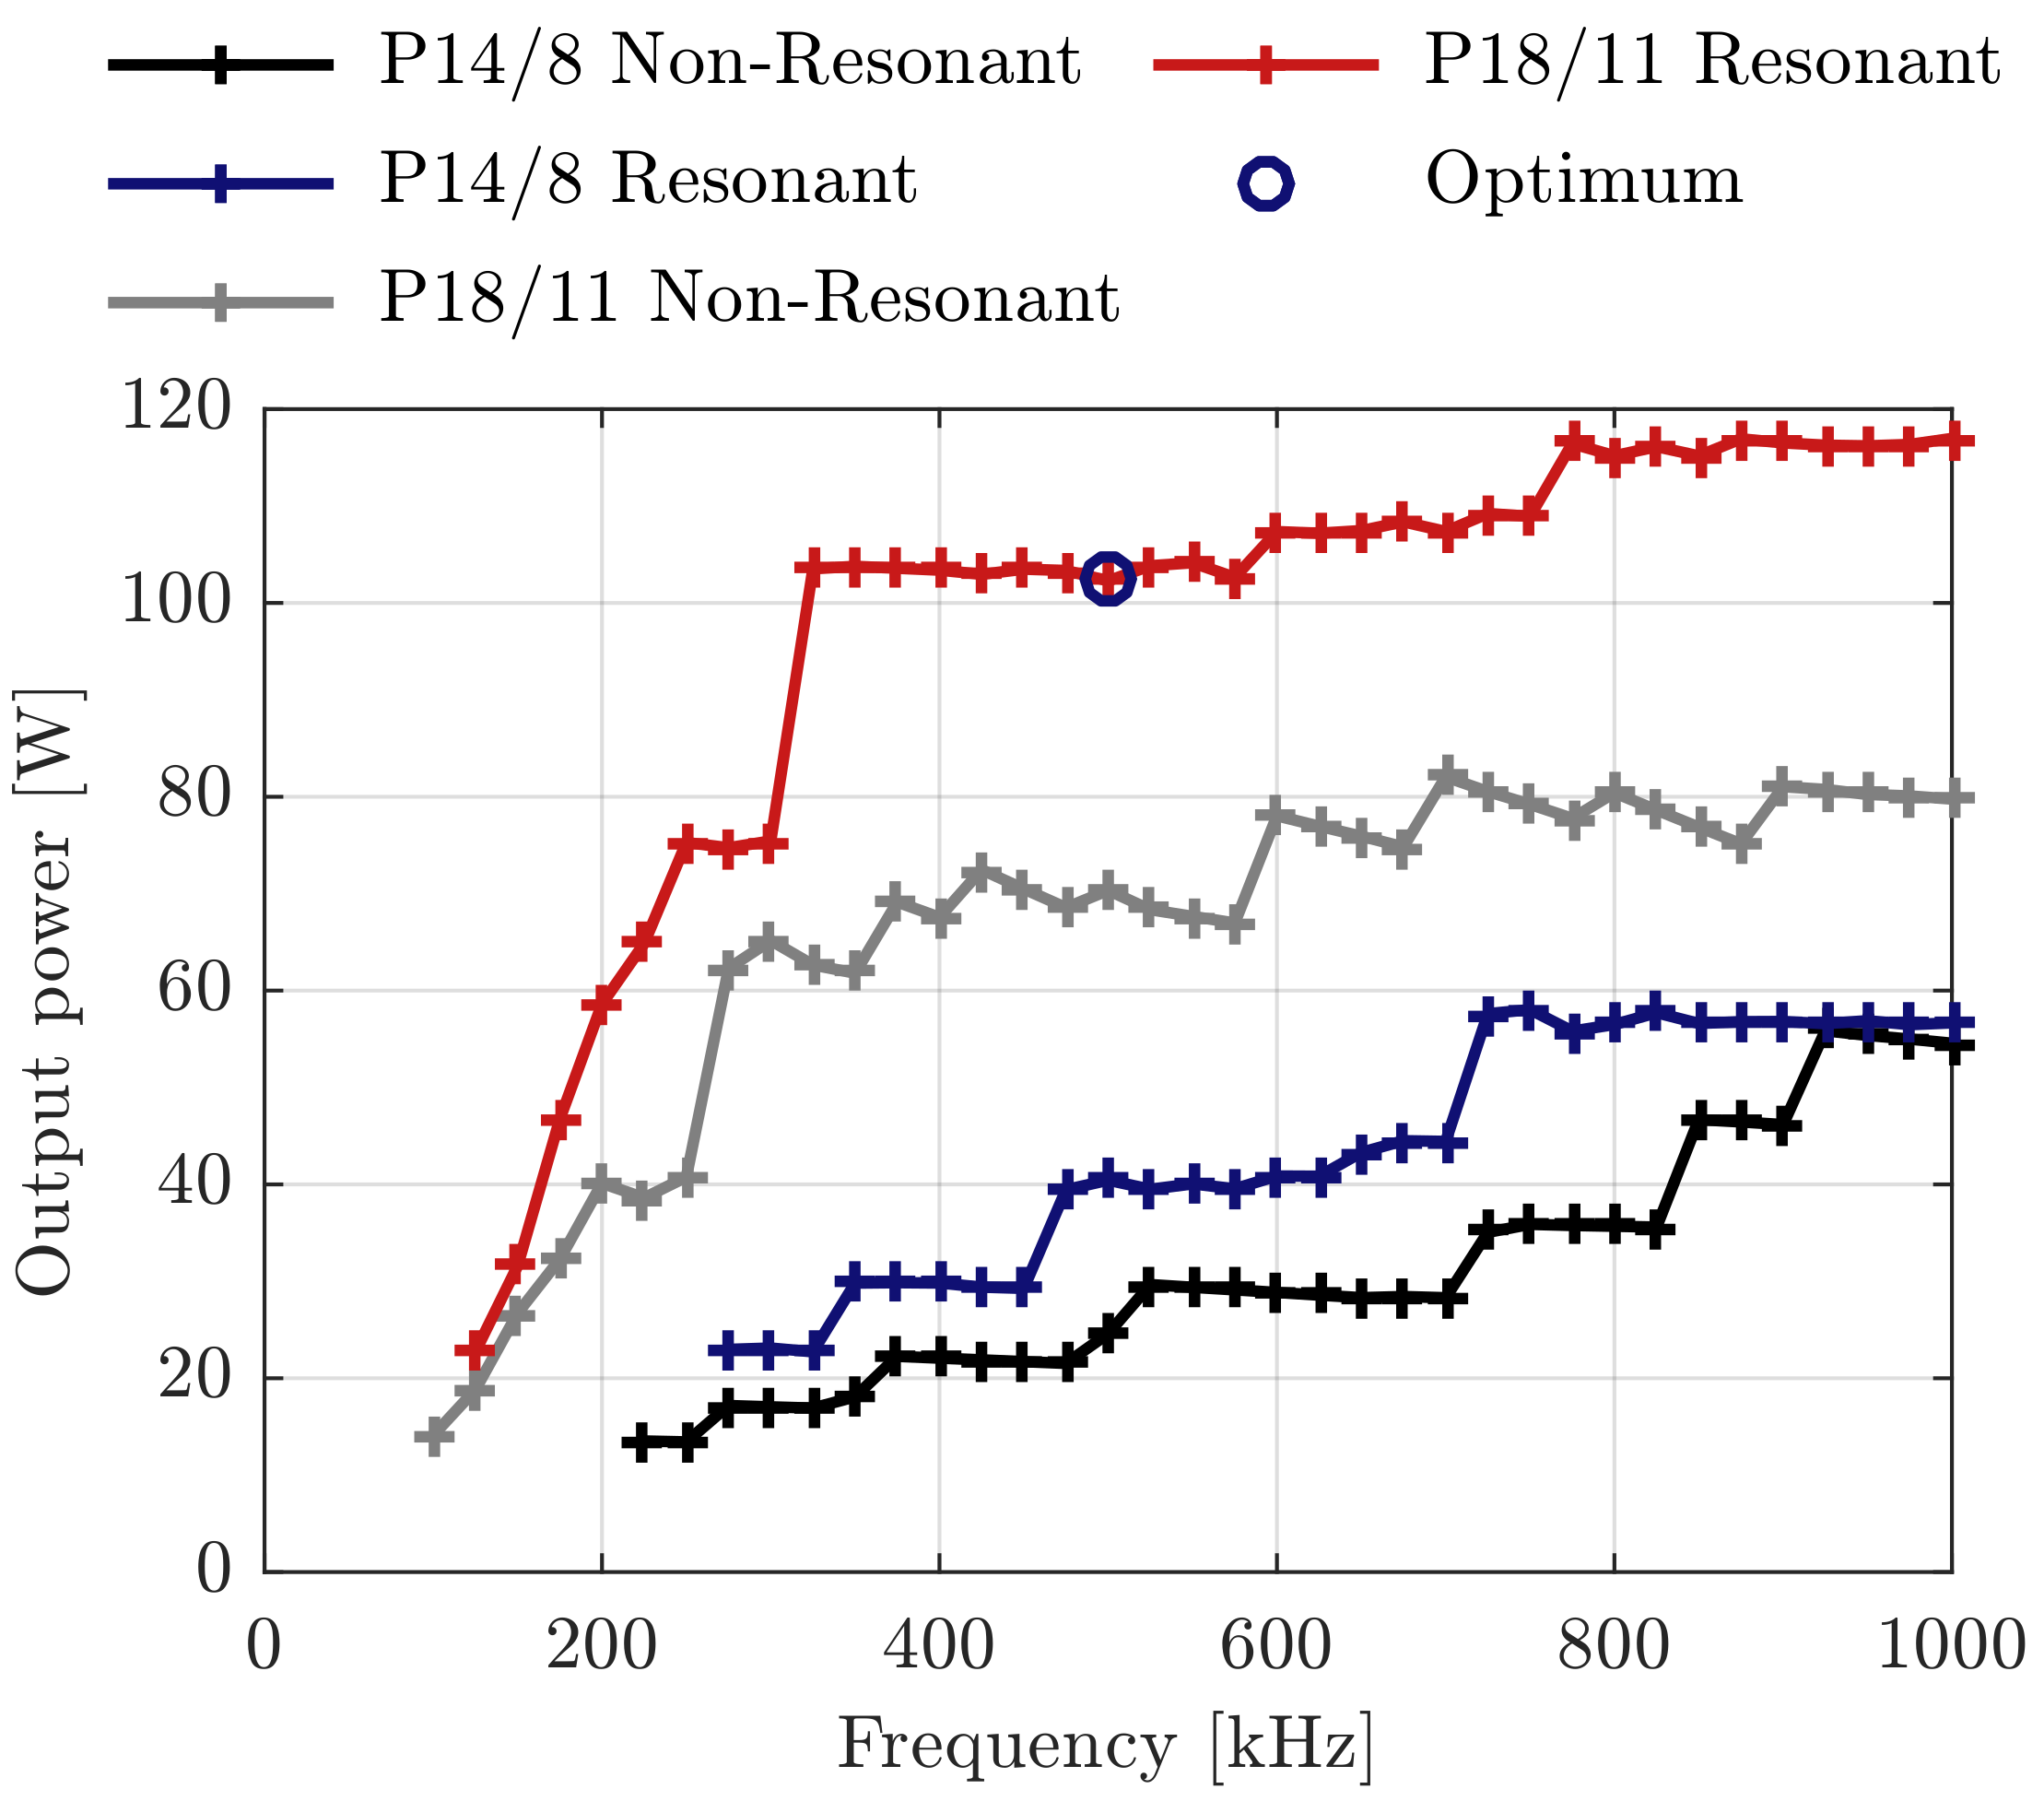
3.2. Experimental Results

For the purpose of experimental verification of the design approach, a stationary prototype of the optimal P18/11 pot core resonant transformer design is realized. The corresponding transformer parameters resulting from the simulation are shown in Table 2. The measurements were performed at an ambient temperature of 22 C and the dc bus voltage was set to 48 V.
The output current and voltage as a function of time resulting from both the measurements and the simulation are shown in Figure 7. The corresponding average values ( I o and V o , respectively) are shown in Table 3. Additionally, the discrepancy ( ϵ ) between the simulation and measurement results is included, which is calculated as:
ϵ = f s f m f m × 100 % ,
where f s and f m represent the values obtained by the simulation and measurement, respectively. A good agreement between the simulation and measurement results is achieved, small discrepancies of −0.95% and +1.9% are observed in the average values of the output current and voltage, respectively. Consequently, the transferred power resulting from the simulation closely matches the measurements, i.e., a small discrepancy of +0.49% is observed. Furthermore, low discrepancies of −3.1% and +3.1% are observed in the input power and efficiency calculations, respectively.
Additionally, the measured and estimated temperatures are shown in Table 3. On both sides a good agreement between the simulation results and the measurements is observed, small discrepancies of +2.1% and +5.4% are observed in the axial ( T s , a ) and radial ( T s , r ) interface temperatures on the secondary side, respectively. On the primary side, higher discrepancies are observed; +8.2% and +10.1% for the axial ( T p , a ) and radial ( T p , r ) interfaces, respectively. The higher discrepancy on the primary side might be caused by unaccounted heat transfer from the core to the printed circuit board (PCB). However, the model realizes sufficient accuracy for the design of the WPT system, therefore providing validation of the thermal model.

3.3. Geometrical Optimization Results

The two resulting optimal transformer geometries are shown in Figure 8. The corresponding geometrical parameters, transformer designs, and physical quantities are shown in Table 4. Compared to the previously determined P18/11 pot core design, a reduction of the core inertia by 38.2% and 66.4% are realized by the optimal non-resonant and resonant design, respectively. In order to obtain the reduction in core inertia, a higher electrical frequency is utilized (i.e., 850 and 950 kHz for the non-resonant and resonant design, respectively compared to 500 kHz for the optimal P18/11 design), which results in increased losses in the power electronics. Consequently, with respect to the P18/11 design, the non-resonant and resonant design decrease the efficiency by 1.5% and 1.1%, respectively.
Compared to the non-resonant optimal design, the resonant optimal design reduces the core inertia by 45.5%, while the output power and efficiency are increased by 9.3% and 0.4%, respectively. The increase in output power above 100 W by the resonant design is caused by the discrete step in the winding design.
In case of the non-resonant design, the core inertia is minimized through the minimization of the leakage inductances. Consequently, the winding area has a small axial height and a large radial width, as shown in Figure 8a. As a result, a high magnetic coupling factor of 0.95 is achieved for the non-resonant design. For the resonant design, the leakage inductances are compensated. Consequently, the opposite is true; the minimization of the core inertia is realized by minimizing the radial width, while utilizing a larger axial height, as shown in Figure 8b. Consequently, with respect to the non-resonant design, a lower magnetic coupling factor is obtained, since the leakage inductances are higher. Furthermore, a higher number of turns is fitted, such that a high magnetizing inductance is created.

4. Discussion

4.1. Three-Dimensional Effects

In each side of the pot core geometry, a small indentation is present, as shown in Figure 1, such that the leads of the winding can enter and exit the magnetic core. However, in the magnetic model, the geometry of the core is assumed to be perfectly axisymmetric. Moreover, the indentations cause the magnetizing and leakage inductances to be dependent on the position during the rotation of the secondary core. The influence of the indentations on the transferred power, iron losses, and the corresponding discrepancy with the 2D model are investigated using a 3D FEM model.
The results of the comparison are shown in Figure 9, where the output power and iron losses as a function of the position of the secondary core are shown in Figure 9a,b, respectively. At the zero position, the winding indentations are aligned, as shown in Figure 1. As a result of the rotation, the winding indentations misalign and the magnetizing inductance decreases, whereas the leakage inductances and the magnetic flux density in the remainder of the core geometry increase. Consequently, the output power is decreased by 0.24% and the iron losses increase by 0.86%. Therefore, the assumption of neglecting the influence of the rotation of the secondary core is justified. Furthermore, the average discrepancy between the 2D and 3D model for the output power and iron loss calculations are equal to +0.46% and −7.3%, respectively. Despite the relatively high discrepancy in the calculation of the iron losses, the effect on the efficiency and core temperature is negligible, since the amplitude of the iron losses is very small compared to the output power. Consequently, also the assumption of neglecting the winding indentations and modeling the geometry as an axisymmetric two-dimensional problem is justified.

4.2. Recommendations

Recommendations for future research include; firstly the improvement of the thermal model by the inclusion of heat transfer to the PCB, such that the estimation of the core temperature can be improved. Consequently, the core inertia could potentially be further reduced in a new geometrical optimization. Secondly, the design approach can be made more generic by the substitution of the 2D magnetic model for a 3D model, such that the accuracy of the core loss calculation is improved. Lastly, the system efficiency could potentially be improved by selecting more efficient diodes, since the largest portion of the losses occurs in the single-phase rectifier.

5. Conclusions

Both resonant and non-resonant high-frequency rotary transformers have been designed and compared within an electrical frequency range up to and including 1 MHz. The objective was to realize an output power level of at least 100 W. A multi-physical design approach has been proposed, in which magnetic, electrical, and thermal models are coupled. A design optimization for two fixed pot core geometries (P14/8 and P18/11 pot cores, respectively) in which the efficiency was maximized, has indicated that the application of series–series resonance within the investigated frequency range, increases the output power on average by 39.7% and 45.5%, respectively.
A geometrical optimization, in which the core inertia was minimized for the desired output power, has indicated that with respect to the optimal non-resonant design, the optimal resonant design reduces the core inertia by 45.5%, while the output power and efficiency are increased by 9.3% and 0.4%, respectively. Furthermore, with respect to the fixed core geometry, improvements in terms of core inertia of 38.2% and 66.4% are obtained by the non-resonant and resonant design, respectively.
The multi-physical design approach has been experimentally verified and closely matches the measurements; maximum discrepancies between the model and measurement results of +0.49%, −3.1%, +5.4% and +10.1% were obtained in the output power, efficiency, secondary and primary core temperature, respectively. Therefore, the multi-physical design approach has proven to be accurate and well-suited for the design of high-frequency WPT systems.

Author Contributions

The results presented in this paper have been developed by K.B. The analysis has been performed in cooperation with D.C.J.K., S.J., and E.A.L. The paper was written by K.B., and contributions and improvements to the content have been made by D.C.J.K., S.J., and E.A.L. All authors have read and agreed to the published version of the manuscript

Funding

This research received no external funding.

Acknowledgments

The author would like to thank Bram Daniels for his help in realizing multiple design optimization routines to be evaluated in parallel.

Conflicts of Interest

The authors declare no conflict of interest.

Abbreviations

The following abbreviations are used in this manuscript:
FEMFinite Element Method
GaNGallium-Nitride
PCBPrinted Circuit Board
rmsRoot-Mean-Square
WPTWireless Power Transfer

References

  1. Campi, T.; Cruciani, S.; Maradei, F.; Feliziani, M. Innovative Design of Drone Landing Gear Used as a Receiving Coil in Wireless Charging Application. Energies 2019, 12, 3483. [Google Scholar] [CrossRef] [Green Version]
  2. Zhang, C.; Lin, D.; Hui, S.Y.R. Ball-Joint Wireless Power Transfer Systems. IEEE Trans. Power Electron. 2018, 33, 65–72. [Google Scholar] [CrossRef]
  3. Bao, Y.; Zhong, Z.; Hu, C.; Qin, Y. Rotor Field Oriented Control of Resonant Wireless Electrically Excited Synchronous Motor. World Electr. Veh. J 2019, 10, 62. [Google Scholar] [CrossRef] [Green Version]
  4. Maier, M.; Parspour, N. Operation of an Electrical Excited Synchronous Machine by Contactless Energy Transfer to the Rotor. IEEE Trans. Ind Appl. 2018, 54, 3217–3225. [Google Scholar] [CrossRef]
  5. Bortis, D.; Fässler, L.; Looser, A.; Kolar, J.W. Analysis of Rotary Transformer Concepts for High-Speed Applications. In Proceedings of the 28th Annual IEEE Applied Power Electronics Conference and Exposition (APEC), Long Beach, CA, USA, 17–21 March 2013; pp. 3262–3269. [Google Scholar]
  6. Chen, X.Y.; Jin, J.X.; Zheng, L.H.; Wu, Z.H. A Rotary-Type Contactless Power Transfer System Using HTS Primary. IEEE Trans. Appl. Supercond. 2016, 26, 1–6. [Google Scholar] [CrossRef]
  7. Qian, W.; Zhang, X.; Fu, Y.; Lu, J.; Bai, H. Applying Normally-Off GaN HEMTs for Coreless High-Frequency Wireless Chargers. CES TEMS 2017, 1, 418–427. [Google Scholar] [CrossRef]
  8. Kazmierkowski, M.P.; Moradewicz, A.; Duarte, J.; Lomonova, E.; Sonntag, C. Contactless Energy Transfer. In Power Electronics and Motor Drives, 2nd ed.; Wilamowski, B., Irwin, J., Eds.; CRC Press: Boca Rotan, FL, USA, 2011; Chapter 35; pp. 1–17. ISBN 978-1-4398-0285-4. [Google Scholar]
  9. Shin, J.; Shin, S.; Kim, Y.; Ahn, S.; Lee, S.; Jung, G.; Jeon, S.J.; Cho, D.H. Design and Implementation of Shaped Magnetic-Resonance-Based Wireless Power Transfer System for Roadway-Powered Moving Electric Vehicles. IEEE Trans. Ind. Electron. 2014, 61, 1179–1192. [Google Scholar] [CrossRef]
  10. Trevisan, R.; Costanzo, A. A 1-kW Contactless Energy Transfer System Based on a Rotary Transformer for Sealing Rollers. IEEE Trans. Ind. Electron. 2014, 61, 6337–6345. [Google Scholar] [CrossRef]
  11. Godbehere, J.; Hopkins, A.; Yuan, X. Design and Thermal Analysis of a Rotating Transformer. In Proceedings of the IEEE International Electric Machines and Drives Conference (IEMDC), San Diego, CA, USA, 12–15 May 2019; pp. 2144–2151. [Google Scholar]
  12. Smeets, J.P.C.; Krop, D.C.J.; Jansen, J.W.; Hendrix, M.A.M.; Lomonova, E.A. Optimal Design of a Pot Core Rotating Transformer. In Proceedings of the IEEE Energy Conversion Congress and Exposition, Atlanta, GA, USA, 12–16 September 2010; pp. 4390–4397. [Google Scholar]
  13. Ditze, S.; Endruschat, A.; Schriefer, T.; Rosskopf, A.; Heckel, T. Inductive Power Transfer System with a Rotary Transformer for Contactless Energy Transfer on Rotating Applications. In Proceedings of the IEEE International Symposium on Circuits and Systems (ISCAS), Montreal, QC, Canada, 22–25 May 2016; pp. 1622–1625. [Google Scholar]
  14. Legranger, J.; Friedrich, G.; Vivier, S.; Mipo, J.C. Comparison of Two Optimal Rotary Transformer Designs for Highly Constrained Applications. In Proceedings of the IEEE International Electric Machines and Drives Conference (IEMDC), Antalya, Turkey, 3–5 May 2007; pp. 1546–1551. [Google Scholar]
  15. Zhong, H.; Zhao, L.; Li, X. Design and Analysis of a Three-Phase Rotary Transformer for Doubly Fed Induction Generators. IEEE Trans. Ind. Appl. 2015, 51, 2791–2796. [Google Scholar] [CrossRef]
  16. Zietsman, N.L.; Gule, N. Optimal Design Methodology of a Three Phase Rotary Transformer for Doubly Fed Induction Generator Application. In Proceedings of the IEEE International Electric Machines and Drives Conference (IEMDC), Coeur d’Alene, ID, USA, 10–13 May 2015; pp. 763–768. [Google Scholar]
  17. Sudhoff, S. Power Magnetic Devices; John Wiley & Sons, Ltd.: Hoboken, NJ, USA, 2014; ISBN 978-1-118-48999-4. [Google Scholar]
  18. Altair Engineering, Inc. Available online: https://www.altair.com/flux/ (accessed on 10 February 2020).
  19. Van den Bossche, A.; Valchev, V.C. Inductors and Transformers for Power Electronics; Taylor & Francis Group: New York, NY, USA, 2005; ISBN 978-1-4200-2728-0. [Google Scholar]
  20. Fair-Rite Products Corp. Available online: https://www.fair-rite.com/78-material-data-sheet/ (accessed on 10 February 2020).
  21. Bertotti, G. Hysteresis in Magnetism; Academic Press, Inc.: San Diego, CA, USA, 1998; ISBN 978-0-12-093270-2. [Google Scholar]
  22. Efficient Power Conversion Corporation. Available online: http://epc-co.com/epc/Portals/0/epc/documents/guides/EPC9035_qsg.pdf (accessed on 10 February 2020).
  23. Nexperia. Available online: https://www.nexperia.com/products/diodes/schottky-rectifiers/medium-power-low-vf-schottky-rectifiers-single-200-ma/PMEG6030ETP.html (accessed on 10 February 2020).
  24. Smeets, J.P.C. Contactless Transfer of Energy: 3D Modeling and Design of a Position-Independent Inductive Coupling Integrated in a Planar Motor. Ph.D. Thesis, Eindhoven University of Technology, Eindhoven, The Netherlands, 19 March 2015. [Google Scholar]
  25. Sinha, D.; Sadhu, P.K.; Pal, N.; Bandyopadhyay, A. Computation of Inductance and AC Resistance of a Twisted Litz-Wire for High Frequency Induction Cooker. In Proceedings of the International Conference on Industrial Electronics, Control and Robotics, Orissa, India, 27–29 December 2010; pp. 85–90. [Google Scholar]
  26. Tang, X.; Sullivan, C.R. Optimization of Stranded-Wire Windings and Comparison with Litz Wire on the Basis of Cost and Loss. In Proceedings of the IEEE 35th Annual Power Electronics Specialists Conference, Aachen, Germany, 20–25 June 2004; pp. 854–860. [Google Scholar]
  27. Pack Litz Wire. Available online: https://www.packlitzwire.com/products/litz-wires/rupalit-classic/ (accessed on 10 February 2020).
  28. Analog Devices. Available online: https://www.analog.com/en/design-center/design-tools-and-calculators/ltspice-simulator.html (accessed on 10 February 2020).
  29. Development Board EPC9035Quick Start Guide. Available online: https://epc-co.com/epc/Products/eGaNFETsandICs/EPC2022.aspx (accessed on 10 February 2020).
  30. Holman, J. Heat Transfer; The McGraw-Hill Companies, Inc.: New York, NY, USA, 2010; ISBN 978-0-07-352936-3. [Google Scholar]
  31. Wong, H.Y. Handbook of Essential Formulae and Data on Heat Transfer for Engineers; William Clowes & Sons Limited: London, UK, 1977; ISBN 0-582-46050-6. [Google Scholar]
  32. Hendershot, J.R.; Miller, T.J.E. Design of Brushless Permanent-Magnet Machines; Motor Design Books LLC: Venice, FL, USA, 2010; ISBN 978-0-9840687-0-8. [Google Scholar]
  33. Mathworks. Available online: https://nl.mathworks.com/help/optim/ug/constrained-nonlinear-optimization-algorithms.html#brnpd5f (accessed on 11 February 2020).
Figure 1. Wedge-shaped cross-sectional view of an axially gapped cylindrical (pot core) transformer, including indication of the various components.
Energies 13 00929 g001
Figure 2. Two-dimensional representation of the pot core transformer geometry in the axisymmetrical plane, including indication of geometrical parameters, region discretization, thermal boundaries, and interface temperatures.
Energies 13 00929 g002
Figure 3. Electrical equivalent circuit model including series–series resonant capacitors and indication of the various components.
Energies 13 00929 g003
Figure 4. Optimization results: Output power as a function of frequency for all designs.
Energies 13 00929 g004
Figure 5. Optimization results: Efficiency as a function of frequency for the P18/11 resonant transformer in the feasible output power region.
Energies 13 00929 g005
Figure 6. Optimization results: Separation of power losses for the optimal P18/11 resonant pot core design; Joule ( P c ), iron ( P F e ), switch ( P s w ), and diode losses ( P d ), respectively.
Energies 13 00929 g006
Figure 7. Measurement and simulation results: (a) Output current as a function of time, and (b) output voltage as a function of time.
Energies 13 00929 g007
Figure 8. Optimized transformer geometries: (a) Non-resonant and (b) resonant transformer design.
Energies 13 00929 g008
Figure 9. Comparison between the 2D and 3D model: (a) Output power as a function of position, and (b) iron losses as a function of position.
Energies 13 00929 g009
Table 1. Litz wire parameters.
ParameterSymbolValueUnit
Strand radius r s 0.016mm
Number of strands n s 250-
Nominal dc resistance (20 C) R d c , 0 0.0987 Ω /m
Total wire diameter including wrapping d w 0.52mm
Table 2. Optimal P18/11 pot core resonant transformer design.
ParameterSymbolValueUnit
Frequencyf500kHz
Number of primary turns N p 5-
Number of secondary turns N s 11-
Number of parallel paths primary side a p 2-
Number of parallel paths secondary side a s 1-
Magnetizing inductance L m 2.125 μ H
Primary leakage inductance L l k p 430.4nH
Secondary leakage inductance L l k s 430.4nH
Magnetic coupling coefficient k 0.893 -
Primary resonant capacitance C p 240.0nF
Secondary resonant capacitance C s 237.2nF
Table 3. Comparison of simulation and measurement results.
QuantitySymbolMeasurementSimulationUnitDiscrepancy [%]
Output current I o 2.112.09A−0.95
Output voltage V o 48.149.0V+1.9
Output power P o 101.7102.2W+0.49
Input power P i n 113.6110.1W−3.1
Efficiency η 89.692.8%+3.1
Secondary core axial
interface temperature
T s , a 72.574.0 C+2.1
Secondary core radial
interface temperature
T s , r 69.973.7 C+5.4
Primary core axial
interface temperature
T p , a 76.582.8 C+8.2
Primary core radial
interface temperature
T p , r 73.981.4 C+10.1
Table 4. Optimal non-resonant and resonant transformer designs resulting from the geometrical optimization.
Geometrical Design
ParameterSymbolNon-ResonantResonantUnit
Inner radius core R 1 1.601.60mm
Inner radius winding area R 2 3.913.23mm
Outer radius winding area R 3 8.526.48mm
Outer radius core R 4 9.527.48mm
Winding area height h w 2.053.38mm
Height bottom core part h c 1.021.00mm
Core inertia J c 112.261.1g·mm 2
Core volume V c 0.4810.400cm 3
Transformer Design
ParameterSymbolNon-ResonantResonantUnit
Frequencyf850950kHz
Number of primary turns N p 34-
Number of secondary turns N s 89-
Number of parallel
paths primary side
a p 22-
Number of parallel
paths secondary side
a s 11-
Magnetizing inductance L m 0.8010.974 μ H
Primary leakage inductance L l k p 86.3248.0nH
Secondary leakage inductance L l k s 86.3248.0nH
Magnetic coupling coefficient k 0.949 0.888 -
Primary resonant capacitance C p -110.0nF
Secondary resonant capacitance C s -111.4nF
Physical Quantities
QuantitySymbolNon-ResonantResonantUnit
Output power P o 100.6110.0W
Efficiency η 91.391.7%
Max. temperature primary core T ^ p , i 94.695.1 C
Max. temperature secondary core T ^ s , i 78.784.4 C

