Abstract
The problem of timely detecting the engine faults that make engine operating parameters exceed their control limits has been well-solved. However, in practice, a fault of a diesel engine can be present with weak signatures, with the parameters fluctuating within their control limits when the fault occurs. The weak signatures of engine faults bring considerable difficulties to the effective condition monitoring of diesel engines. In this paper, a multivariate statistics-based fault detection approach is proposed to monitor engine faults with weak signatures by taking the correlation of various parameters into consideration. This approach firstly uses principal component analysis (PCA) to project the engine observations into a principal component subspace (PCS) and a residual subspace (RS). Two statistics, i.e., Hotelling’s and statistics, are then introduced to detect deviations in the PCS and the RS, respectively. The Hotelling’s and statistics are constructed by taking the correlation of various parameters into consideration, so that faults with weak signatures can be effectively detected via these two statistics. In order to reasonably determine the control limits of the statistics, adaptive kernel density estimation (KDE) is utilized to estimate the probability density functions (PDFs) of Hotelling’s and statistics. The control limits are accordingly derived from the PDFs by giving a desired confidence level. The proposed approach is demonstrated by using a marine diesel engine. Experimental results show that the proposed approach can effectively detect engine faults with weak signatures.
1. Introduction
The diesel engine has been holding its value in all mechanical engineering fields since its inception. Many researchers have given their attention to the related subjects for the better understanding and management of engines. Among these subjects, the reliability and security of the diesel engine is a crucial topic due to the serious consequences of engine failures. Fault detection and diagnosis (FDD) is capable of detecting the deterioration and failures of diesel engines in a timely manner, as well as providing necessary information on details for condition-based maintenance (CBM). Currently, with the rapid development of sensing technology, signal processing and decision-making, novel FDD techniques of diesel engines keep coming up, and these facilitate the safe operation of diesel engines.
Generally, the FDD of a diesel engine consists of three steps: fault detection, fault isolation and fault identification [1]. Among these three steps, fault detection aims to monitor the working condition of a diesel engine in real time and then report an abnormity if present. This is the first step for the FDD of a diesel engine that provides the evidence, in detail, for locating the root cause of an abnormity (fault isolation) and quantifying the magnitude of the failure (fault identification). Based on a different theory, the fault detection approaches regarding diesel engine can be classified into two primary subcategories, i.e., the model-based approach and the data-driven approach [2]. The model-based approach attempts to describe diesel engine behavior by using a mathematical model. The mathematical model is constructed in such a way that each residual of an analytical redundancy relation (ARR) is sensitive just to a certain fault. Whenever acquiring a sample (a set of system parameters) of an engine’s working conditions, the residuals of ARRs are generated to indicate if a fault is present or not. The successful application of model-based fault detection techniques can be found in [3,4,5]. A model-based fault detection technique mathematically maps the drifting parameters with specific faults based on which one can get a thorough understanding of system malfunction behavior from the mathematical model. However, diesel engines have become equipped with some auxiliary equipment, e.g., a sequential turbo charging (STC) system, exhaust gas recirculation (EGR) and selective catalytic reduction (SCR), in recent decades to meet the ever-increasing demand for high economic efficiency and low emissions. The increased complexity of diesel engines, as well as the strong coupling among various subsystems, have shifted the mathematical model towards a limited ability to get an exhaustive description of system behavior. As such, most successful applications of model-based fault detection techniques have focused on subsystems with a relatively small number of inputs, outputs and states [6], and this has limited the ability to provide a comprehensive and universal method for engine fault detection.
Alternatively, the fault detection of a diesel engine can be pursued via a data-driven approach. Different from the model-based approach, the data-driven technique monitors the engine’s working conditions by taking advantage of measured data, and no simplifying assumption regarding the engine model is needed during this process [7]. Consequently, the data-driven technique has unique advantages for the fault detection of complex mechanical systems. For a data-driven engine fault detection approach, the upper control limit (UCL), lower control limit (LCL), or both are set to monitor the drift of a specific parameter. A fault is thought to be present if a parameter exceeds either the UCL or the LCL. Univariate statistics is a popular method for engine fault detection. This technique firstly assumes a probability distribution model for the operating parameters of a diesel engine, and the UCL and the LCL are then set according to a desired confidence level. This technique has been widely used in real-world practice. Though it is easy to implement, this technique can only detect the faults that show a strong abnormal signal, i.e., a fault is reported only if a large magnitude of the drifting of the corresponding parameters is detected. This technique has a limited ability to detect faults with weak abnormal signatures. In this paper, a fault with weak signature means that all observable parameters do not markedly deviate from the normal value when a fault occurs, thus making the fault difficult or impossible to directly detect from the absolute value of the parameters. An example of this situation can be seen in Section 2. In practice, a fault can be present as a breakdown of the correlation between parameters. In this situation, the deviation of operating parameters may still fluctuate within normal limits when a fault is present, which leads to the misdiagnosis of faults with weak signatures in diesel engines. Multivariate statistics is an effective approach for the condition monitoring of engineering systems. Currently, this technique is successfully used in process monitoring [8,9,10,11,12]. However, few researches have been devoted to apply this technique into diesel engine fault diagnosis. The typical researches on this topic can be listed as: Boullosa took advantage of Hotelling’s statistic control charts to detect the cylinder lubrication process and fuel oil process of a marine diesel engine [13,14]. Wang introduced the local statistical approach into the nonlinear statistical process control technique, and Hotelling’s and statistics were produced to detect the air leaks of an automotive diesel engine [15]. This paper reveals the effectiveness of multivariate statistics to detect engine faults with weak signatures. As for one of the key problems in multivariate statistics-based approaches, many studies set the UCL of statistics, i.e., Hotelling’s and statistics, by assuming that the statistics follow a specific distribution, e.g., and distributions. Due to measurement noise and unstable working conditions, a standard probabilistic model has a limited ability to describe the real probabilistic distribution of statistics. In order to solve this problem, some researchers have used kernel density estimation (KDE) to estimate the probability density function (PDF) of engine statistics [16,17,18]. The KDE is a powerful non-parametric tool that is used to estimate the PDF of a random variable from a set of data samples. A prior probabilistic model is not needed in this approach, so the KDE is capable of objectively modeling the probabilistic distribution of a random variable. Nevertheless, a problem remains to be solved is the selection of bandwidth. Bandwidth is a free parameter in KDE that has a strong influence on estimating results. A large bandwidth over-smooths the PDF curve such that the local feature of the PDF is covered. A small bandwidth, however, indicates a narrower region for each sample and could under-smooth the PDF curve [19,20,21,22]. It may take a few attempts to find a proper bandwidth. Consequently, selecting an optimal bandwidth for KDE is a crucial issue to be settled to make the multivariate statistics-based engine fault detection technique effective and efficient.
The main contributions of this paper are as follows: (i) A multivariate statistics-based condition monitoring approach is proposed to detect diesel engine faults with weak signatures, and (ii) adaptive kernel density estimation is introduced to determine the control limits of the statistics, thus relaxing the a priori assumption for the probability distribution of statistics. Principal component analysis (PCA) is firstly used to project diesel engine observations into a principal component subspace (PCS) and a residual subspace (RS). Two statistics, i.e., Hotelling’s and statistics, are then introduced as indictors to detect deviations in the PCS and the RS, respectively. The Hotelling’s and statistics describe the statistical characteristics of engine operating parameters by taking the correlation of various parameters into consideration so that faults with weak signatures, which cannot be monitored with a conventional fault detection approach, can be effectively detected via these two statistics. In order to reasonably determine the control limits of the statistics, adaptive kernel density estimation is utilized in this paper to estimate the PDFs of Hotelling’s and statistics. The control limits are accordingly derived from the PDFs by giving a desired confidence level. The proposed approach is demonstrated by using a marine diesel engine, and experimental results show that the proposed approach can effectively detect engine faults with weak signatures.
The rest of this paper is organized as follows. Section 2 describes the diesel engine test cell and the blind spot of conventional diesel engine fault detection approaches regarding faults with weak signatures. Section 3 presents a multivariate statistics-based engine condition monitoring approach. The methodology to estimate the PDF of Hotelling’s and statistics by using adaptive kernel density estimation is also presented in this section. Section 4 illustrates the proposed approach by using the experimental results of the diesel engine. Finally, Section 5 outlines the key findings.
2. Engine Fault Detection Using Univariate Statistics
2.1. Description of the Engine Test Cell
Experiments were carried out on an 8-cylinder, 4-stroke, water-cooled, marine diesel engine, which was configured with 2 turbochargers. Cylinders were evenly arranged in two rows with 4 cylinders on each side. The engine had a continuous power output with a maximum 500 kW at rated speed 1800 rpm. The crankshaft was connected with an eddy current dynamometer by a flange so that the output power could be effectively adjusted. The engine speed was controlled via a self-developed electronic control system (ECS) that was based on a PID algorithm. The technical details of the diesel engine are presented in Table 1.

Table 1.
Technical details of the marine diesel engine.
A diesel engine usually consists of several subsystems. The lubrication system is a crucial system to guarantee the safe and reliable operation of a diesel engine. The poor working conditions of a lubrication system can lead to abnormal wear or even some major safety accidents [23,24], e.g., cylinder score and the journal sticking of a diesel engine. Accordingly, the lubrication system was taken as the research object in our study to simulate the faults and illustrate the proposed engine fault detection approach. The lubrication system of this marine diesel engine consisted of several parts, including a gear pump, an oil filter, an oil cooler, and several valves with various functions. Normally, the working condition of an engine lubrication system is described via oil pressures and temperatures at various points. Therefore, a set of sensors were configured on the engine to acquire the oil pressures and temperatures of the engine lubrication system. The main working parameters of an engine lubrication system are shown in Table 2. In this engine test cell, the sensor signals were sampled and pre-processed by using a National Instruments PCI-6225 data acquisition (DAQ) system. The schematic of the engine test cell is shown in Figure 1.
Table 2.
Main working parameters of an engine lubrication system.
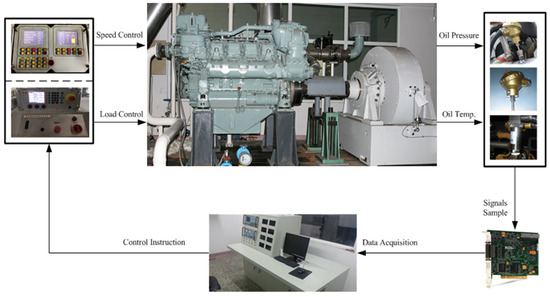
Figure 1.
The schematic of the marine diesel engine test cell.
2.2. Detecting Engine Faults with Weak Signatures Using Univariate Statistics
Three common faults were introduced into the engine lubrication system, i.e., oil leakage, oil filter clogging, and a low oil level. Oil leakage occurs when the joints of pipes or components loosen. The leakage of oil leads to the pressure loss of the oil gallery. An oil filter is used to prevent the impurities from flowing into the engine body. Once the oil filter is clogged, the oil pressure before the oil filter increases and the pressure after the filter decreases. The low oil level has a similar behavior to oil leakage, but this fault would happen before the engine started. Meanwhile, the occurrence of these three faults also affects the oil temperature. In this paper, the faults were introduced at a minor magnitude so that weak signatures could be detected. The working parameters presented in Table 2 were acquired by using the above-mentioned DAQ system to characterize the working condition of the engine lubrication system. Data were recorded at three different engine working conditions, i.e., 25%, 50%, and 75% loads at 1800 rpm. Table 3 presents the value of the main working parameters at different engine conditions in asample.
Table 3.
Oil pressures and temperatures at different engine conditions.
As mentioned above, univariate statistics is often used to monitor whether a working parameter deviates its control limits. Statistically, an operating parameter of a fault-free engine fluctuates around their mathematical expectation within certain limits. The statistic characteristics are broken when a fault occurs [6]. Thus, the presence of faults can be sensed via the statistical characteristics of working parameters. Among the univariate statistics, the Pauta criterion is one of the most widely used univariate statistics methods that has been widely used in control charts. According to the Pauta criterion, the fluctuation of the operating parameters of a diesel engine is normally distributed (Gaussian distribution), and the UCL and the LCL of a parameter are determined by using the mathematical expectation and standard deviation . A parameter is thought to be normally fluctuating if its value falls in , and it is thought to be out-of-control otherwise. However, this method has a limited ability for faults with weak signatures. As an example, take oil filter clogging at a 75% full load and 1800 rpm; according to Table 3, this method can compute that the deviations of these 6 parameters from the normal value are 1.12% at maximum. Such small deviations make the abnormality difficult to be detected. Figure 2 shows the monitoring charts of oil filter clogging at a 75% full load and 1800 rpm while using the Pauta criterion. The UCL and the LCL were determined by using train data with a quantity of 500 samples, and they are represented with red dash line in the charts. A total of 500 samples were utilized as test data to demonstrate the method; 100 samples were obtained under healthy conditions, and points 101–500 are the parameters with engine faults. The fault was introduced with small magnitude, and signal cables without shields were used to simulate the real industrial scenario. It could be found that due to the measurement noise and small fault magnitude, most parameters still fluctuated within their control limits in faulty conditions, which were therefore classified as healthy conditions, and only a small part of the samples exceeded the control limits regarding oil temperature after cooler. Therefore, only a small part of abnormal points were correctly identified by using the Pauta criterion.
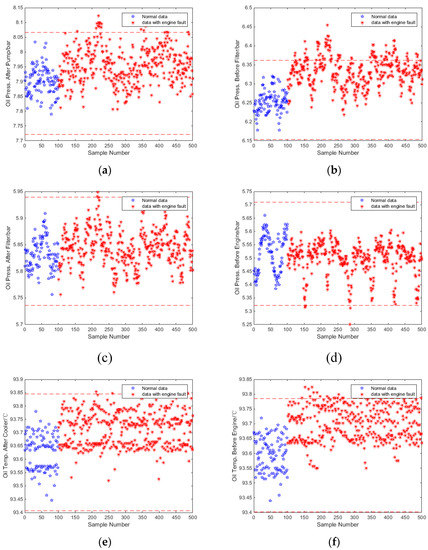
Figure 2.
Monitoring charts of oil filter clogging by using the Pauta criterion (75% full load and 1800 rpm): (a) oil pressure after pump; (b) oil pressure before filter; (c) oil pressure after filter; (d) oil pressure before engine; (e) oil temperature after cooler; and (f) oil temperature before engine.
The fault detection rate (FDR) [25] is commonly used to quantify the performance of a detection method, and it is defined as the percentages of fault samples that are correctly identified from the total population:
where represents the size of the total population and denotes the quantity of samples that are correctly identified. According to Equation (1), only 30.5% samples were successfully detected by using the Pauta criterion, which means that it was highly likely that the abnormalities of the engine operation were ignored when the oil filter was clogging. The FDRs of the Pauta criterion regarding the three engine faults are presented in Table 4. It can be seen that, excepting the oil filter clogging at a 50% full load and 1800 rpm, the FDRs for engine faults under different working conditions were unsatisfactory when using the Pauta criterion. Some of the FDRs were quite low, which easily led to a misleading diagnosis of the diesel engine. Therefore, the univariate statistics-based engine fault detection method cannot meet the ever-increasing demand for safe engine operation. Thus, a multivariate statistics-based method is now proposed to increase the FDRs of engine faults with weak signatures.
Table 4.
The fault detection rate of three engine faults when using the Pauta criterion.
3. A Multivariate Statistics-Based Fault Detection Approach of Diesel Engine
This section presents a multivariate statistics-based engine fault detection approach. Section 3.1 projects the engine observations into a principal component subspace (PCS) and a residual subspace (RS) by using principal component analysis. Section 3.2 introduces two statistics to detect the deviations in the RCS and the RS. Section 3.3 presents the methodology to determine the control limits of the statistics by using adaptive kernel density estimation.
3.1. Principal Component Analysis
Consider a sample vector with parameters, i.e., . A data matrix for samples can be constructed as follows [26].
In order to eliminate the influence of magnitude difference between different parameters, the data matrix is firstly scaled to a zero mean and unit variance according to the sample mean and covariance. As for a set of variables with correlation, PCA finds a set of linearly uncorrelated variables to represent the information contained in the original variables. The newly-constructed, linearly uncorrelated variables are called principal components (PCs). As for the data matrix , the transformation can be described as
where is called scores matrix of data matrix , is the PC score vector that describes the observed values of the -th PC for each sample vector , and represents the loadings matrix, which defines the basis vectors of the transformation.
According to Equation (3), the PC score vector can be represented as
Score vector can be viewed as the instantiated principal component given a set of observations of original variables. Therefore, we also use to represent the -th principal component. In order to account for as much of the variability in the original data as possible, PCA defines this transformation in such a way that the principal component should in turn have the largest possible variance. The variances of PCs are the eigenvalue of the covariance matrix of data matrix , and the loadings vector is therefore the eigenvector. The first PCs are sufficient to explain most of the characteristics of the original data. The linear space spanned by the first loadings vectors , i.e., , is called the principal component subspace (PCS), and the space , which is spanned by the last loadings vectors —i.e., —is called the residual subspace (RS). Normally, we use the PCS to describe the variations of data while retaining most of the information content. The RS, accordingly, depicts the residual information of the PCA model. According to Equations (3) and (4), the description of the data matrix when using the PCS and the RS can be represented as
where matrices and represent the score of data matrix in the PCS and the RS.
3.2. Fault Detection Indices
Given a measurement , its PC score can be calculated as
Different from in Equations (3) and (4), vector is used to represent the scores of a sample of an engine condition in all PCs. The Hotelling’s , which is also known as the Mahalanobis distance [27], is used to evaluate the variations of the observations in the PCS, which is defined as
where is the diagonal matrix of the largest eigenvalues of covariance matrix in a descending order; that is,
Hotelling’s quantifies the deviation of the various variables from their means. A fault is reported if the deviation exceeds the control limits. Since the data were normalized at the beginning of PCA modeling, the means of the PCs scores are the origin point of the PCS.
A fault can be effectively detected when the characteristics of the original variables can be depicted by the PCs corresponding to the PCS at a desired level. However, a change in variable correlation is possibly presented due to the influence of faults. Under this situation, the PCs cannot effectively describe the statistical characteristics of the original variables. Therefore, Hotelling’s has a limited ability for this situation. According to PCA, the PCS and the RS are complementary. A measurement will increase its projection to the RS when the PCS decreases its capability for characterization [28]. Consequently, the faults that lead to correlation changes can be detected by detecting the magnitude of projection to the RS.
A measurement can be decomposed as
where and represent its projections to the PCS and the RS, respectively, which can be calculated as
The statistic is introduced to evaluate the magnitude of , which is constructed as
Let and be the UCLs of Hotelling’s and statistics, respectively; then, a fault is reported if
where represents a logical OR operation. The method to determine the control limits and is presented in Section 3.3.
3.3. Determining UCLs Using Adaptive Kernel Density Estimation
The UCLs for Hotelling’s and statistics are normally determined with the assumption that all operating parameters and prediction errors have a Gaussian distribution. Nevertheless, this assumption is not always true due to the time-varying characteristics of engine working conditions and collective modeling errors [8]. This section proposes an adaptive kernel density estimation-based approach to determine the control limits of Hotelling’s and statistics while relaxing the assumptions regarding Gaussian distribution.
The KDE is a non-parametric estimation approach to construct the PDF of a random variable with no need for any prior assumption about variable distribution. Let be a sample of a random variable . The PDF of random variable can be derived by using a fixed-width KDE:
where is taken to be the quantity of data points for constructing the PDF, denotes the bandwidth (also called the window width), and represents the kernel PDF.
The bandwidth and kernel PDF are two factors that need to be set for PDF estimation. It has been proven that different kernel PDFs share almost the same optimality as each other. The Gaussian kernel function is a popular choice and was also used in this study. The Gaussian kernel function can be described as follows.
The bandwidth is a free parameter that directly determines the effectiveness of KDE. Some rough estimations of the optimal bandwidth aim to minimize the mean integrated square error. Among these rules, the rules-of-thumb (ROT) [29] are some of the most popular ways to set the bandwidth. However, the use of the ROT may lead to over-smoothing for the multimodal and non-normal density function [30]. This section takes advantage of an adaptive KDE algorithm to estimate the PDFs of Hotelling’s and statistics by overcoming the above-mentioned problem.
The main idea of the adaptive kernel method is to use a larger width in regions of a lower probability density and a smaller width otherwise [31]. The bandwidth is firstly set by using an initial value and then modified by using a local bandwidth factor. The strategy of the adaptive KDE is shown as follows. The mathematical derivation can be found in [32].
Step 1: Set an initial bandwidth and derive a pilot PDF estimation by using fixed-width KDE.
Step 2: Calculate the local bandwidth factor by using Equation (15);
where is the sensitivity factor.
Step 3: Modify the bandwidths to and obtain the adaptive kernel estimate by
The local bandwidth factor provides a variable bandwidth for various data points that avoids over-smoothing or under-smoothing by using a fixed bandwidth. It has been confirmed that the adaptive KDE is insensitive to the fine details of the pilot estimate in Step 1 [31].
The probability distribution function of a random variable can be obtained by using the estimated PDF . Given a confidence level , the control limit can be determined by
After replacing the random variable with Hotelling’s and statistics, respectively, the upper control limits can be obtained from the PDFs by
4. Case Study
Figure 3 shows the technical procedure for diesel engine fault detection by using a multivariate statistics-based approach. The procedure can be divided into two steps. In the off-line training step, engine operating data at healthy conditions are firstly collected and then normalized by mean-centering and scales while using standard variance to make the variance between one operating variable comparable to that of any other. Principal component analysis is then utilized to project the data to the PCS and the RS, respectively. The quantity of principal components is determined according to an accumulative contribution rate. In this paper, the accumulative contribution rate threshold was set as 85%; therefore, four PCs in total were selected to construct the PCS. As a consequence, the other two PCs were used to project the engine’s observable parameters into the RS. The Hotelling’s and statistics were calculated in the PCS and the RS, respectively, for each sample. The statistics were then listed as training data for the adaptive KDE to determine the upper control limits. In the on-line monitoring step, the operating parameters of the engine were detected in real-time and normalized by using the means and standard deviation values that were acquired in the off-line training step. The test sample was then projected to the PCS and the RS via the principal and residual loading vectors, respectively. The Hotelling’s and statistics of the test sample were deduced by using Equations (7) and (11) to detect the deviations in the PCS and the RS. The statistics were then compared with their control limits that were derived by using the adaptive KDE. A fault was reported if any statistic exceeded its control limit.
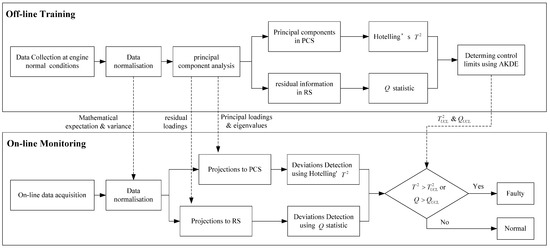
Figure 3.
Technical procedure for diesel engine fault detection.
The engine lubrication system faults mentioned in Section 2 were re-studied by using a multivariate statistics-based approach. In this study, the training data set was constructed based on the engine’s healthy condition with a sample size of 500. In total 400 samples were acquired as a test data set for each kind of fault, i.e., oil leakage, oil filter clogging, and a low oil level. All faults were introduced at the 101st sample point. Figure 4 shows the detection results for oil filter clogging at a 75% full load and 1800 rpm, Figure 4a presents the monitoring chart of Hotelling’s statistic, and Figure 4b shows the monitoring chart of the statistics.
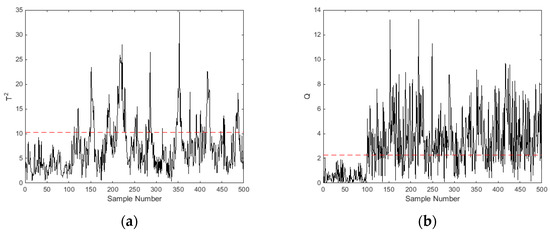
Figure 4.
Monitoring charts of oil filter clogging by using multivariate statistics (75% full load and 1800 rpm): (a) Hotelling at different samples and (b) statistic at different samples.
It can be seen that the Hotelling’s and statistics firstly kept below the control limits from point 1 to point 100, and then they remarkably increased from point 101, showing the presence of a fault. According the fault detection rule described in Equation (12), a fault was reported either Hotelling’s or statistic exceeded its UCL. The fault detection result was quantified by using Equation (1) to calculate the FDR, and result showed that the fault detection rate increased from 30.5% to 75.5% after using the multivariate statistics-based method. Table 5 shows the FDRs of engine faults under different engine working conditions. It can be seen that the FDRs of all faults increased at different degrees, which means the multivariate statistics-based approach can give a more accurate result for engine fault detection.
Table 5.
The improved performance of engine fault detection rate by using multivariate statistics.
The results also show the complementarity of Hotelling’s and statistics for fault detection. According to the control charts shown in Figure 4, the Hotelling’s and statistics detected different samples of oil filter clogging (75% full load and 1800 rpm). The FDRs that were found by using Hotelling’s and statistics separately were 23.5% and 70%, respectively, and the FDR increased to 75.5% after combining the two statistics. A complementarity result could also be seen from the control charts of oil leakage (50% full load and 1800 rpm), which are shown in Figure 5. Contrary to Figure 4, most of the fault samples regarding oil leakage were detected via Hotelling’s statistic, while a small proportion of samples were detected by using statistic. The FDRs that were found by separately using Hotelling’s and statistics were 67.25% and 10.5%, respectively. Therefore, the combination of the two statistics improved the fault detection rate of the diesel engine.
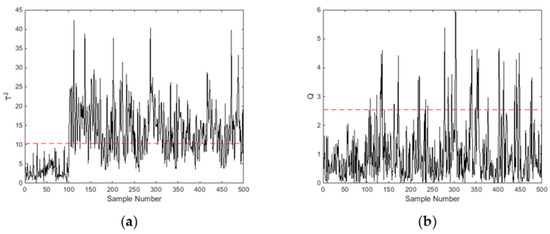
Figure 5.
Monitoring charts of oil leakage by using multivariate statistics (50% full load and 1800 rpm): (a) Hotelling at different samples and (b) statistic at different samples.
5. Conclusions
This paper proposed a multivariate statistics-based approach to detect diesel engine faults with weak signatures. Principal component analysis was firstly used to obtain the principal components of engine observations in the principal component subspace and the residual subspace. Hotelling’s and statistics were then introduced to detect deviations of principal components in the PCS and the RS, respectively. The control limits were determined by using adaptive kernel density estimation by overcoming the influence of bandwidth selection on PDF estimation. The proposed approach was verified by the experimental measurements from a MTU8V396 marine diesel engine. Comparisons with conventional univariate statistics fault detection method showed that the proposed approach improved the fault detection rate, at maximum, of oil leakage from 43% to 84.75%, from 30.5% to 75.5% for oil filter clogging, and from 43.75% to 85% for a low oil level. The results showed that the multivariate statistics-based approach provides a more effective method for diesel engine condition monitoring.
Author Contributions
Conceptualization, J.W. and X.M.; methodology, J.W. and Y.X.; software, J.W.; validation, C.Z.; formal analysis, C.Z.; investigation, J.W.; resources, X.M. and Y.X.; data curation, C.Z.; writing—original draft preparation, J.W.; writing—review and editing, J.W., X.M., Y.X. and R.C.; visualization, C.Z.; supervision, X.M.; project administration, Z.W.; funding acquisition, Z.W. All authors have read and agreed to the published version of the manuscript.
Funding
This research was funded by The National Natural Science Fund of China, grant number 51305089, and Natural Science Foundation of Heilongjiang Province of China, grant number E2016018.
Conflicts of Interest
The authors declare no conflict of interest.
References
- Liu, R.; Yang, B.; Zio, E.; Chen, X. Artificial intelligence for fault diagnosis of rotating machinery: A review. Mech. Syst. Signal. Process. 2018, 108, 33–47. [Google Scholar] [CrossRef]
- Haghani, A.; Jeinsch, T.; Roepke, M.; Ding, S.; Weinhold, N. Data-driven monitoring and validation of experiments on automotive engine test beds. Control Eng. Pract. 2016, 54, 27–33. [Google Scholar] [CrossRef]
- Svard, C.; Nyberg, M.; Frisk, E.; Krysander, M. Autimotive engine FDI by application of an automated model-based and data-driven design methodology. Control Eng. Pract. 2013, 21, 455–472. [Google Scholar] [CrossRef]
- Salehi, R.; Alasty, A.; Shahbakhti, M.; Vossoughi, G. Detection and isolation of faults in the exhaust path of turbocharged automotive engines. Int. J. Automot. Technol. 2015, 16, 127–138. [Google Scholar] [CrossRef]
- Boulkroune, B.; Aitouche, A.; Cocquempot, V.; Cheng, L.; Peng, Z. Actuator fault diagnosis with application to a diesel engine testbed. Math. Probl. Eng. 2015, 2015, 189860. [Google Scholar] [CrossRef]
- Mohammadpour, J.; Franchek, M.; Grigoriadis, K. A survey of diagnostic methods for automotive engines. Ind. J. Engine Res. 2011, 13, 41–64. [Google Scholar] [CrossRef]
- Zhong, J.; Wong, P.; Yang, Z. Fault diagnosis of rotating machinery based on multiple probabilistic classifiers. Mech. Syst. Signal. Process. 2018, 108, 99–114. [Google Scholar] [CrossRef]
- Pilario, K.; Cao, Y. Canonical variate dissimilarity analysis for process incipient fault detection. IEEE Trans. Ind. Inform. 2018, 12, 5308–5315. [Google Scholar] [CrossRef]
- Samuel, R.; Cao, Y. Nonlinear process fault detection and identification using kernel PCA and kernel density estimation. Syst. Sci. Control Eng. 2016, 4, 165–174. [Google Scholar] [CrossRef]
- Jiang, Q.; Yan, X.; Huang, B. Performance-driven distributed PCA process monitoring based on fault-relevant variable selection and Bayesian inference. IEEE Trans. Ind. Electron. 2015, 63, 377–386. [Google Scholar] [CrossRef]
- Zhang, K.; Ding, S.; Shardt, Y.; Sarrate, Y.; Chen, Z.; Peng, K. Assessment of T2 and Q statistics for detecting additive and multiplicative faults in multivariate statistical process monitoring. J. Frankl. Inst. 2017, 354, 668–688. [Google Scholar] [CrossRef]
- Wang, Y.; Si, Y.; Huang, B.; Lou, Z. Survey on the theoretical research and engineering applications of multivariate statistics process monitoring algorithms: 2008–2017. Can. J. Chem. Eng. 2018, 96, 2073–2085. [Google Scholar] [CrossRef]
- Boullosa, D.; Larrabe, J.; Lopez, A.; Gomez, M. Monitoring through T2 Hotelling of cylinder lubrication process of marine diesel engine. Appl. Therm. Eng. 2017, 110, 32–38. [Google Scholar] [CrossRef]
- Boullosa, D.; Barrena, J.; Lopez, A.; Menendez, J.; Solaetxe, M. Monitoring of fuel oil process of marine diesel engine. Appl. Therm. Eng. 2017, 127, 517–526. [Google Scholar] [CrossRef]
- Antory, D. Fault diagnosis application in an automotive diesel engine using auto-associative neural networks. In Proceedings of the International Conference on Computational Intelligence for Modeling, Control and Automation and International Conference on Intelligent Agents, Vienna, Austria, 28–30 November 2005; Volume 2, pp. 109–116. [Google Scholar]
- Zhong, K.; Li, J.; Wang, J.; Han, M. Fault detection for marine diesel engine using semi-supervised principal component analysis. In Proceedings of the 9th International Conference on information Science and Technology, Hulunbuir, China, 2–5 August 2019; pp. 146–151. [Google Scholar]
- Antory, D. Application of a data-driven monitoring technique to diagnose air leaks in an automotive diesel engine: A case study. Mech. Syst. Signal. Process. 2007, 21, 795–808. [Google Scholar] [CrossRef]
- Antory, D.; Kruger, U.; Irwin, G.; McCullough, G. Fault diagnosis in internal combustion engines using non-linear multivariate statistics. Proc. Inst. Mech. Eng. Part I J. Syst. Control Eng. 2005, 219, 243–258. [Google Scholar] [CrossRef]
- Davies, T.; Lawson, A. An evaluation of likelihood-based bandwidth selectors for spatial and spatiotemporal kernel estimates. J. Stat. Comput. Simul. 2019, 89, 1131–1152. [Google Scholar] [CrossRef]
- Heda, K.; Louani, D. Optimal bandwidth selection in kernel density estimation for continuous time dependent processes. Stat. Probab. Lett. 2018, 138, 9–19. [Google Scholar] [CrossRef]
- Yadav, R.; Raj, S.; Pradhan, A. Real-time event classification in power system with renewables using kernel density estimation and deep neural network. IEEE Trans. Smart Grid 2019, 10, 6849–6859. [Google Scholar] [CrossRef]
- Zhang, F.; Liu, Y.; Chen, C.; Li, Y.; Huang, H. Fault diagnosis of rotating machinery based on kernel density estimation and Kullback-Leibler divergence. J. Mech. Sci. Technol. 2014, 28, 4441–4454. [Google Scholar] [CrossRef]
- Wei, N.; Gu, J.; Gu, F.; Chen, Z.; Li, G.; Wang, T.; Ball, A. An investigation into the acoustic emissions of internal combustion engines with modeling and wavelet package analysis for monitoring lubrication conditions. Energies 2019, 12, 640. [Google Scholar] [CrossRef]
- Li, G.; Gu, F.; Wang, T.; Lu, X.; Zhang, L.; Zhang, C.; Ball, A. An improved lubrication model between piston rings and cylinder liners with consideration of liner dynamic deformations. Energies 2017, 10, 2122. [Google Scholar] [CrossRef]
- Samuel, R.; Cao, Y. Fault detection in a multivariate process based on kernel PCA and kernel density estimation. In Proceedings of the 20th Inernational Conference on Automation and Computing, Cranfield, UK, 12–13 September 2014; pp. 146–151. [Google Scholar]
- Alcala, C.; Qin, S. Analysis and generalization of fault diagnosis methods for process monitoring. J. Process Control 2011, 21, 322–330. [Google Scholar] [CrossRef]
- Norvilas, A.; Negiz, A.; DeCicco, J.; Cinar, A. Intelligent process monitoring by interfacing knowledge-based systems and multivariate statistical monitoring. J. Process Control 2000, 10, 341–350. [Google Scholar] [CrossRef]
- Dunia, R.; Qin, S. Subspace approach to multidimensional fault identification and reconstruction. AICHE J. 1998, 44, 1813–1831. [Google Scholar] [CrossRef]
- Rao, B. Nonparametric Functional Estimation; Academic Press: New York, NY, USA, 2014. [Google Scholar]
- Cao, R.; Cuevas, A.; Manteiga, W. A comparative study of several smoothing methods in density estimation. Comput. Stat. Data Anal. 1994, 17, 153–176. [Google Scholar] [CrossRef]
- Au, S.; Beck, J. A new adaptive importance sampling scheme for reliability calculations. Struct. Saf. 1999, 21, 135–158. [Google Scholar] [CrossRef]
- Abramson, I. On bandwidth variation in kernel estimates—A square root law. Ann. Stat. 1982, 10, 1217–1223. [Google Scholar] [CrossRef]


© 2020 by the authors. Licensee MDPI, Basel, Switzerland. This article is an open access article distributed under the terms and conditions of the Creative Commons Attribution (CC BY) license (http://creativecommons.org/licenses/by/4.0/).