Article

Experimental Investigation on the High-frequency Pressure Oscillation Characteristics of a Combustion Process in a DI Diesel Engine

1
College of Energy Engineering, Zhejiang University, Hangzhou 310027, Zhejiang, China
2
Engine Business Division, FAW Jiefang Automotive Co, Ltd., Wuxi 214000, Jiangsu, China
*
Author to whom correspondence should be addressed.
Energies 2020, 13(4), 871; https://doi.org/10.3390/en13040871
Submission received: 6 January 2020 / Revised: 6 February 2020 / Accepted: 12 February 2020 / Published: 17 February 2020
(This article belongs to the Section J: Thermal Management)

Abstract

:
It is difficult to decompose the in-cylinder pressure of combustion of the direct injection (DI) diesel engine, a transient process associated with complicated oscillation components, because of its steep property. An adaptive cyclic average method based on time varying filter based empirical mode decomposition (TVF-EMD) is proposed to decompose the in-cylinder pressure signal, and the cyclic number is determined adaptively with protruding ratio of high-frequency oscillation. The proposed method is used to compare with the ensemble empirical mode decomposition and original TVF-EMD. The results indicate that the proposed method can overcome the drawbacks of these methods and extract high-frequency oscillations accurately and effectively. Three evaluation indexes, center frequency, normalized energy, and average center frequency are defined to analyze the frequency and energy characteristics of high-frequency oscillation quantitatively. The influence of speed, load, rail pressure, main injection timing, pilot injection interval, and pilot injection quantity are investigated systematically. The energy of high-frequency oscillation reaches the peak at medium-high speed, and increase with engine load and rail pressure. However, the relationship of high-frequency oscillation with fuel injection parameters are non-monotonic.

1. Introduction

Since the 90s, the diesel engine has become the mainstream energy conversion device in Europe [1] and China [2], due to excellent power performance, comfortable drivability, and lower fuel consumption and CO2 emissions [3,4]. Unfortunately, there are still some serious challenges of noise, vibration, and harshness (NVH) performances and pollutant NOx emissions in the research & development (R&D) process of the diesel engine [5,6]. In order to solve the issues of using diesel fuel, some methods have been implemented to reduce both emissions of atmosphere and acoustics. Use of fibrous porous materials for engine acoustic wrapping and intake and exhaust equipment can absorb noise and reduce polluted emissions [7,8]. In addition, the widespread use of alternative fuels, such as unconventional shale gas [9] and novel proton exchange membrane fuel cells [10] are also effective solutions to reduce diesel engine pollution.
Previous studies indicate that the overall noise level of the diesel engine is strongly related to the high-frequency pressure oscillation, which can be reduced by variable working parameters, in high load conditions [11,12,13]. However, the quantitative characteristics of the cylinder pressure oscillations still have not been revealed systematically.
For modern direct injection diesel engines, premixed combustion dominates the combustion process in the early stage. Thus, pressure oscillation is prone to occur. In the early stage of combustion, several regions of mixed gas ignite spontaneously and transmit pressure fluctuations [14]. Then, a high-frequency pressure oscillation of the mixed gas with complex frequency components occurs. The oscillation frequency depends on the geometry of the chamber and the acoustic velocity of the mixture gas, and is influenced by the temperature, pressure, and density of gas mixture. In addition, the intensity of the pressure oscillation is relative to the pressure rise rate in the preliminary stage of combustion. In fact, the pressure rise rate is related to combustion calibration parameters such as main injection timing, pilot injection interval, and pilot injection quantity [15]. Pressure oscillations have a significant impact on the NVH performance, and polluted emissions of the diesel engine [16]. These oscillations are the source of excitation for high frequency combustion noise [17]. Diéguez et al. [18] found that a knock event can be well described by the high-frequency components of the pressure and acceleration signals which show change associated with an abnormal combustion event. Payri et al. [19] obtained resonance signal to analyze the impact on combustion noise by decomposing the in-cylinder pressure signal to pseudo-motored pressure, combustion pressure, and resonance pressure firstly. Zhang et al. [20] emphasized the significance of the pilot injection stage on high-frequency oscillation of the multiple injection diesel engine. Kyrtatos et al. [21,22,23] found the in-cylinder pressure fluctuations and its effects on emission trends (Soot and NOx), in the research of pressure resonance and cycle-to-cycle variation in a diesel engine. At the same time, Alberto Broatch et al. [15] and Luján et al. [17] used the signal of cylinder pressure oscillation to estimate the trapped mass of the cylinder. Chiatti Giancarlo et al. [24] indicated that there are high values of correlation coefficients exist between the indices for combustion development and injection process characterization. These all illustrate the importance of research on cylinder pressure oscillation, however, none of research above found the detailed change rules between high frequency pressure oscillation and engine working parameters.
There are many experimental studies on the identification of high-frequency pressure oscillation of the engine by signal processing methods [25,26,27,28,29]. Saeed Siavoshani [25] defined a Wiener filter that characterizes the fluctuation of the cylinder pressure and multiplies the Wiener filter by the combustion pressure signal to obtain combustion contribution of the vibration of the engine block. Badawy et al. [26] studied the effect of injection pressure and exhaust-gas recirculation (EGR) on combustion resonance by inserting an ion current sensor. Albarbar et al. [27] investigated the air-borne acoustic signal in the vicinity of injector head combined with independent component analysis (ICA) to decompose the acoustic signals, and found that the recovered energy level of high frequency band 9–15 kHz was affected by the injector pressure setting. Hou et al. [28] and Shi et al. [29] used a wavelet packet transform to characterize combustion resonance in homogeneous charge compression ignition (HCCI) engines. All of the signal acquisition and processing methods have separated relatively effective combustion resonance with high signal-noise ratio.
Apart from experimental research on pressure oscillation, some work has been done to calculate and simulate the cylinder pressure oscillation and describe the in-cylinder combustion process [14,30,31]. Torregrosa and Broatch et al. [14] proposed a numerical calculation method that used the noise caused by the combustion process of a diesel engine to overcome the experimental limits. The results showed that the local flow conditions at the beginning of combustion have a great influence on the acoustic response of the combustion excitation source. Wei et al. [30] predicted the wave equations for the coupling of pressure fluctuations in the combustion process of diesel engines with the Kiva program. Kaushal et al. [31] used large eddy simulation (LES) to study the turbulent fluid flow around the intake valve of a single cylinder IC-engine, and found that the LES tool revealed high prediction capability of the simulation of valve flows. As a consequence, all of these simulation methods above have obtained combustion resonance to a certain extent. However, because of the randomness and complex frequency components inside the combustion process, it is difficult to obtain more realistic combustion resonance information only by simulation. Therefore, it is more necessary to verify the need of analyze high-frequency pressure oscillation by experimental methods.
Empirical mode decomposition (EMD), as a classical mode decomposition, has been widely used in fault diagnosis and incentive identification [32]. Bi et al. [33] proposed an EMD decomposition method combined with wavelet-denoising to identify the knock characteristics (including the light knock) from a vibration signal. Sankar et al. [34] used complementary ensemble empirical mode decomposition (CEEMD) for decompose the rotary optical encoder signal to detect the spark ignition engine firing. Bi et al [35] used variational mode decomposition (VMD) to decomposing the vibration signals of engine to detect the knock of engine, which can eliminate the effect of noise and extract knock at different intensities more accurately and quickly than EMD. An improved empirical mode decomposition method, called time varying filter based empirical mode decomposition (TVF-EMD) is developed recently [36]. TVF-EMD is capable of restraining mode mixing in comparison to EMD. These improvements ensure that the vibration signal is decomposed into multiple meaningful empirical modes precisely, known as intrinsic mode functions (IMFs). Therefore, TVD-EMD is considered to be effective and robust in troubleshooting [37,38].
It can be found from the previous studies that, on the one hand, although plenty of works have analyzed high-frequency pressure oscillation, including the change of the pressure gradient related to the pressure oscillation, the frequency range is defined empirically without obtaining the specific peak region, and the relationship between combustion parameters and cylinder pressure oscillation also have not been established. So, it is difficult to provide guidance for the optimization of the high-frequency pressure oscillation and combustion noise. On the other hand, although the conventional TVF-EMD method can separate the field point noise adaptively, since the cylinder pressure curve is a highly intermittent signal, it is difficult to separate cylinder pressure oscillation without proper improvement.
In this paper, a four-cylinder direct injection (DI) diesel engine with multi-injection strategy is conducted for the experimental study. The experimental setup and testing conditions including different engine speed, loads and fuel injection parameters are presented in Section 2. In Section 3, an adaptive cyclic average TVF-EMD method is proposed to decompose the in-cylinder pressure signal. The results are verified by the time-frequency analysis and compared with EEMD and TVF-EMD methods to show the accuracy and advantage of the proposed method. Three evaluation indexes, center frequency, normalized energy and average center frequency, are defined to analyze the frequency and energy characteristics of high-frequency pressure oscillation quantitatively. In Section 4, the change rules of high-frequency oscillation with different engine speed, loads and fuel injection parameters are studied in detail systematically. In Section 5, summarizing relationship between high-frequency oscillation with engine speeds, loads, and fuel injection parameters are given, and the influences on sound quality of DI diesel engine are also discussed. Finally, the main conclusions and contributions of this research are emphasized in Section 6.

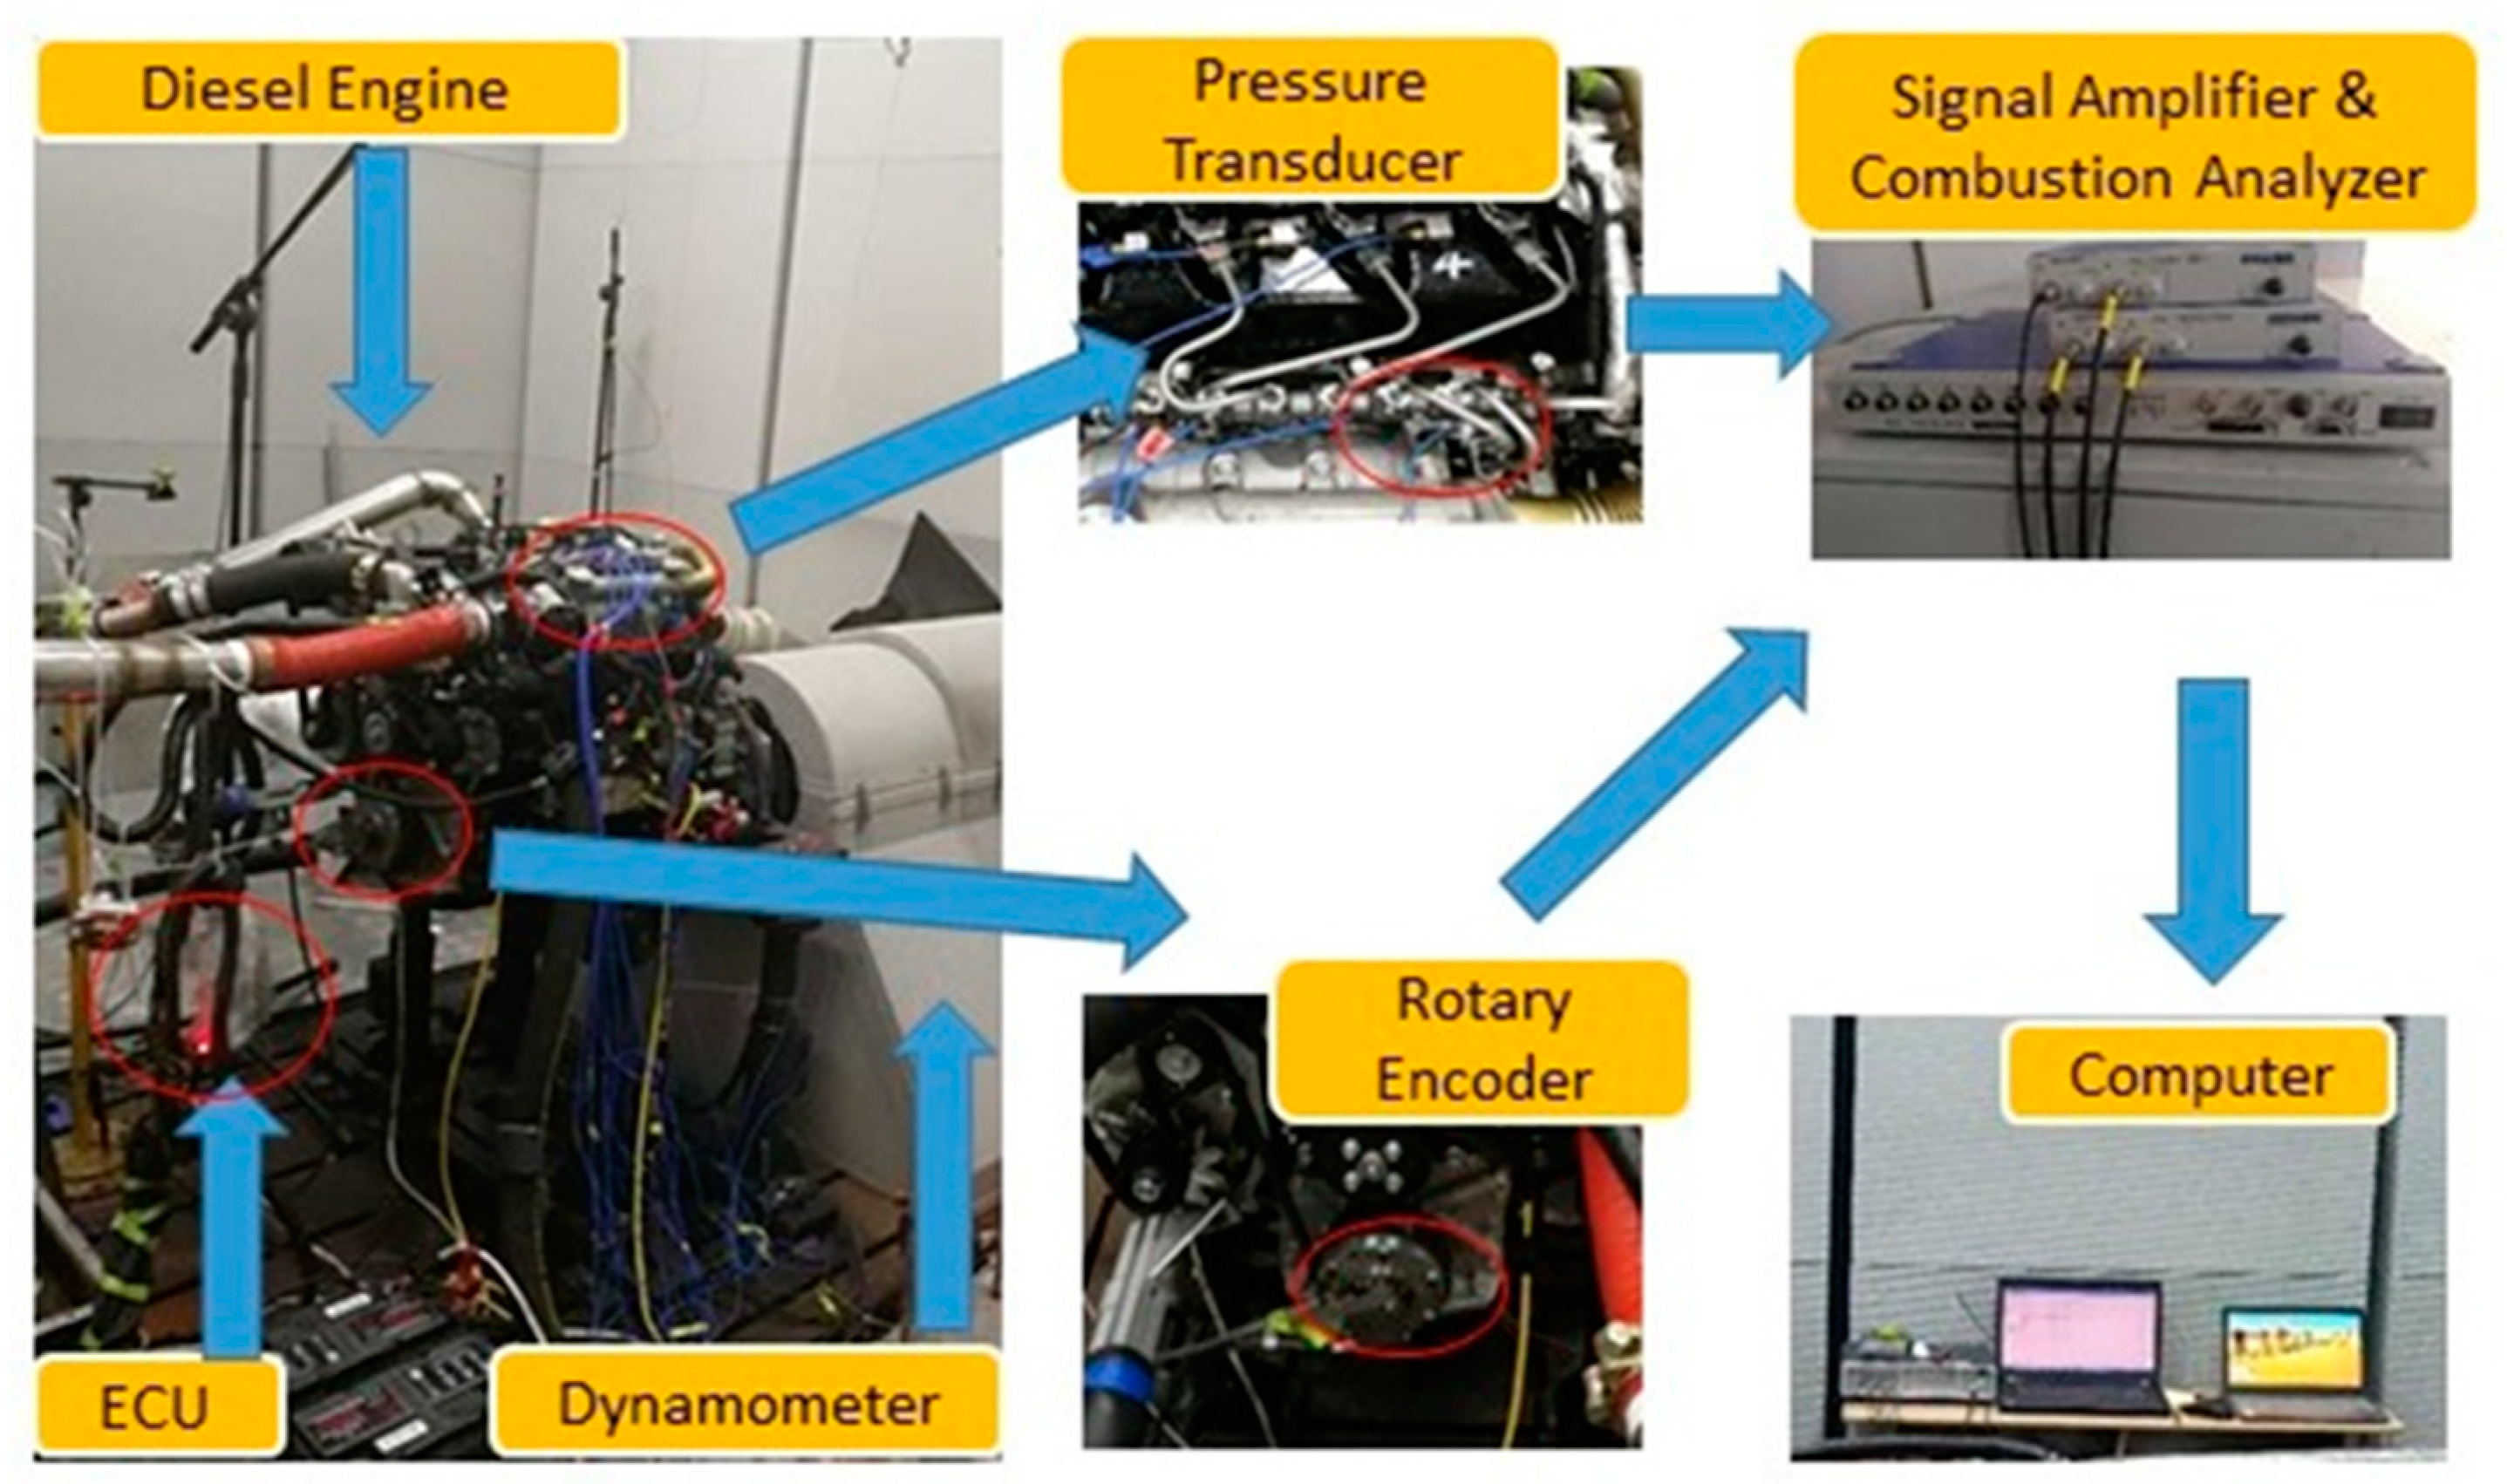
2. Experimental Setup and Working conditions

A four-cylinder DI diesel engine equipped with high pressure common rail fuel injection system and electronic control unit (ECU) is adopted for the experimental study, and detailed parameters are listed in Table 1. Experimental setup and equipment are shown in Figure 1. In the process of the experiment, the engine is joined to a current electrodynamometer, and the working condition of the engine can be continuously supervised and adjusted by the computer in anytime. The AVL combustion analysis system is utilized to record the in-cylinder pressure signal and analyze the combustion status of the diesel engine. The system composed of the cylinder pressure sensor, the crank-angle sensor, the charge amplifier, the signal acquisition and processing system. During the test, the sampling interval of in-cylinder pressure signal is 0.1 degree of the crank angle (°CA). The working conditions are adjusted by altering the ECU data through the combustion process calibration software INCA.
The working parameters studied in this paper include speed, load, rail pressure (RP, bar), main injection timing (MIT, °CA), pilot injection interval (PII, °CA), and pilot injection quantity (PIQ, mg). Detailed working conditions are presented in Table 2. During the test, the operation condition of the engine should remain stable, and the temperatures of the lubricating oil and coolant are set to maintain the standard operation area, which are separately 90–110 °C and 90–95 °C.

3. Signal Processing Methods

3.1. AGST Time-Frequency Analysis Method
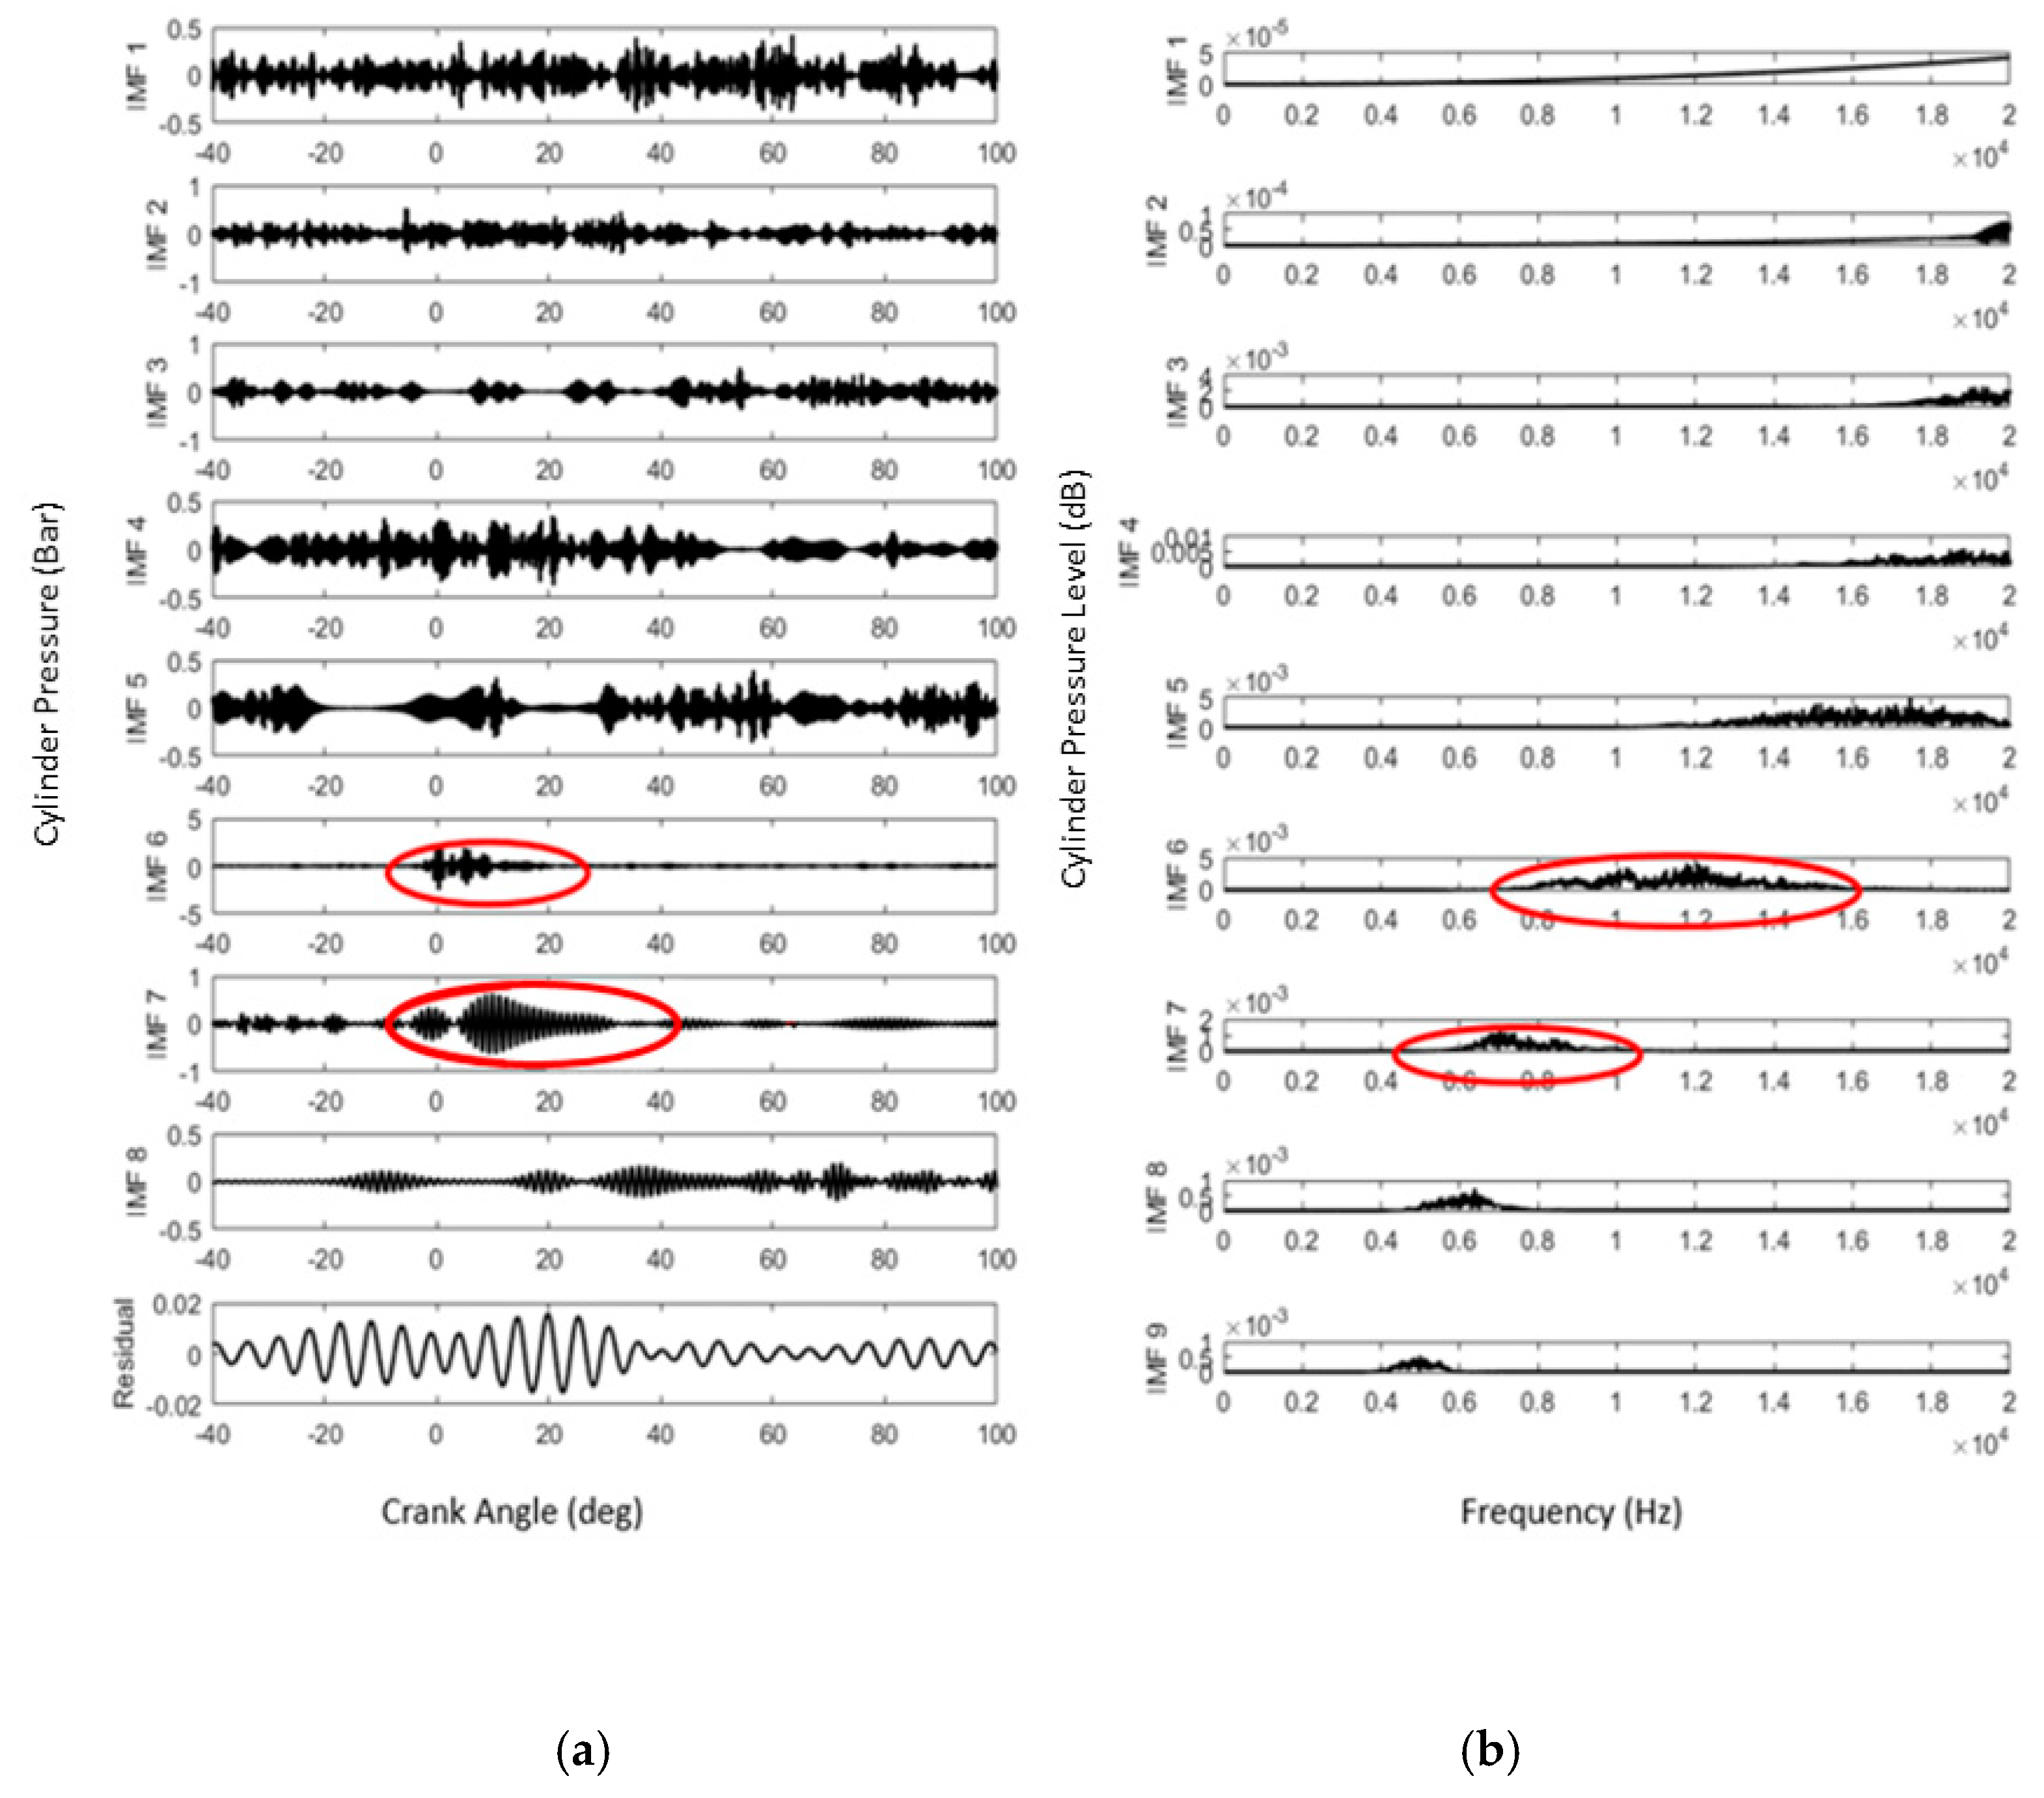
The adaptive generalized S transform (AGST) has already been proved to be effective for the time-frequency analysis of the multi-physical signals of IC engine, which can achieve good time-frequency resolution both in low and high frequency areas [20]. The main idea of AGST method can be shown as following.
The generalized S transform (GST) can be defined as [39]:
G S T ( τ , f , m ) = + x ( t ) | f | m 2 π exp ( ( τ t ) 2 f 2 m 2 ) exp ( i 2 π f t ) d t
where the parameter m is a variable to adjust the time-frequency resolution of GST. And the energy concentration of GST can be defined as [20]:
C M ( m ) = + + | G S T ( τ , f , m ) ¯ | d t d f
where G S T ( τ , f , m ) ¯ = G S T ( τ , f , m ) / + + | G S T ( τ , f , m ) | 2 d t d f is the energy standardized result of GST (τ, f, m). Therefore, the global optimum time-frequency resolution can be obtained as the minimum value of CM (m) is achieved [20]:
m 0 = arg min ( C M ( m ) )
Then, AGST can be defined as [20]:
A G S T ( t , f ) = G S T ( t , f , m 0 )
In order to verify the effectiveness of AGST method, the in-cylinder pressure signal under 1400 r/min full load condition is analyzed by GST and AGST separately, and the results are shown in Figure 2, where the crank angle of 0 degree is the compression top dead center (TDC) of this cylinder. It can be seen that the time-frequency distribution of the cylinder pressure obtained by AGST have a higher frequency resolution above 4 kHz, which is more suitable for the identification of high-frequency pressure oscillations.

3.2. TVF-EMD Method

The TVF-EMD method is an effective method for decomposing complex multivariate signals into basic wave curve. It is already used in fault diagnosis of mechanical signals, but there are none cases in the application of cylinder pressure signals. The work of TVF-EMD can be divided into the following two steps:
(1) Find out the local cut-off frequency:
Firstly, a time-varying cut-off frequency filter is adopted as β-spline approximation filter. The signal in this β-spline is defined as [36]:
g m n ( t ) = k = c ( k ) β n ( t / m k )
where βn (t) is the β-spline function of order n; m is the step size of the knot sequence; c(k) is an important factor and the approximation result depends on c(k). β-spline approximation can be considered as a special form of low-pass filtering, and the cut-off frequency is depending on the step size of knot m, and the detail formula derivation can be referred to the reference [36].
(2) Stopping criterion
Mathematically, a multi-component signal can be expressed as a combination of two signals [36]:
z ( t ) = A ( t ) e j φ ( t ) = a 1 ( t ) e j φ 1 ( t ) + a 2 ( t ) e j φ 2 ( t )
So that a relative criterion is defined as [36]:
θ ( t ) = B L o u g h l i n ( t ) ϕ a v g ( t )
where B L o u g h l i n ( t ) and ϕ a v g ( t ) are the weighted average instantaneous frequency and the Loughlin instantaneous bandwidth respectively, which can be calculated as follows [36]:
ϕ a v g ( t ) = a 1 2 ( t ) φ 1 ( t ) + a 2 2 ( t ) φ 2 ( t ) a 1 2 ( t ) + a 2 2 ( t )
B L o u g h l i n ( t ) = [ a 1 2 ( t ) + a 2 2 ( t ) ] a 1 2 ( t ) + a 2 2 ( t ) + a 1 2 ( t ) a 2 2 ( t ) ( ϕ 1 ( t ) ϕ 2 ( t ) ) 2 ( a 1 2 ( t ) + a 2 2 ( t ) ) 2
When θ ( t ) decreases, the bandwidth of the signal reduces. Given a threshold Ԑ, a signal can be regarded as local narrow-band, when θ ( t ) ε . In this paper, the bandwidth threshold is set as ε = 0.1 , in order to obtain a high-frequency oscillation concentrated area with a bandwidth of about 1000–1500 Hz.

3.3. Experimental Study Using EEMD and Original TVD-EMD

The time-frequency distribution of the 1400 r/min full load cylinder pressure in Section 3.1 are zoomed near the top dead center (TDC) to show the characteristics of high-frequency oscillation in Figure 3, where 0 °CA represents TDC point. It can be seen that the high-frequency oscillations are mainly concentrated on two red circled regions, which are 8–13 and 6–8 kHz, and arise within ‒5–20 and ‒5–40 °CA in the time-frequency distribution (TFD), respectively.
Firstly, the original cylinder pressure signal of 1400 r/min full load is decomposed by EEMD, the ensemble time is set as 100, the results of angle domain and frequency domain are shown in Figure 4a,b, respectively. It is clear that the high-frequency oscillation components highlighted in Figure 3 cannot be extracted effectively by the EEMD method. This is because uniform spline approximation is used as a filter in the EEMD method, which is not completely adaptive, resulting in modal aliasing.
Secondly, the original cylinder pressure signal of 1400 r/min full load is decomposed by TVF-EMD. The results in Figure 5a,b showed that the in-cylinder pressure signal cannot be decomposed into series of IMFs because of the steep characteristics.

3.4. Cyclic Average TVF-EMD Method

Since in-cylinder pressure signal is so steep that cannot be directly separated by TVF-EMD, it is necessary to pre-process the cylinder pressure signal. According to the reference [19], the in-cylinder pressure signal under 1000 Hz can be defined as pseudo-motored pressure, which is not related to high-frequency pressure oscillation. Therefore, a 1000 Hz Butterworth high pass filter is recommended for use to obtain the smoothest frequency response curve of in-cylinder pressure signal. An original pressure signal and a filtered pressure signal in angle domain and frequency domain of 1400 r/min full load are shown in Figure 6a,b. It can be obtained from the spectrum that the in-cylinder pressure below 1000 Hz is significantly suppressed to about 110 dB after filtering, and high frequency characteristics are not destroyed in Figure 6b.
However, the filtered cylinder pressure signal is still a highly steep signal, and when performing TVF-EMD decomposition, there will still be some timescales lost, which is easy to cause decomposition confusion, also called modal mixture. Inspired by the idea of EEMD [33], adding additional white noise will make signal evenly distributed over the entire time-frequency space, and signal regions of different scales will be automatically mapped to appropriate scales related to background noise. The default white noise amplitude is one-tenth of the maximum value of the original filtered cylinder pressure signal. Figure 7a,b shows the comparison charts of a 1000 Hz high-pass filtered cylinder pressure signal and the mixed signal after adding white noise. The auto-power spectrum of white noise is controlled at 40 dB, while the auto-power spectrum of high frequency oscillation component is above 140 dB. Therefore, the adding of white noise has almost no effect on the high frequency oscillation energy.
The modified idea is to perform the TVF-EMD decomposition multiple times by adding the white-assisted noise signal, and is named as cyclic average TVF-EMD method. The steps for decomposing the cylinder pressure using the cyclic average TVF-EMD method are shown in Figure 8.
The decomposition accuracy of the cyclic average TVF-EMD depends on the cyclic number, and it is expected to obtain better decomposition result with higher cyclic number. Then, the cyclic average TVF-EMD method is used to decompose the same signal as above and the cyclic number is set at 100, as shown in Figure 9. As shown in Figure 3, the high-frequency oscillations are mainly concentrated on the two red circled regions, which are 8–13 kHz and 6–8 kHz, and arise within ‒5–20 °CA and ‒5–40 °CA in the TFD, so that IMF6 and IMF7 are high frequency oscillation components in red circled in Figure 9. If the cyclic number is too large, the calculation efficiency will be seriously reduced. By defining the protrusion rate of the high frequency oscillation as the cut-off condition of the cyclic number.

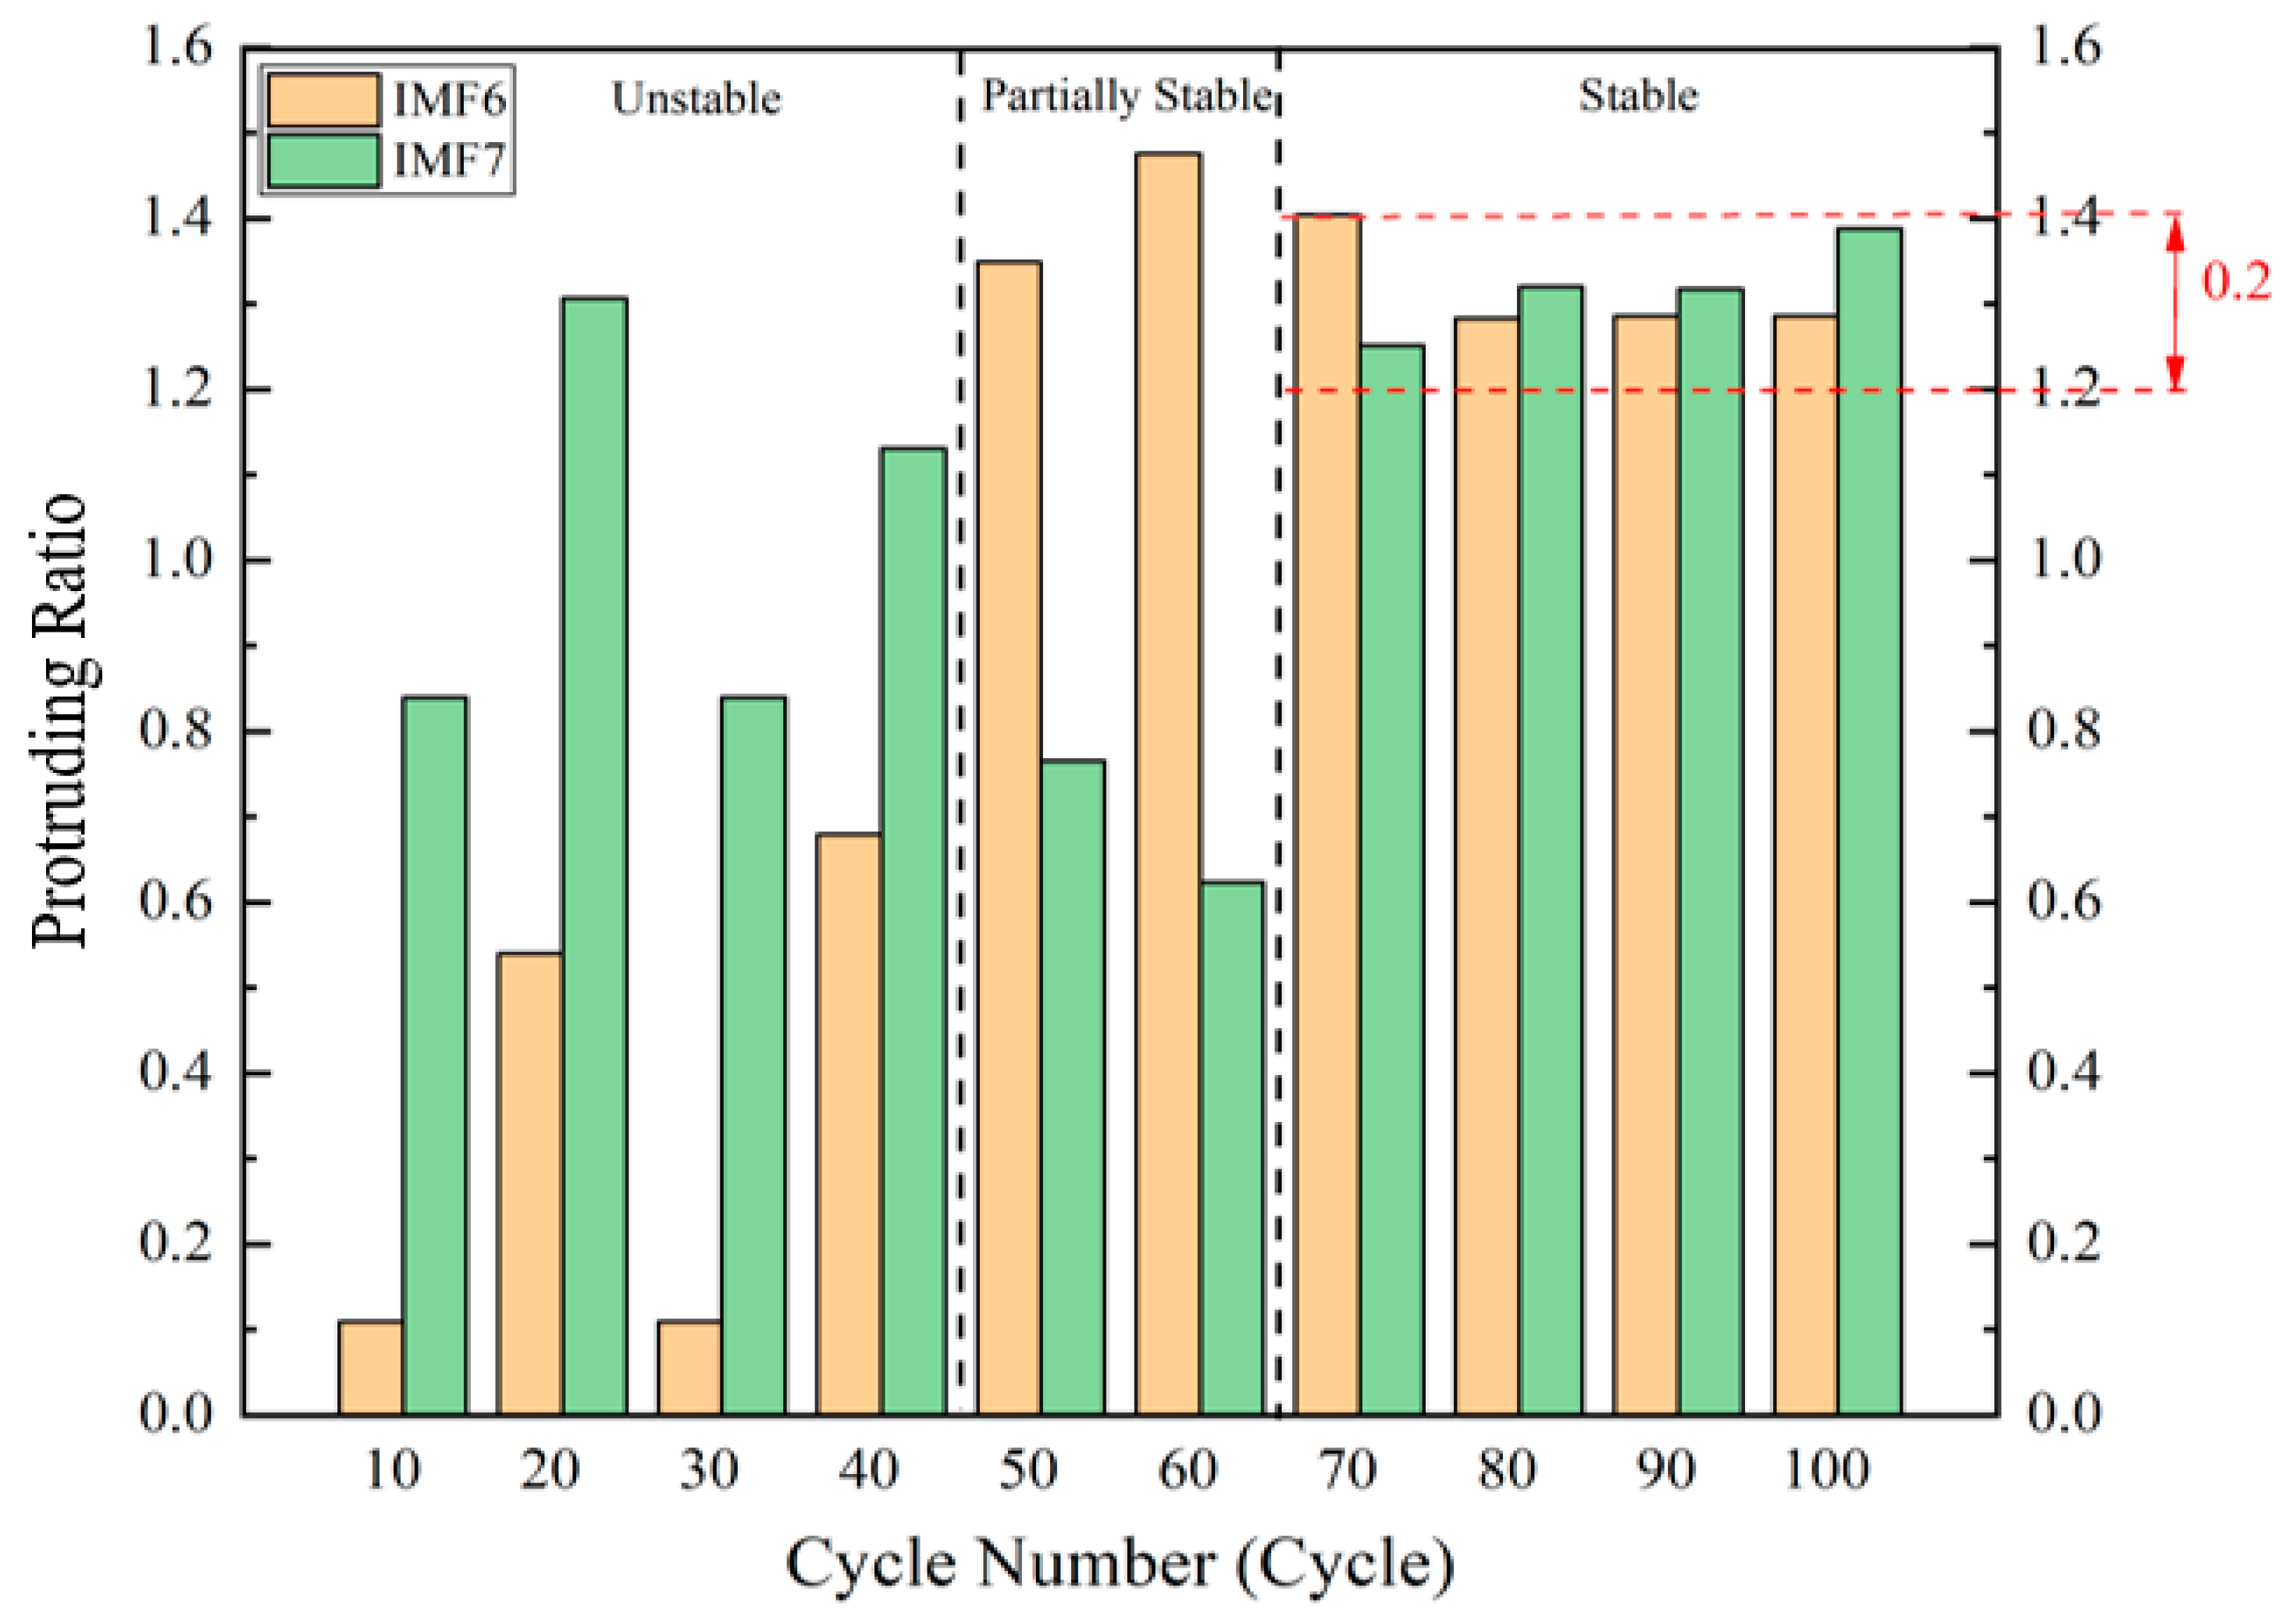
3.5. Adaptive Cyclic Average TVF-EMD Method

The computational efficiency of cyclic average TVF-EMD is far less than original TVF-EMD and EEMD. As a result, a Matlab parallel computing program is used to evaluate the computational efficiency of cyclic average TVF-EMD (the same signal as above) with different cyclic number. The calculations are carried out on a high-speed workstation with a detailed configuration as listed in Table 3. It is clear that when cyclic number increases from 10 to 100 times, the memory usage increases gradually from 20 to 30 GB, however, and the calculation time increases sharply from 58 to 662 seconds. Therefore, under the premise of ensuring the decomposition effect of IMFs, a smaller cyclic number is preferred.
In order to decompose the in-cylinder signal accurately with the minimum cyclic number, a protruding ratio (PR) parameter is proposed to choose the proper cyclic number adaptively. According to the time-frequency characteristics of high-frequency pressure oscillations discussed in Section 3.3, it could be confirmed that -5–40 °CA is the main occurrence time of the high-frequency oscillations. Therefore, the protruding ratio (PR) of the IMFs (IMF6 and IMF7 in this case) containing high-frequency oscillation components can be defined as:
P R IMF = 5 40 ( I M F n ) 2 d θ / { 360 360 ( I M F n ) 2 d θ 5 40 ( I M F n ) 2 d θ }
The protruding ratio (PR) comparison by cyclic average TVF-EMD with different cyclic number can be obtained in Figure 10. Obviously, for certain IMF with high-frequency oscillation component, the energy in high-frequency oscillation occurrence crank angle region should be larger than the other region, so that the PR should larger than 1. The results of PR can be divided into three zone (Unstable, Partially Stable and Stable) to judge the stability of cyclic average TVF-EMD. When cyclic number is less than 50 cycles (Unstable zone in Figure 10), the PR of both IMF6 and IMF7 are unstable and the values are less than 1. When averaging number of cycle is 50 or 60 cycles (Partially Stable zone in Figure 10), only the PR of IMF6 is close to stable, while PR of IMF7 is still less than 1 and unstable. After 70 cycles (Stable zone in Figure 10), PR of both IMF6 and IMF7 are stable in the range of 1.2 to 1.4. Therefore, in order to obtain stable high frequency oscillation component with minium computational amount, the cyclic number can be determined adaptively when PR is larger than 1 and the variation range is less than or equal to ≤0.2.
Using cycle average TVF-EMD method, the in-cylinder pressure signal at a speed of 1400 r/min can be decomposed. The minium cyclic number with high efficiency and stable performance is 70. In order to verify the proposed adaptive method, a comparison of IMF components decomposed by cyclic average TVF-EMD with three cyclic numbers (10, 50, 70 cycles) in crank angle domain and frequency domain are shown in Figure 11 and Figure 12, respectively.
As shown in Figure 11a, after adding the white noise, the decomposed IMF component by adaptive cyclic average TVF-EMD is inevitably affected by false modalities at 10 cyclic number, the oscillation components in IMF6 and IMF 7 are aliased within of −5–40 °CA (blue circled), which is different from the original signal and time-frequency analysis results. As shown in Figure 11b, when the cyclic number increases to 50, the high-frequency oscillation component within −5–20 °CA shown in Figure 3 can be obtained in IMF6, while another high-frequency component within −5–40 °CA is split in IMF7 (blue circled), so the decomposition is still not stable. As shown in Figure 11c, when the cyclic number increases to 70, the spurious amplitude fluctuation caused by adding white noise can be reduced obviously, and the high-frequency oscillation components can be decomposed accurately in IMF6 and IMF7. In addition, the decomposition performance is quite similar to the 100 cyclic number result shown in Figure 9, which also verifies the cyclic process has reached stability.
As shown in Figure 12a, when the cyclic number is 10, IMF 6 and IMF 7 are mixed in 8–12 kHz affected by modal aliasing. After 50 cycles, the two high-frequency oscillation regions (IMF 6 and IMF7) have not changed too much, as shown in Figure 12b,c (circled). However. the amplitude-frequency characteristics of 70 cyclic number results are closer to the time-frequency analysis.
Therefore, the whole steps for extracting the in-cylinder high-frequency pressure oscillation by adaptive cyclic average TVF-EMD are shown in Figure 13.

3.6. Evaluation Indexes Definition

In order to investigate the influence of different working parameters on the frequency and energy characteristics of in-cylinder high-frequency pressure oscillation quantitatively, we define three evaluation indexes, namely center frequency, normalized frequency, normalized frequency. - After the high-frequency oscillation component is decomposed by adaptive cyclic average TVF-EMD, the energy can be obtained by integrating the IMF component in the angle domain:
E IMF n = 360 360 ( IMF n ) 2 d φ
where IMFn represents the n IMF component dominated by high-frequency oscillation in the angular domain and E IMF n represents its energy. φ represents the crank angle, and the integral range is an engine working cycle (−360 °CA to 360 °CA).
Therefore, the center frequency of the n IMF component dominated by high-frequency oscillation can be obtained by the following formula in the frequency domain:
i = 1 f r e q _ c e n t e r ( F ( IMF n ) ) 2 d f = 1 2 k = 1 20000 ( F ( IMF n ) ) 2 d f
where freq_center represents the center frequency of oscillation energy, the left side of the equation represents the oscillation energy in the frequency domain from 0 Hz to center frequency. The right side of the equation is half of the total energy in the frequency domain, and the bandwidth is 0 to 20 kHz.
It can be seen from Figure 3, there are two high-frequency oscillation energy concentration regions, which are 8–13 kHz and 6–8 kHz, respectively. In order to obtain a clear relationship between the combustion parameters and oscillation energy, it is necessary to average the center frequency and normalize the oscillation energy. The center frequency and energy of each IMF component dominated by high-frequency oscillation can be averaged and normalized by the following formula, respectively:
E n o r m a l i z e d = E i i = 1 i = n E i 100 %
f a v e r a g e = i = 1 i = n E i _ n o r m a l i z e d f i n
where Ei and E normalized represent the high-frequency oscillation energy of one IMF component and normalized high-frequency oscillation energy, respectively. f i , f a v e r a g e and n represent the center frequency of each pressure oscillation component, average center frequency, and the number of high-frequency oscillation IMF components, respectively.
Therefore, under 1400 r/min full load condition, the center frequency, normalized energy of the two high-frequency oscillation IMFs and the final average center frequency as shown can be obtained in Table 4. The center frequency of the two high-frequency oscillation components are 11,013 and 6755 Hz. Since the normalized energy of the former component is dominant (96%), the average center frequency of the high-frequency oscillations under this condition can reach 10,841 Hz.

4. Parametric Study and Discussion of High-frequency Pressure Oscillation

4.1. Influence of Engine Speed on High-frequency Pressure Oscillation

For the diesel engine running under different working conditions, the density, temperature, pressure and fluid movement state of the gas mixture in the cylinder mixture are different due to the difference of the intake air amount, fuel injection amount and fuel injection parameters. The physical properties of the internal gas are also different.
The high-frequency pressure oscillation components under full load condition with a speed of 1200, 1400, 1600, 1800, and 2000 r/min are extracted by the proposed adaptive cyclic average TVF-EMD method. It can be seen from Figure 14 that the average center oscillation frequency and normalized oscillation energy vary with the engine speed under full load condition. As the speed increases, the average center frequency and normalized energy of the high-frequency oscillations rise first, while after reaching a peak at 1600 r/min both of the evaluation indexes decrease rapidly.
Three characteristic speeds are selected for detailed comparison, among which 1200, 1600 and 2000 r/min are the lowest speed, maximum torque speed and highest speed during the test, respectively. The cylinder pressure at three characteristic speeds in angle domain shown in Figure 15a. As the engine speed increases, the peak pressure in the cylinder first increases and then decreases, and the oscillation component above 1000 Hz also increases first and then decreases. From the spectrum of the in-cylinder pressure, as shown in Figure 15b, the pressure oscillation energy increases first and then decreases with the increase of the engine speed.
The in-cylinder pressure time-frequency distribution at engine speeds of 1200, 1600, and 2000/min under full load conditions are shown in Figure 16a–c, respectively. The comparison shows that the frequency ranges of the dominant energy distribution of the pressure oscillations at three speeds are not the same. The pressure oscillation energy of 1200r/min is mainly distributed in the frequency range of 8–12 kHz and is weak at other frequencies. The pressure oscillation energy of 1600 r/min and 2000 r/min are mainly distributed in the frequency range of 8–12 kHz and 5–7 kHz, and pressure oscillation lasts longer at the higher speed.
The detailed center frequency and normalized energy characteristics of high-frequency pressure oscillation of the three speeds are shown in Table 5. It can be clearly seen that when the speed increases, the dominant center frequency of the pressure oscillation will increase to more than 10 kHz with peak normalized energy at 1600 r/min, and then decreased to lower than 6 kHz with lowest normalized energy at 2000 r/min. In addition, the pressure oscillations above 8 kHz almost disappear at 2000 r/min.
It is clear that engine speed has great impact on high-frequency oscillation of diesel engine in Figure 16 and Table 5. The normalized energy and average center frequency result in the peak value at medium high engine speed (1600 r/min). Neither low speed nor high speed are conducive to the generation of high-frequency oscillation. On the one hand, excessively low speed corresponds to mild combustion process, and suppresses the occurrence of high-frequency oscillation. On the other hand, excessively high speed greatly reduces the cycle interval, and also suppresses high-frequency oscillation.

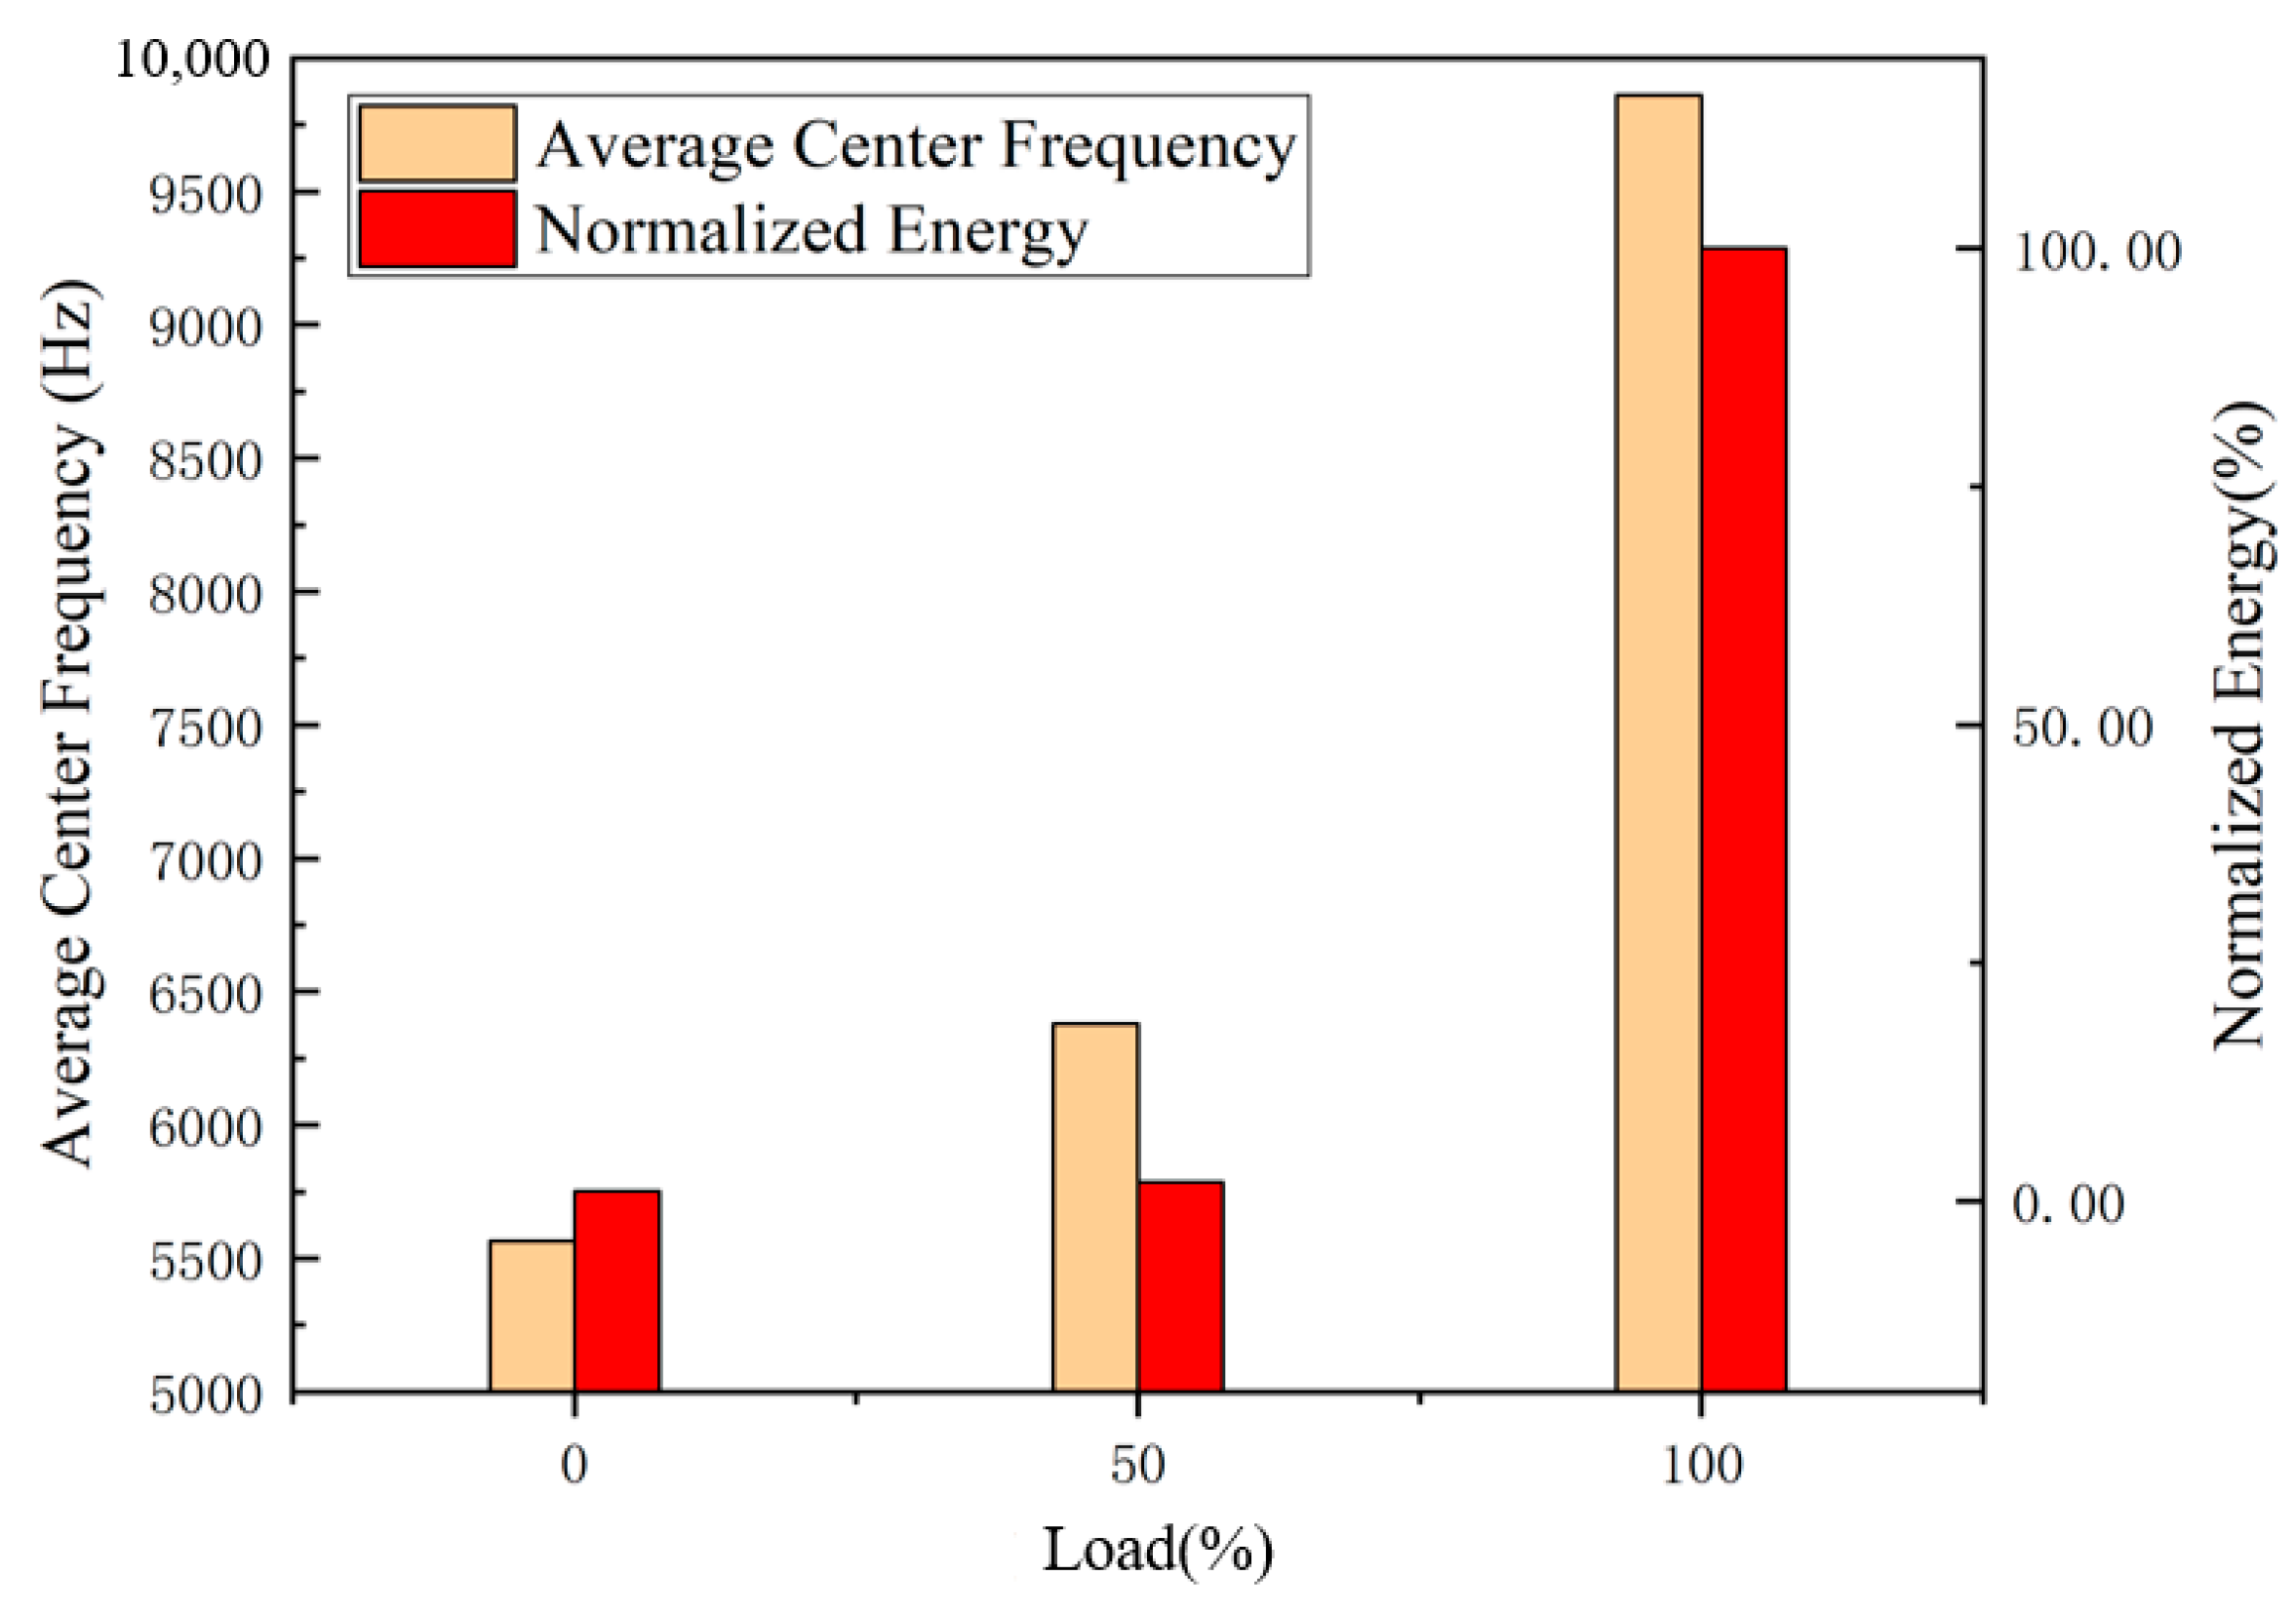
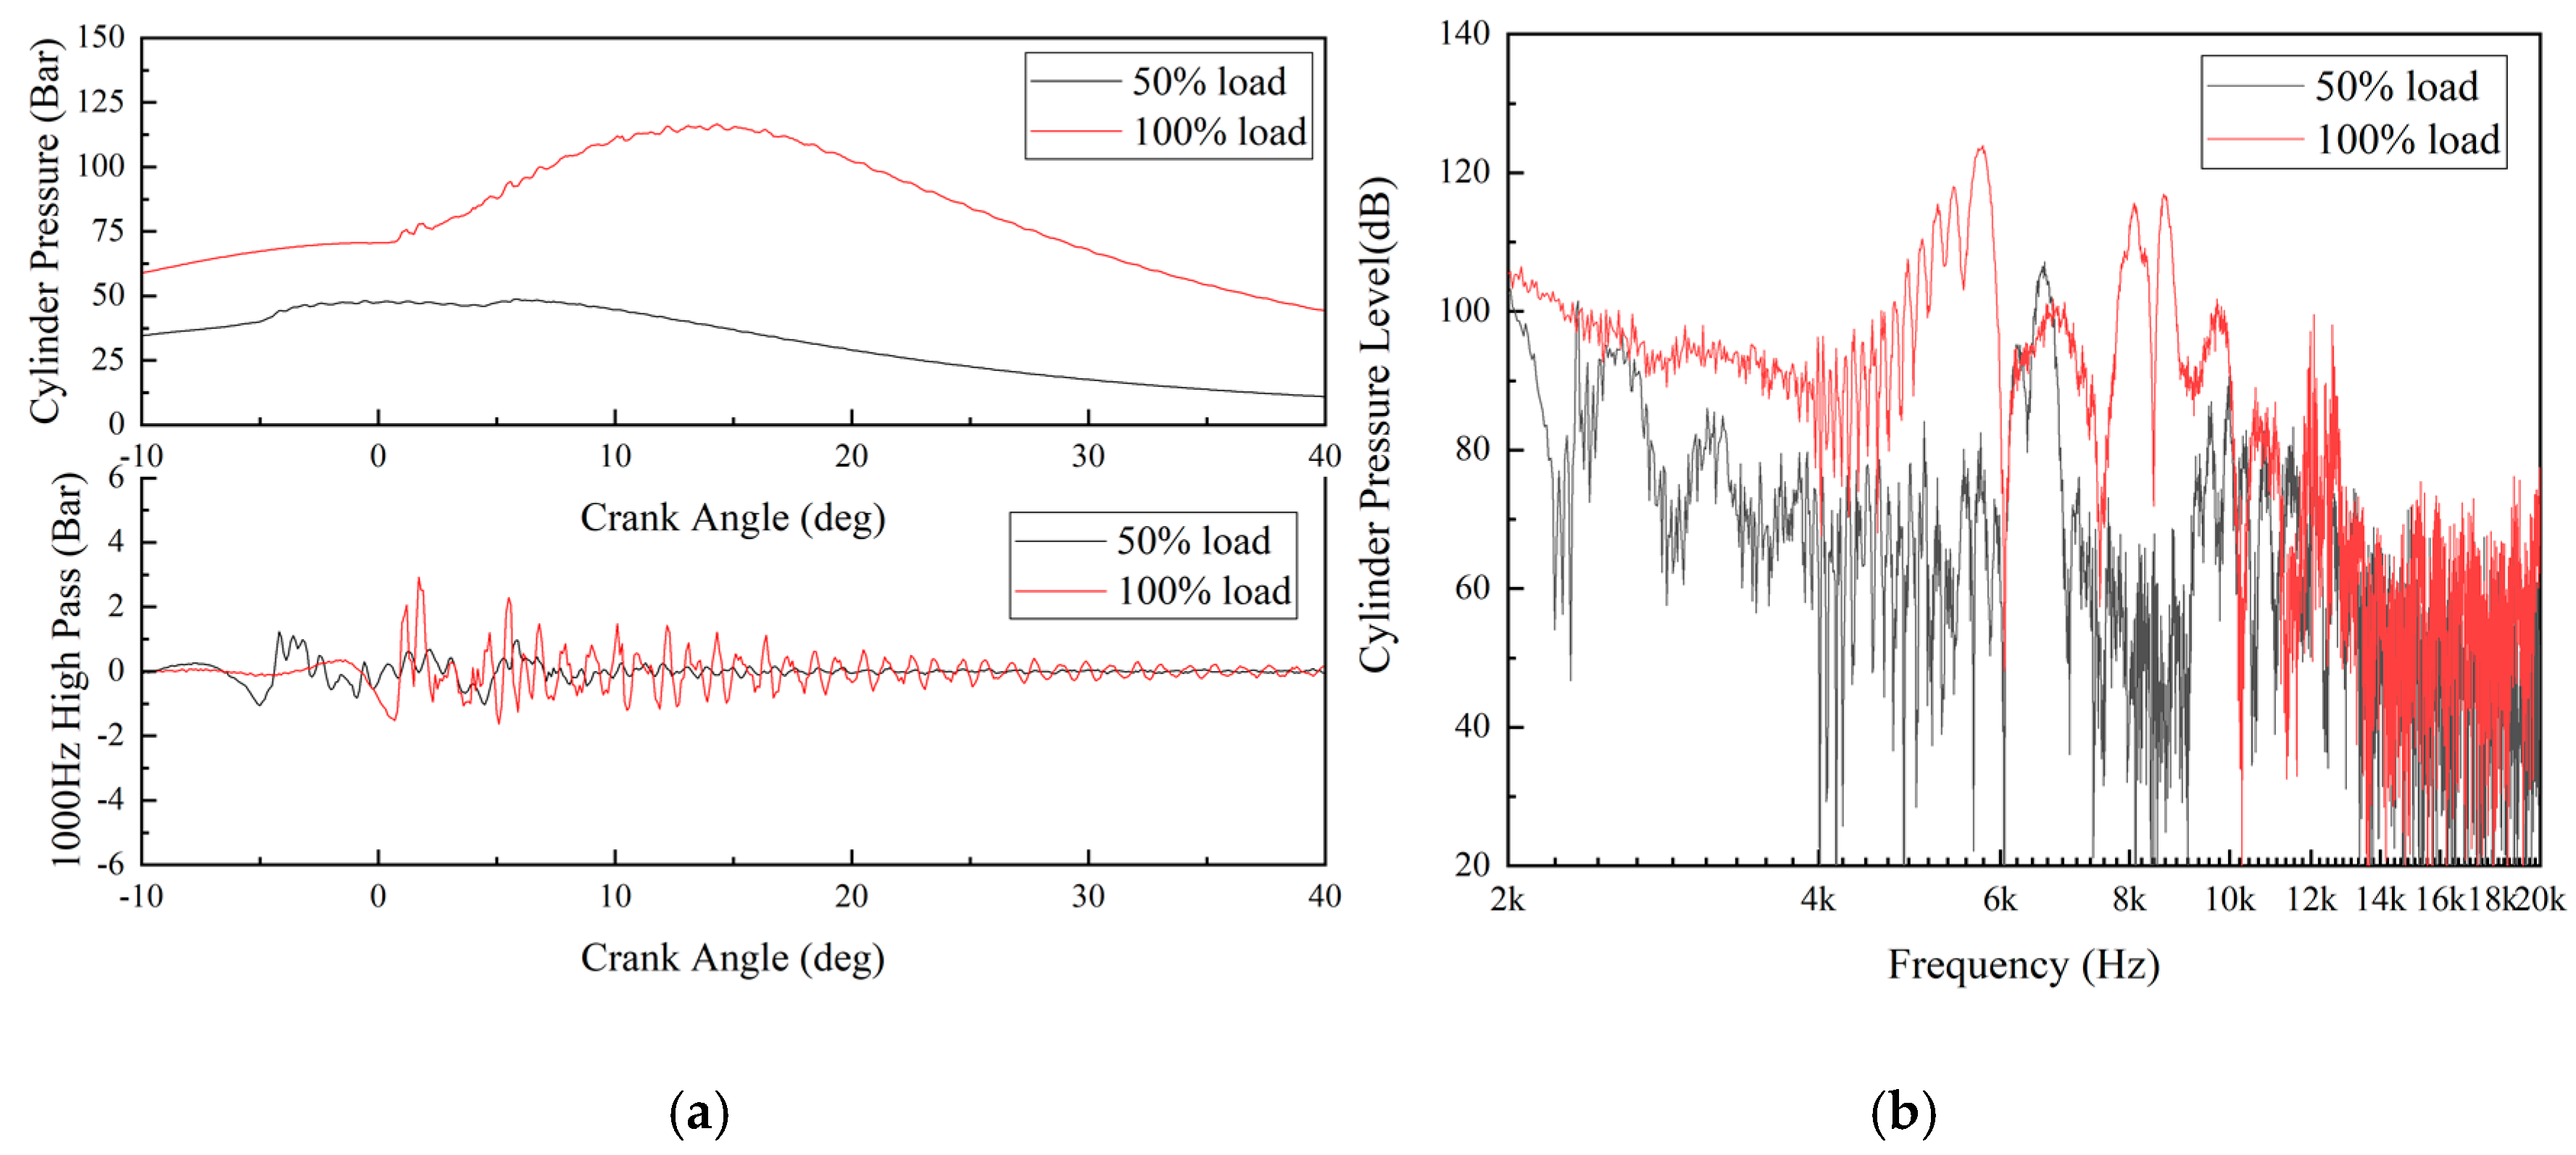
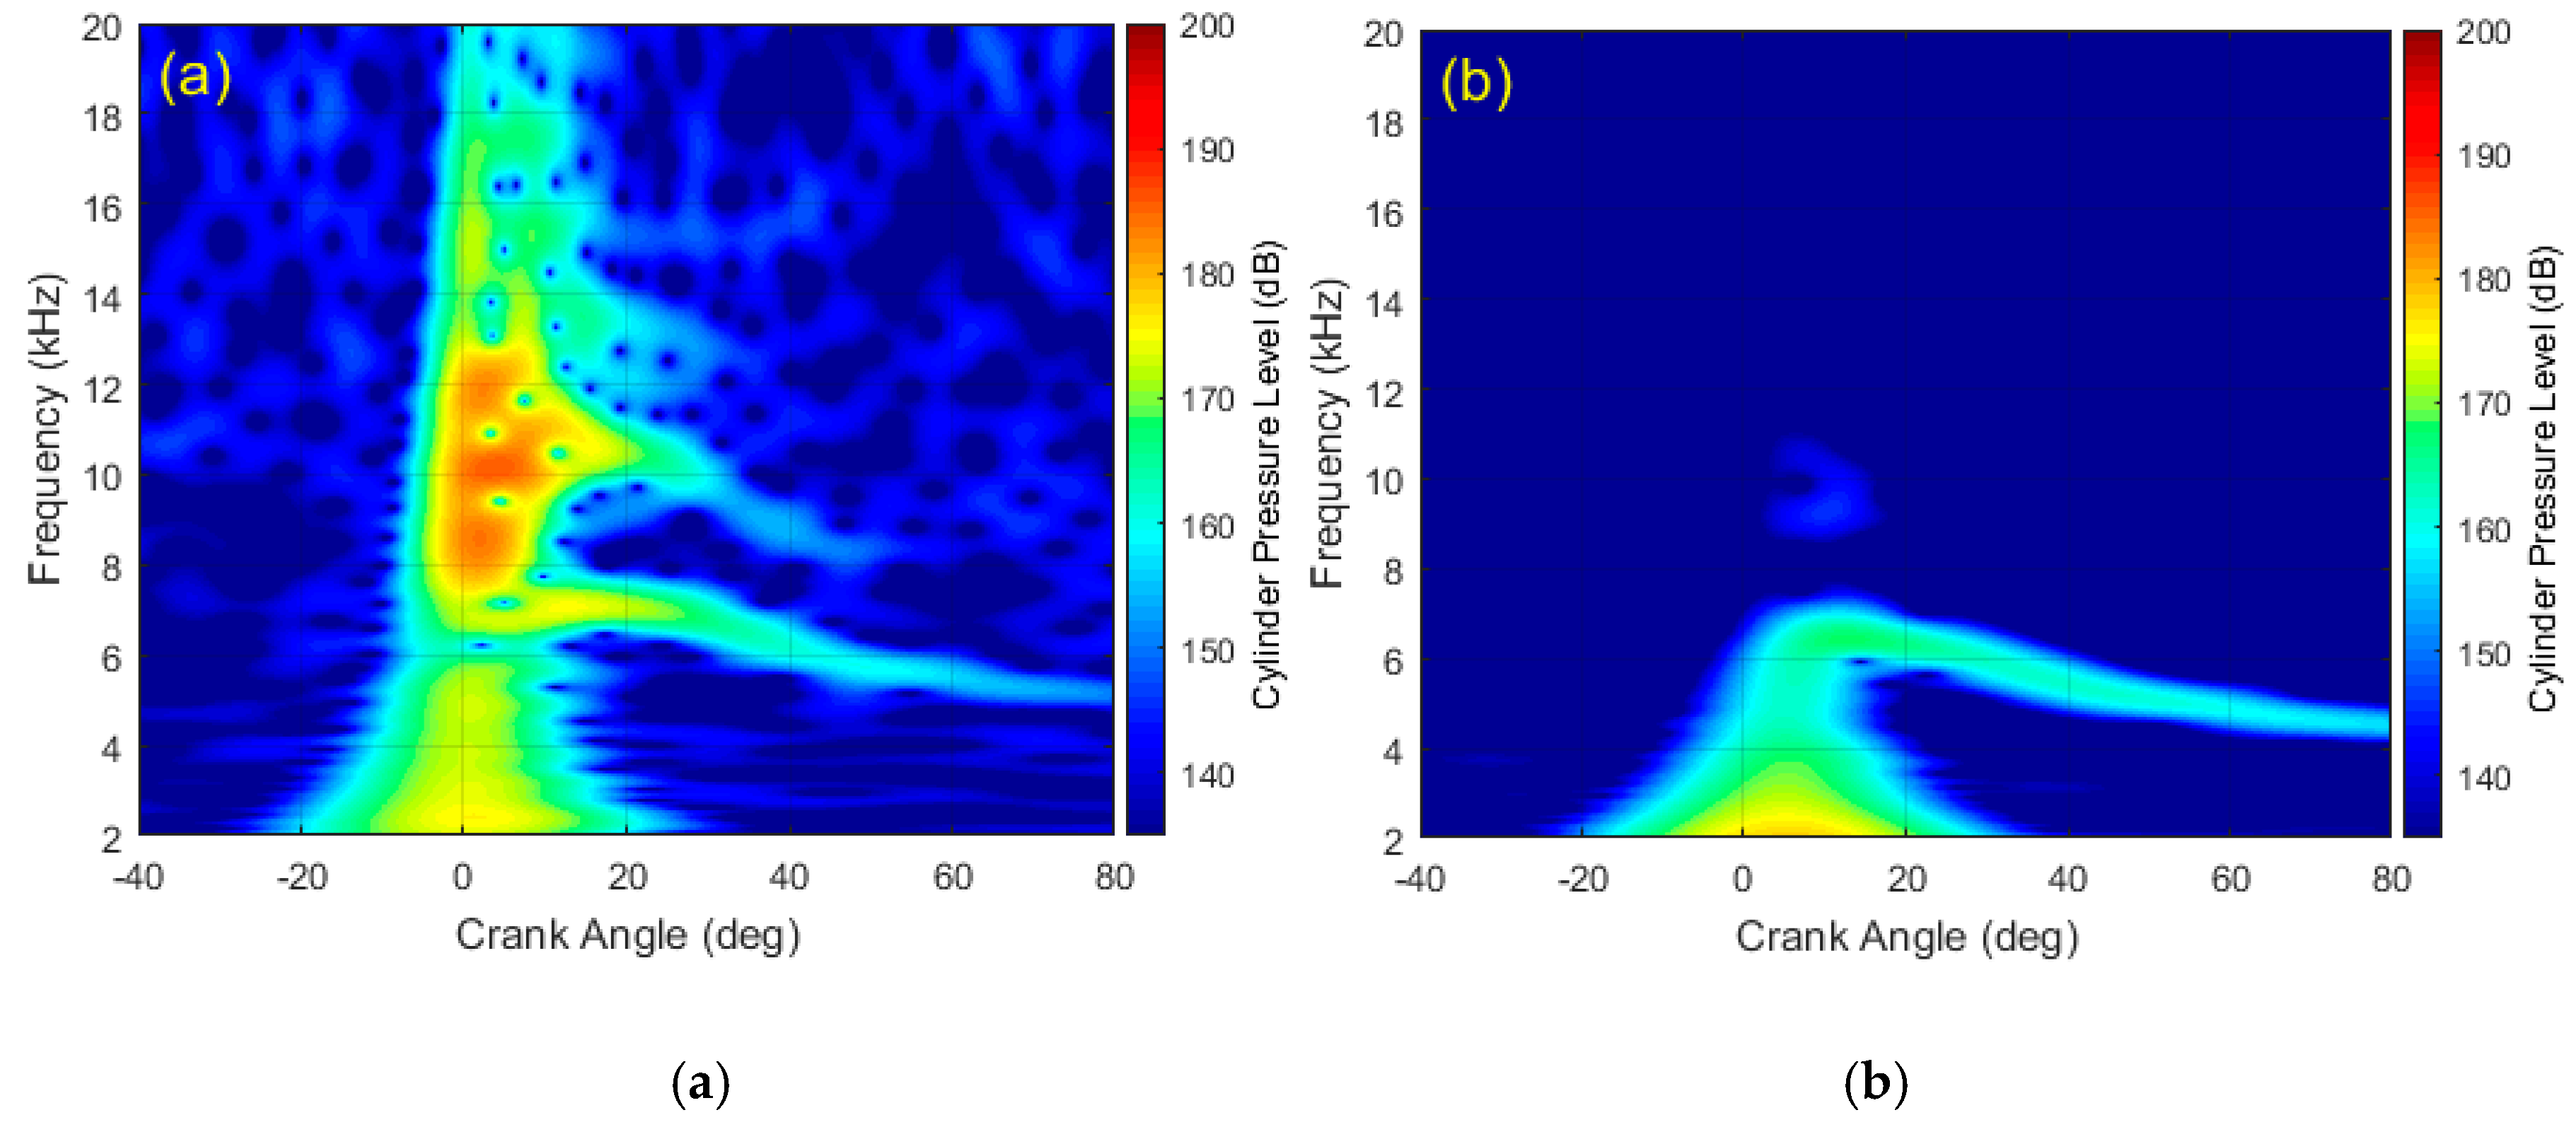
4.2. Influence of Load on High-frequency Pressure Oscillation

For the diesel engine operated under different loads, the amount of oil injected into the cylinder is greatly different, resulting in a large difference in the length of the combustion process, gas temperature and high-frequency pressure oscillation. Taking 1200 r/min as an example, the high-frequency pressure oscillation components under 0, 50 and 100% loads are extracted by the proposed adaptive cyclic average TVF-EMD method, respectively. It can be seen from Figure 17 as the load increases, the average center frequency and normalized energy of the pressure oscillation increase accordingly.
Since the energy of pressure oscillation is quite low at 0% load condition, the results of 50% load and 100% load conditions are chosen for the further analysis. From the pressure field of the cylinder, as shown in Figure 18a, under full load condition, not only the peak pressure in the cylinder is much larger than that under the half load condition, but also the pressure oscillation near the peak is very severe. From Figure 18b of the in-cylinder pressure spectrum, it can be seen that the pressure oscillation amplitude of the full load condition above 4 kHz is significantly larger than the half-load condition, especially in the frequencies higher than 6 kHz.
It can be clearly seen in Figure 19a,b that the time-frequency characteristics of the pressure oscillation under full load and 50% load conditions are quite different. From the perspective of the frequency domain, the pressure oscillation energy under full load condition is mainly located at 8–12 kHz and 6–7 kHz, while the oscillation energy under half load condition is much lower and the 8–12 kHz component almost disappears. From the perspective of time domain, the oscillation duration of the full load condition in the range of 8–12 kHz is significantly longer than the half load condition, while the oscillations duration of 6–7 kHz is almost the same.
The detailed center frequency and normalized energy characteristics of in-cylinder pressure oscillation of the two loads are shown in Table 6. When the load increases the pressure oscillation energy will increase significantly, and center frequency of the dominant oscillation component will move from 6340 Hz of 50% load to 8800 Hz and 10,440 Hz of 100% load, an average center frequency will increase obviously.
As the load change results shown in Figure 19 and Table 6, the frequency and energy characteristic of high-frequency oscillation are closely related to engine load. The increase in load brings more intense fluctuations of temperature and pressure. As a consequence, it is beneficial for the generation of high-frequency oscillation.

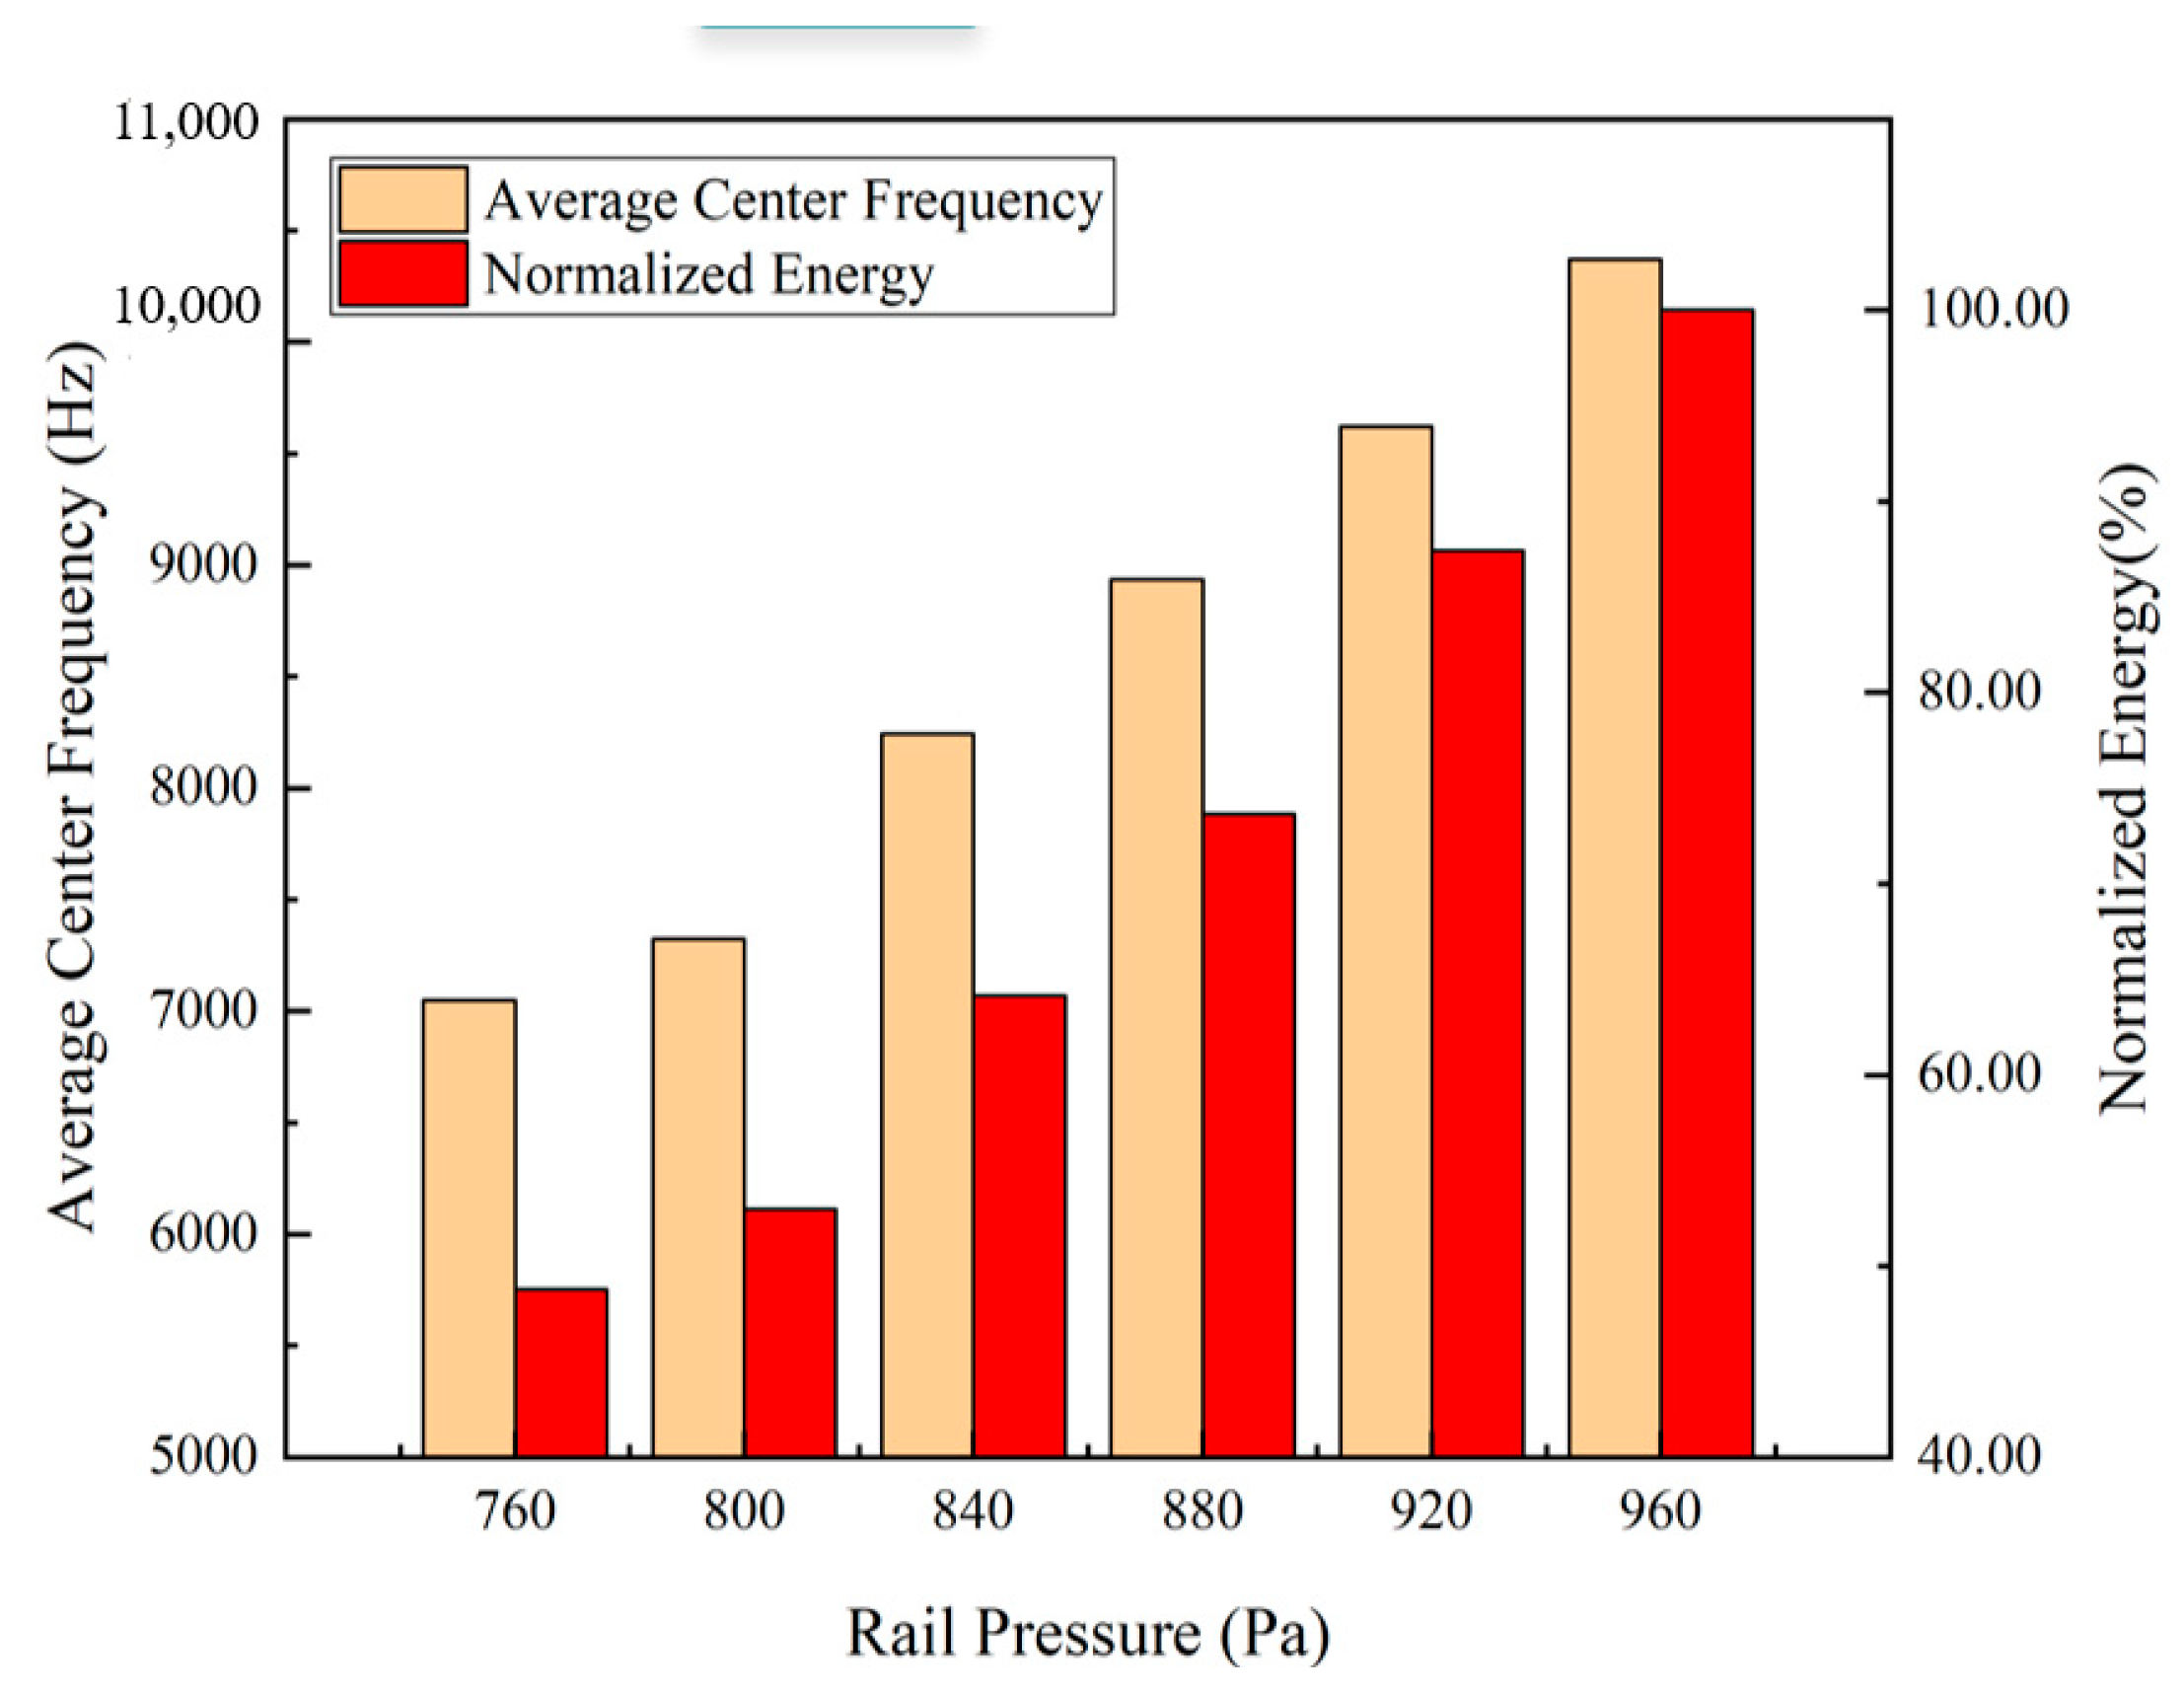
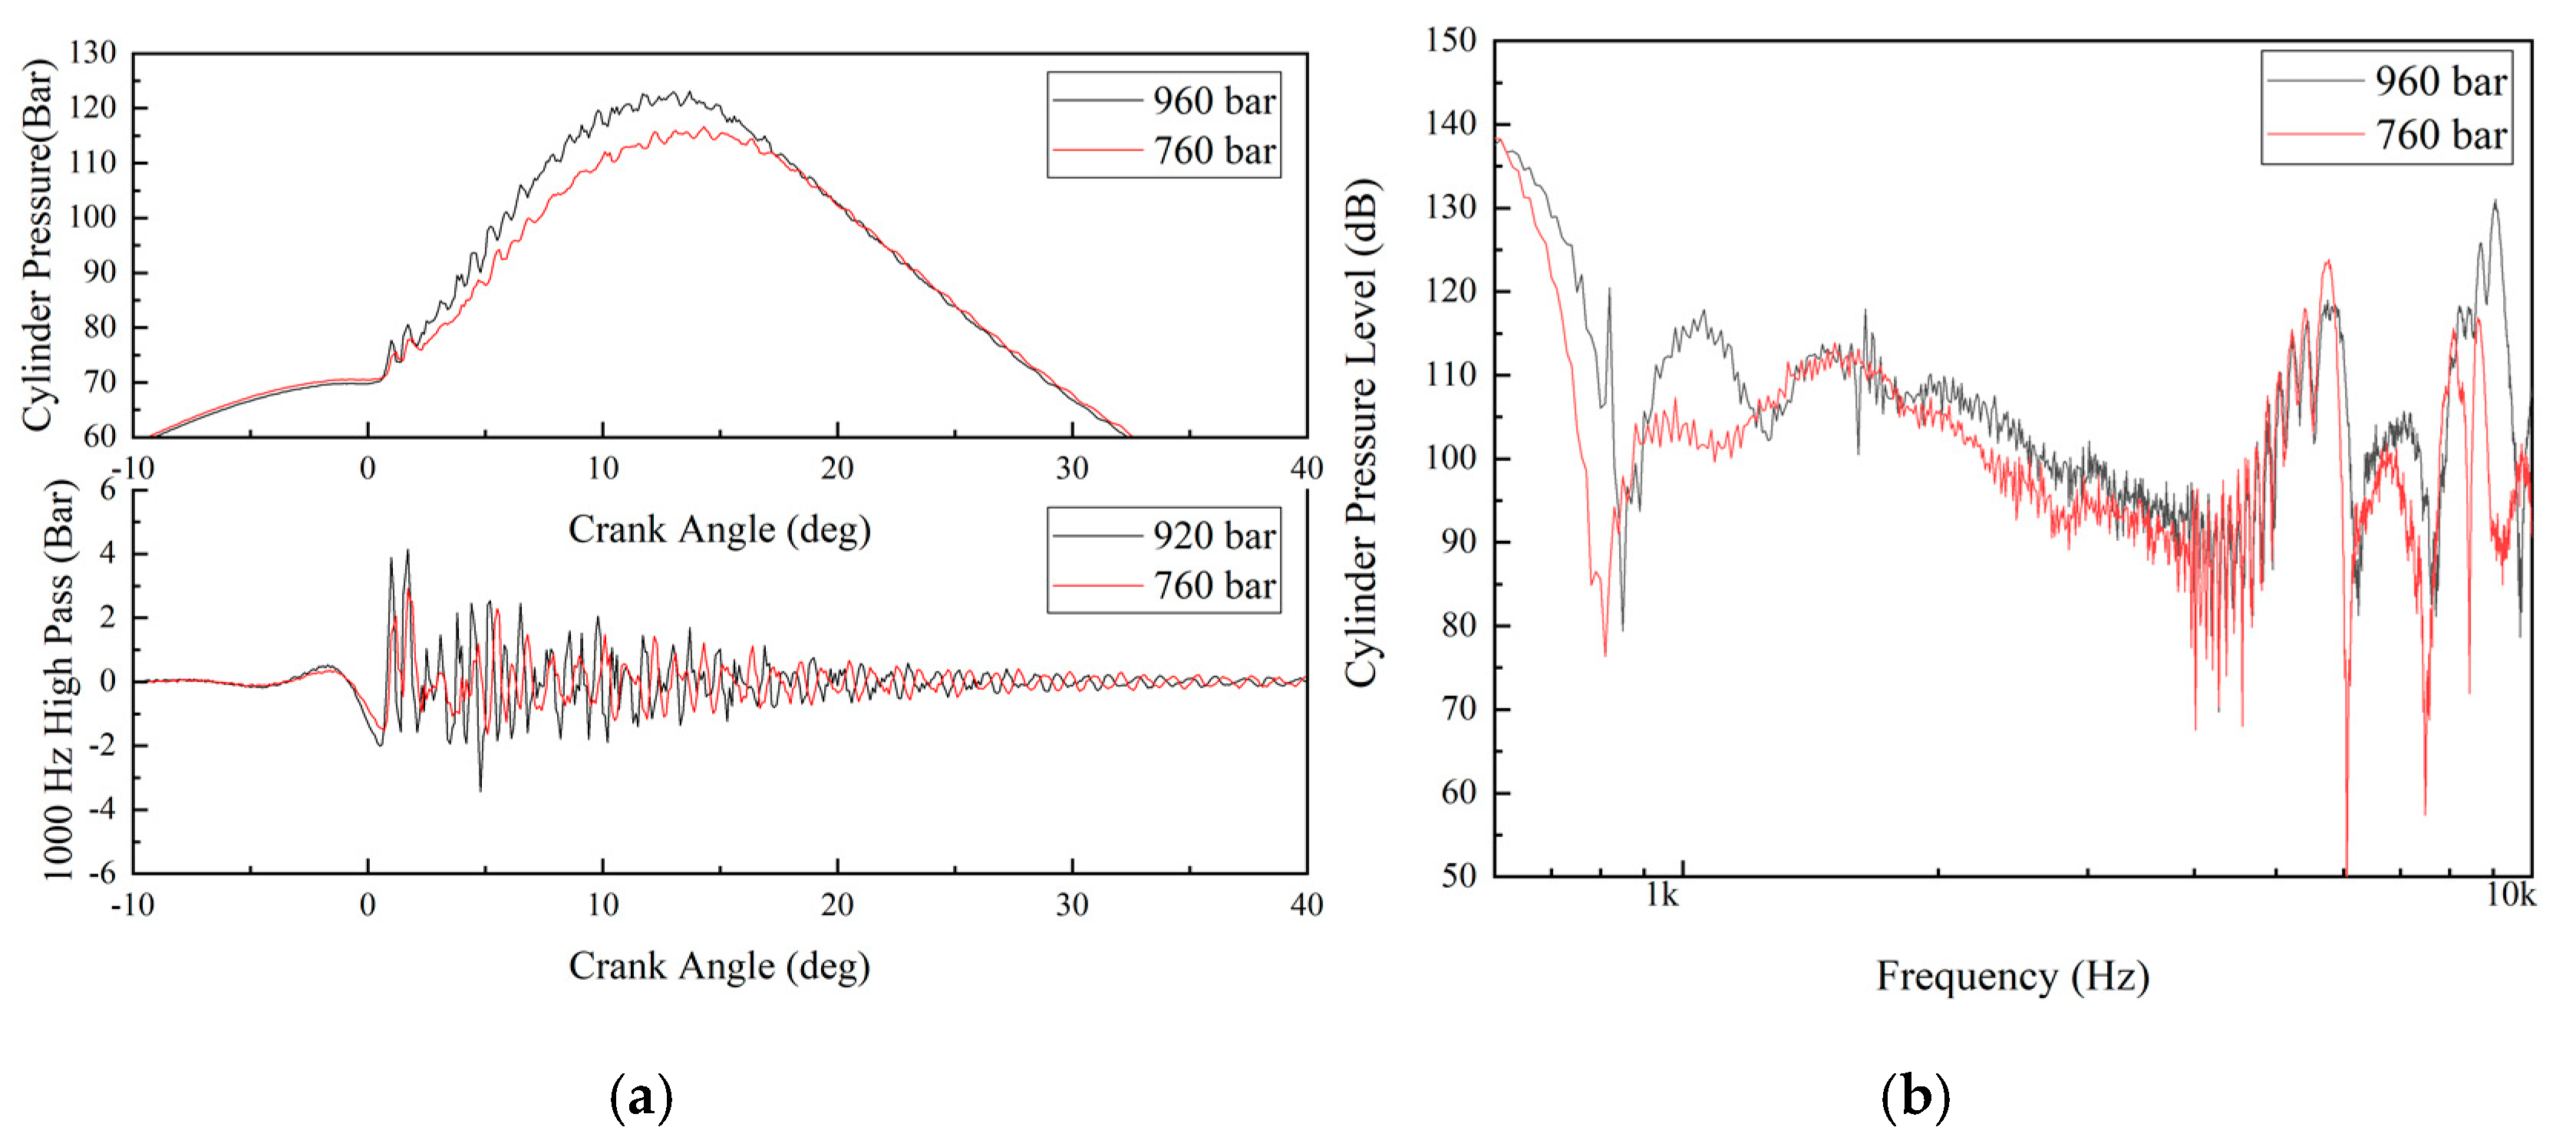
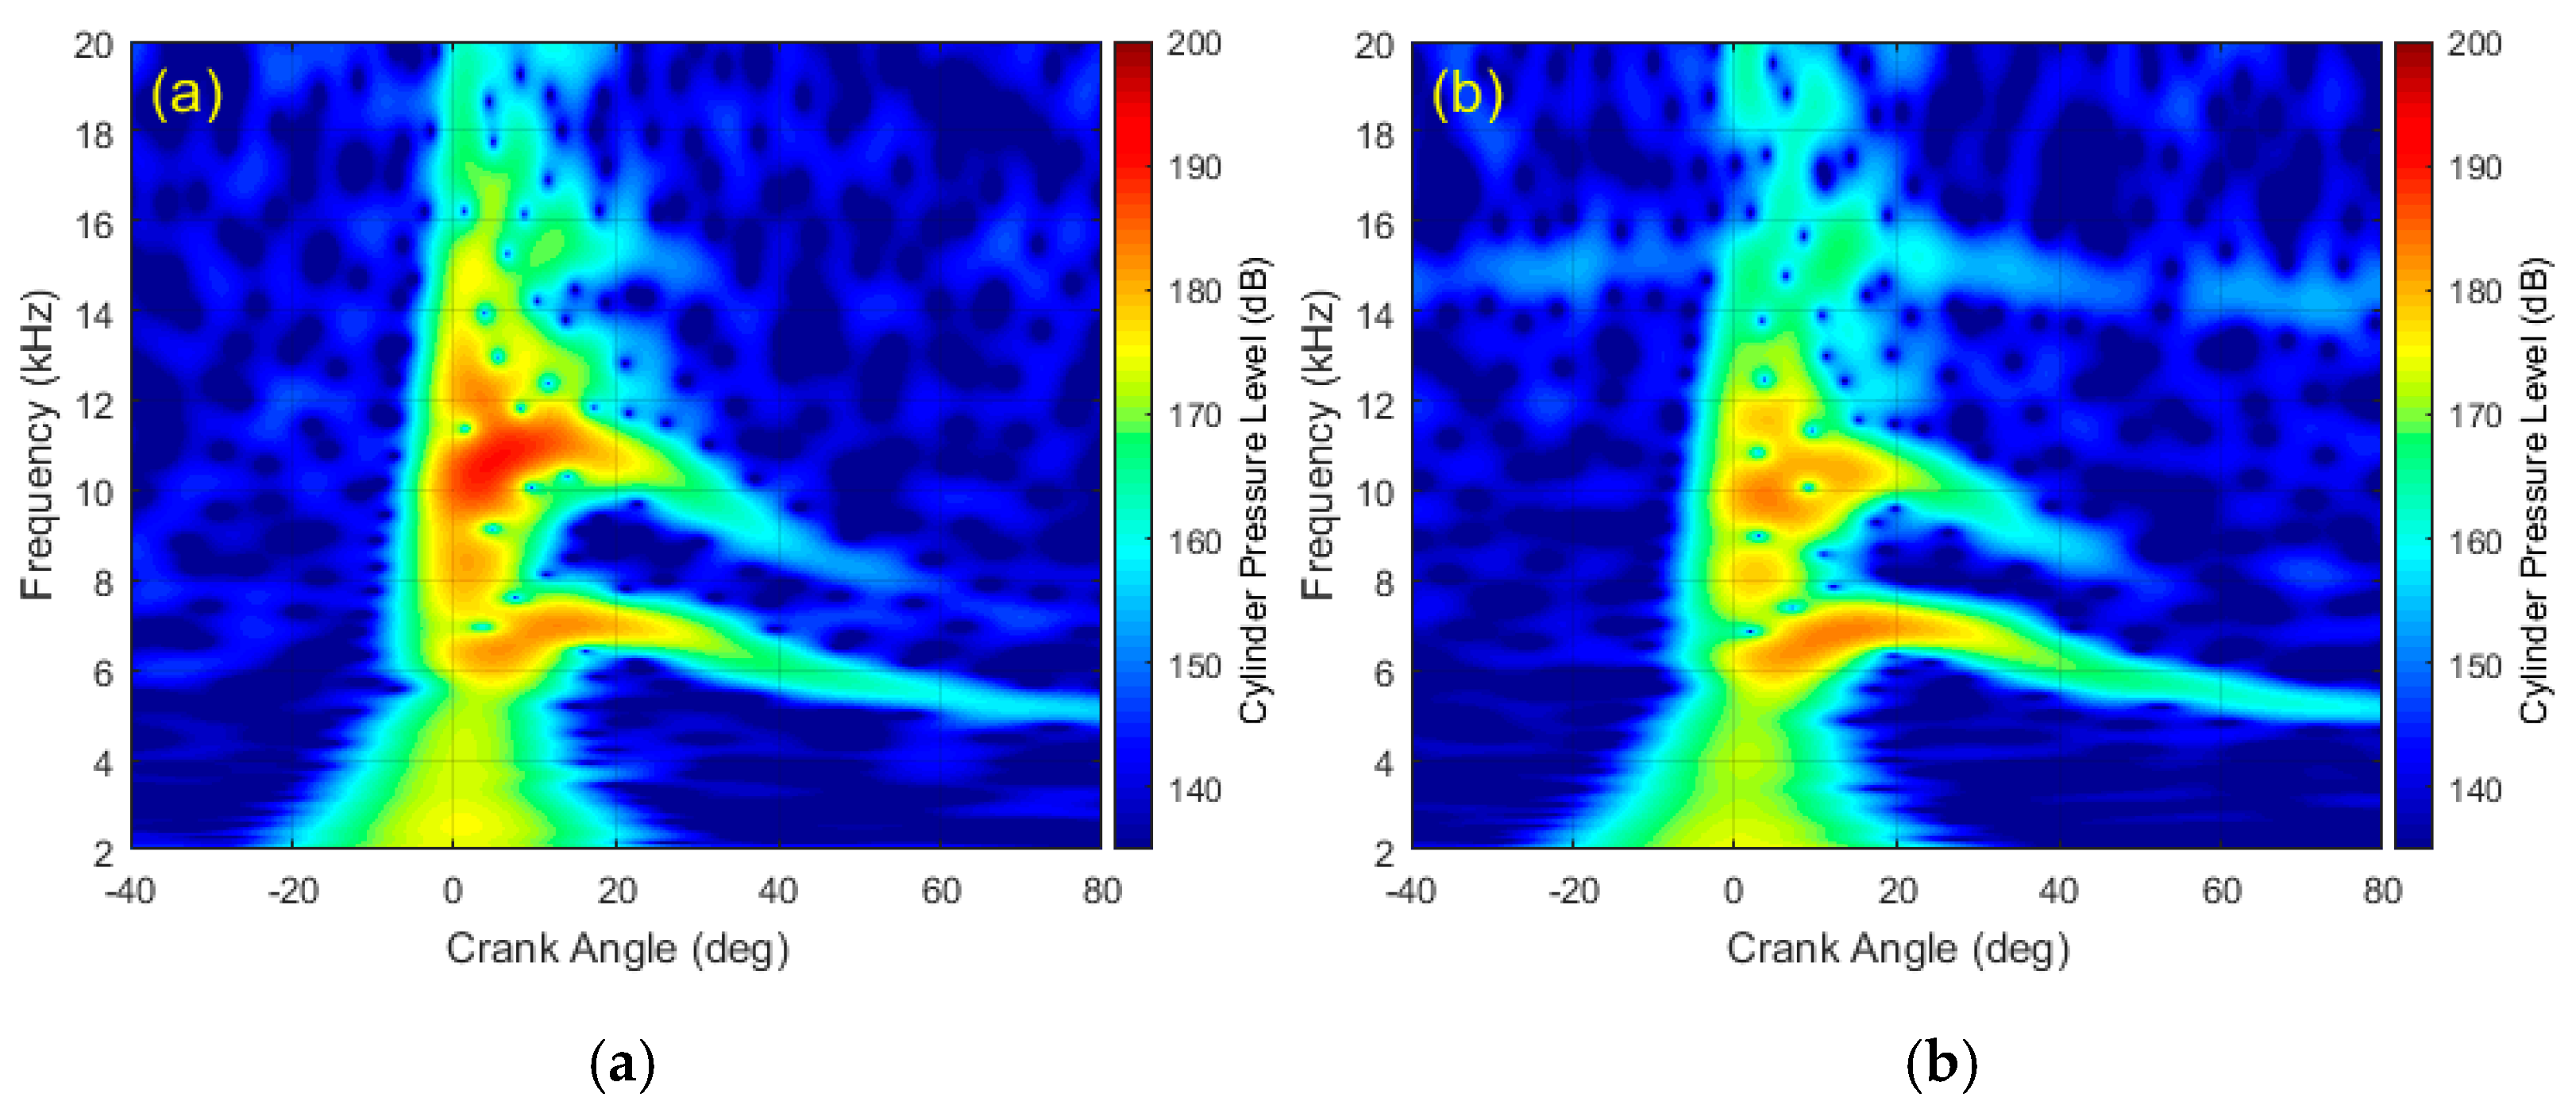
4.3. Influence of Rail Pressure on High-frequency Pressure Oscillation

Modern diesel engines are equipped with a high-pressure common rail system. The increase of rail pressure will lead to the more intense combustion process, higher in-cylinder pressure and gas temperature. In order to investigate the effect of rail pressure on high-frequency pressure oscillation, the engine speed, main injection timing, pilot injection interval, and pilot injection quantity are all fixed, while the rail pressure is changed. The high-frequency pressure oscillation components under rail pressure conditions of 760, 800, 840, 880, 920, and 960 bar are extracted by the proposed adaptive cyclic average TVF-EMD method. It can be seen from Figure 20 that as the rail pressure increases, the pressure oscillation normalized energy and average center frequency of the in-cylinder pressure oscillation will both increase significantly.
The results of the highest rail pressure 960 bar and the lowest rail pressure 760 bar during the test are chosen for further detailed analysis. It can be seen from the time domain signal of Figure 21a that when the rail pressure increases from 760 bar to 960 bar, the in-cylinder pressure and the high-pass part above 1000 Hz are both increased. As shown in Figure 21b, the oscillation energy above 7 kHz of 960 bar rail pressure condition is slightly larger than that of 760 bar condition, which indicates that the rail pressure oscillation has slight influence on the high-frequency pressure oscillation.
The time-frequency distributions of the two conditions are shown in Figure 22a,b, respectively. It can be more clearly seen the pressure oscillation energy located at 8–14 kHz under 960 bar rail pressure condition is significantly higher than the 760 bar condition, while in the other frequencies are much the same. In addition, the pressure oscillations of the two conditions both start from the extreme burning stage, however, the 8–14 kHz oscillation component under 960 bar rail pressure condition last longer.
Detailed center frequency and normalized energy characteristics of in-cylinder pressure oscillation of the two rail pressure conditions are shown in Table 7. It can be clearly seen that as the rail pressure increases, the center frequencies of in-cylinder pressure oscillations of the two conditions are very similar, while more energy will move to high frequencies above 10 kHz, and the corresponding average center frequency will also increase significantly.
As the rail pressure change result shown in Figure 22 and Table 7, the effect of rail pressure on high-frequency oscillations are similar with load. The increase in rail pressure exacerbates the severity of the in-cylinder combustion process, leading to more pronounced high-frequency oscillations.

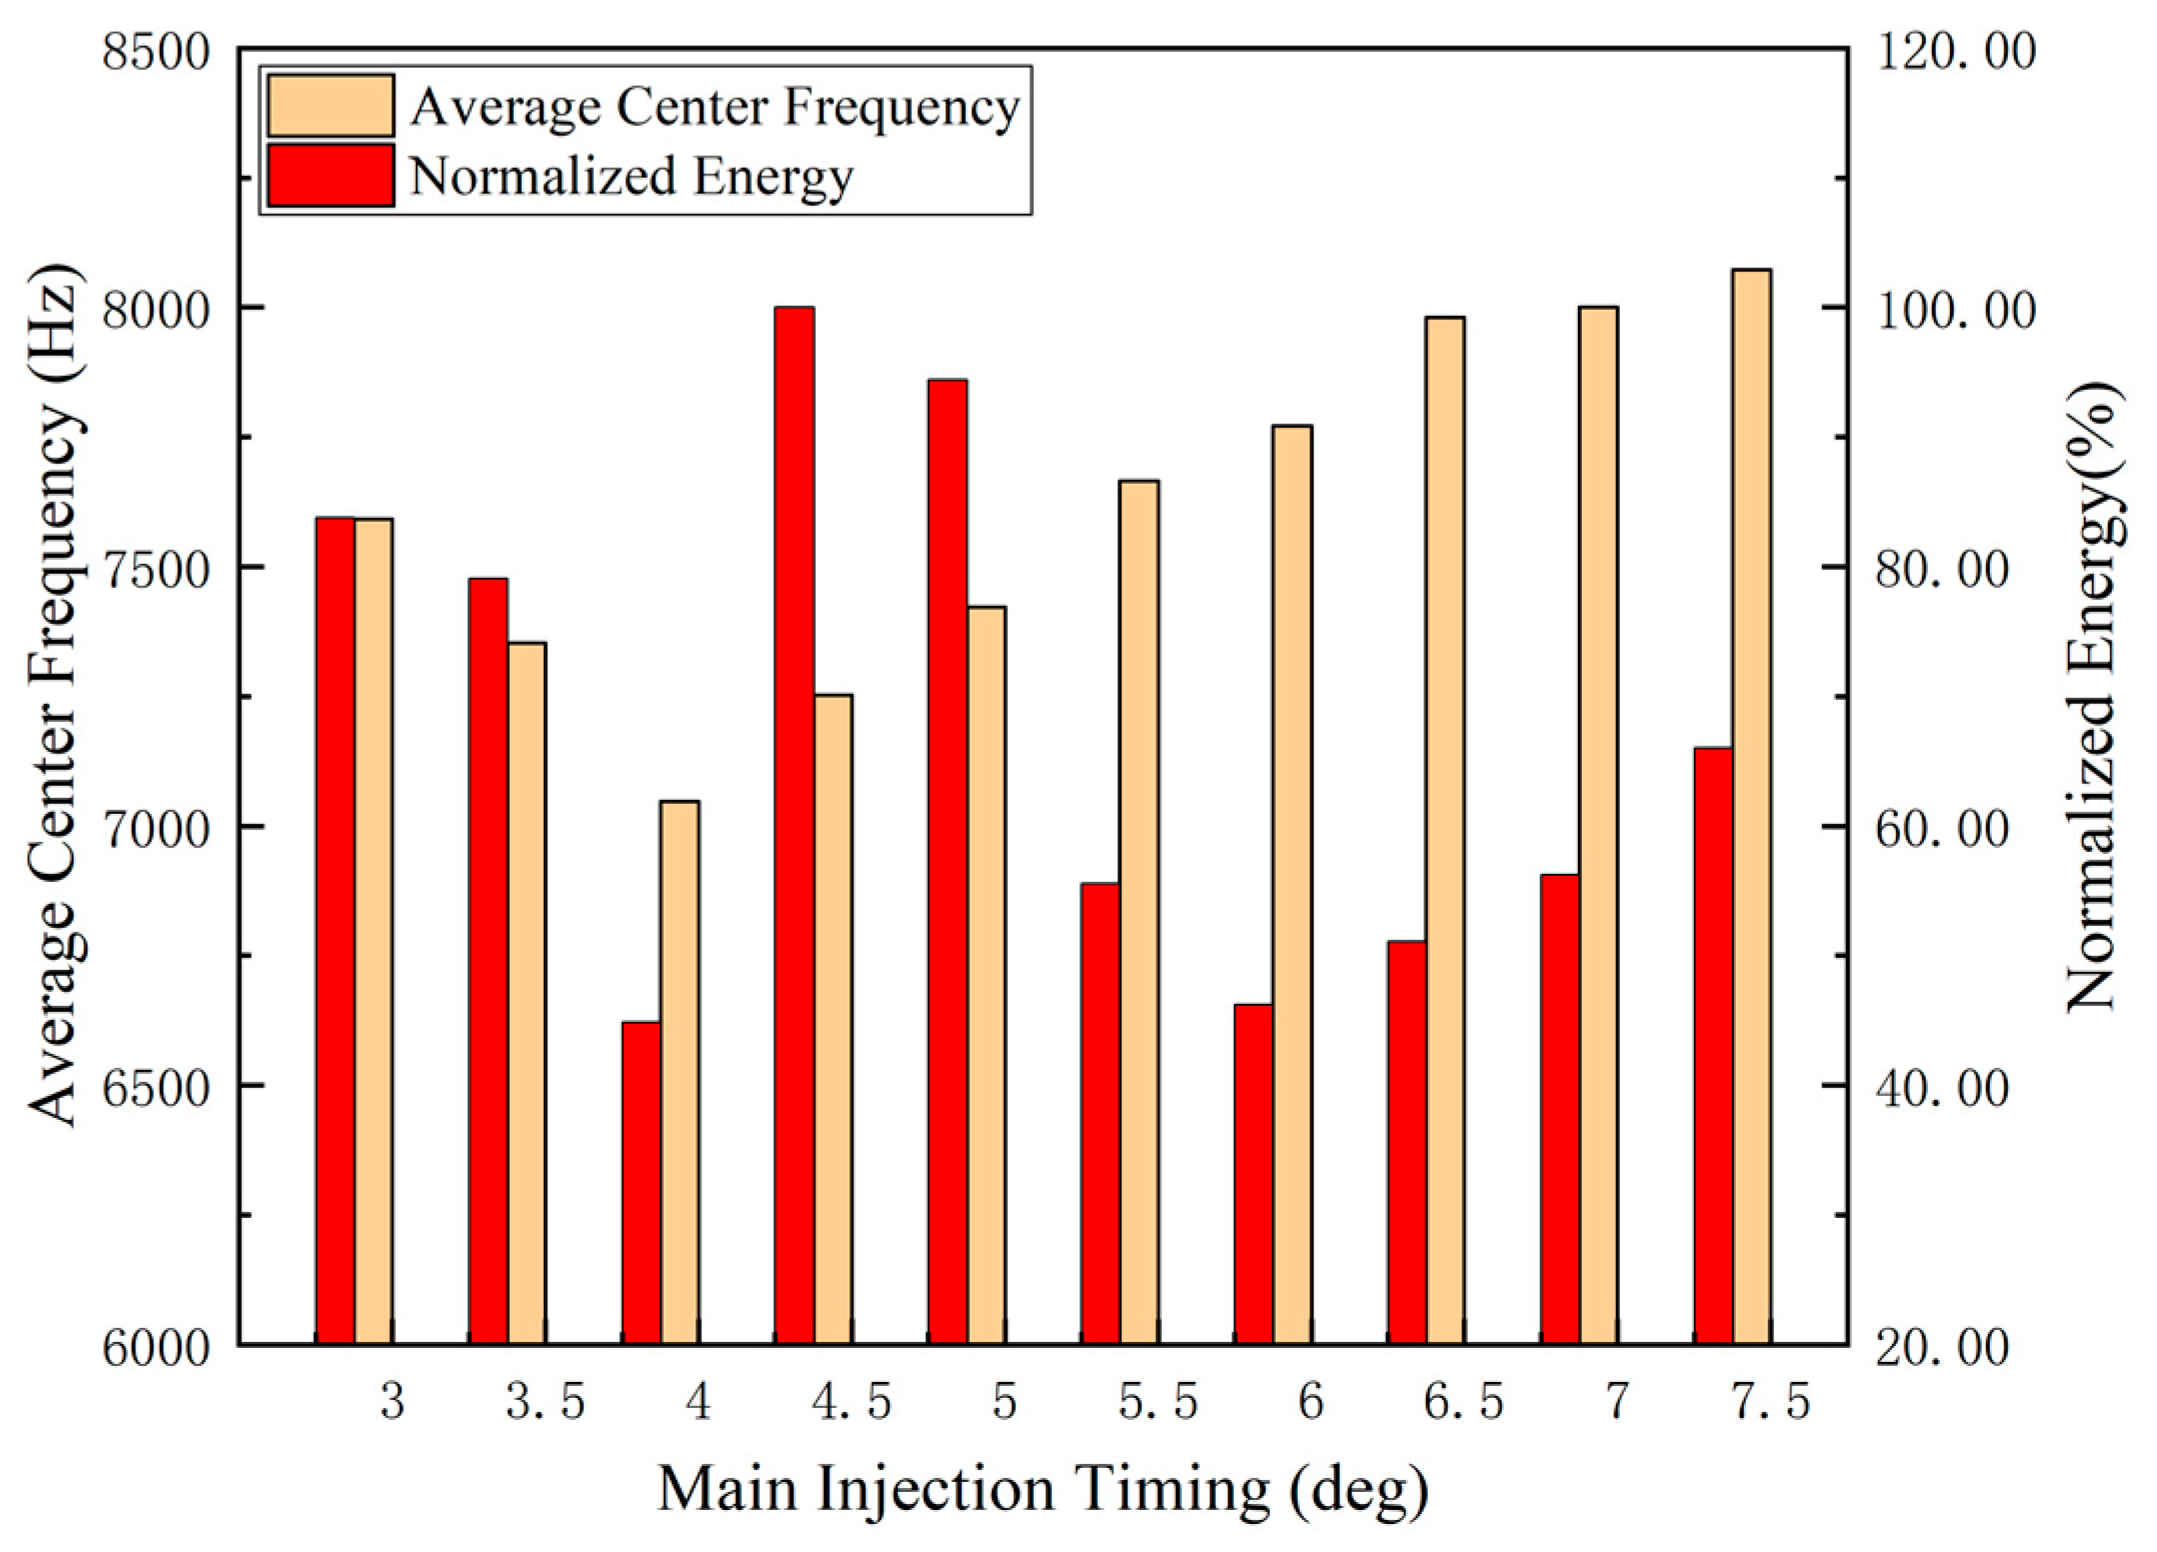
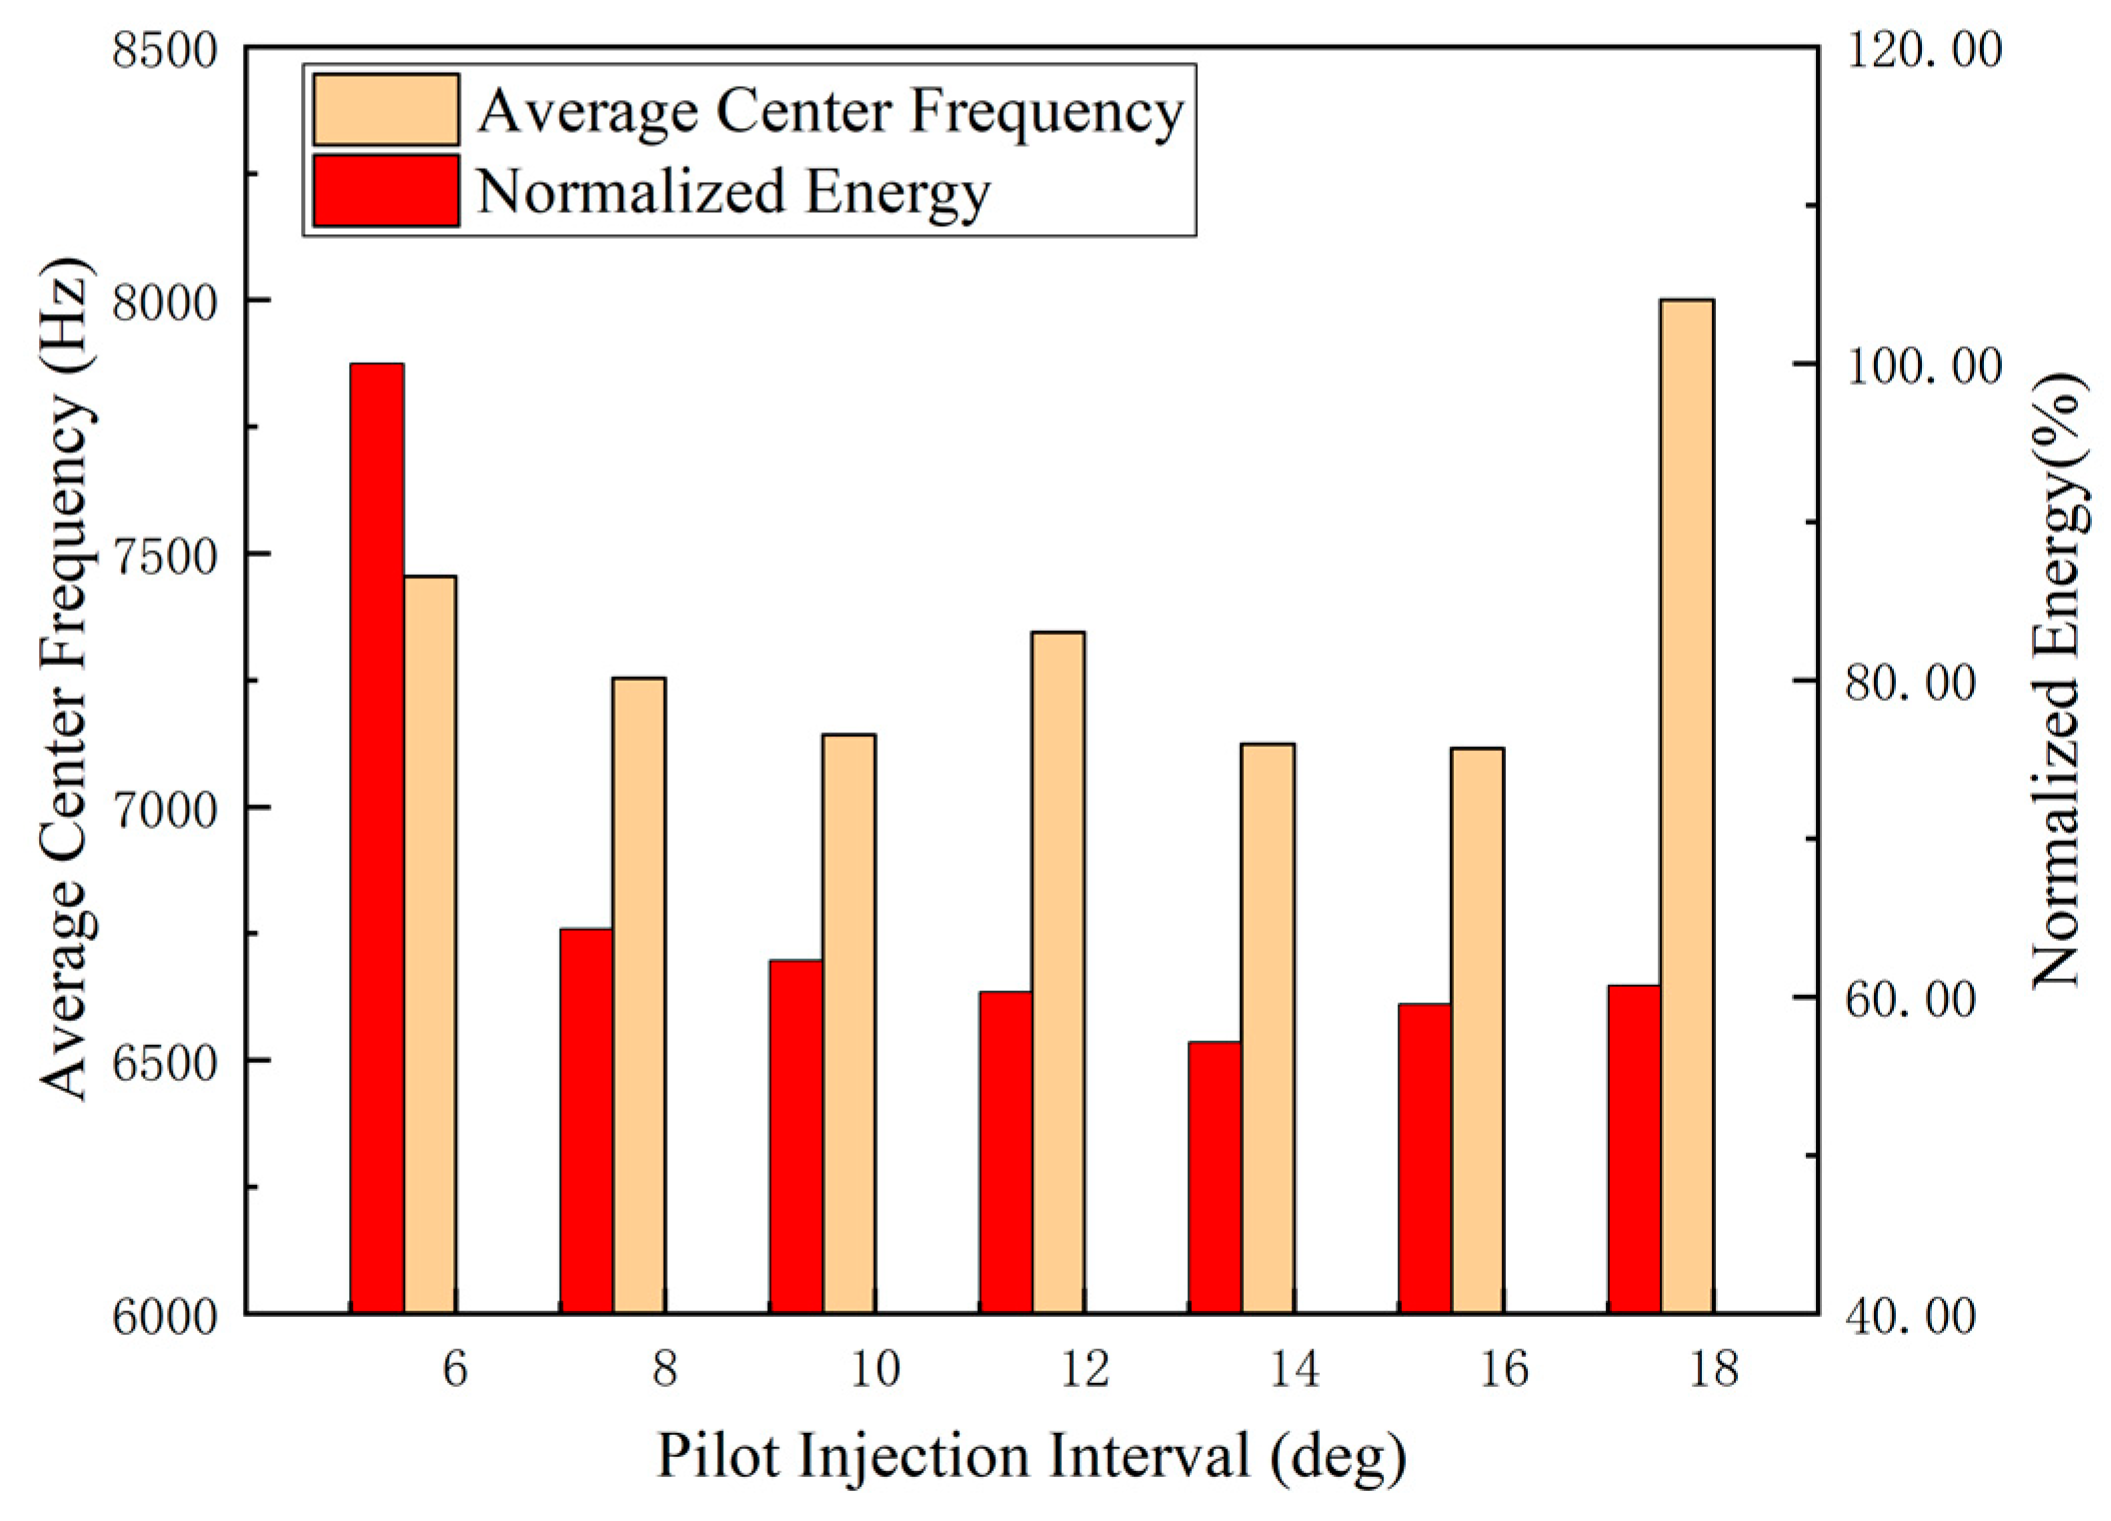
4.4. Influence of Fuel Injection Parameters on High-frequency Pressure Oscillation

The high-frequency pressure oscillation will also be affected by some other parameters, such as main injection timing (MIT), pilot injection interval (PII), and pilot injection quantity (PIQ). However, the monotonicity of the change may be inferior to the previous parameters. Taking 1200r/min full load condition as an example, the influence of main injection timing, pilot injection interval and pilot injection quantity on high-frequency pressure oscillation are analyzed by the proposed method, and the results are shown in Figure 23, Figure 24 and Figure 25, respectively.
As shown in Figure 23, as the main injection timing increases from 3 to 7.5 °CA, on one hand, the average frequency center of the pressure oscillation first decreases and then increases, and the critical main injection timing is 4.5 °CA. On the other hand, the change of the normalized oscillation energy is complicated without a clear monotonic rule, which may be affected by factors such as the expansion of the in-cylinder space and the main-pilot injection interval.
As shown in Figure 24, as the pilot injection interval increases from 6 to 18 °CA, on one hand, the normalized pressure oscillation energy first decreases dramatically and then remains stable. On the other hand, there is little change in the average center frequency.
As shown in Figure 25, as the pilot injection quantity increases from 1.75 to 3.75 mg, both the average center frequency and normalized energy of the high-frequency pressure oscillation show little change. Therefore, the change of pilot injection quantity has little influence on the high- frequency pressure oscillation.

5. Remarks

The high-frequency cylinder oscillation in the cylinder is the main excitation source of the high- frequency noise of the engine. Since the low and medium frequencies of diesel engine noise can be effectively reduced in terms of diesel engine body shape optimization design and vehicle acoustic package design, while the high-frequency noise caused by the high-frequency oscillation excitation in the cylinder is difficult to be removed, the vehicle interior noise sound quality is closely related to the high-frequency oscillation characteristics and its transfer function. The engine transfer function is determined by the engine block structure and working conditions of the engine. At the same speed, load, and rail pressure, when the fuel injection parameters are fine-tuned, the mechanical noise of the engine is considered to be almost constant, and the structural attenuation of the engine is almost unchanged. The sound quality of the diesel engine is considered to be more related to combustion oscillation. Since the human acoustic perception is very sensitive to the high- frequency noise originating from the high-frequency pressure oscillation, based on the above analysis, the ways of controlling the pressure oscillation and improving the sound quality of the diesel engine are discussed in this section.
The working speed has great influence on the high-frequency oscillation of the direct injection diesel engine. As can be seen from Figure 14, when the engine speed is too low (1200 r/min), the engine condition is relatively smooth, and the temperature and pressure changes are moderate, so that the high-frequency oscillation is suppressed, the normalized energy of high-frequency oscillation of 1200 r/min is 71.22% compared to 1600 r/min. When the engine speed is too high (2200 r/min), the time interval between the engine cycle to cycle is gradually reduced, and the duration of the high-frequency oscillation is greatly compressed, the normalized energy of high-frequency oscillation of 2200 r/min is 30.62% compared to 1600 r/min. When. Thus, the peak normalized energy of high-frequency oscillation will always appear at the medium-high speed (in this case is 1600 r/min), which is the common working condition of the engine, and should be optimized by adjusting the injection parameters.
The frequency and energy characteristics of high-frequency cylinder oscillation are related to the load and rail pressure. As can be seen from Figure 17, when the load increases more fuel will be injected into the cylinder, and the change of the cylinder gas and temperature will be more severe, which is favorable for the increase of the frequency and energy of the pressure oscillation, the normalized energy of high-frequency oscillation of 50% load is only 2.12% compared to 100% load. Similarly, as can be seen from Figure 20, when the rail pressure increases, the peak value of the cylinder pressure will increase, and the change of cylinder gas and temperature will be more severe, which is favorable for the increase of the frequency and energy of the high-frequency oscillation, the normalized energy of high-frequency oscillation of 760 Bar is 48.83% compared to 960 Bar. Therefore, choosing a reasonable lower rail pressure and lower load are the most direct method of reducing pressure oscillation.
After the top dead center (TDC), the influence of the main injection timing on the high- frequency oscillation is complicated. As can be seen from Figure 23, when the main injection timing increases, on the one hand, the piston will be gradually moved away from the TDC and the in-cylinder space at the time of combustion will be gradually enlarged, which is advantageous for the reduction of the frequency and energy of the pressure oscillation. On the other hand, the time of the retarding combustion period will be pushed back, and the length of the retardation combustion period will be increased, which is disadvantageous for the reduction of the frequency and energy of the combustion resonance. Therefore, after the TDC, the appropriate main injection timing should be carefully selected by the proposed method, and the main injection timing is preferably at 4 °CA in this case.
As can be seen from Figure 24, a reasonable pilot injection interval can also suppress the high- frequency oscillation. If the pilot injection interval is too small, the pilot injection interval is not clearly distinguishable from the main injection interval, which is equivalent to single combustion, and the energy of the pressure oscillation increases. If the pilot injection interval is too large, the increased in-cylinder temperature in the pilot injection interval is lowered again in the main injection interval, which is disadvantageous for shortening the combustion retardation period and the frequency and energy of pressure oscillation may increase again. Therefore, the pilot injection interval is preferable at 14 °CA in this case.
Affected by factors such as emissions, the adjustment range for pilot injection quantity is small in this study, and the results in Figure 25 show that the fine-tuning pilot injection quantity has little effect on high-frequency oscillation.
This research focuses on reducing the frequency and energy of in-cylinder pressure oscillations by adjusting the working parameters. By establishing the statistical relationship between the high- frequency oscillation and the objective sound quality of the engine, it is possible to rationally design the excitation source of high-frequency oscillation and improve the objective sound quality of the diesel engine.

6. Conclusion

This paper aims to study the method for identifying the frequency and energy characteristics of high-frequency in-cylinder pressure oscillation of DI diesel engine and the change laws with working parameters. The potential ways for reducing the energy of high-frequency pressure oscillations are also discussed. The research achievements can provide technical support for quantitative analysis and optimization of high-frequency pressure oscillation. The main conclusions are shown as follows:
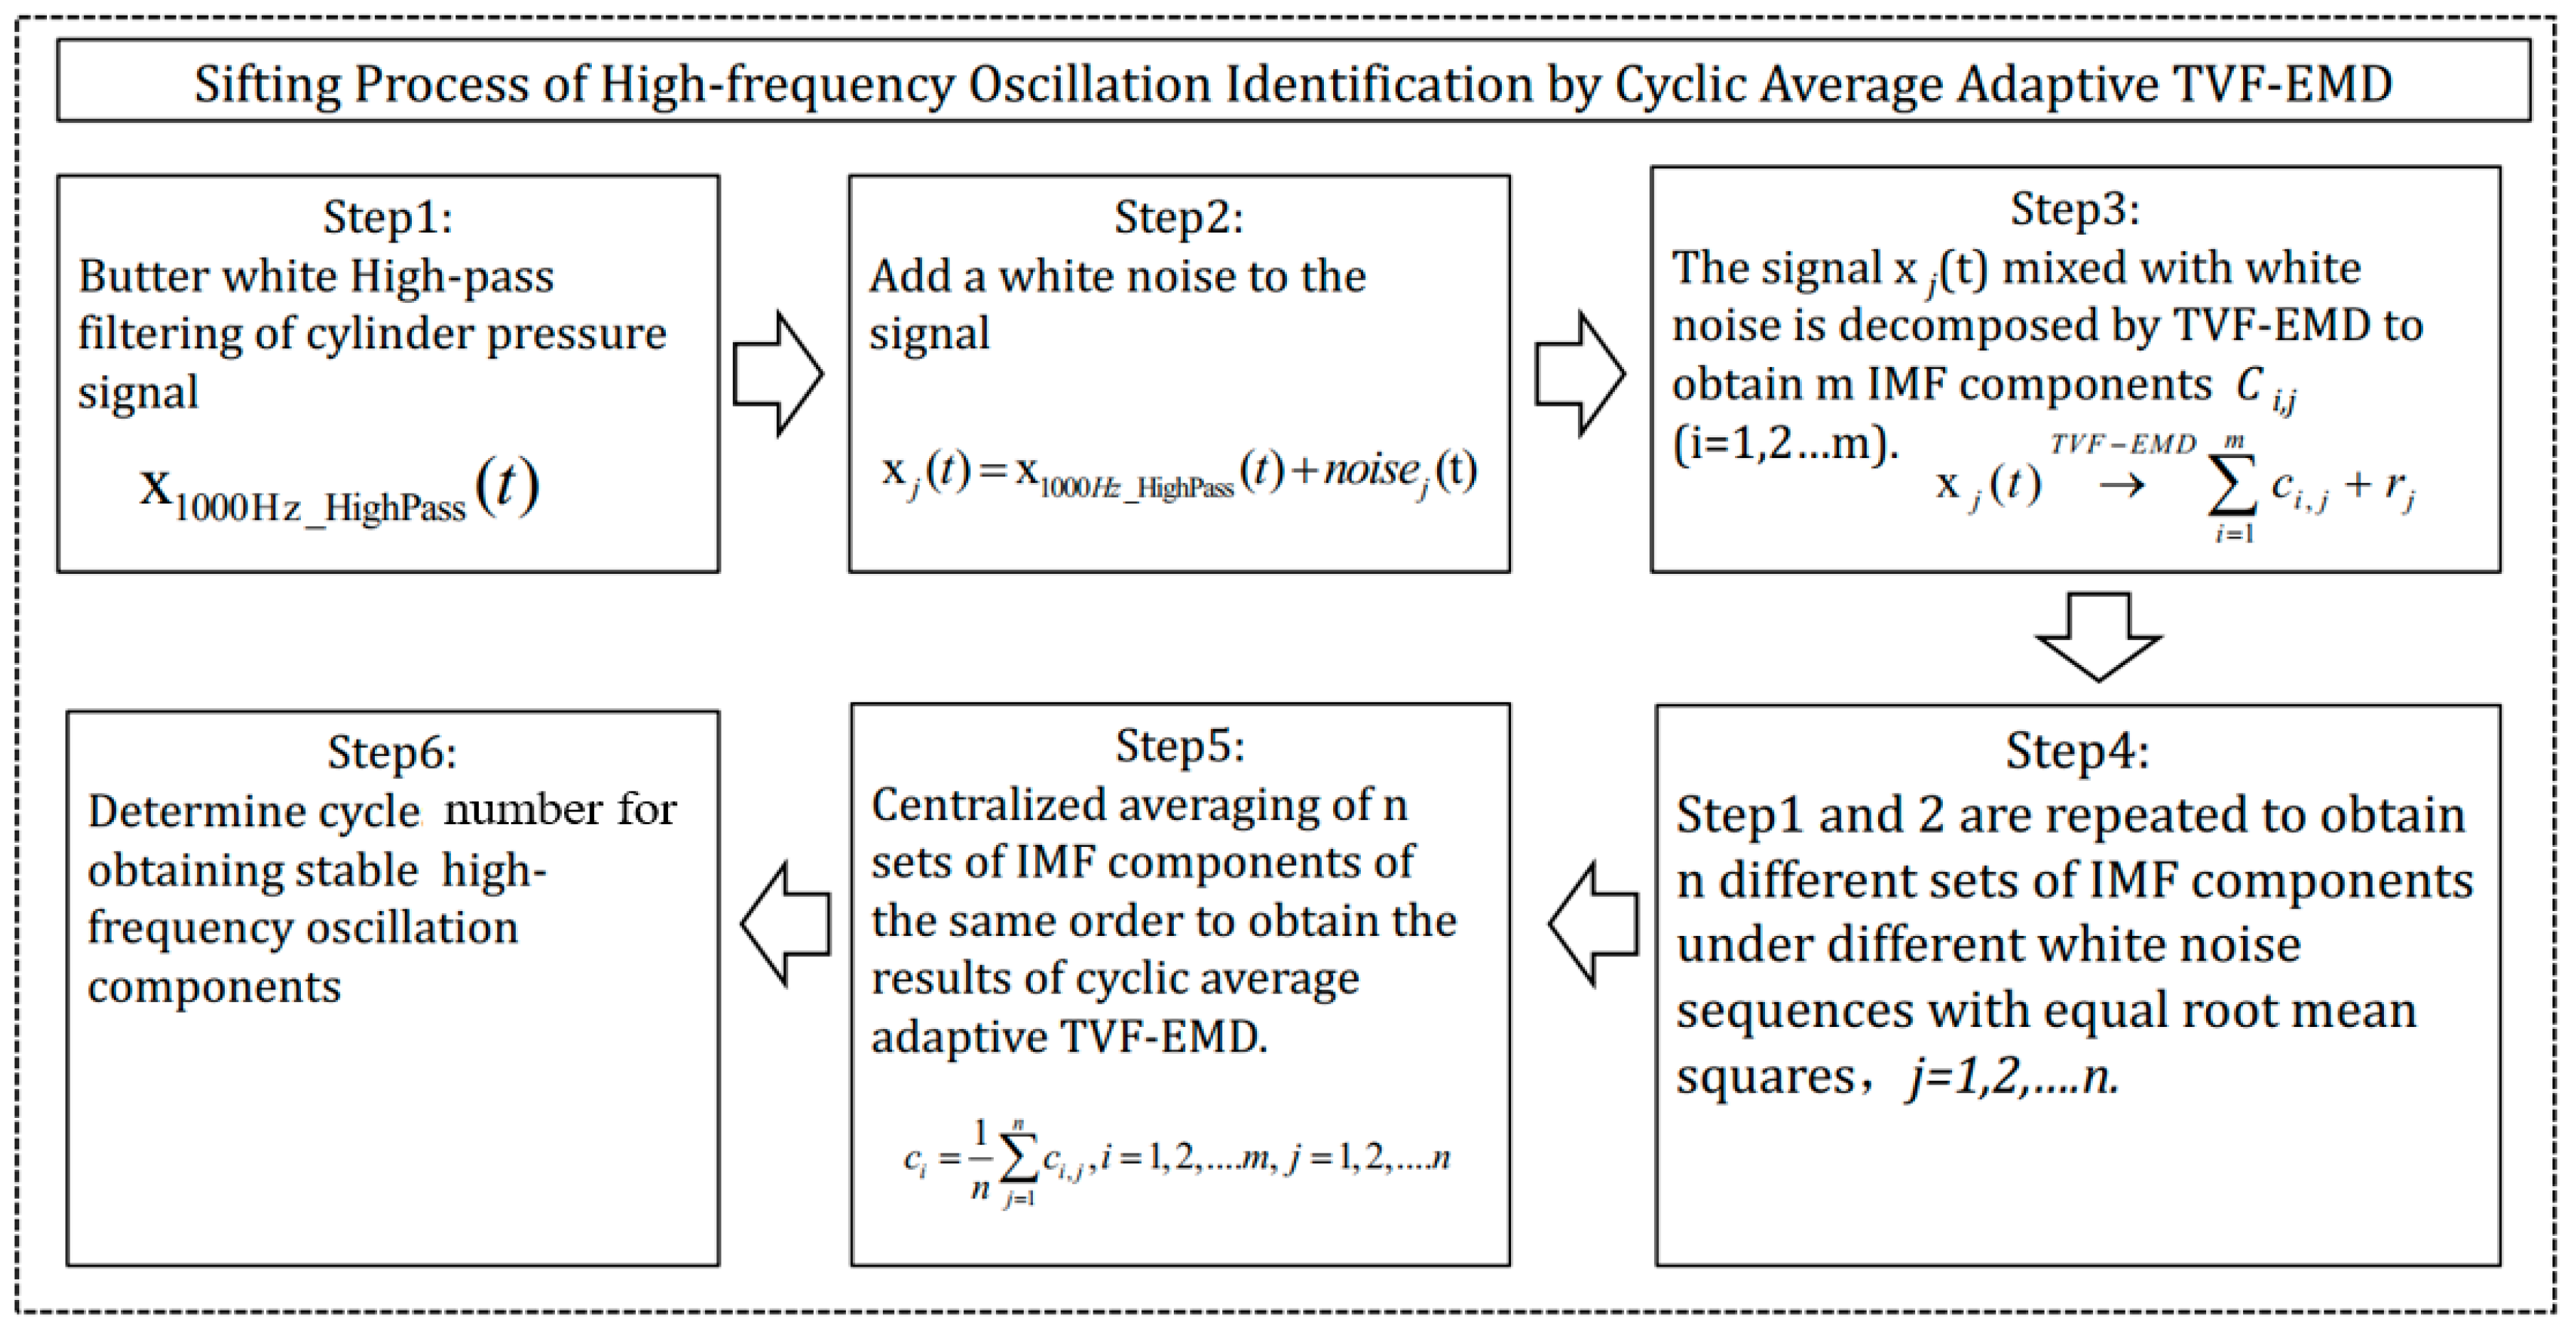
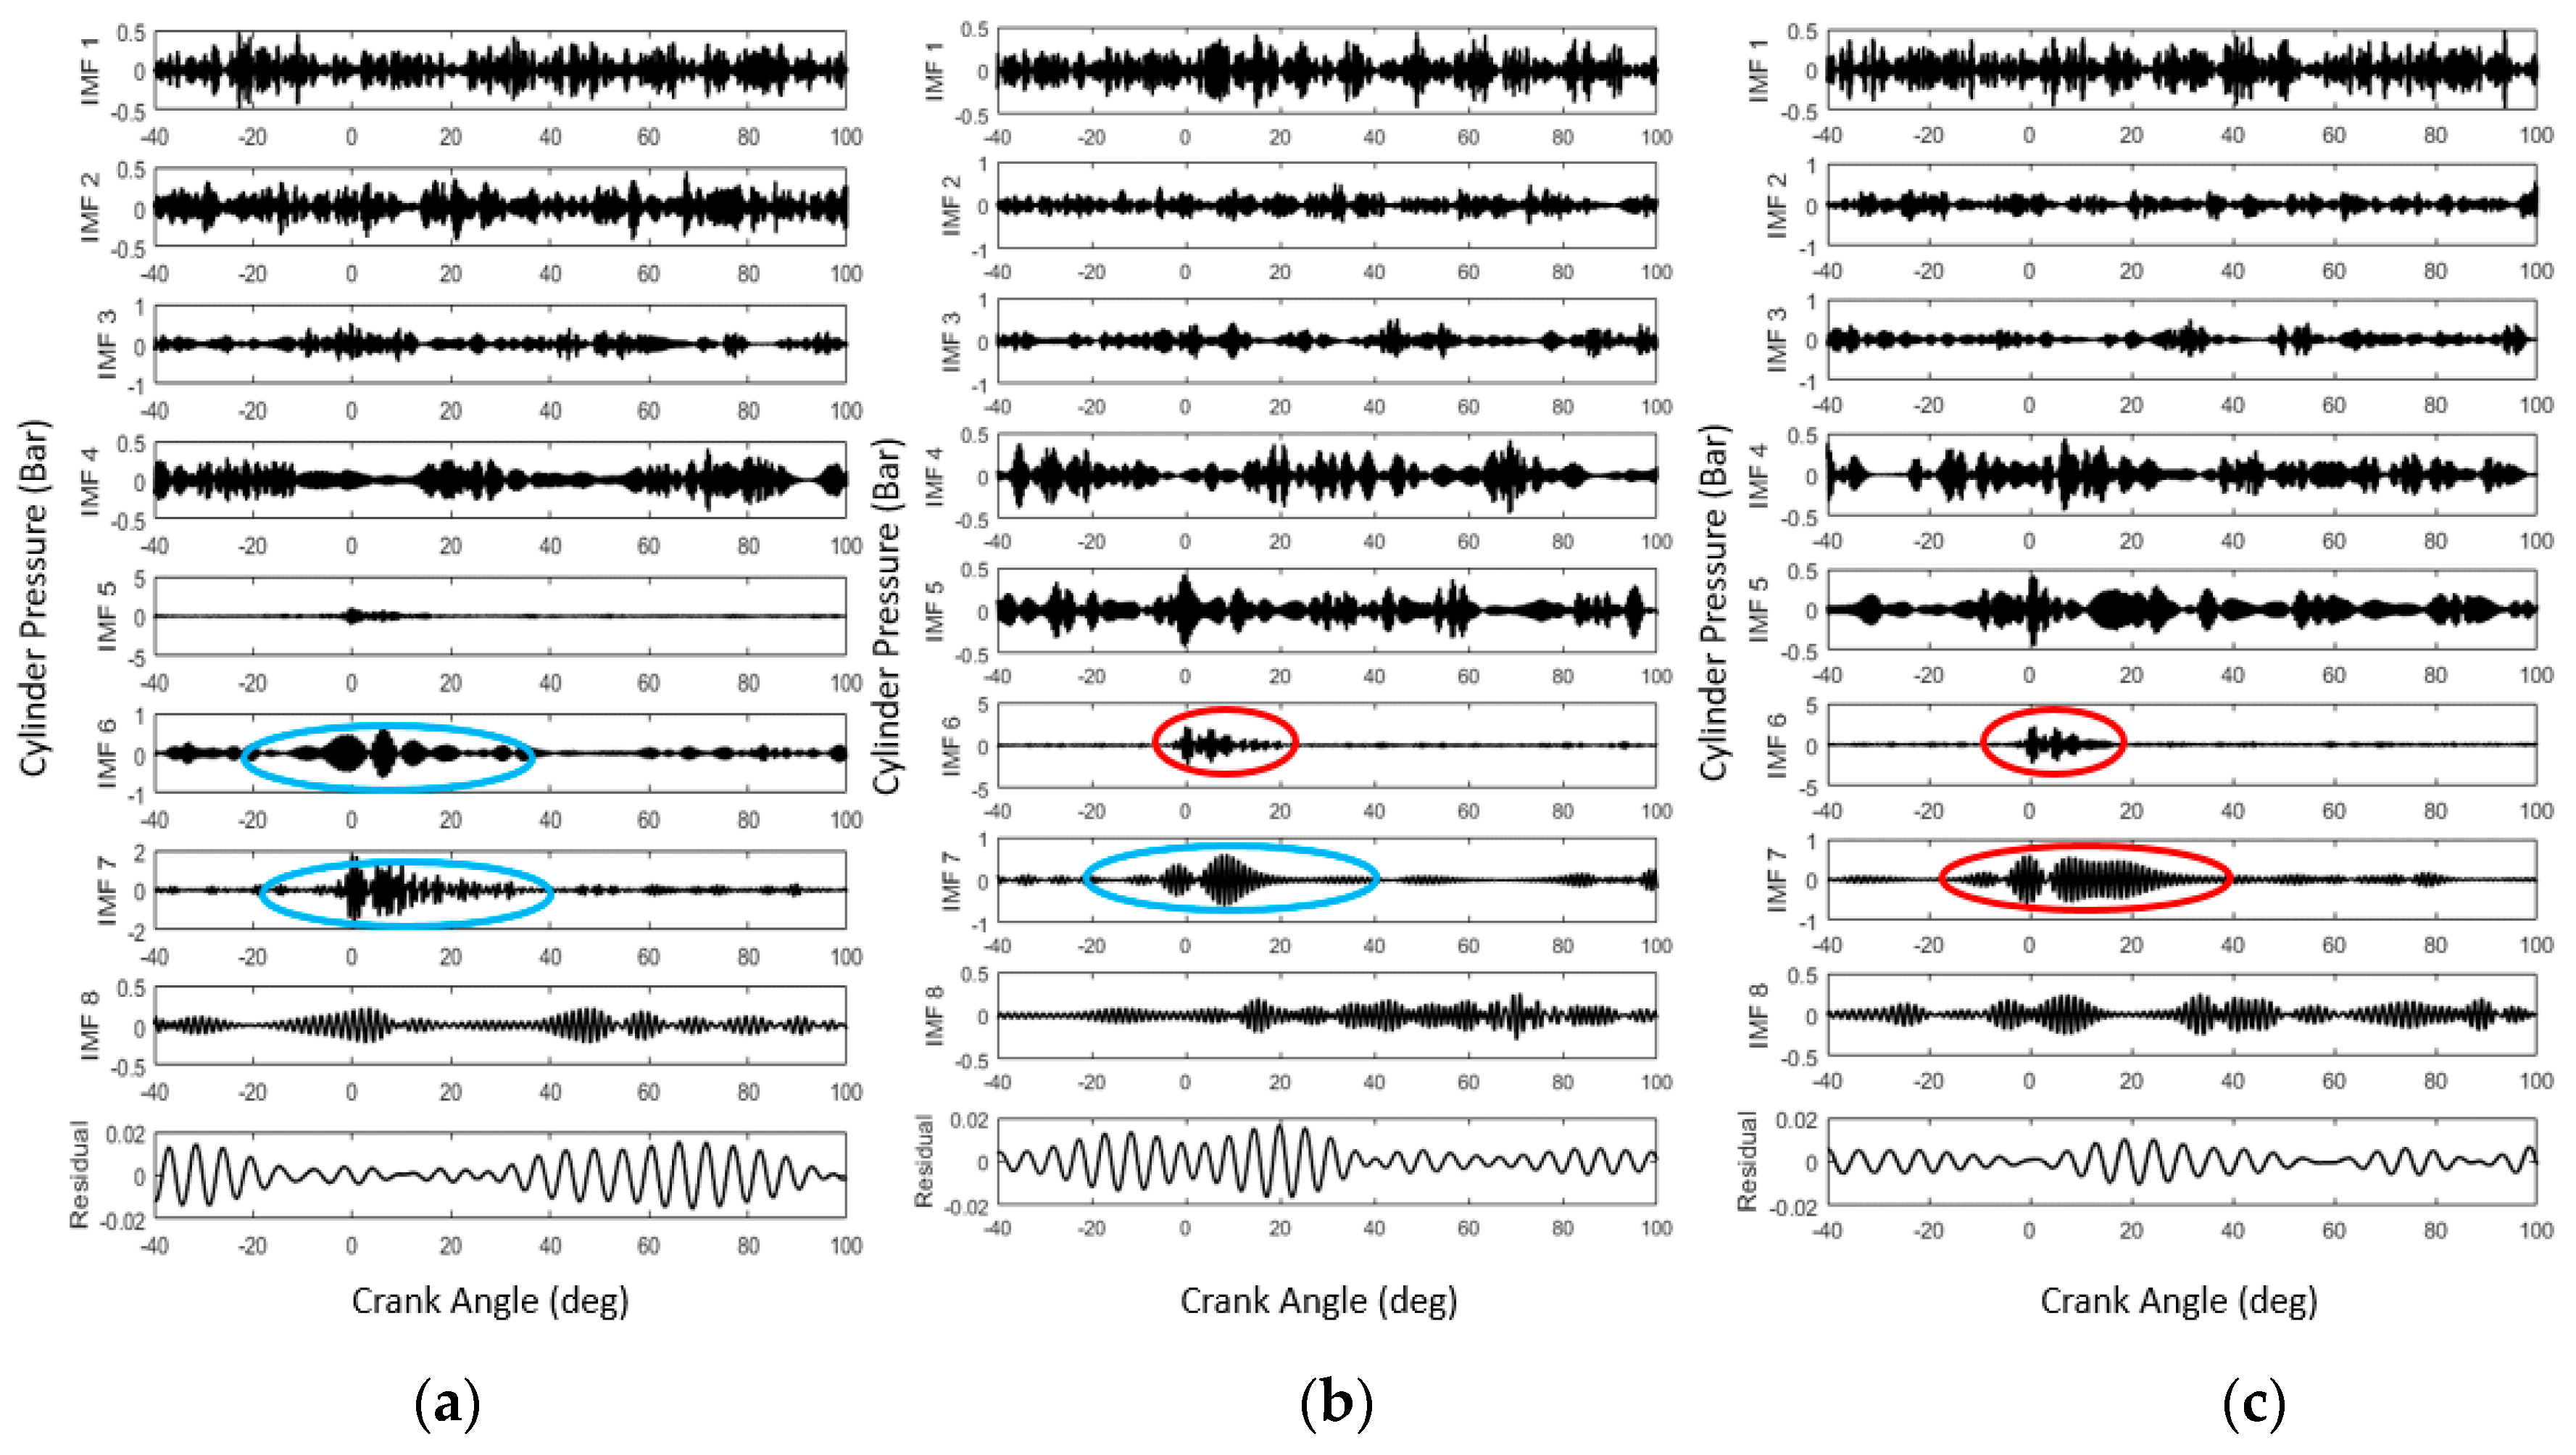
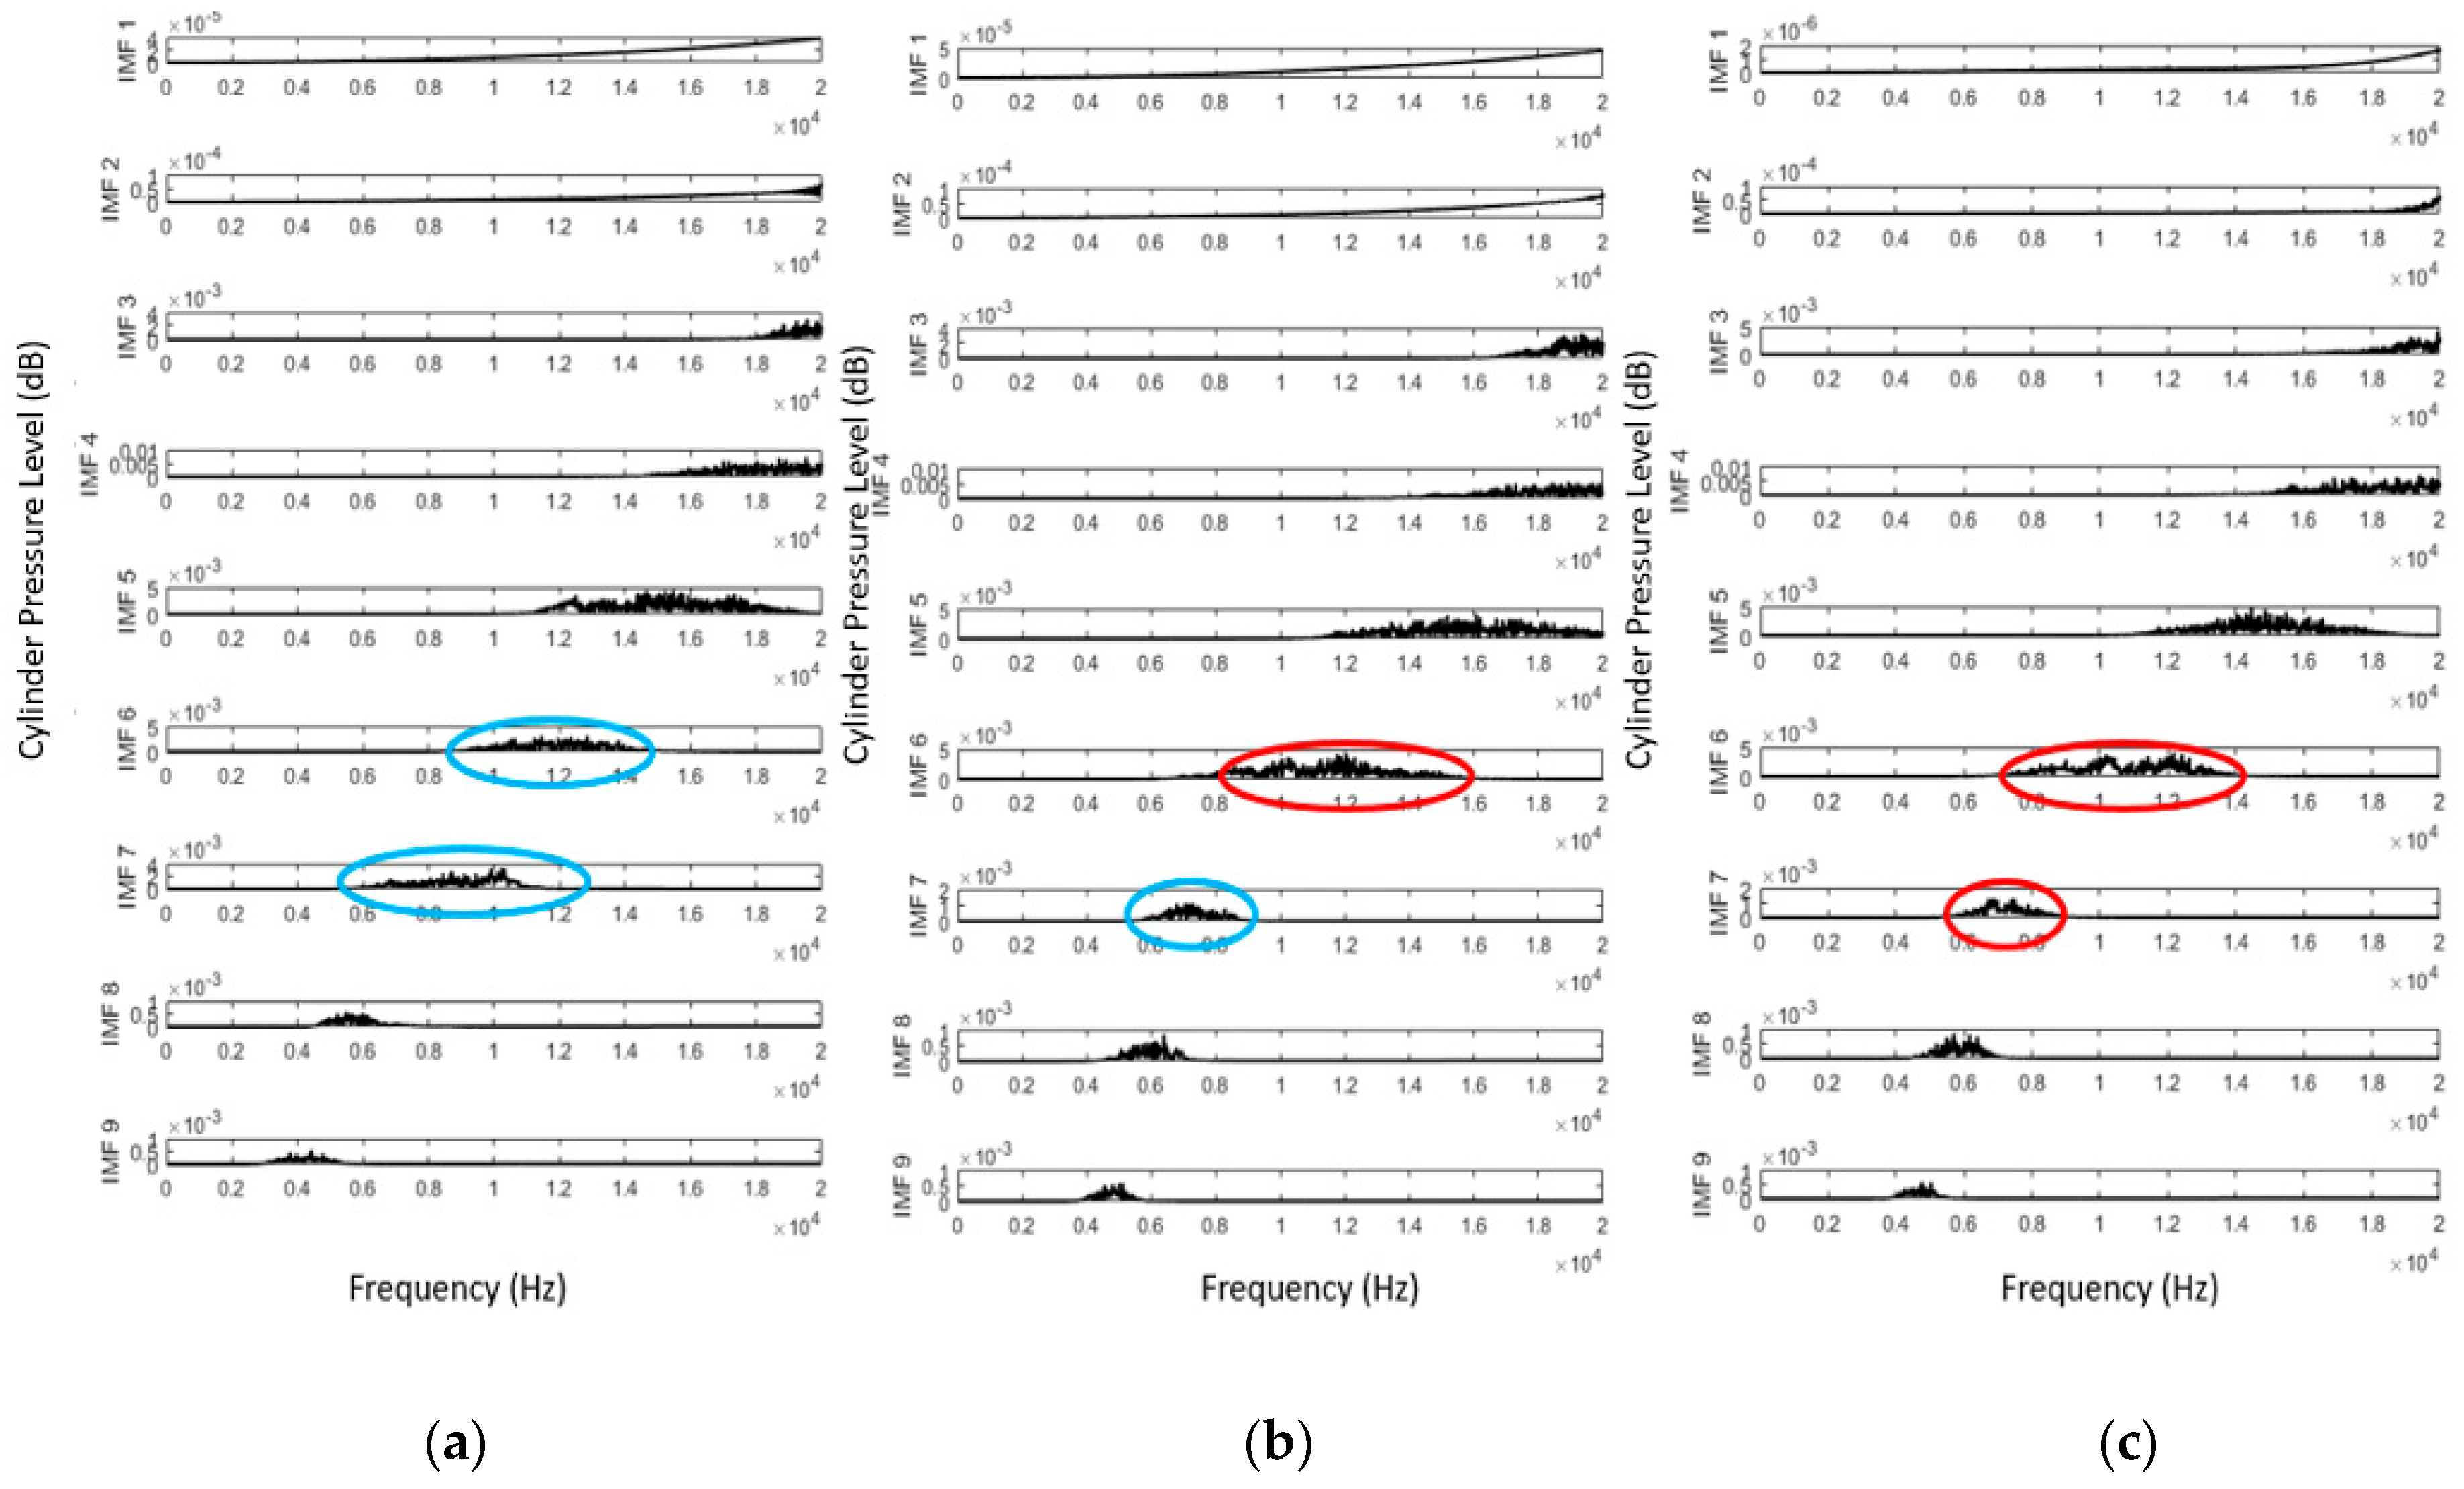
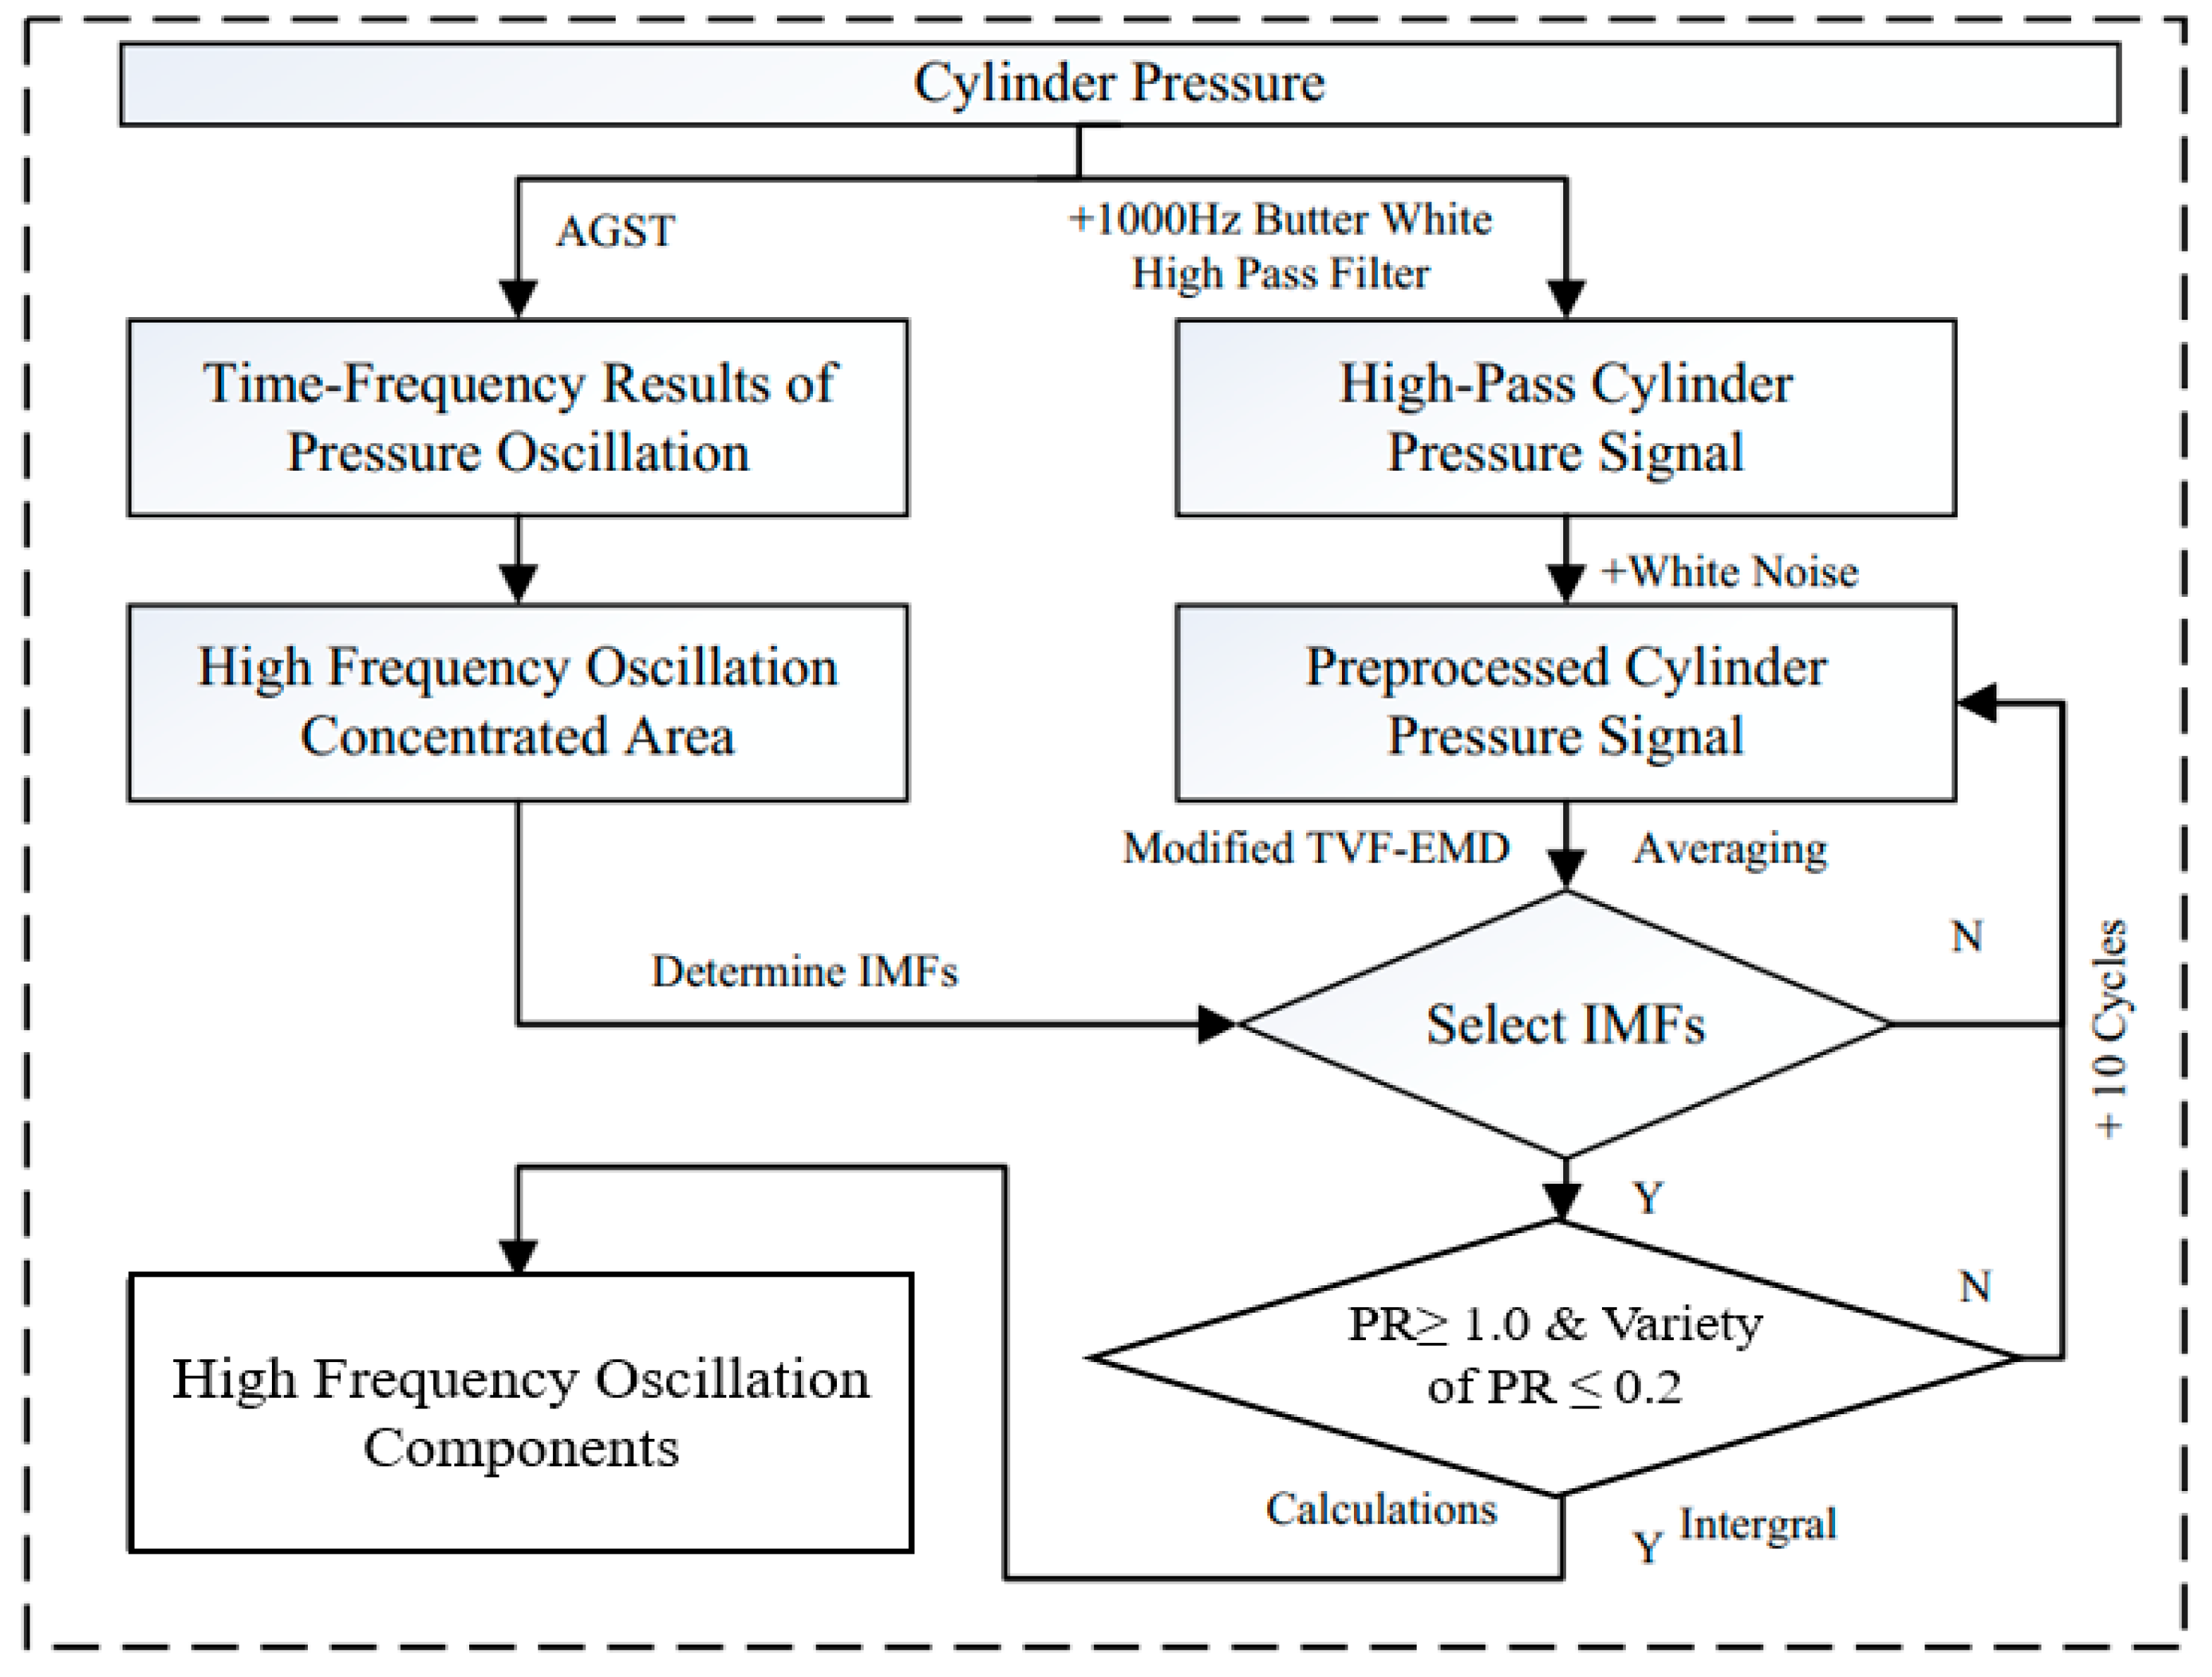
  • An adaptive cyclic average TVF-EMD is proposed to decompose the in-cylinder pressure and extract the high-frequency oscillation adaptively, and the decomposition process and the way to determine the adaptive cyclic number are discussed systematically. The proposed method is verified to be more effective and reliable for decomposing the in-cylinder signal compared to the other methods such as EEMD and original TVF-EMD.
  • Based on the proposed method, three evaluation indexes, which are center frequency, normalized frequency, average center frequency, are defined to investigate the influences of different working parameters on the frequency and energy of in-cylinder pressure oscillation quantitatively.
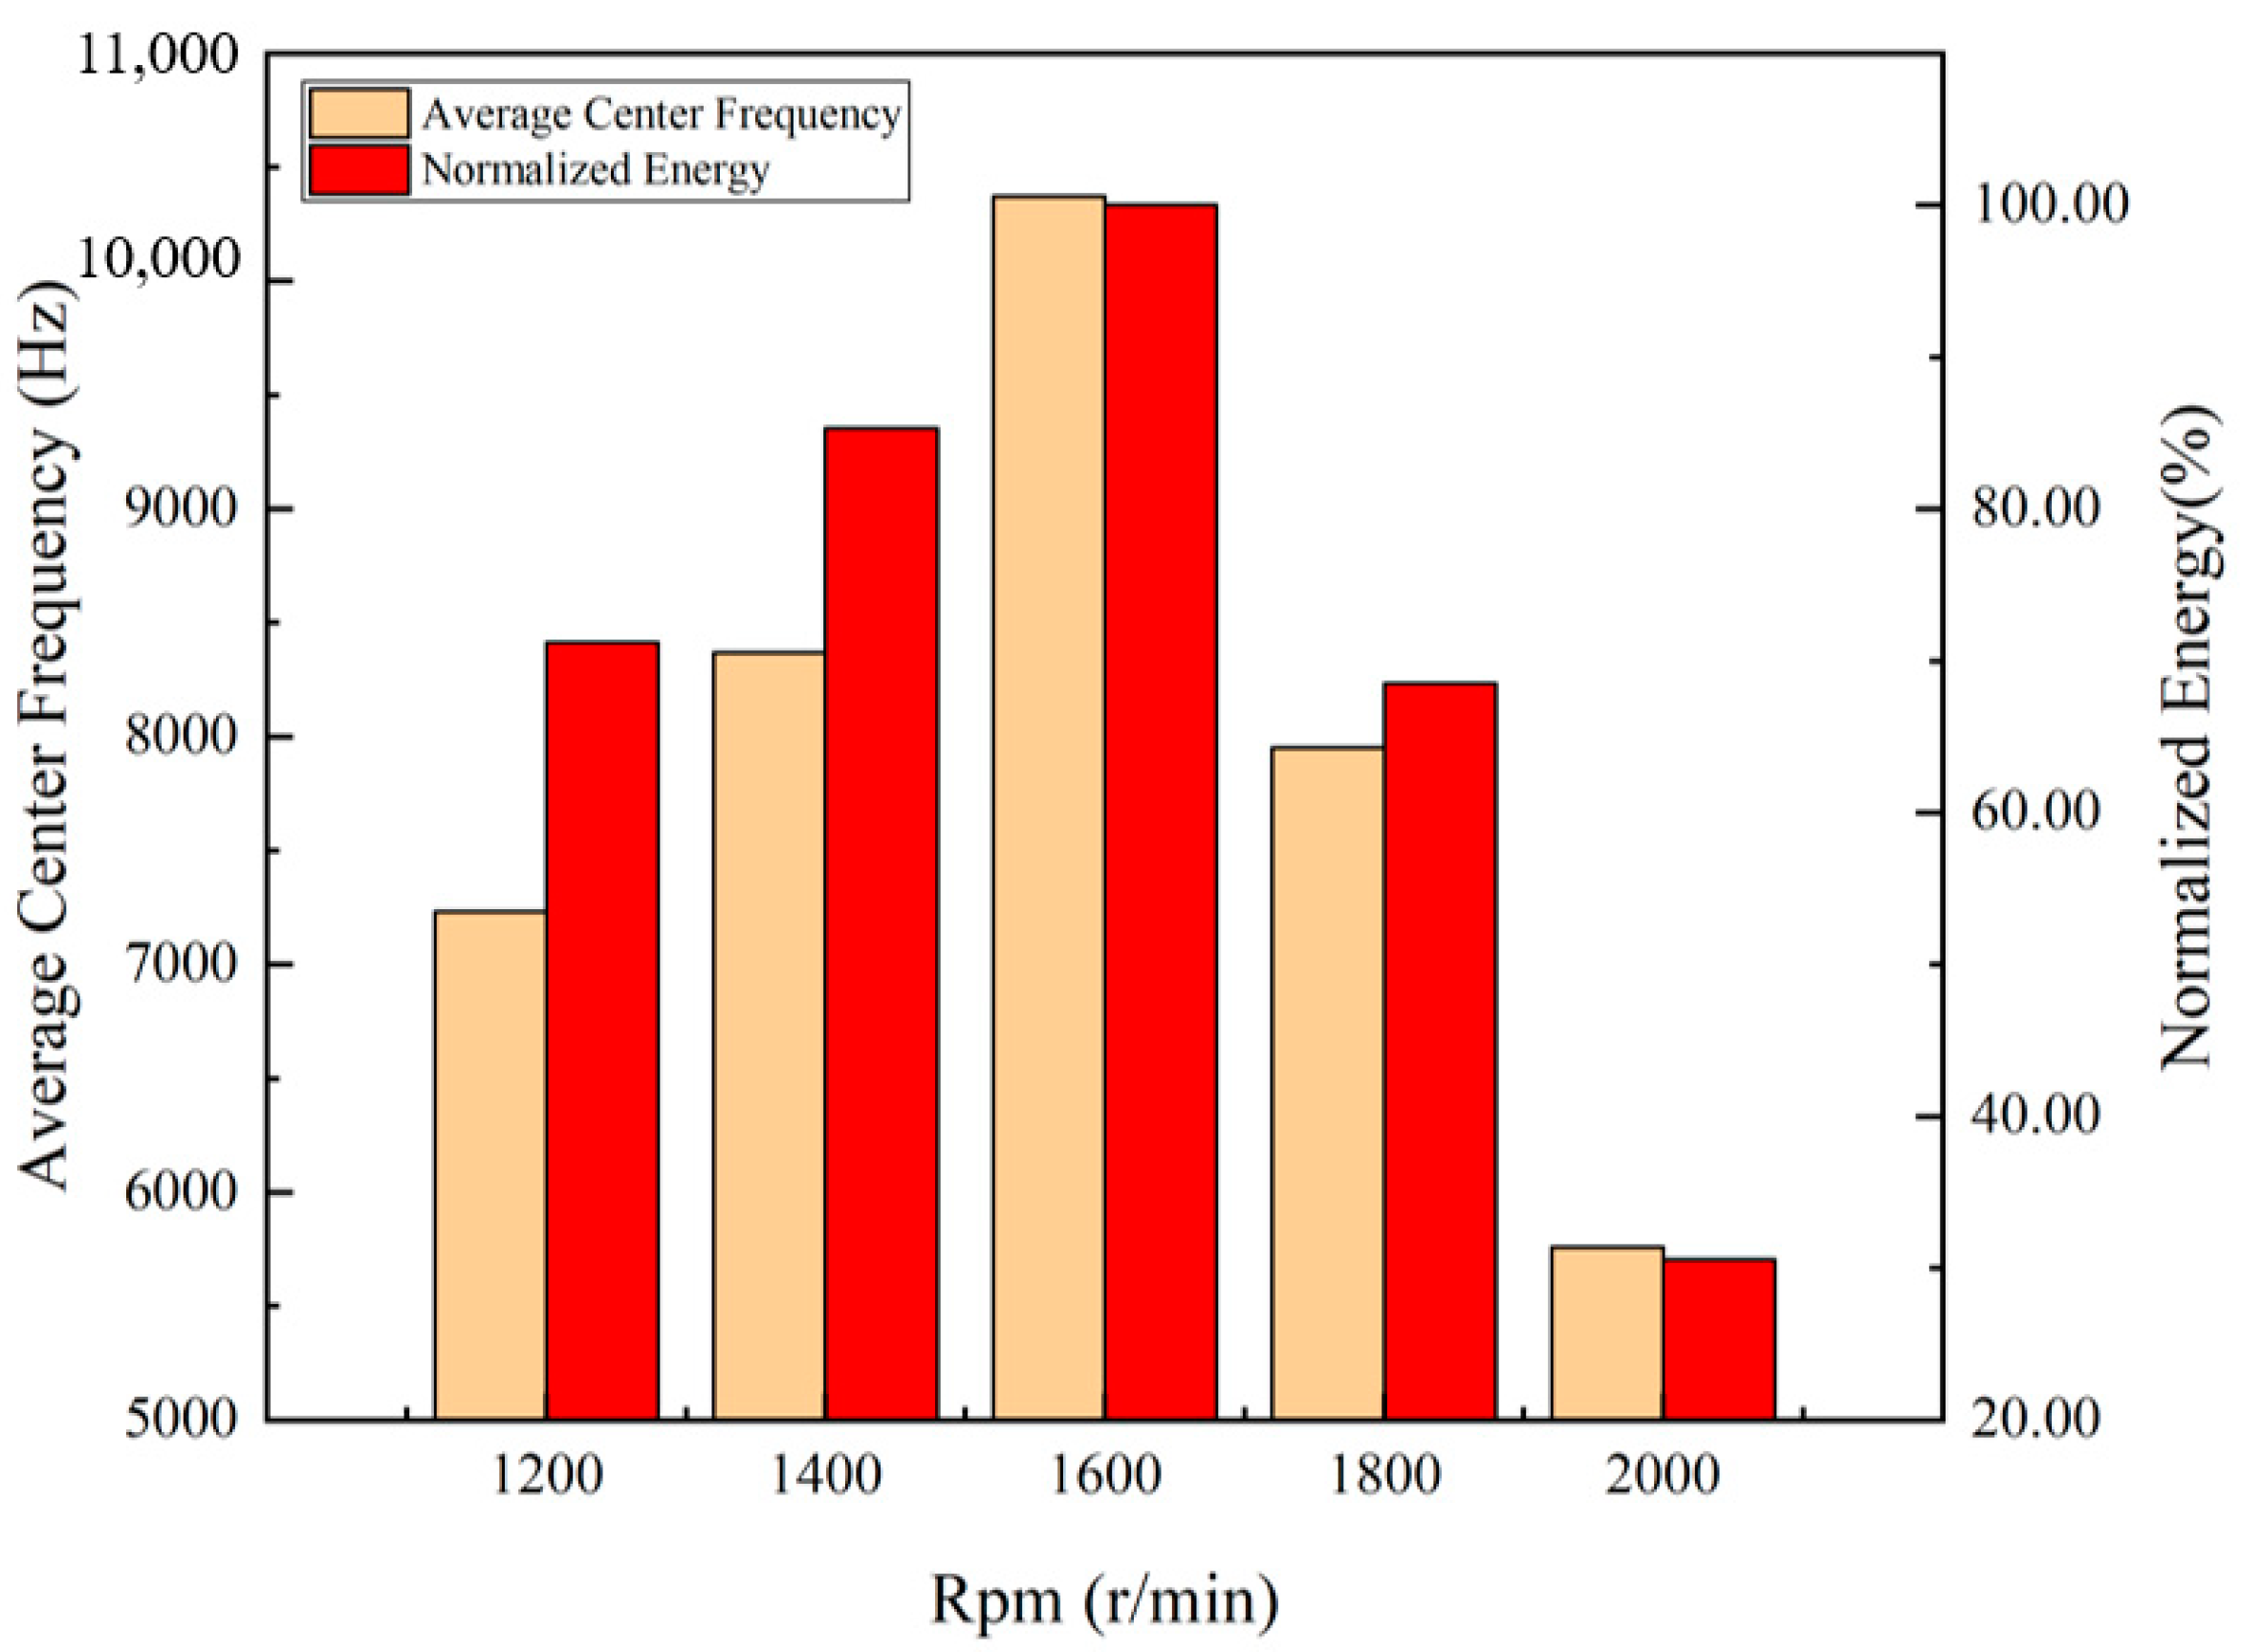
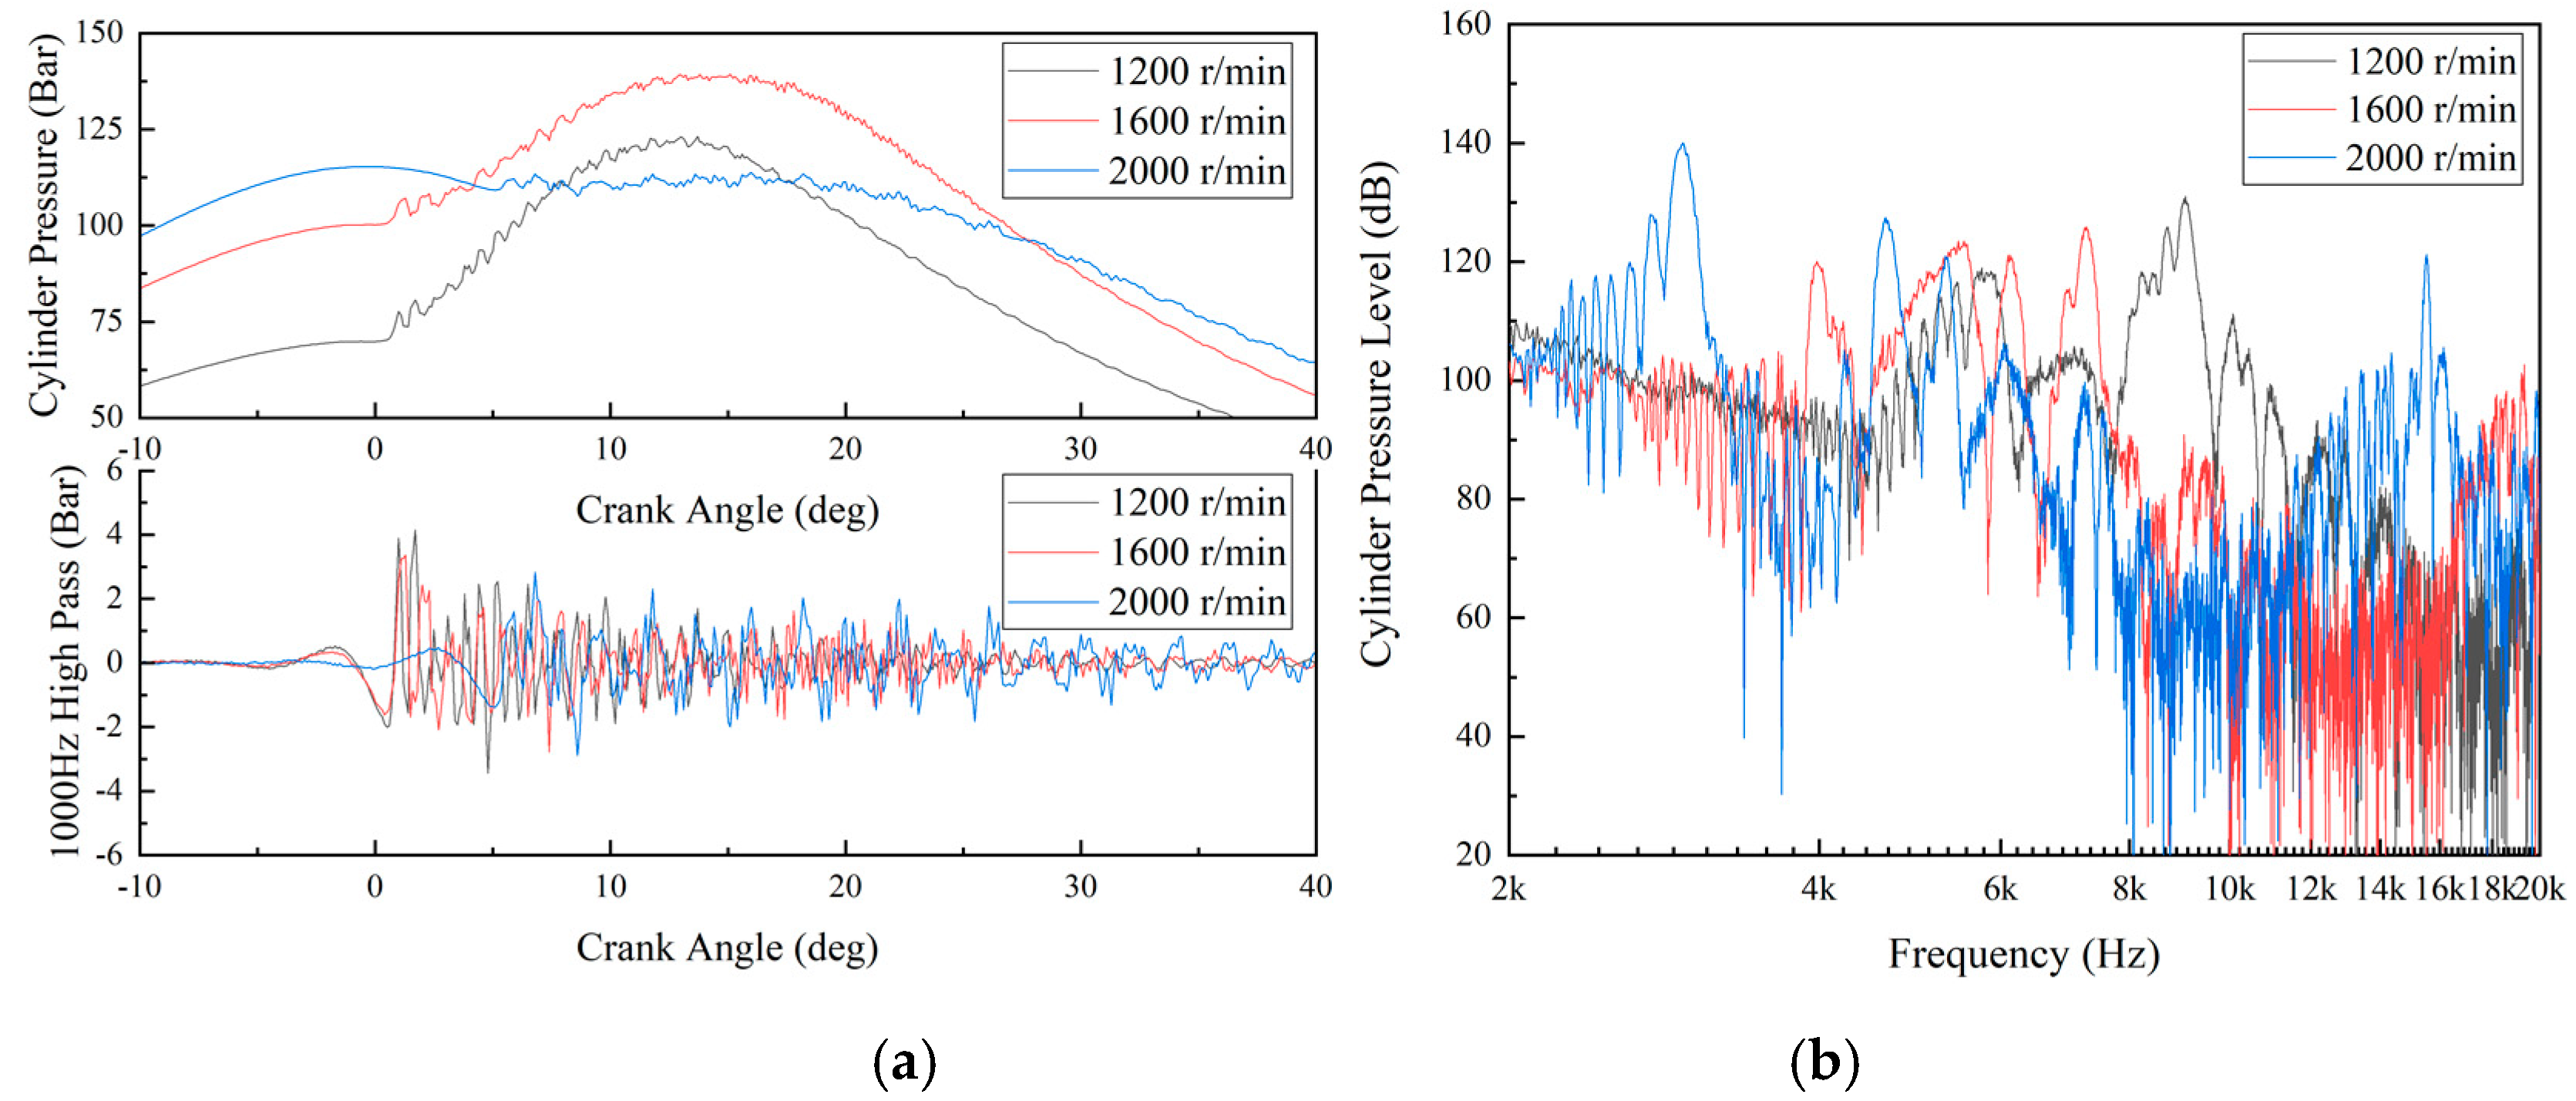
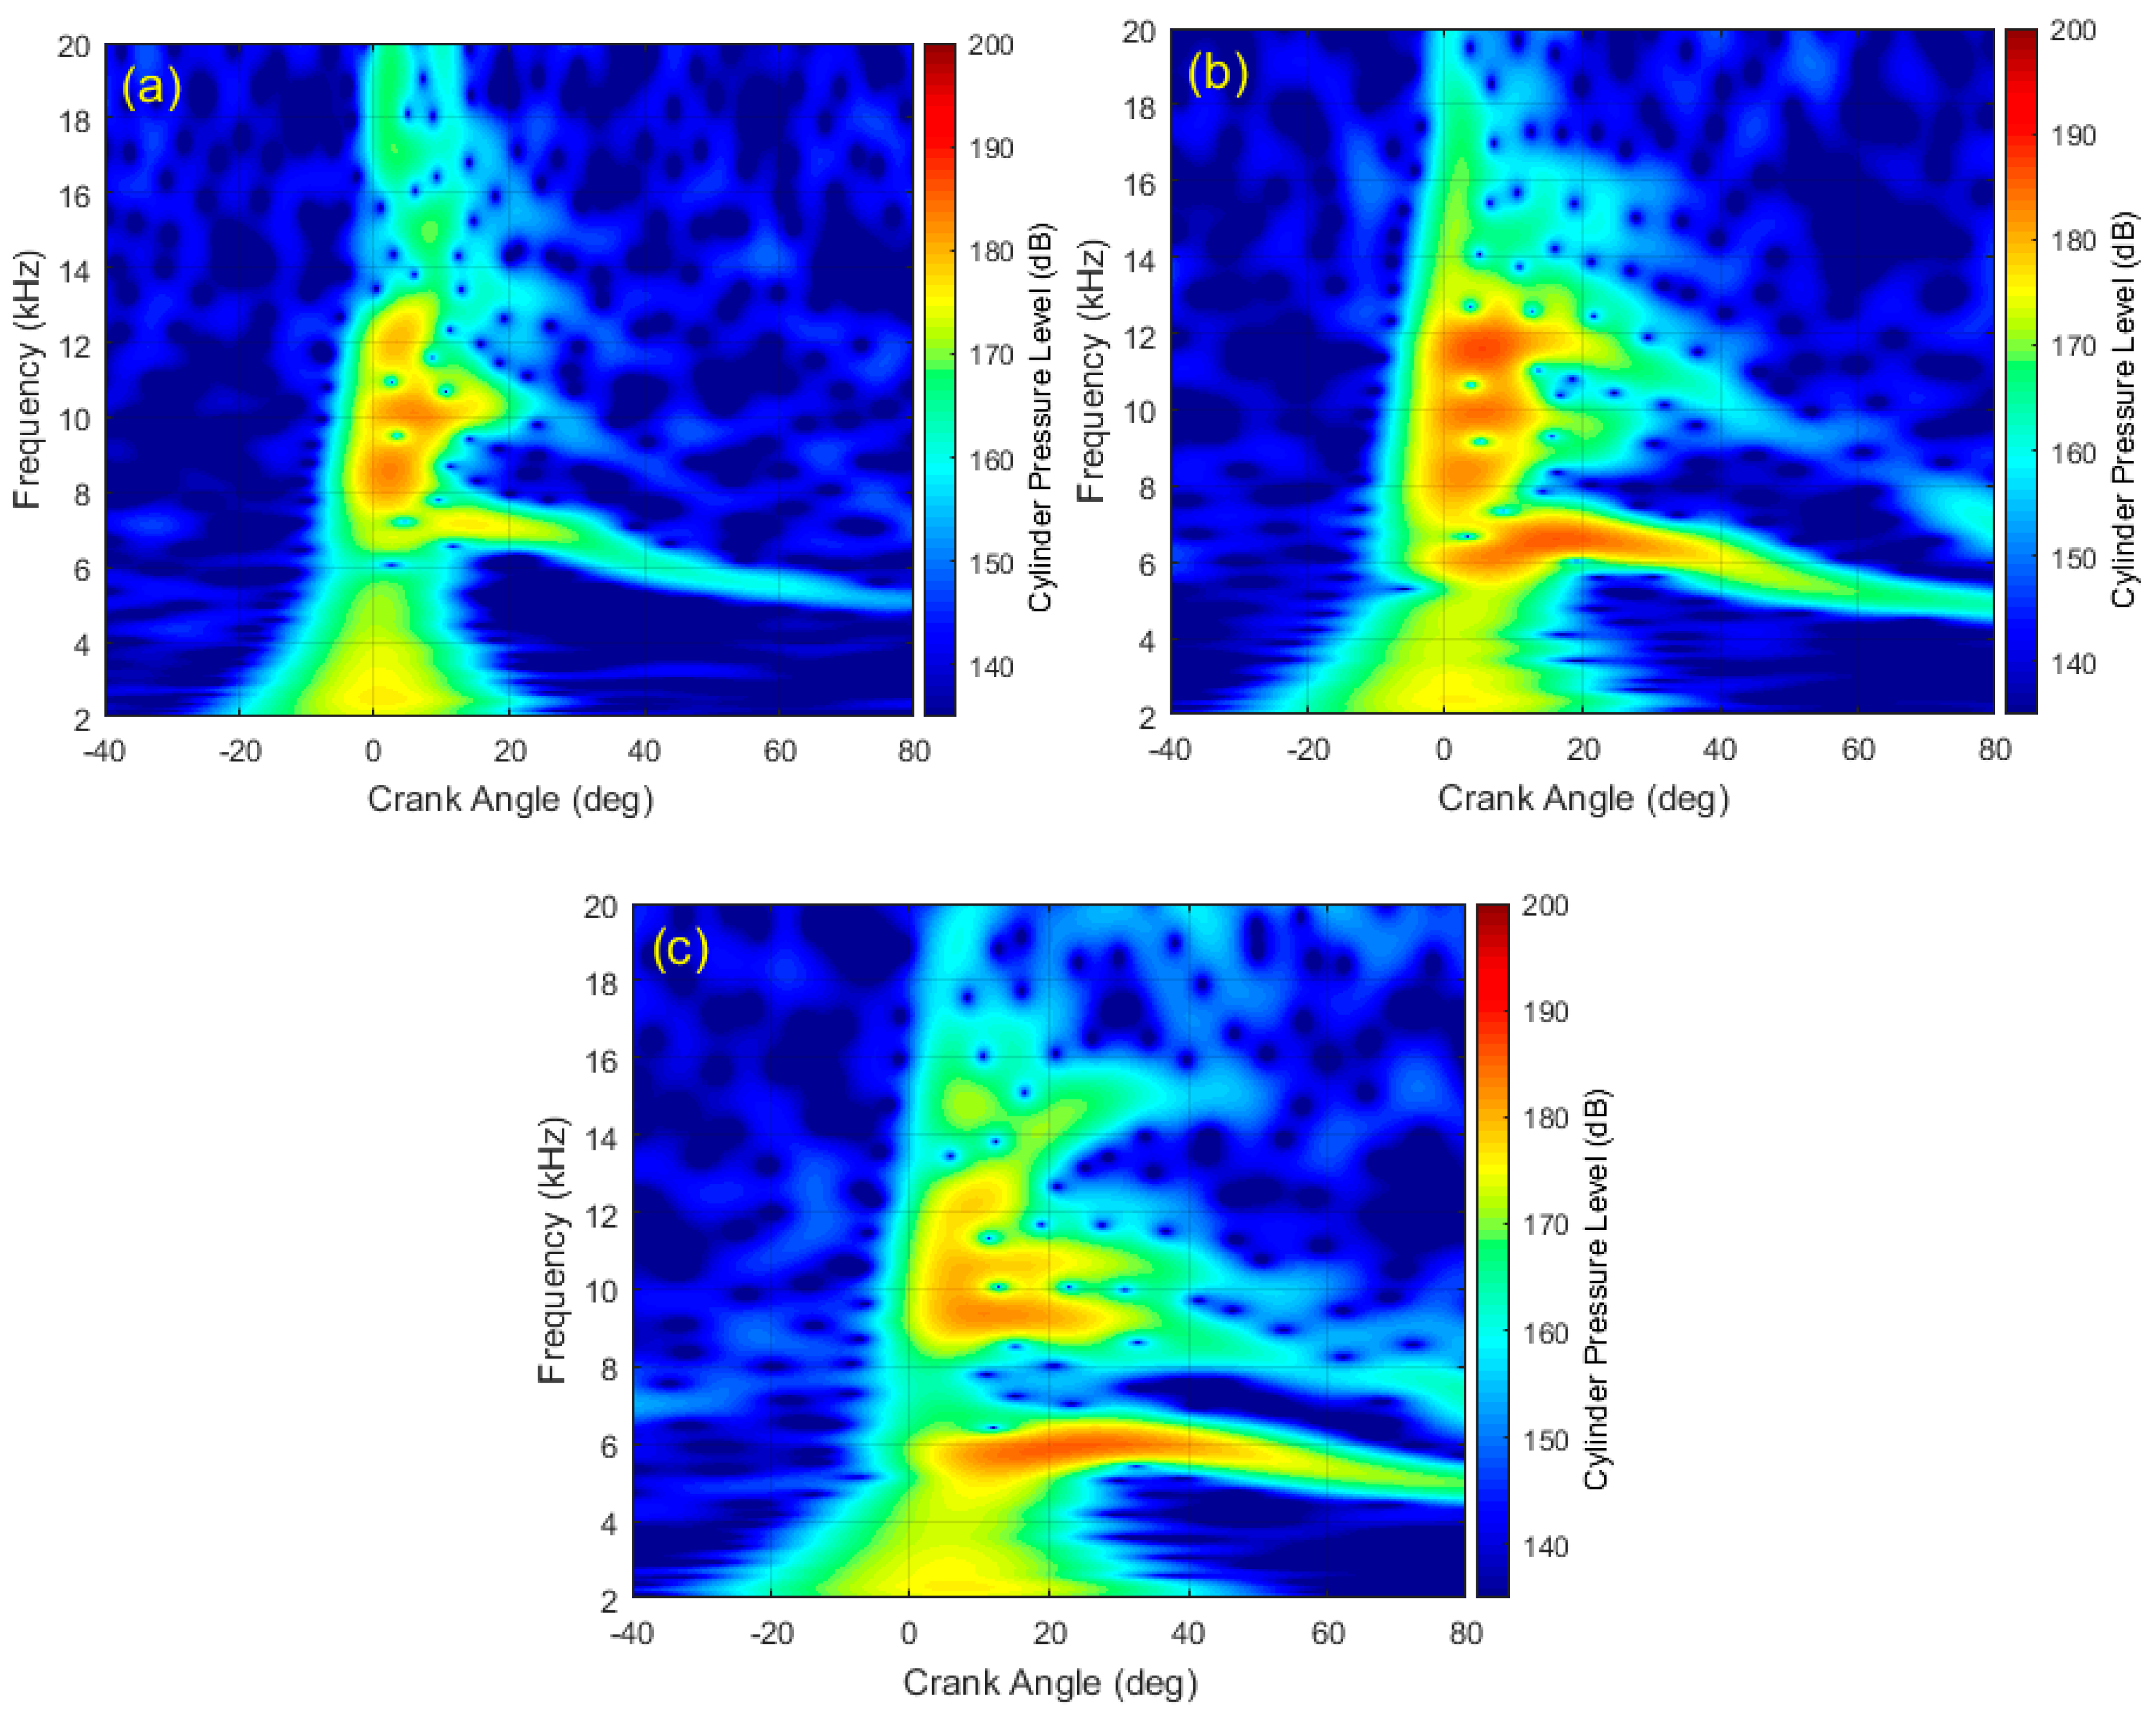
  • The working speed has great influence on the in-cylinder oscillation. As the speed increases, the dominant oscillation energy will move to the low-frequency range. The average oscillation center frequency rises first, and then rapidly decreases after reaching a peak at medium-high speed. The normalized energy trend of the oscillation also rises first and then falls, reaching a peak at medium-high speed.
  • The frequency and energy characteristics of high-frequency cylinder oscillation are related to the load and rail pressure. As the load and rail pressure increase, the pressure oscillation energy will increase significantly, and the dominant oscillation components will also move to high-frequency range.
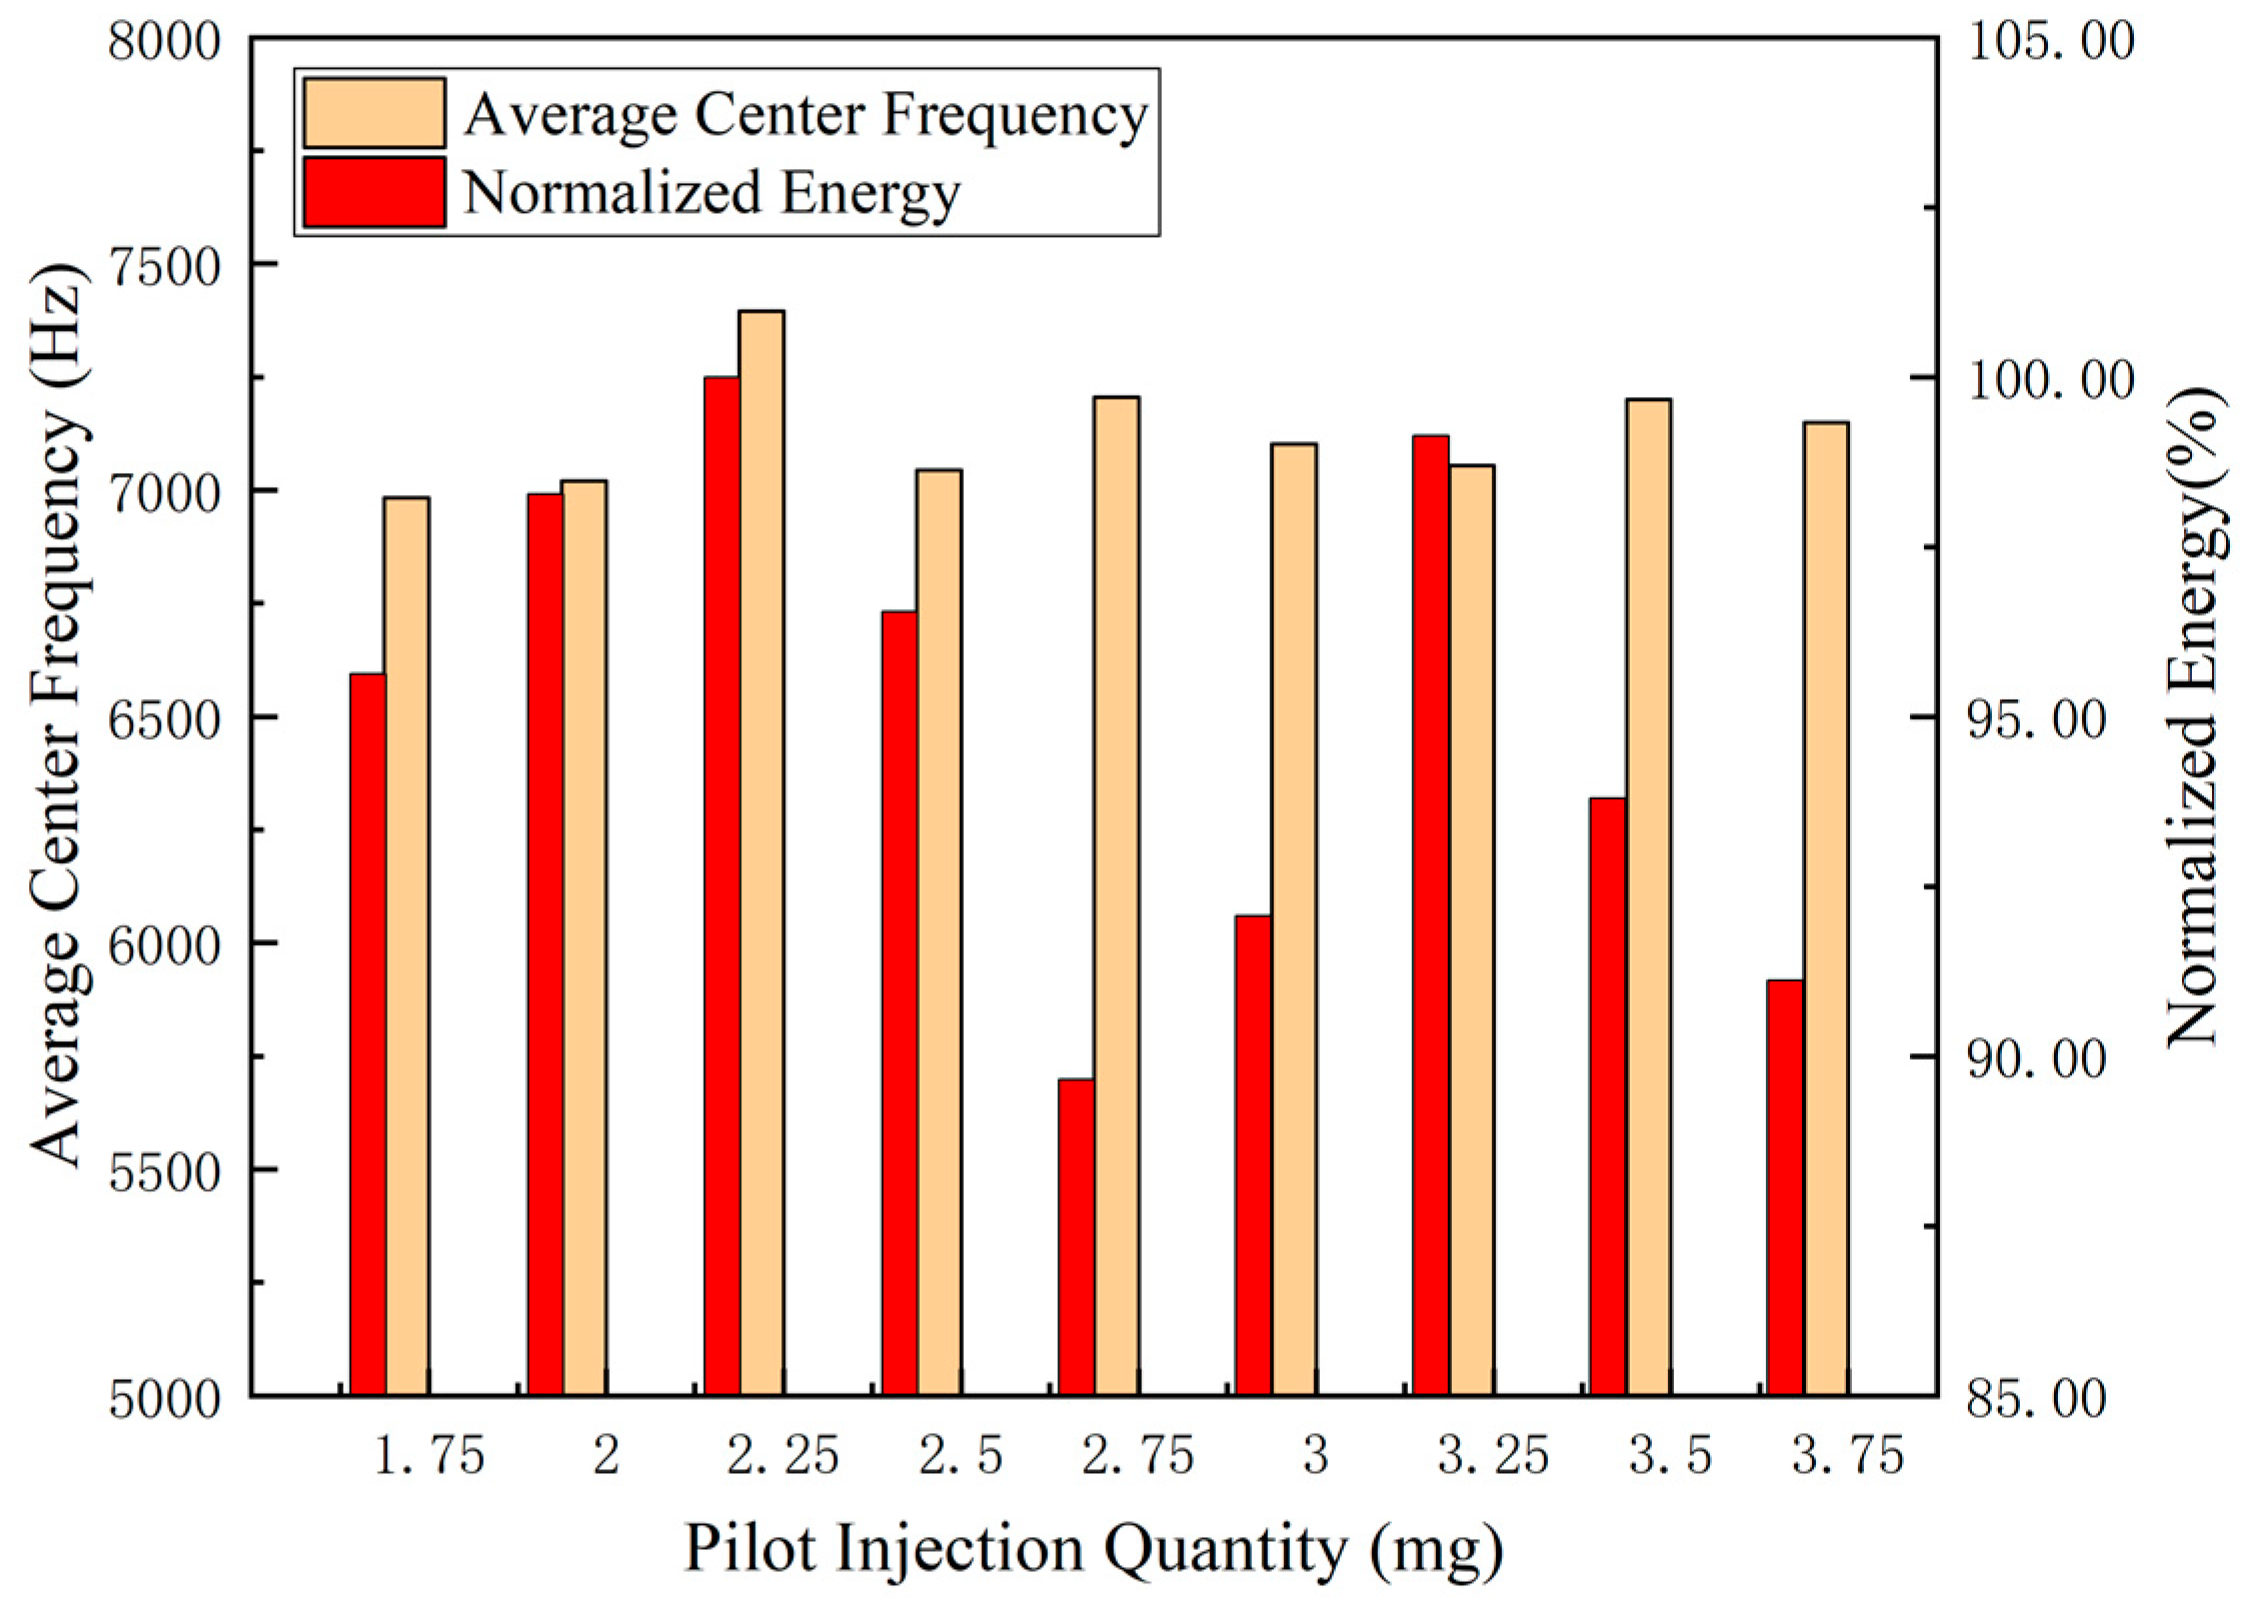
  • The influences of main injection timing, pilot injection interval and pilot injection quantity on high-frequency pressure oscillation are non-monotonic. However, as the main injection timing and pilot injection interval increase, the lowest normalized oscillation energy will occur with the lowest average frequency center, which are middle angle in this case respectively. In addition, affected by factors such as emissions, the adjustment range for pilot injection quantity is small, and its influence on high-frequency pressure oscillation is little.
  • Based on the proposed method, the frequency and energy of the in-cylinder pressure oscillation in each combustion stage can be effectively reduced by reasonable adjustment of working parameters. Therefore, by establishing the statistical relationship between the high-frequency in-cylinder oscillation and the sound quality of the engine, it is possible to rationally design the diesel engine with good sound quality performance.

Author Contributions

For this research, X.Z. and N.Z. designed the experiment; Q.Z. provided the support of signal processing; R.L. provided the experiment support; X.Z. and N.Z. wrote the paper; while Y.Q. and Z.H. further improved the manuscript. All authors have read and agreed to the published version of the manuscript.

Funding

This research was funded by National Natural Science Foundation of China, grant number 51876188.

Acknowledgments

The authors gratefully acknowledge Ningbo Institute of Technology, Hangzhou Bay Automotive College for providing test bench.

Conflicts of Interest

The authors declare no conflict of interest.

References

  1. Agudelo, A.F.; García-Contreras, R.; Agudelo, J.R.; Armas, O. Potential for exhaust gas energy recovery in a diesel passenger car under European driving cycle. Appl. Energy 2016, 174, 201–212. [Google Scholar] [CrossRef]
  2. Zhang, B.; Jiaqiang, E.; Gong, J.; Yuan, W.; Zuo, W.; Li, Y.; Fu, J. Multidisciplinary design optimization of the diesel particulate filter in the composite regeneration process. Appl. Energy 2016, 181, 14–28. [Google Scholar] [CrossRef]
  3. Wei, H.; Yao, C.; Pan, W.; Han, G.; Dou, Z.; Wu, T.; Liu, M.; Gao, J.; Chen, C.; Shi, J. To meet the demand of Euro V emission legislation urea free for HD diesel engine with DMCC. Fuel 2017, 207, 33–46. [Google Scholar] [CrossRef]
  4. Park, J.; Choi, J. Optimization of dual-loop exhaust gas recirculation splitting for a light-duty diesel engine with model-based control. Appl. Energy 2016, 181, 268–277. [Google Scholar] [CrossRef]
  5. Köten, H.; Parlakyiğit, A.S. Effects of the diesel engine parameters on the ignition delay. Fuel 2018, 216, 23–28. [Google Scholar] [CrossRef]
  6. Thangaraja, J.; Kannan, C. Effect of exhaust gas recirculation on advanced diesel combustion and alternate fuels - a review. Appl. Energy 2016, 180, 169–184. [Google Scholar] [CrossRef]
  7. Xiao, B.; Wang, W.; Zhang, X.; Long, G.; Fan, J.; Chen, H.; Deng, L. A novel fractal solution for permeability and Kozeny-Carman constant of fibrous porous media made up of solid particles and porous fibers. Powder. Technol. 2019, 349, 92–98. [Google Scholar] [CrossRef]
  8. Xiao, B.; Zhang, X.; Jiang, G.; Long, G.; Wang, W.; Zhang, Y.; Liu, G. Kozeny–carman constant for gas flow through fibrous porous media by fractal-monte carlo simulations. Fractals 2019, 27, 1950062. [Google Scholar] [CrossRef]
  9. Long, G.; Liu, S.; Xiao, B. A Perforation-Erosion Model for Hydraulic-Fracturing Applications. SPE Prod. Oper. 2018, 33, 770–783. [Google Scholar] [CrossRef]
  10. Liang, M.; Liu, Y.; Xiao, B.; Yang, S.; Wang, Z.; Han, H. An analytical model for the transverse permeability of gas diffusion layer with electrical double layer effects in proton exchange membrane fuel cells. Int. J. Hydrogen Energy 2018, 43, 17880–17888. [Google Scholar] [CrossRef]
  11. Zhang, Q.H.; Hao, Z.Y.; Zheng, X.; Yang, W.Y.; Mao, J. Mechanism and optimization of fuel injection parameters on combustion noise of DI diesel engine. J. Cent. South Univ. 2016, 23, 379–393. [Google Scholar] [CrossRef]
  12. JunKim, H.; Park, S.H.; Lee, C.S. Impact of fuel spray angles and injection timing on the combustion and emission characteristics of a high-speed diesel engine. Energy 2016, 107, 572–579. [Google Scholar]
  13. Kim, G.; Moon, S.; Lee, S.; Min, K. Numerical Analysis of the Combustion and Emission Characteristics of Diesel Engines with Multiple Injection Strategies Using a Modified 2-D Flamelet Model. Energies 2017, 10, 1292. [Google Scholar] [CrossRef] [Green Version]
  14. Torregrosa, A.J.; Broatch, A.; Gil, A.; Gomez-Soriano, J. Numerical approach for assessing combustion noise in compression-ignited Diesel engines. Appl. Acoust. 2018, 135, 91–100. [Google Scholar] [CrossRef]
  15. Broatch, A.; Lopez, J.J.; García-Tíscar, J.; Gomez-Soriano, J. Experimental Analysis of Cyclical Dispersion in Compression-Ignited Versus Spark-Ignited Engines and Its Significance for Combustion Noise Numerical Modeling. J. Eng. Gas Turbines Power 2018, 140, 102808. [Google Scholar] [CrossRef]
  16. Torregrosa, A.J.; Broatch, A.; Martín, J.; Monelletta, L. Combustion noise level assessment in direct injection diesel engines by means of in-cylinder pressure components. Meas. Sci. Technol. 2007, 18, 2131–2142. [Google Scholar] [CrossRef]
  17. Luján, J.M.; Guardiola, C.; Pla, B.; Bares, P. Estimation of trapped mass by in-cylinder pressure resonance in HCCI engines. Mech. Syst. Signal Process. 2016, 66, 862–874. [Google Scholar] [CrossRef]
  18. Diéguez, P.M.; Urroz, J.C.; Sáinz, D.; Machin, J.; Arana, M.; Gandía, L.M. Characterization of combustion anomalies in a hydrogen-fueled 1.4 L commercial spark-ignition engine by means of in-cylinder pressure, block engine vibration, and acoustic measurements. Energy Convers. Manag. 2018, 172, 67–80. [Google Scholar] [CrossRef]
  19. Payri, F.; Broatch, A.; Tormos, B.; Marant, V. New methodology for in-cylinder pressure analysis in direct injection diesel engines–application to combustion noise. Meas. Sci. Technol. 2005, 16, 5407. [Google Scholar] [CrossRef]
  20. Zhang, Q.; Hao, Z.; Zheng, X.; Yang, W. Characteristics and effect factors of pressure oscillation in multi-injection DI diesel engine at high-load conditions. Appl. Energy 2017, 195, 52–66. [Google Scholar] [CrossRef]
  21. Kyrtatos, P.; Hoyer, K.; Obrecht, P. Apparent effects of in-cylinder pressure oscillations and cycle-to-cycle variability on heat release rate and soot concentration under long ignition delay conditions in diesel engines. Int. J. Engine Res. 2014, 15, 325–337. [Google Scholar] [CrossRef]
  22. Kyrtatos, P.; Brückner, C.; Boulouchos, K. Cycle-to-cycle variations in diesel engines. Appl. Energy 2016, 171, 120–132. [Google Scholar] [CrossRef]
  23. Kyrtatos, P.; Brückner, C.; Boulouchos, K. Determination of the resonance response in an engine cylinder with a bowl-in-piston geometry by the finite element method for inferring the trapped mass. Int. J. Engine Res. 2016, 17, 534–542. [Google Scholar]
  24. Giancarlo, C.; Ornella, C.; Fulvio, P.; Andrea, P. Diagnostic methodology for internal combustion diesel engines via noise radiation. Energy Convers. Manag. 2015, 89, 34–42. [Google Scholar]
  25. Siavoshani, S.; Vesikar, P.B.; Pentis, D.; Ippili, R. Separation of Combustion and Mechanical Noise Using Wiener Filter. SAE Tech. Paper 2017. [Google Scholar] [CrossRef]
  26. Badawy, T.; Shrestha, A.; Henein, N. Detection of combustion resonance using anion current sensor in diesel engines. J. Eng. Gas Turbines Power. 2012, 132, 052802. [Google Scholar] [CrossRef]
  27. Albarbar, A.; Gu, F.; Ball, A.D. Diesel engine fuel injection monitoring using acoustic measurements and independent component analysis. Measurement 2010, 43, 1376–1386. [Google Scholar] [CrossRef] [Green Version]
  28. Hou, J.; Qiao, X.; Wang, Z.; Liu, W.; Huang, Z. Characterization of knocking combustion in HCCIDME engine using wavelet packet transform. Appl. Energy 2010, 87, 1239–1246. [Google Scholar] [CrossRef]
  29. Shi, L.; Deng, K.; Cui, Y.; Qu, S.; Hu, W. Study on knocking combustion in a diesel HCCI engine with fuel injection in negative valve overlap. Fuel 2013, 106, 478–483. [Google Scholar] [CrossRef]
  30. Wei, H.; Wei, J.; Shu, G. Calculation on cylinder pressure fluctuation by using the wave equation in the KIVA program. Chin. J. Mech. Eng. 2012, 25, 362–369. [Google Scholar] [CrossRef]
  31. Nishad, K.; Ries, F.; Li, Y.; Sadiki, A. Numerical Investigation of Flow through a Valve during Charge Intake in a DISI -Engine Using LargeEddy Simulation. Energies 2019, 12, 2620. [Google Scholar] [CrossRef] [Green Version]
  32. Huang, N.E.; Shen, Z.; Long, S.R.; Wu, M.C.; Shih, H.H.; Zheng, Q.; Yen, N.C.; Tung, C.C.; Liu, H.H. The empirical mode decomposition and the Hilbert spectrum for nonlinear and non-stationary time series analysis. Proc. R. Soc. Lond. A 1998, 454, 903–995. [Google Scholar] [CrossRef]
  33. Bi, F.; Ma, T.; Xu, W. Development of a novel knock characteristic detection method for gasoline engines based on wavelet-denoising and EMD decomposition. Mech. Syst. Signal Process. 2019, 117, 517–536. [Google Scholar] [CrossRef]
  34. Sankar kumar Roy, A.R. Mohanty.Use of rotary optical encoder for firing detection in a spark ignition engine. Measurement 2017, 98, 60–67. [Google Scholar]
  35. Fengrong, B.; Xin, L.; Chunchao, L.; Congfeng, T.; Teng, M.; Xiao, Y. Knock detection based on the optimized variational mode decomposition. Measurement 2019, 140, 1–13. [Google Scholar]
  36. Heng, L.; Zhi, L.; Wei, M. A time-varying filter approach for empirical mode decomposition. Signal Process 2017, 138, 146–158. [Google Scholar]
  37. Zhang, X.; Liu, Z.; Miao, Q.; Wang, L. An optimized time-varying filtering based empirical mode decomposition method with grey wolf optimizer for machinery fault diagnosis. J. Sound Vib. 2018, 418, 55–78. [Google Scholar] [CrossRef]
  38. Xu, Y.; Cai, Z.; Ding, K. An enhanced bearing fault diagnosis method based on TVF-EMD and a high-order energy operator. Meas. Sci. Technol. 2018, 29, 095108. [Google Scholar] [CrossRef]
  39. Stockwell, R.G.; Mansinha, L.; Lowe, R.P. Localization of the complex spectrum: The S transform. IEEE Trans. Signal Process. 1996, 44, 998–1001. [Google Scholar] [CrossRef]
Figure 1. Experimental setup and equipment.
Energies 13 00871 g001
Figure 2. Time-frequency distribution (TFD) of the in-cylinder pressure under 1400 r/min full load condition: (a) TFD results of generalized S transform (GST); (b) TFD results of adaptive generalized S transform (AGST).
Energies 13 00871 g002
Figure 3. Time-frequency distribution (TFD) of the high-frequency in-cylinder pressure oscillation under 1400 r/min full load condition.
Energies 13 00871 g003
Figure 4. Decomposed results of the in-cylinder pressure under 1400 r/min full load condition by ensemble empirical mode decomposition (EEMD): (a) angle domain results; (b) frequency domain results.
Energies 13 00871 g004
Figure 5. The decomposed results of original cylinder pressure signal of 1400 r/min full load by TVF- EMD: (a) angle domain results; (b) frequency domain results.
Energies 13 00871 g005
Figure 6. In-cylinder pressure signal and 1000 Hz high pass signal at 1400 r/min, full load condition: (a) in-cylinder pressure in angle domain; (b) in-cylinder pressure in frequency domain.
Energies 13 00871 g006
Figure 7. (a) Comparison chart of a 1000Hz high-pass filtered cylinder pressure signal and white noise in angle domain; (b) 1000Hz high-pass filtered cylinder pressure signal and white noise in the frequency domain.
Energies 13 00871 g007
Figure 8. The process of the cyclic average time varying filter based empirical mode decomposition (TVF-EMD) method.
Energies 13 00871 g008
Figure 9. IMFs components of in-cylinder pressure by cyclic average TVF-EMD with 100 cycles: (a) in the crank angle domain; (b) in the frequency domain.
Energies 13 00871 g009
Figure 10. Protruding ratio (PR) of adaptive cyclic average TVF-EMD with different ensemble averaging time: 10 cycles to 100 cycles.
Energies 13 00871 g010
Figure 11. Intrinsic mode functions (IMFs) components of in-cylinder pressure by cyclic average TVF-EMD with different cyclic number in crank angle domain: (a) 10; (b) 50; (c) 70 cycles.
Energies 13 00871 g011
Figure 12. IMFs components of in-cylinder pressure by adaptive cyclic average TVF-EMD with different ensemble averaging time in frequency domain: (a) 10; (b) 50; (c) 70 cycles.
Energies 13 00871 g012
Figure 13. The method steps for identifying the in-cylinder high-frequency oscillation components.
Energies 13 00871 g013
Figure 14. Average center oscillation frequency and the normalized oscillation energy under different engine speed.
Energies 13 00871 g014
Figure 15. In-cylinder pressure at different engine speeds: (a) in angle domain; (b) infrequency domain.
Energies 13 00871 g015
Figure 16. Time-frequency distribution (TFD) at different engine speeds: (a) 1200; (b) 1600; (c) 2000 r/min.
Energies 13 00871 g016
Figure 17. The average center oscillation frequency and the normalized average oscillation energy under different loads.
Energies 13 00871 g017
Figure 18. Cylinder pressure in (a) angle domain and (b) frequency domain of different loads.
Energies 13 00871 g018
Figure 19. Time-frequency distribution (TFD) of different load: (a) 100% load; (b) 50% load.
Energies 13 00871 g019
Figure 20. Average center oscillation frequency and the normalized average oscillation energy under different rail pressures.
Energies 13 00871 g020
Figure 21. Cylinder pressure in (a) angle domain and (b) frequency domain of different rail pressures.
Energies 13 00871 g021
Figure 22. Time-frequency distributions (TFD) of different rail pressure values: (a) 960; (b) 760 bar.
Energies 13 00871 g022
Figure 23. Average center oscillation frequency and the normalized average oscillation energy under different main injection timing.
Energies 13 00871 g023
Figure 24. Average center oscillation frequency and the normalized average oscillation energy under different pilot injection interval.
Energies 13 00871 g024
Figure 25. Average center oscillation frequency and the normalized average oscillation energy under different pilot injection quantity.
Energies 13 00871 g025
Table 1. Specific engine parameters tested.
ParametersValueParametersValue
Displacement, L2.2Cooling and Intake modeWater and Turbocharged
Cylinder bore, mm86Maximum Torque, N*m285
Compression ratio16.5Rated power, kW80
Number of cylinders4Rated Speed, r/min3200
Table 2. Specification of working conditions.
Speed(r/min)Load (%)Fuel Injection Parameters
RP (bar)MIT (°CA)PII (°CA)PIQ (mg)
120009605.5102.0
50
100
100960–760
9603–7.5
5.56–18
101.75–3.75
14001009807112.0
160011006.512
18001105213
200011203.513.5
Table 3. Detailed configuration of the workstation.
ParameterValue
CPU Series ModelIntel ® Xeon® Gold 6148
Multi-core number of CPU’s20
CPU Clock Speed24.0 GHz
Memory Capacity128 GB
Number of CPU2
Table 4. Evaluation indexes of pressure oscillation components of 1400 r/min full load condition.
Working ConditionCenter Frequency (Hz)Normalized Energy (%)Average Center Frequency (Hz)
1400 r/min
full load
11,01396.1010,841
67553.90
Table 5. Average Center Frequency and Normalized Energy of three characteristic speeds of full load.
SpeedCenter Frequency (Hz)Normalized Energy (%)Average Center Frequency (Hz)Normalized Energy (%)
1200 r/min
full load
652059.73723171.22
870036.94
11,1401.33
1600 r/min
full load
682023.5110,370100.00
958014.22
10,81058.26
2000 r/min
full load
571087.81576030.62
87405.52
11,1400.67
* where the peak value of normalized energy and the related average center frequency is bold.
Table 6. Average Center Frequency and Normalized Energy of 100% and 50% load.
Load (%)Center Frequency (Hz)Normalized Energy (%)Average Center Frequency (Hz)Normalized Energy (%)
100701014.619860100.00
880038.99
10,44041.30
50634081.2263802.12
91407.64
11,0503.64
* where the peak value of normalized energy and the related average center frequency is bold.
Table 7. Average Center Frequency and Normalized Energy of 960 and 760 bar.
Rail Pressure (bar)Center Frequency (Hz)Normalized Energy (%)Average Center Frequency (Hz)Normalized Energy (%)
960682023.5210,370100.00
958014.21
10,81058.27
760678052.23705048.83
961022.01
10,48021.76
* where the peak value of normalized energy and the related average center frequency is bold.

