Article

Application Study on a New Hybrid Canning Structure of After-Treatment System for Diesel Engine

1
School of Automotive studies, Tongji University, Shanghai 201804, China
2
Kailong High Technology Co., Wuxi 214153, China
*
Authors to whom correspondence should be addressed.
Energies 2020, 13(3), 734; https://doi.org/10.3390/en13030734
Submission received: 19 December 2019 / Revised: 28 January 2020 / Accepted: 3 February 2020 / Published: 7 February 2020
(This article belongs to the Section B: Energy and Environment)

Abstract

:
Based on the airflow rotation concept, a new packaging structure was designed to meet the performance requirements of China-VI stage emission regulations. The new structure is a hybrid structure of spiral space with small blades and conical plates. The Computational Fluid Dynamics (CFD) simulation was used to analyze the velocity uniformity and ammonia uniformity of the flow field, and the results showed that velocity uniformity and ammonia uniformity were higher than 0.95, and the possibility of crystallization risk was very low. The actual performance of the new structural prototype was verified by means of engine bench testing. The test results were excellent and the conversion efficiency reached 0.96. The new selective catalytic reduction (SCR) urea mixed structure design greatly improved the conversion efficiency of the after-treatment system and has excellent anti-crystallization performance.

1. Introduction

From July 2021, China VI emission regulation will be implemented national wide throughout the country. The existing traditional canning and mixer structure under China V will be difficult to meet the updated emission regulation. It is imperative to develop a more advanced canning structure to fulfill the target. Selective Catalytic Reduction (SCR) is regarded as the most promising technical solution for reducing nitrogen oxides (NOx) in exhaust gas in most countries, and it is widely used all over the world [1]. The structure of the SCR mixing chamber in the after-treatment system has a great impact on the conversion efficiency of the catalytic unit [2]. Zhang et al designed a new claw mixer based on the traditional mixer and found that the new mixer can effectively reduce the risk of crystallization while ensuring a higher distribution of reducing agents [3]. Choi et al applied a numerical analysis of NOx reduction for compact design in marine urea-SCR system and found that the compact structure can reduce 55% of the chamber and connecting pipe without decreases of NOx reduction efficiency [4]. In addition, many researched have studied the miniaturization of the mixer of the SCR system [5,6,7,8]. In terms of other aspect of the SCR system, Kusaka et al. evaluated the reaction efficiency of the SCR catalyst substrate by establishing a single-channel two-dimensional numerical model for the oxidation catalyst, and found that the numerical model results are consistent with the experimental results [9]. Eichelbaum et al. studied the pyrolysis and hydrolysis characteristics of aqueous urea solution on different SCR catalyst coated supports. It was found that all solid crystals were decomposed into isocyanic acid and cyanide when the reaction temperature was higher than 600 °C [10]. Kuhnke first established a spray/wall effect model and improved the urea injection accuracy [11]. During the collision process, droplets were divided into four states: deposition, splash, rebound, and thermal decomposition [12,13,14,15]. Birkhold extended the four hitting areas in the model to six, increasing the partial and partial fracture areas and enhancing the prediction of wall formation in the SCR system [16]. Meingast et al. carried out a deeper optimization based on the original urea droplet evaporation model. They considered the effect of urea dissolution rate on droplet evaporation behavior, and established three new theoretical models for the droplet evaporation process [17]. Liao et al. analyzed the spray/wall heat transfer characteristics of UWS under different exhaust gas flow conditions on the basis of predecessors. It was found that the cooling effect of spray on the exhaust gas flow rate and temperature was greatly reduced, and the wall temperature and droplet dynamics were determined together. Spray/wall heat transfer [18]. Wanke et al. established a corresponding model for the pyrolysis process of urea droplets, and found that a single droplet will undergo rapid decomposition reaction when pyrolyzed at 827 °C, generating equal amounts of ammonia and isocyanic acid [19]. Teawha analyzed and compared the two types of blade arrangement of the grid plate static mixer by numerical simulation, namely linear and spiral arrangement, they found that the angle of the blade is 45°. In the case of a mixer, the catalyst uniformity index is increased by about 20% and the resulting pressure loss is small [20]. Tan et al. used computational fluid dynamics software to perform multiple operating conditions on the built-in double-layer rotary vane mixer. The comparative analysis shows that the double mixer unit structure can significantly improve the droplet breakage and evaporation effect, and can better improve the uniformity of NH3 distribution on the front end of the substrate [21]. Capetillo et al. used the whole factor experiment (DOE) to measure the effect of various factors on the ammonia distribution mean index, depressurization and liquid film formation. It was found that the blade angle of the rotary vane mixer had an important influence on the performance of the mixer, the number of blades was second, and the influence of the mixer on the distance of the injector was the smallest [22]. To study the prevention of low-temperature crystallization, Ström et al. proposed that the addition of adiabatic insulation can effectively reduce the amount of sediment formation [23]. However, this type of mixer needs to match the type of spray, otherwise it will be detrimental to the decomposition of urea [24]. Based on the thermodynamic properties of the wall membrane in computational fluid dynamics, Henrik et al. accurately predicted the risk of formation of sediments in the rotary vane mixer, and systematically studied the depletion rate of the components at different reaction temperatures. When the temperature is raised to 350 °C, it can initiate the rapid decomposition of deposits formed below 250 °C [25].
The structure of the SCR mixing chamber in the after-treatment unit has a great influence on the conversion efficiency of the catalytic unit. This paper aims to develop a new mixer that can effectively reduce the crystallization risk under the condition of high reductant distribution by studying the influence of the mixer structure on the tail gas purification performance. The development of the mixer provides a new research direction for the design of the China-VI stage product, which can be used for reference in the design of small size after-treatment products in the China-VI stage period.

2. Research Plan

2.1. Proposed New Mixer and Canning Design

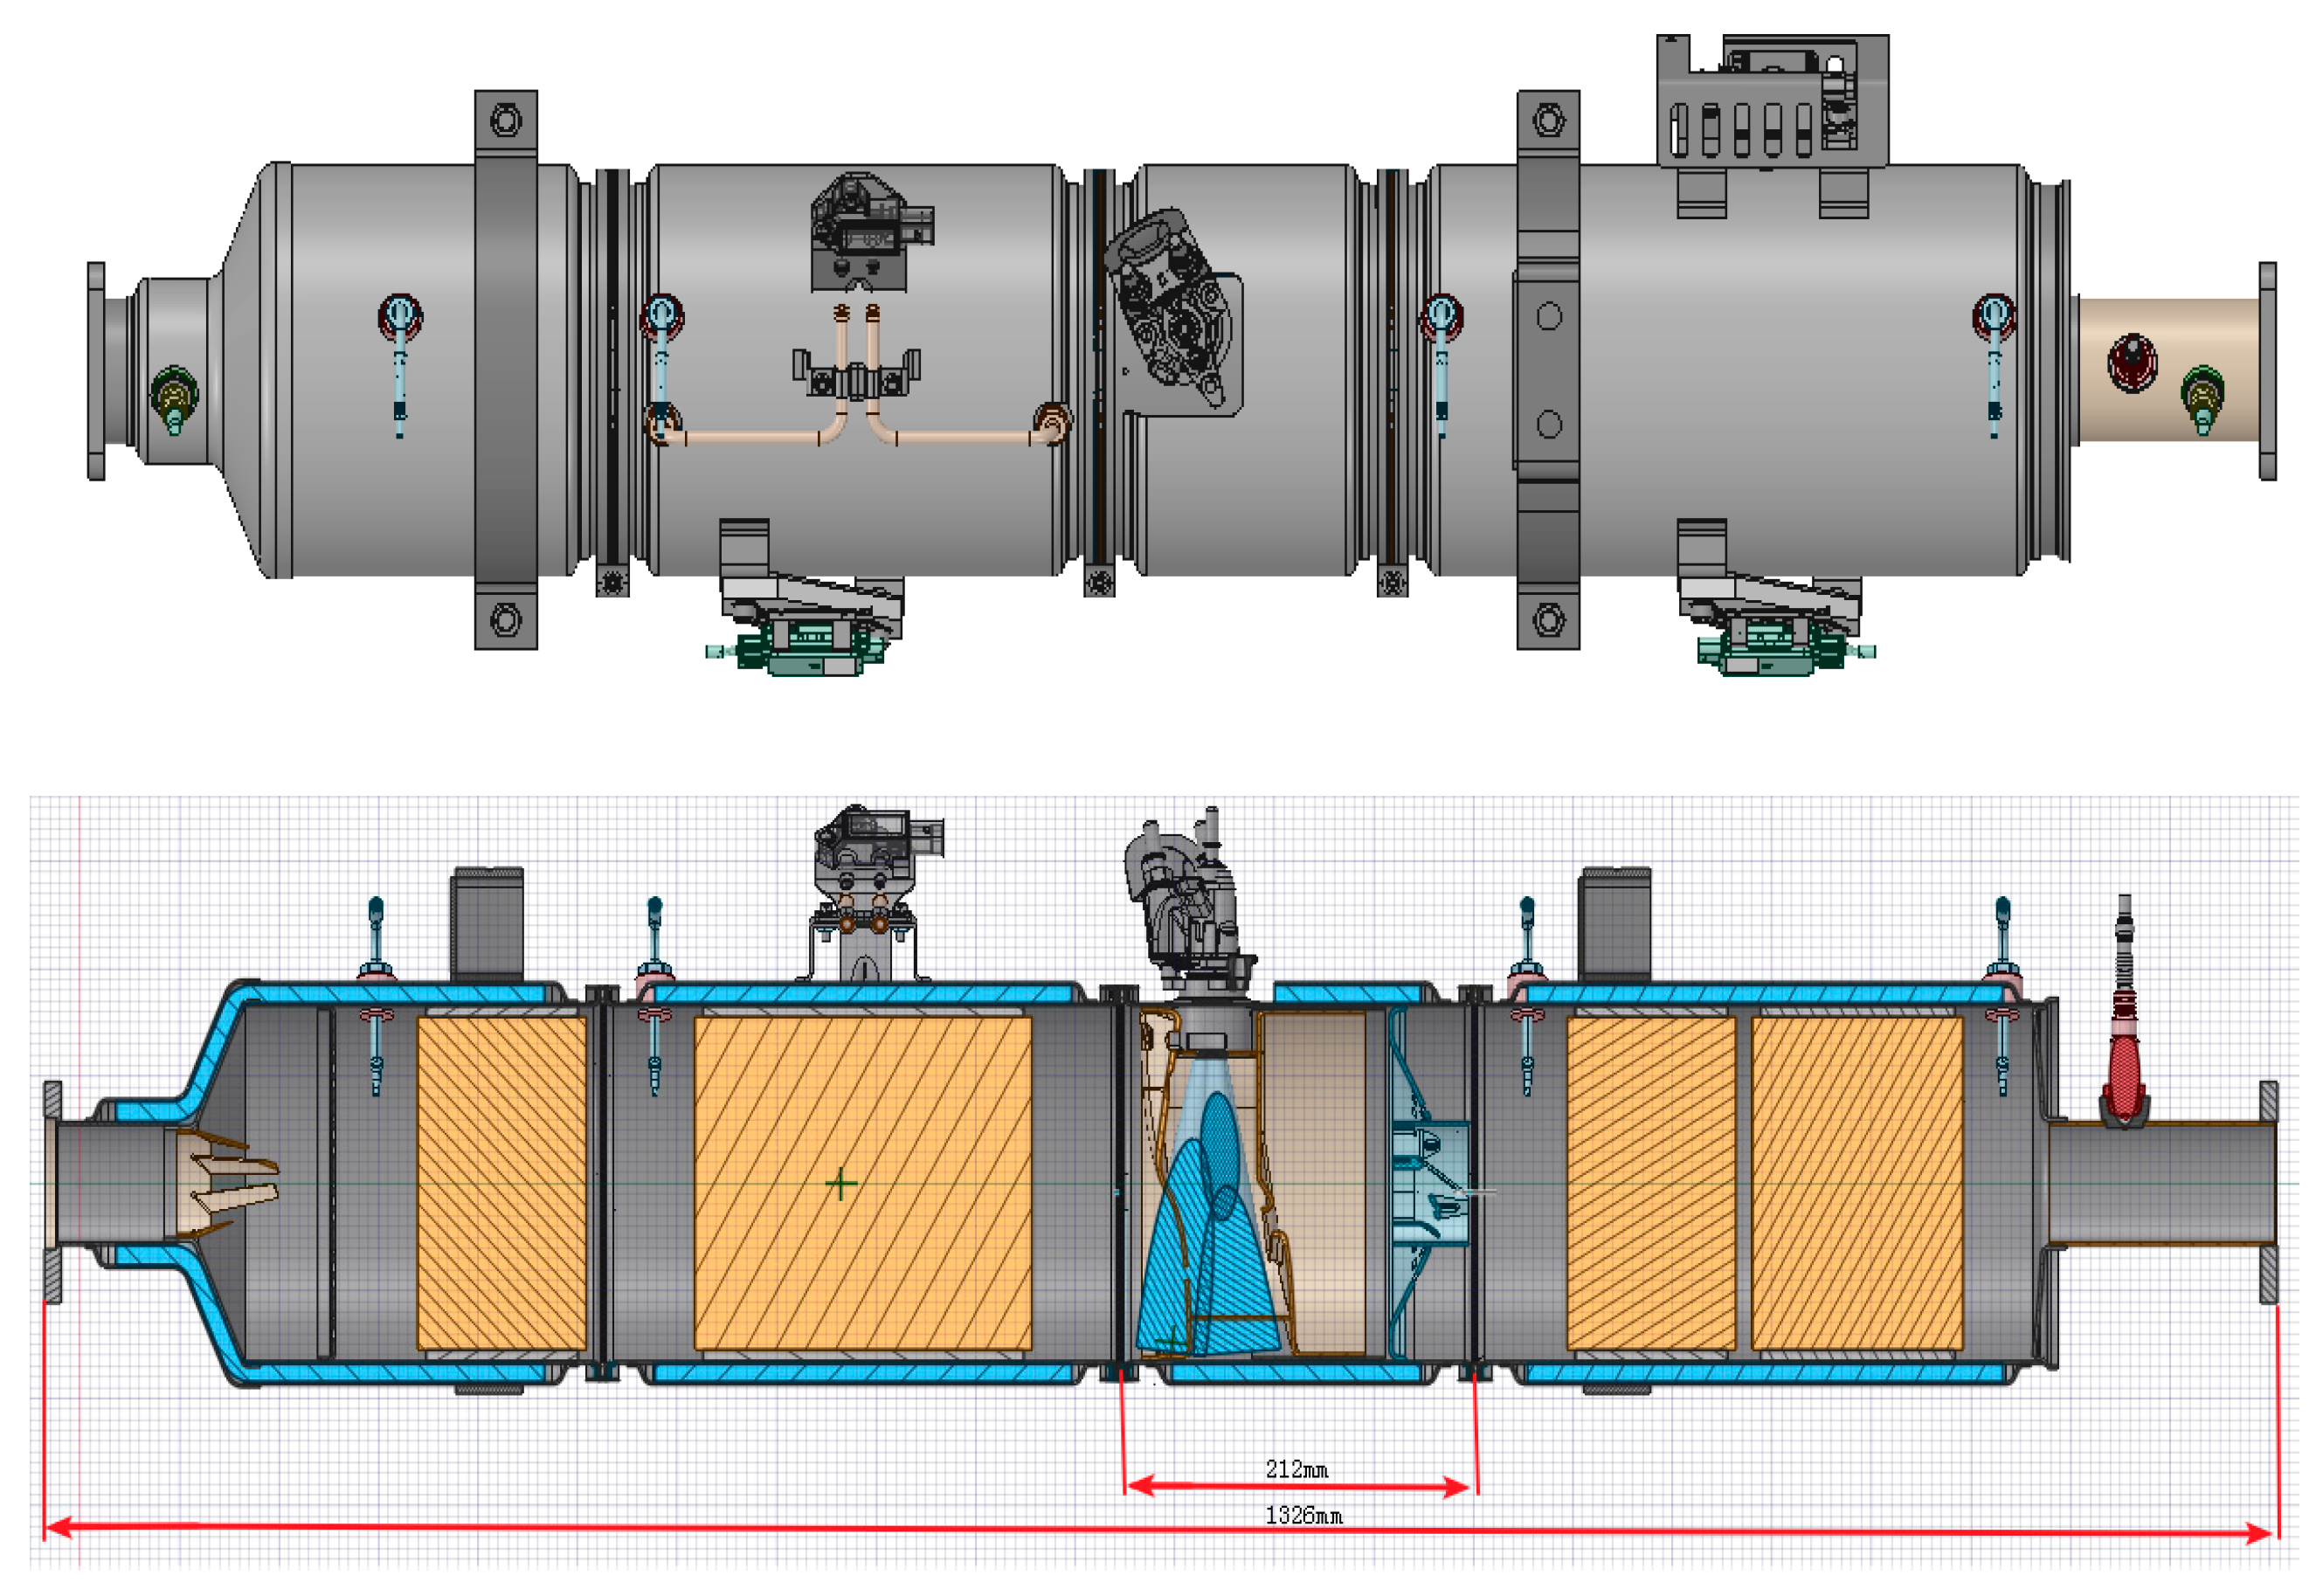
A typical layout of the exhaust gas after-treatment system in China V stage is shown in Figure 1. Urea is injected into the exhaust pipe through a nozzle at a specific angle towards the mixer. The turbulence produced by the mixer will enhance the atomization and evaporation effect of the mixture of the ammonia and the exhaust gas flow. This process requires a certain space to gain the reaction time. Naturally, an adequate mixing distance at downstream of the mixer is required to satisfy the urea hydrolysis and pyrolysis reactions, and also to promote the thorough mixing of the exhaust gas and the ammonia gas. However, the longer mixing distance brings more temperature loss, and the chemical reaction process of the catalytic unit is quite sensitive to temperature, especially in the low temperature range of the chemistry reaction window of the catalyst. Shortening the physical length of canning structure is the best way to reduce the temperature loss, and the compact structure of the exhaust gas after-treatment system can better adapt to the spatial arrangement of various vehicles.
For this reason, this study proposed a new concept to improve the conversion efficiency, while still being able to work well within a compact space and shorter length of mixing section. The design contains hybrid cavity structure and utilizes circumferential space to cope the flow path for adequate urea hydrolysis and pyrolysis reactions time. In order to further enhance the effect, a tapered plate combined with a mixer is arranged behind the mixing chamber, and the overall structure is as shown in Figure 2.
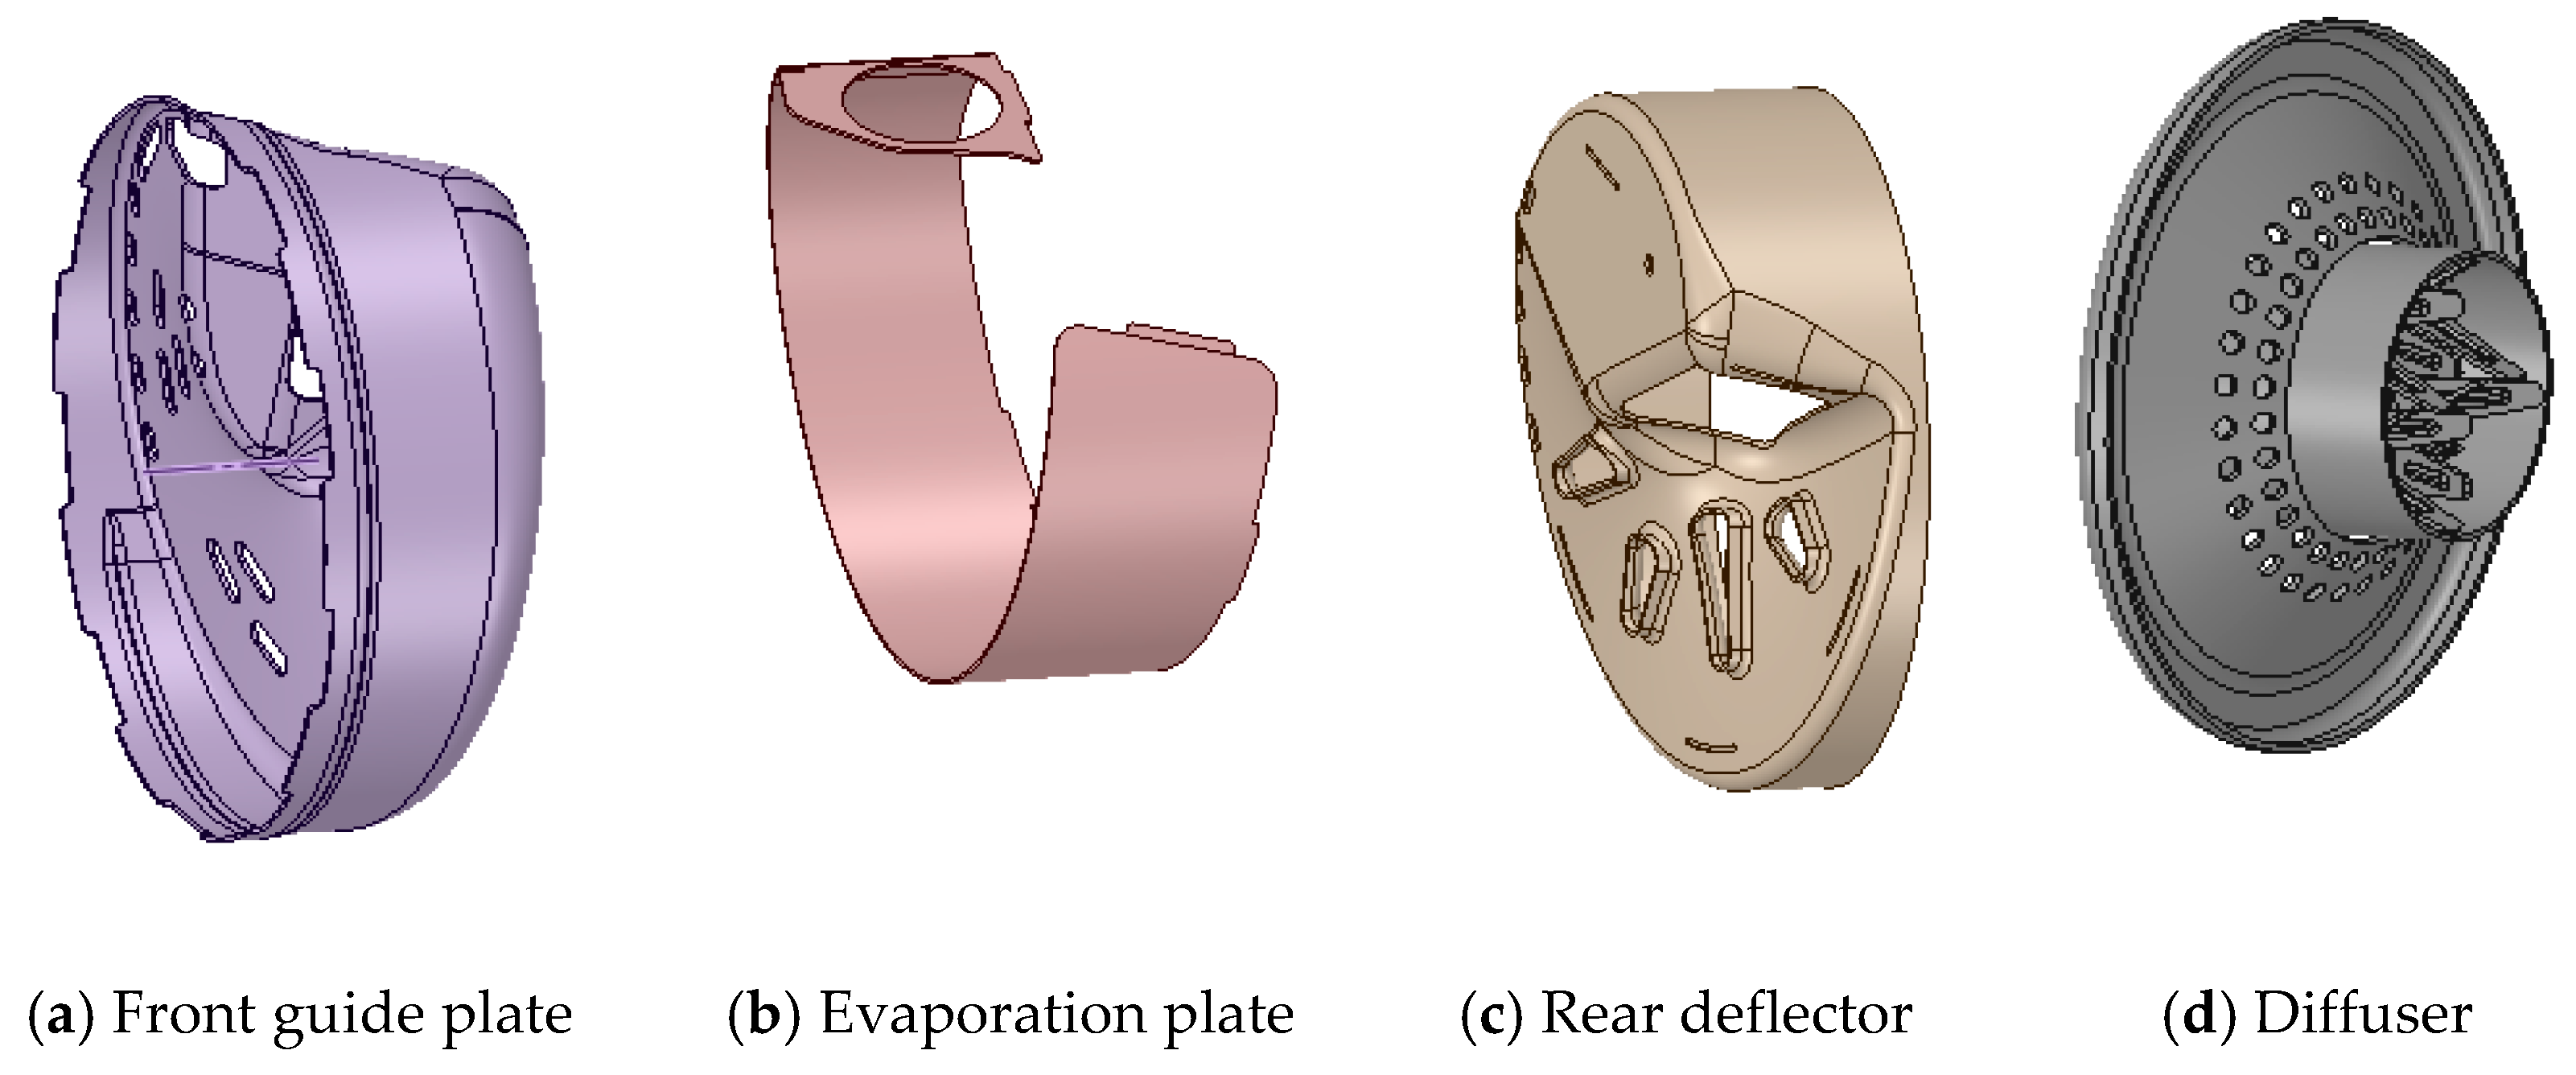
The new mixing chamber layout scheme can be seen from the canning structure as shown in Figure 2. For more detailed illustration, the main components to form the mixer chamber include three parts, as shown in Figure 3, labeled as a, b and c. The special curved surface shape enables the airflow to form a long-path swirling flow along the circumferential direction. In order to promote the ammonia generation of urea, on the other hand, the ammonia gas can be quickly mixed with the exhaust gas. Urea is injected directly into the chamber from the nozzle, which will locate on the surface of the bumping area. Usually, the surface temperature of the outer cylinder is low, and the intermediate partition (b) has a small hole in the place where the partition is in contact with the other two curved surfaces (a, c) so that the urea is not directly sprayed on the inner wall surface of the cylinder. The high-temperature airflow is continuously heating the opposite side of the urea wall area, and the temperature of the liquid film in the wall area is greatly increased by heat transfer, thus, the evaporation is accelerated, and the crystallization rate becomes lower. Considering the swirling gas flow in the mixing chamber, it can be foreseen that due to the centrifugal phenomenon in the mixing of the discrete phases, the distribution of the ammonia gas on the surface of the substrate may not be uniform enough, and the local concentration may be too high or too low. In order to make the ammonia distribution more uniform, a tapered hollow baffle, as shown in Figure 3, part d, was designed in the mixing chamber to collect the gas in the middle, slow down the centrifugal phenomenon, and add a blade mixer in the middle of the conical baffle. The mixer can create turbulence, so that the ammonia gas is mixed evenly before entering the coated substrate. Considering the throttling effect of the conical diaphragm, pressure loss is generated, and the pressure relief hole is evenly arranged on the circumferential surface of the conical plate to reduce the back pressure.

2.2. Simulation Analysis

Under the premise of determining the overall structure of the SCR catalyst, the new hybrid mixer designed in this paper was accurately modeled. The hexahedral and tetrahedral meshes were divided into the substrate and fluid domains by ICEM software. The pressure loss of the substrate under different flow rates was determined based on the cold flow back pressure test. The porous medium numerical model was established for the catalyst substrate. Subsequently, a numerical model of the unidirectional flow field was established for the catalyst, and the flow field velocity distribution and wall temperature distribution characteristics of the catalyst structure were studied. The discreate phase model (DPM) component transport model, and the atomization fracture model of urea solution were used to simulate the denitrification process of SCR catalyst. The uniformity of ammonia concentration distribution and liquid film distribution of the new structural scheme were analyzed and generated for the catalyst. The crystallization site is subjected to a crystallization risk assessment. The crystallization test of the catalyst of the new SCR hybrid structure was carried out, and the results of the bench test were highly correlated with the conclusions of the simulation analysis.
Considering the actual calculation conditions and the running time spent, it is more reasonable to calculate the internal flow field of the SCR catalyst by selecting the k-ε model of the two equations in the RANS. This semi-empirical modified k-ε model is a turbulent flow. Viscosity adds a formula that ensures the mathematical constraints of Reynolds pressure and the continuity of turbulence. The model also performs well in terms of fluid rotational motion, boundary layer flow, flow separation, and secondary flow.
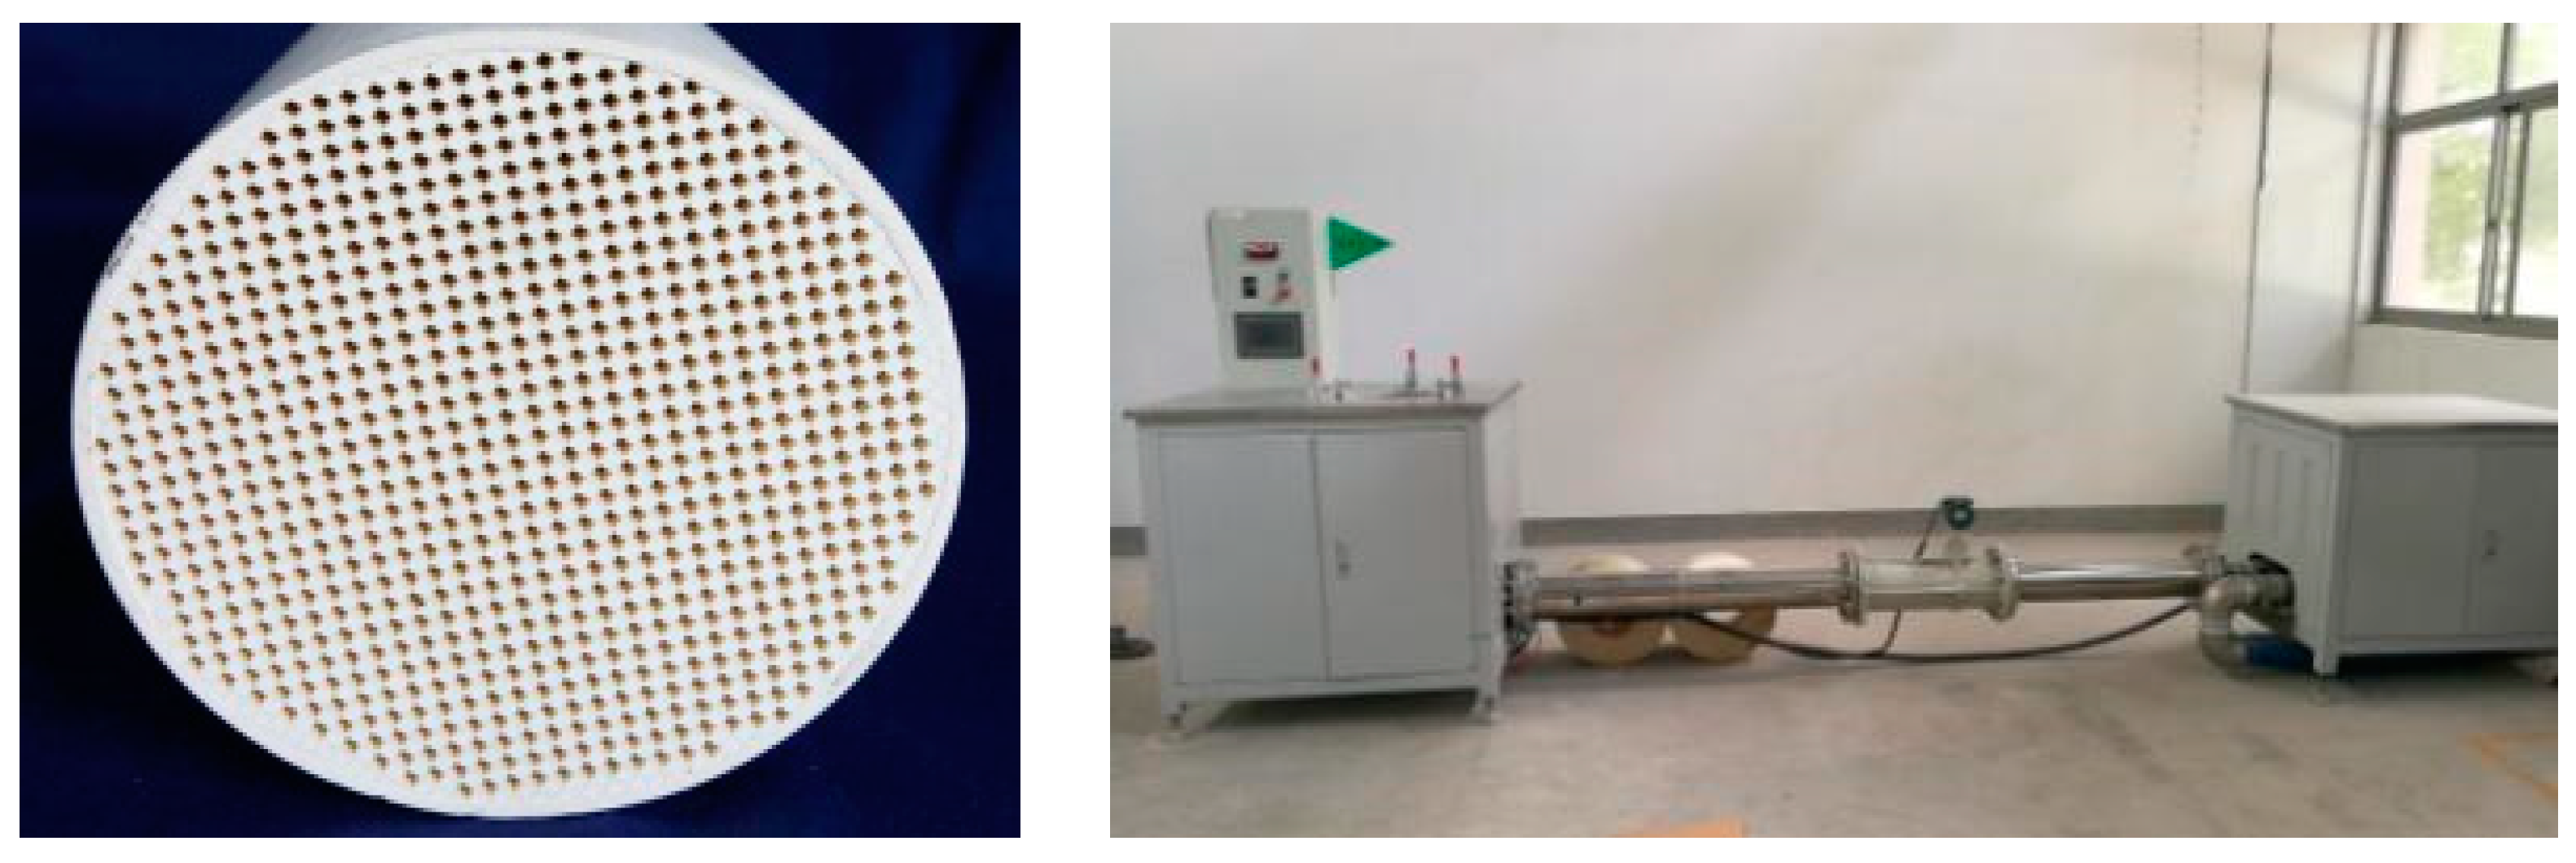
In the simulation process of SCR substrate, the internal flow field is regarded as a fully developed steady-state incompressible laminar flow, and its internal flow is described using a porous medium model. The pressure loss values of the catalyst substrate under different flow conditions were determined by experiments, as shown in Figure 4, and the inertial drag coefficient and the viscous drag coefficient were calculated by Darcy’s law.
The urea liquid jet is selected by a three-hole conical injection method, and the particle size of the urea droplet injection follows as the Rosin-Rammler distribution. The spray droplet breakage model is a wave breaking model (KH-RT) with a discrete phase calculation time of 0.1 s.
The KHRT model assumes that a liquid core exists in the near nozzle region. Child droplets are shed from this liquid core and are subjected to sudden acceleration when they are ejected into the free-stream and a Rayleigh-Taylor instability becomes the dominant effect. The length of the liquid core is obtained from Levich theory [26]:
L = C L d 0 ρ l ρ g
where C L is the Levich constant and d 0 is a reference nozzle diameter.
The volume of the catalyst in the heated state is almost constant and the fluid inflow is relatively uniform, which can be regarded as an incompressible steady flow. The engine exhaust is set as an ideal gas. The k-ε two-equation mathematical model under RANS is used to describe the turbulent flow, and the component transport model is started. The equation is expressed as follows:
( ρ C S ) t + div ( ρ u C S ) = div ( D s gard ( ρ C s ) ) + S S
where Cs is the volume concentration, ρ C S is the mass concentration, Ds is the component diffusion coefficient, and SS is the mass of the component produced by the chemical reaction.
The engine operating conditions were selected as the four operating conditions shown in Table 1 below, and the catalyst inlet and outlet diameters were all 77 mm. The catalyst inlet boundary condition is set to the mass flow inlet, the outlet boundary condition is set by the pressure outlet (default setting is a standard atmospheric pressure), the turbulent energy value is 5% of the square of the average inlet velocity, and the characteristic length value is 10% of the outlet diameter. The boundary condition at the wall surface of the catalyst is defined as frictionless and non-slip. The wall and cylinder material is set to iron, and the heat transfer coefficient is set to 10 W/m2·K. Considering the convective heat transfer between the outer wall and the outside air, the mat attached the substrate has a density of 400 kg/m3 and a specific heat of 1000 J/kg·°C.
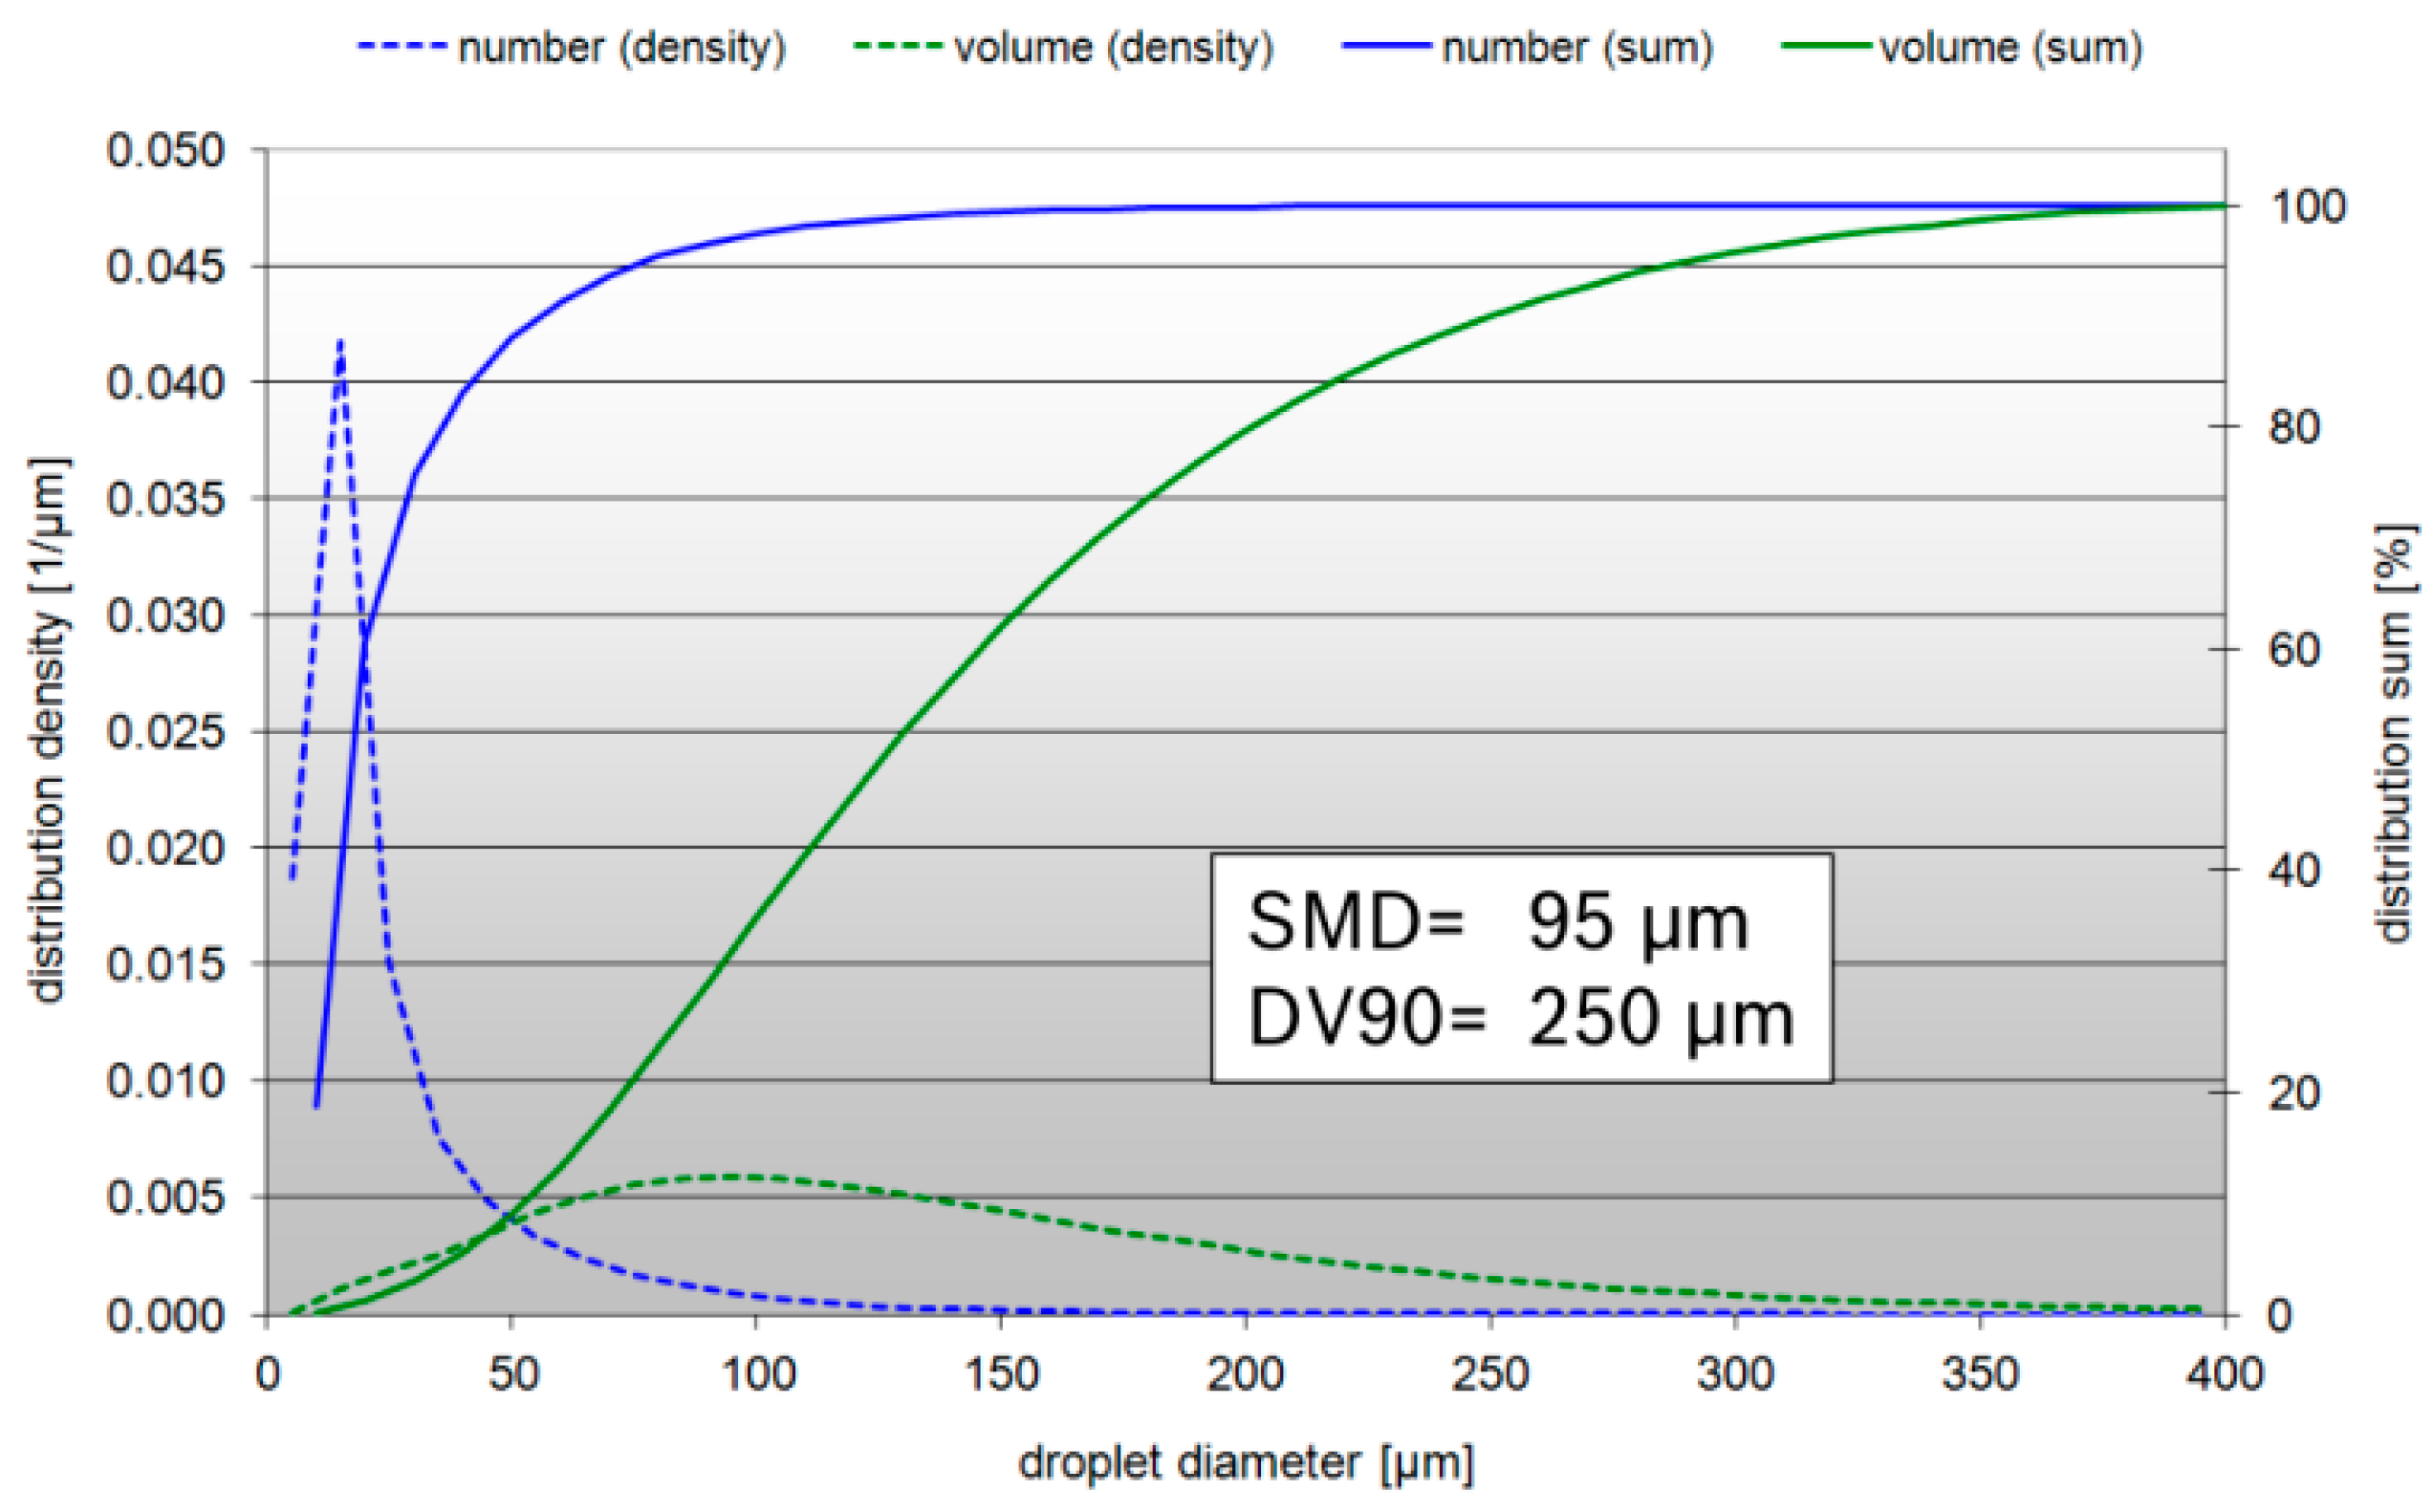
In addition, the nozzle used in this study was bought from BOSCH company with injection pressure of 5 bar, and its parameters were presented in the following Table 2. The urea droplet size distribution was measured by laser particle size analyzer (Winner318A), and other experimental devices including urea pump, INCA software, urea pipeline, wine harnesses, test bench, etc. During the test, the injection pressure of the pump was 0.5 MPa, the temperature was room temperature, the test was applied to standard urea-water solution, and the distance between the nozzle orifice and the beam center was set to about 75 mm. The test result of the urea droplet size distribution was shown in Figure 5.

2.3. Experimental Validation

2.3.1. Engine Bench Test

In order to evaluate the accuracy of the simulation results and the reasonable performance of the product, this paper determines the product performance by conducting experiments on the uniformity of ammonia concentration distribution and crystal thickness through relevant experiments.
The exhaust temperature and exhaust flow rate are required for the four operating conditions matching with the simulation parameters. The FTIR6000FT gas analyzer used was showed Figure 6, which was used to measure the ammonia concentration at the outlet of the substrate to ensure measurement. For a better accuracy, a 10-min settling time is required before the first point is measured, then each point is measured for 30 s and averaged. Then, we waited for 30 s, measured it again for 30 s and obtained the average value. If the value difference between the two measurements was less than 3 ppm, then the average data of the second measurement was considered feasible. Otherwise, we waited for 3 min and then repeated the measurement, until the difference between the two measurements did not exceed 3 ppm. After the first point has stabilized, the measurement line was rotated and the second measurement was tested. After measuring the data, the ammonia gas concentration distribution uniformity was calculated accordingly.
The diesel engine (see Table 3 for parameters) and the SCR catalyst system will be subjected to crystallization experiments through the bench test according to the conditions shown in Table 1.
After 10 h of operation, the mixer section is disassembled and the condition is checked. In the crystallization test, the electronic control unit, sensor system, urea injection system, and wiring harness of the SCR catalytic system were assembled according to the vehicle configuration requirements (Figure 7). Moreover, the diesel engine speed, torque, fuel consumption, and power were recorded at each moment in the whole crystallization test process, the front and rear exhaust temperature was measured, nitrogen oxide content and ammonia leakage rate of the SCR catalyst was recorded, and the bench test device under each cycle, data on urea consumption, intake flow, and temperature were monitored. After the completion of the entire cycle of the crystallization test, the SCR catalyst was removed from the test rig. Firstly, we carefully observed the mixing chamber and the front of substrate. Secondly, photos for each observation.
In the conversion efficiency experiment, the main equipment were a dynamometer, engine, control system, gas analyzer and ammonia analyzer, etc. The engine parameters are shown in Table 3. According to the calibration strategy and the requirements of the carrier ammonia storage model, the NOx conversion rate under different injection equivalent coefficients (α) needs to be measured. A is mainly related to the urea injection amount. The test needs to examine the NOx conversion efficiency and ammonia under different operating conditions under different α values. For leaks, the test conditions for the bench test are the same as those for the CFD calculation, see Table 4. The SCR used for the test was provided with an ammonia leak coating (ASC).

2.3.2. Fleet Test

After the bench test was completed, the after-treatment system needed to be installed on the vehicle for road test under typical driving conditions. The vehicle road test needed to be carried out in a specific environment; the road test environment requirements and topographic test conditions are presented in Table 5 and Table 6. The correct operating practices for the current stage of the target were obtained within the specified geographic area and time.
According to original equipment manufacturer’s durability requirements, due to China’s vast territory, the models must meet the climatic conditions of various regions. The terrain, load, city, country, and other multi-case factors must also be taken into account. The light duty truck equipped with this device will complete the test of the road conditions in the following table, as shown in Table 7, and the crystallization of the exhaust system was checked periodically after each test interval.

3. Simulation Results and Discussion

3.1. Simulation on the Pathline (or Trajectory) of Flow Field

The internal traces of the flow field can vividly depict the trajectory of airflow inside the solution, as shown in Figure 8 below. It can be seen from the figure that after passing through the claw-shaped mixing blades at the inlet section, the airflow rotates and spreads. After the secondary rectification of the orifice plate, the airflow is concentrated and diffused from the center to the entire cross-sectional distribution, which improves the uniformity of the speed of the diesel oxidation catalyst (DOC) carrier. The vortex mixer at the front end of the SCR increases the flow distance of the airflow by extending the airflow, extends the contact time between the two, promotes the mixing of the airflow and the urea aqueous solution, and provides more space for the hydrolysis and pyrolysis of urea with time. A mixer consisting of a conical orifice and a small blade improves the spatial distribution of urea and effectively improves the uniformity of the front end of the SCR carrier.

3.2. Uniformity Index

The performance of the catalytic converter is closely related to the distribution of the gas flow at the front end of the internal substrate. A good airflow distribution can effectively utilize the catalytic substrate to improve the performance. The standard for evaluating the airflow quality is the velocity uniformity index (UI), which is calculated as follows:
UI flow = 1 i = 1 n ( w i w ¯ ) 2 w ¯ A i 2 A
In the above equation, wi represents the normal velocity of the grid element i, w ¯ represents the normal average velocity, A is the plane cross-sectional area, Ai represents the cross-sectional area of the cell grid i, and n represents the number of meshes.

3.2.1. Velocity Uniformity Index

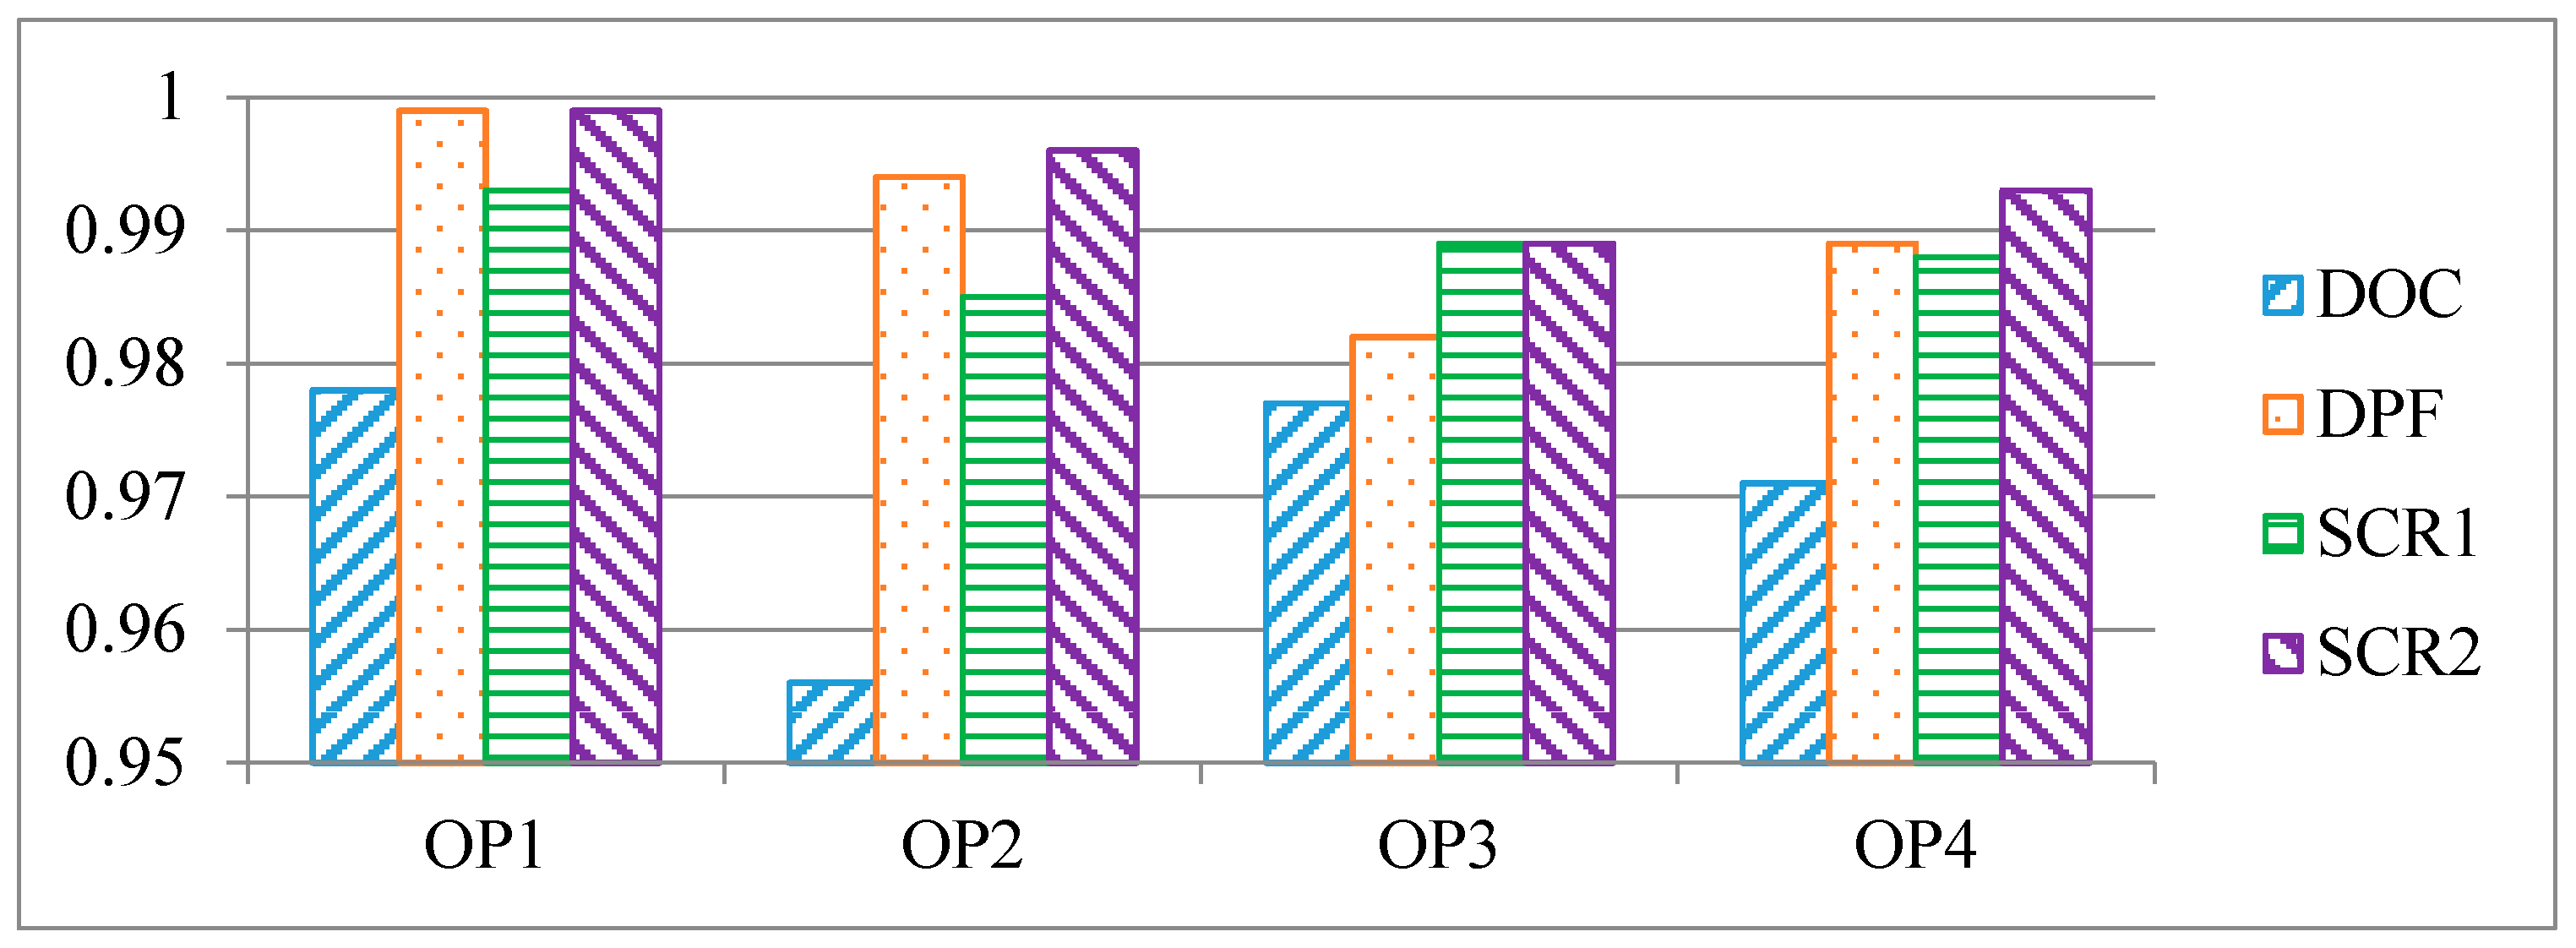
In response to the China VI emission requirements, compared with the previous, the velocity uniformity index should be above 0.95, through the CFD simulation analysis, the uniformity distribution of the four working conditions of the DOC substrate are shown in Figure 9 below. The specific values are shown in the following Table 8.
As represented in Figure 10, the higher velocity part is close to the cylinder, and the velocity of the central part is lower. This is because the air flow is subjected to the action of the swirl mixer at the inlet location, which rotates the airflow and passes through a perforated plate. The plate promotes secondary divergence of the gas stream, diffusing the central stream to the entire interface of the DOC substrate. From the four operating conditions, the overall distribution is relatively uniform, with an average coefficient of 0.97.
The DPF is located at the downstream of the DOC substrate. After the rectification effect of the DOC substrate, the velocity uniformity coefficient of the inlet face of DPF is generally high. The specific distribution is shown in Figure 9 below, and the values are shown in Table 9, which the average coefficient reaches 0.99.
SCR as an important part of the catalyst, the speed uniformity of the carrier end face directly determines the performance of the catalyst. After the airflow flows from the DPF, after the spiral space, the airflow rotates. Under the dual action of the conical orifice plate and the small blade mixer, the airflow is evenly distributed throughout the cross section of the carrier, which improves the uniformity value of the end face of the carrier and the speed of the SCR1 carrier is uniform. The distribution is shown in Figure 11 below, and the values are shown in Table 10 below.
It can be seen from the figure that the velocity distribution on the cross section is relatively uniform, and the velocity at most positions on the cross section of the substrate is at the same gradient value, and the average uniformity coefficient reaches 0.988.
After the rectification of SCR1 substrate, the SCR2 substrate velocity uniformity is improved further compared with the previous substrate, and the distribution is shown in Figure 12 below. The values are shown in Table 11 below.
Statistics 4 calculation results of working conditions (as shown in Figure 13). It can be seen from the figure that the calculated values are higher than 0.95. Under the action of the mixer, the air flow is evenly distributed over the entire cross section of the carrier, which improves the performance of the carrier. It plays a positive role in promoting the complete use of the carrier and meets the requirements of high-speed uniformity of the solution.

3.2.2. Ammonia Uniformity Index

The nitrogen oxides and ammonia react chemically on the surface of the catalyst substrate. Therefore, the concentration distribution of the ammonia on the inlet face of the SCR substrate has an important influence on the overall efficiency of the reaction. The formula of ammonia uniformity Index is expressed as follows:
UI flow = 1 i = 1 n ( m i m ¯ ) 2 m ¯ A i 2 A
where mi represents the NH3 mass fraction of the grid element i, m ¯ represents the NH3 average mass fraction, A is the plane cross-sectional area, Ai represents the unit grid i cross-sectional area, and n represents the grid number.
Taking into account the difference in ammonia concentration distribution, the ammonia concentration gradient evaluation index is introduced, and the calculation method is as follows:
Ratio = Max   NH 3   us   SCR Average   NH 3   us   SCR < 1.5
For the simulation results, the ammonia uniformity distribution at the front end of the SCR1 substrate is shown in Figure 14, and the values are shown in Table 12 below.
It can be seen from the figure that the position with higher ammonia concentration is located on the outer side of the section and near the barrel, and the concentration of the center of the section is relatively low due to the centrifugal force. Overall, its distribution is uniform, the average coefficient reaches 0.968. The concentration gradient is up to 1.318, which meets the target value of 1.5.
After the pre-stage substrate rectification, the uniformity of the secondary substrate ammonia gas is slightly higher than that of the pre-stage substrate, and the distribution is as shown in Figure 15 and the values are shown in Table 13 below.

3.3. Crystallization Risk Analysis

For a canning design product that meets the requirements of the China VI emission requirements, it is also important to evaluate whether the urea aqueous solution will cause crystallization failure during long-term use after being injected into the system. In the simulation analysis, the fluid membrane theory of fluid mechanics can be used to simulate the liquid membrane pathway and properties in the catalyst. When the temperature reaches 152 °C, urea pyrolysis forms isocyanic acid and ammonia, isocyanic acid, and Urea reacts to form biuret. When temperature continues to rise, the reaction is more complicated. Combined with the calculation results and lesson learned experience, the estimation indicator of crystallization risk under different conditions is recommended, as shown in Table 14.
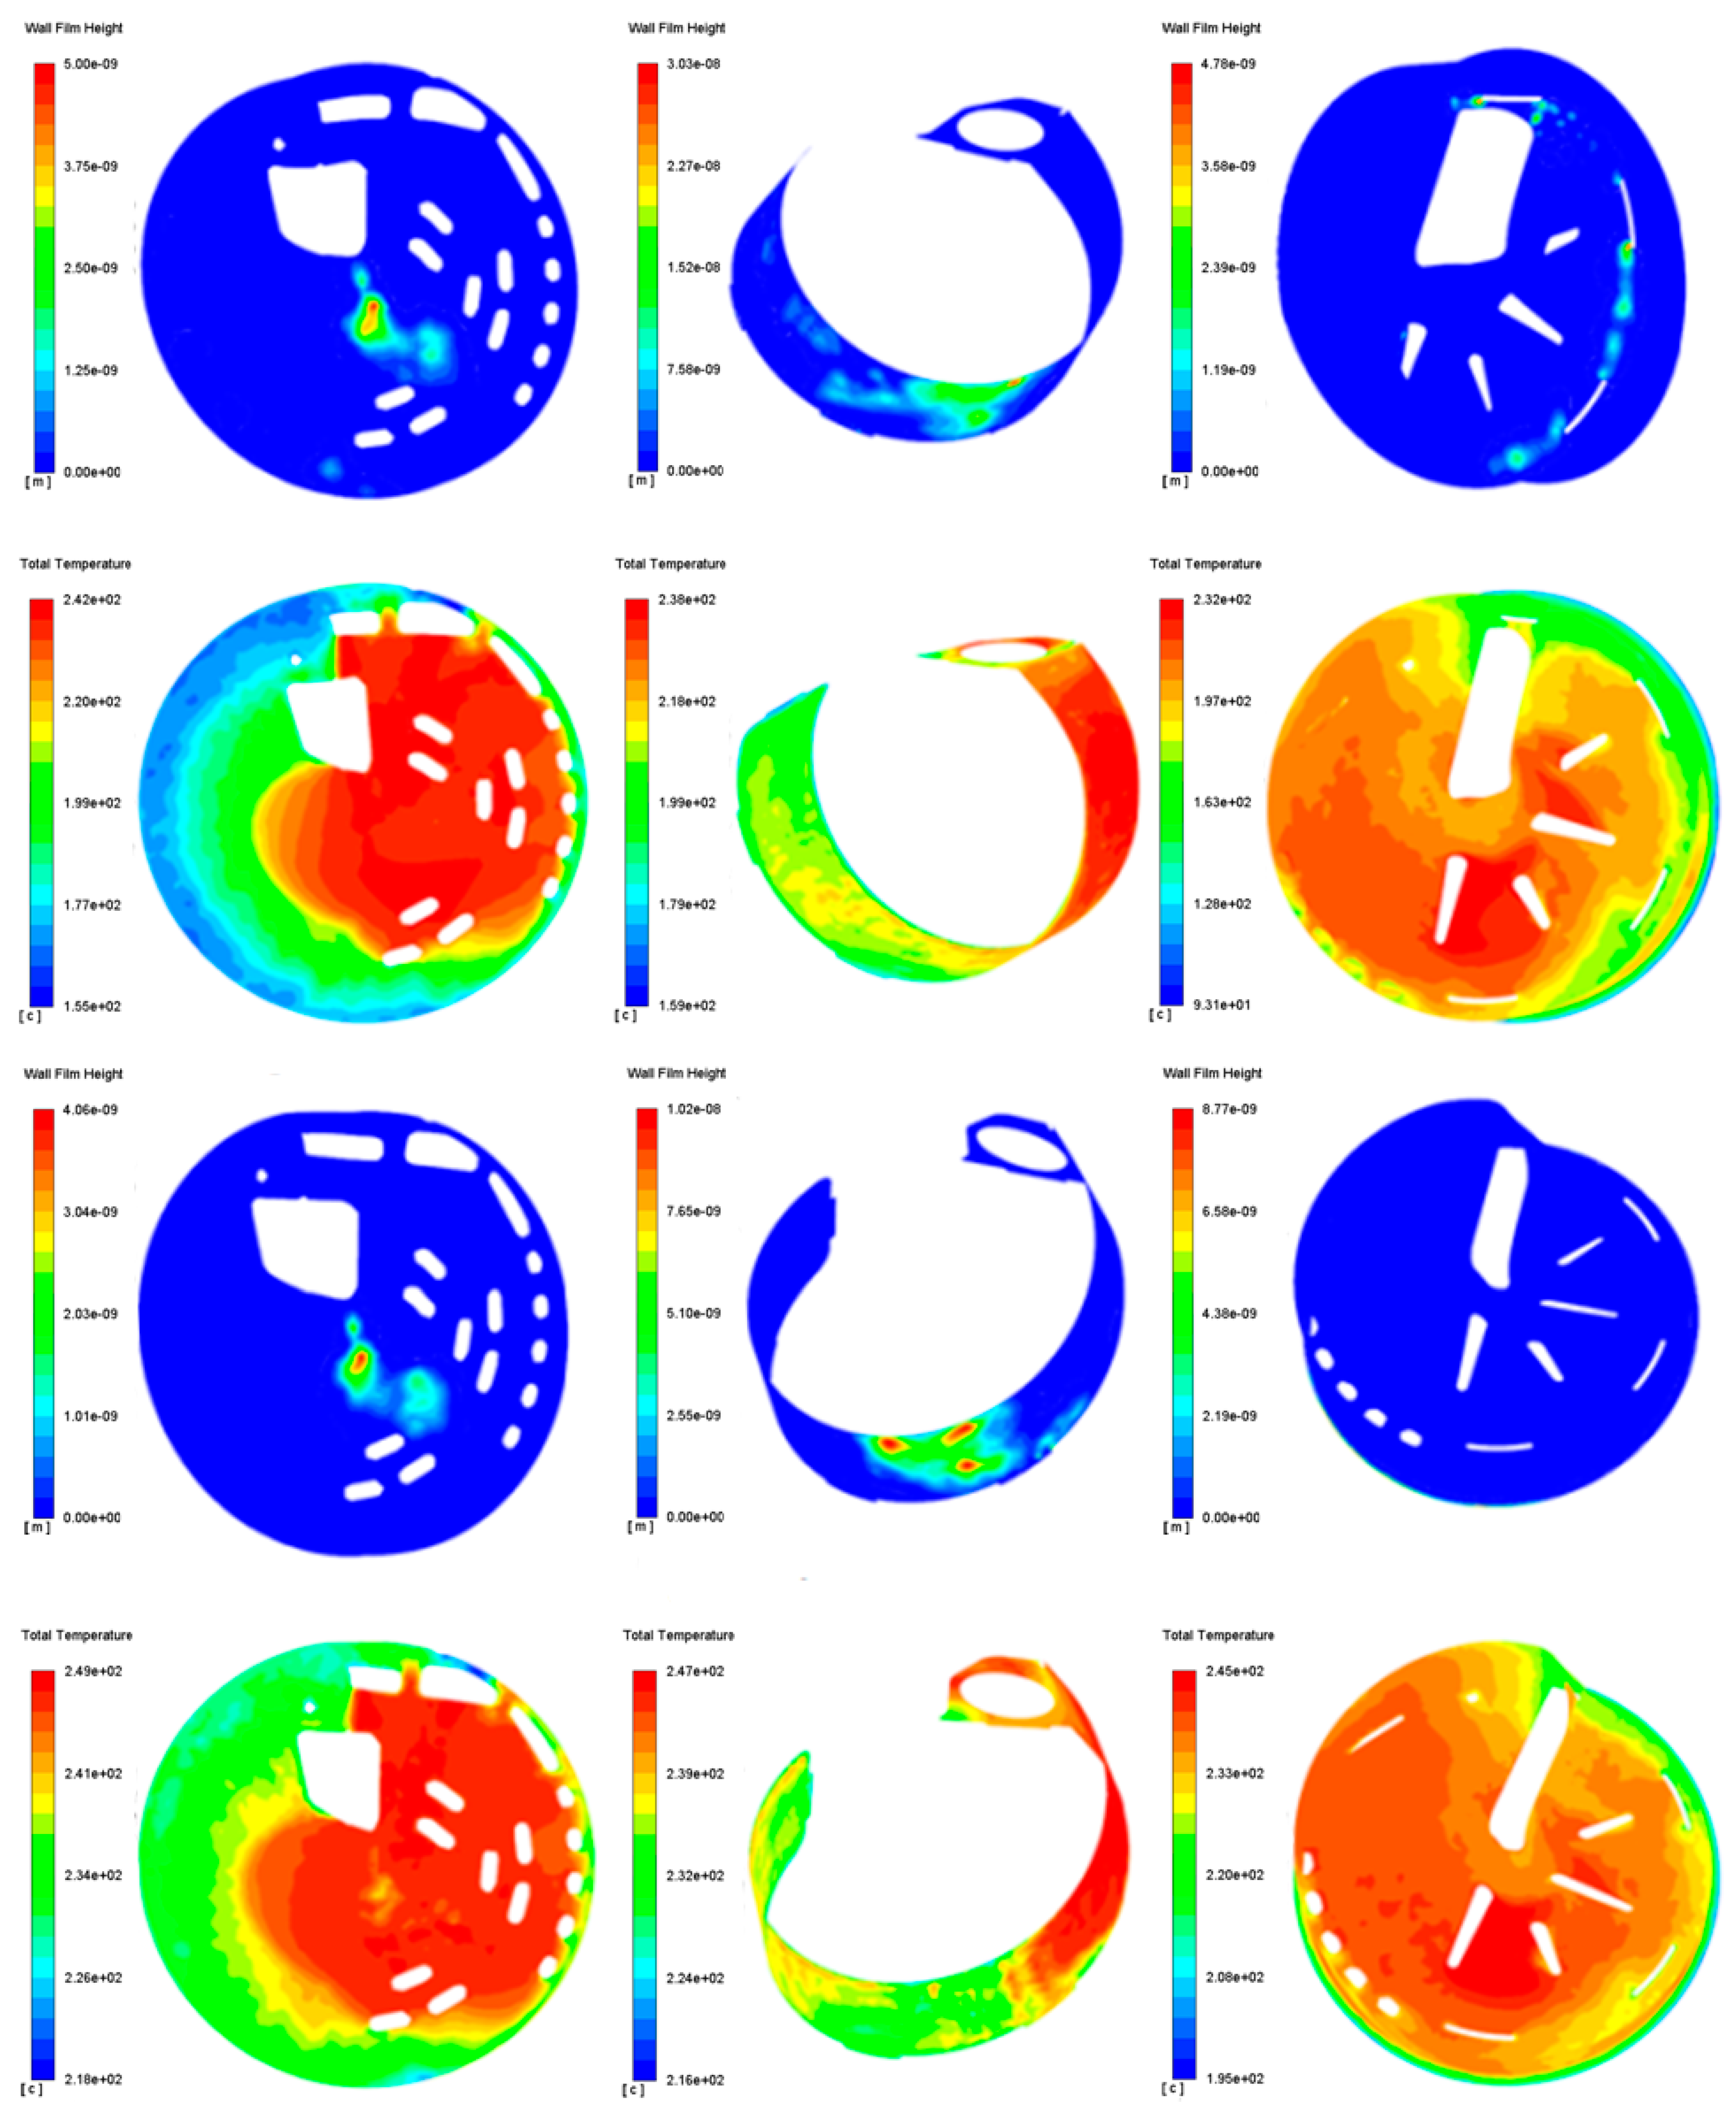
The temperature distribution of the liquid film of the mixer is shown in Figure 16 below. It can be seen from the figure that the thicker part of the liquid film is the middle part of the front mixing sheet, the bottom of the center mixing sheet, etc., which conforms to the position distribution of the direct point of the spray path of the nozzle. Most of the urea was taken away by the air flow, mixed with the air flow, and a few of it condensed on the wall, forming crystallization. From the comparison of liquid film and temperature, the location of the liquid film with high thickness absorbs most of the heat due to its crystallization, which causes the temperature of the crystalline location to be low. From the perspective of the liquid film thickness in the four operating conditions, the liquid film value is low. The specific values are shown in Table 15 below.

4. Test Results and Discussion

4.1. Engine Bench Test

4.1.1. Ammonia Uniformity Test

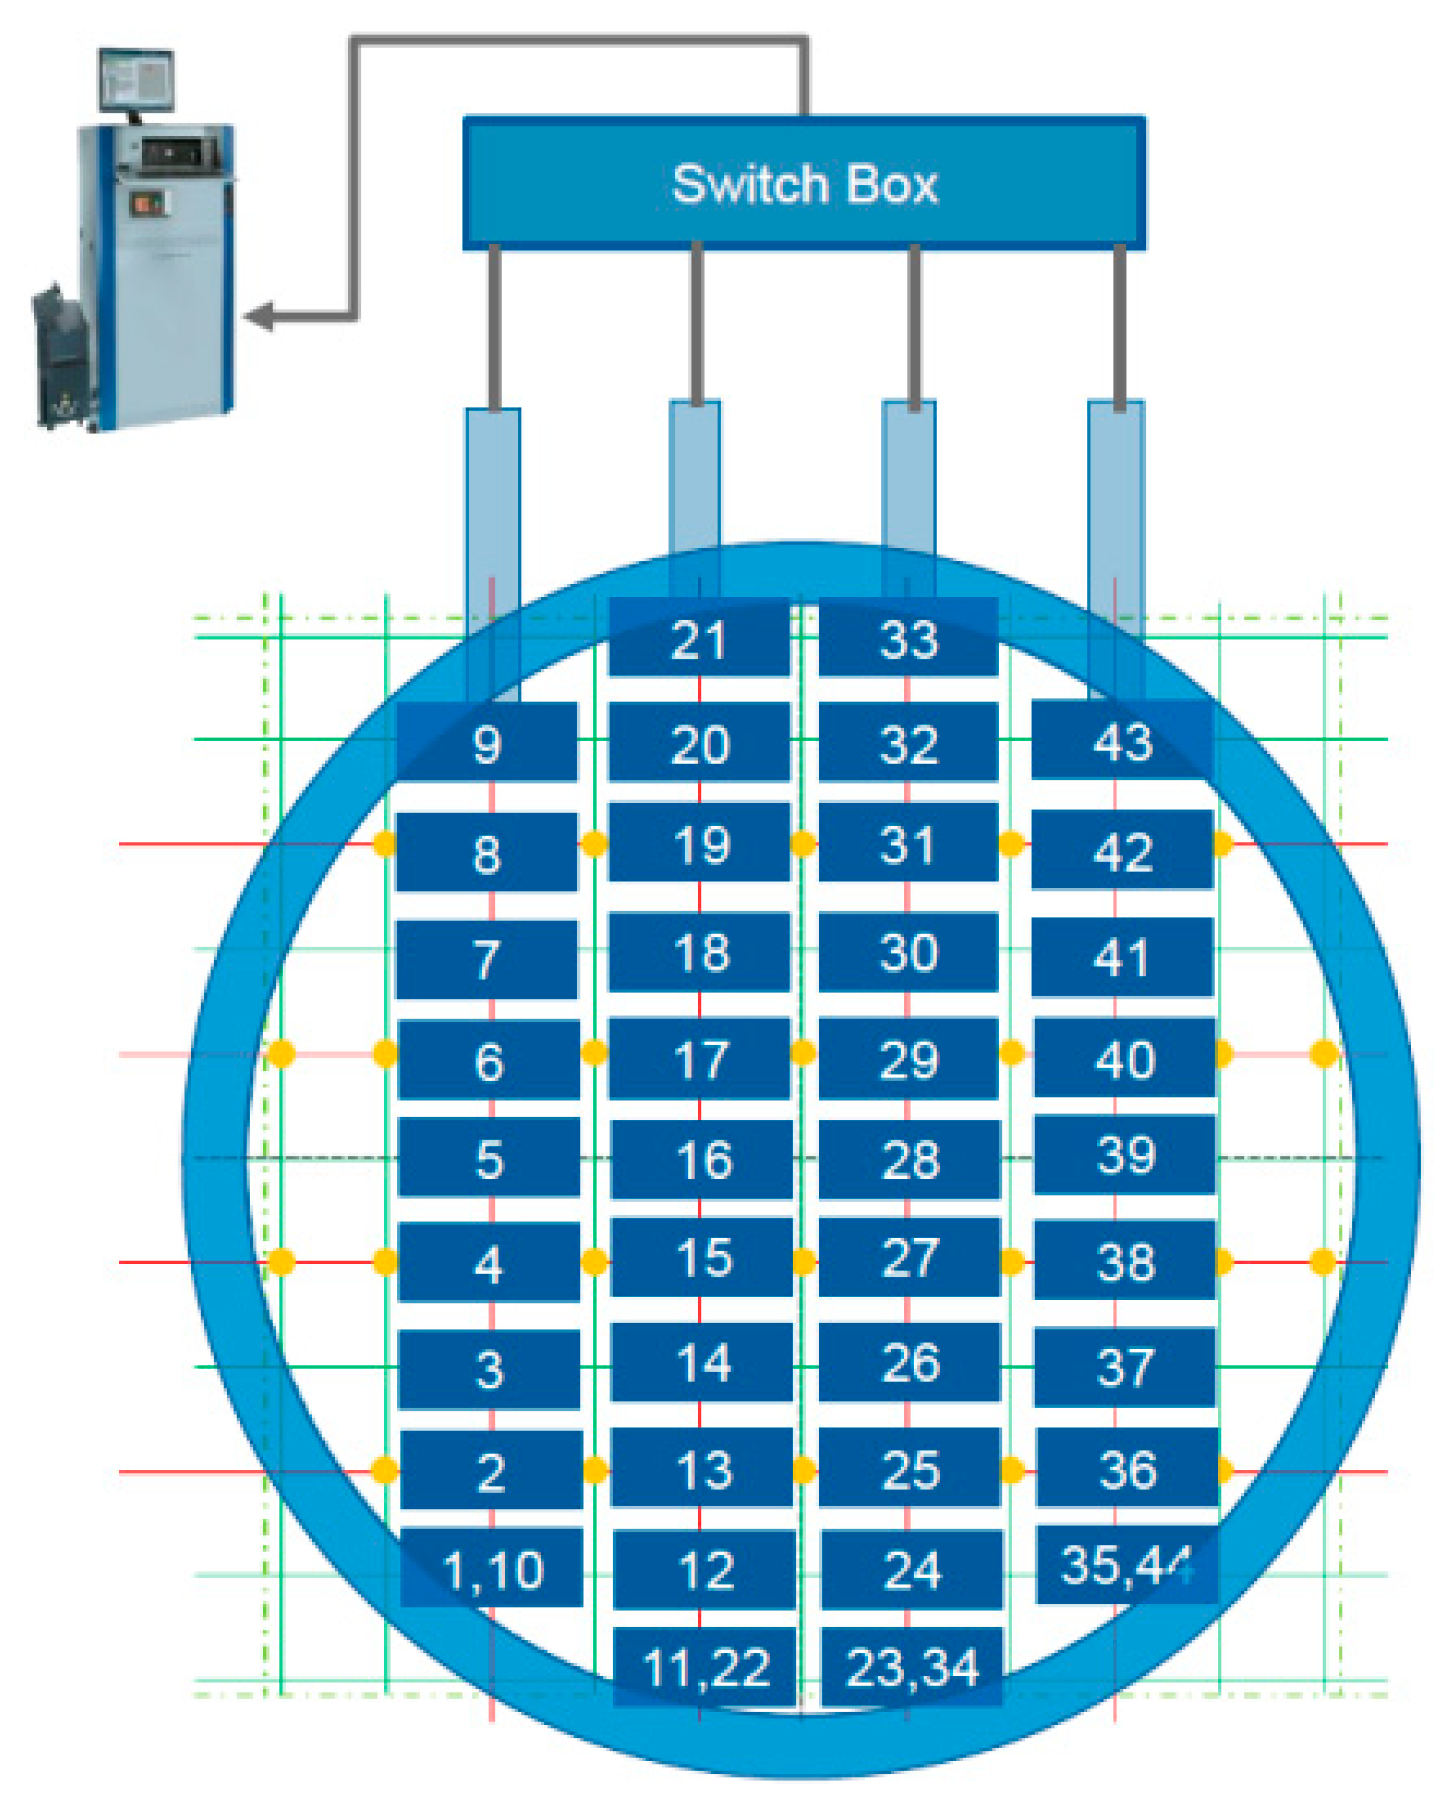
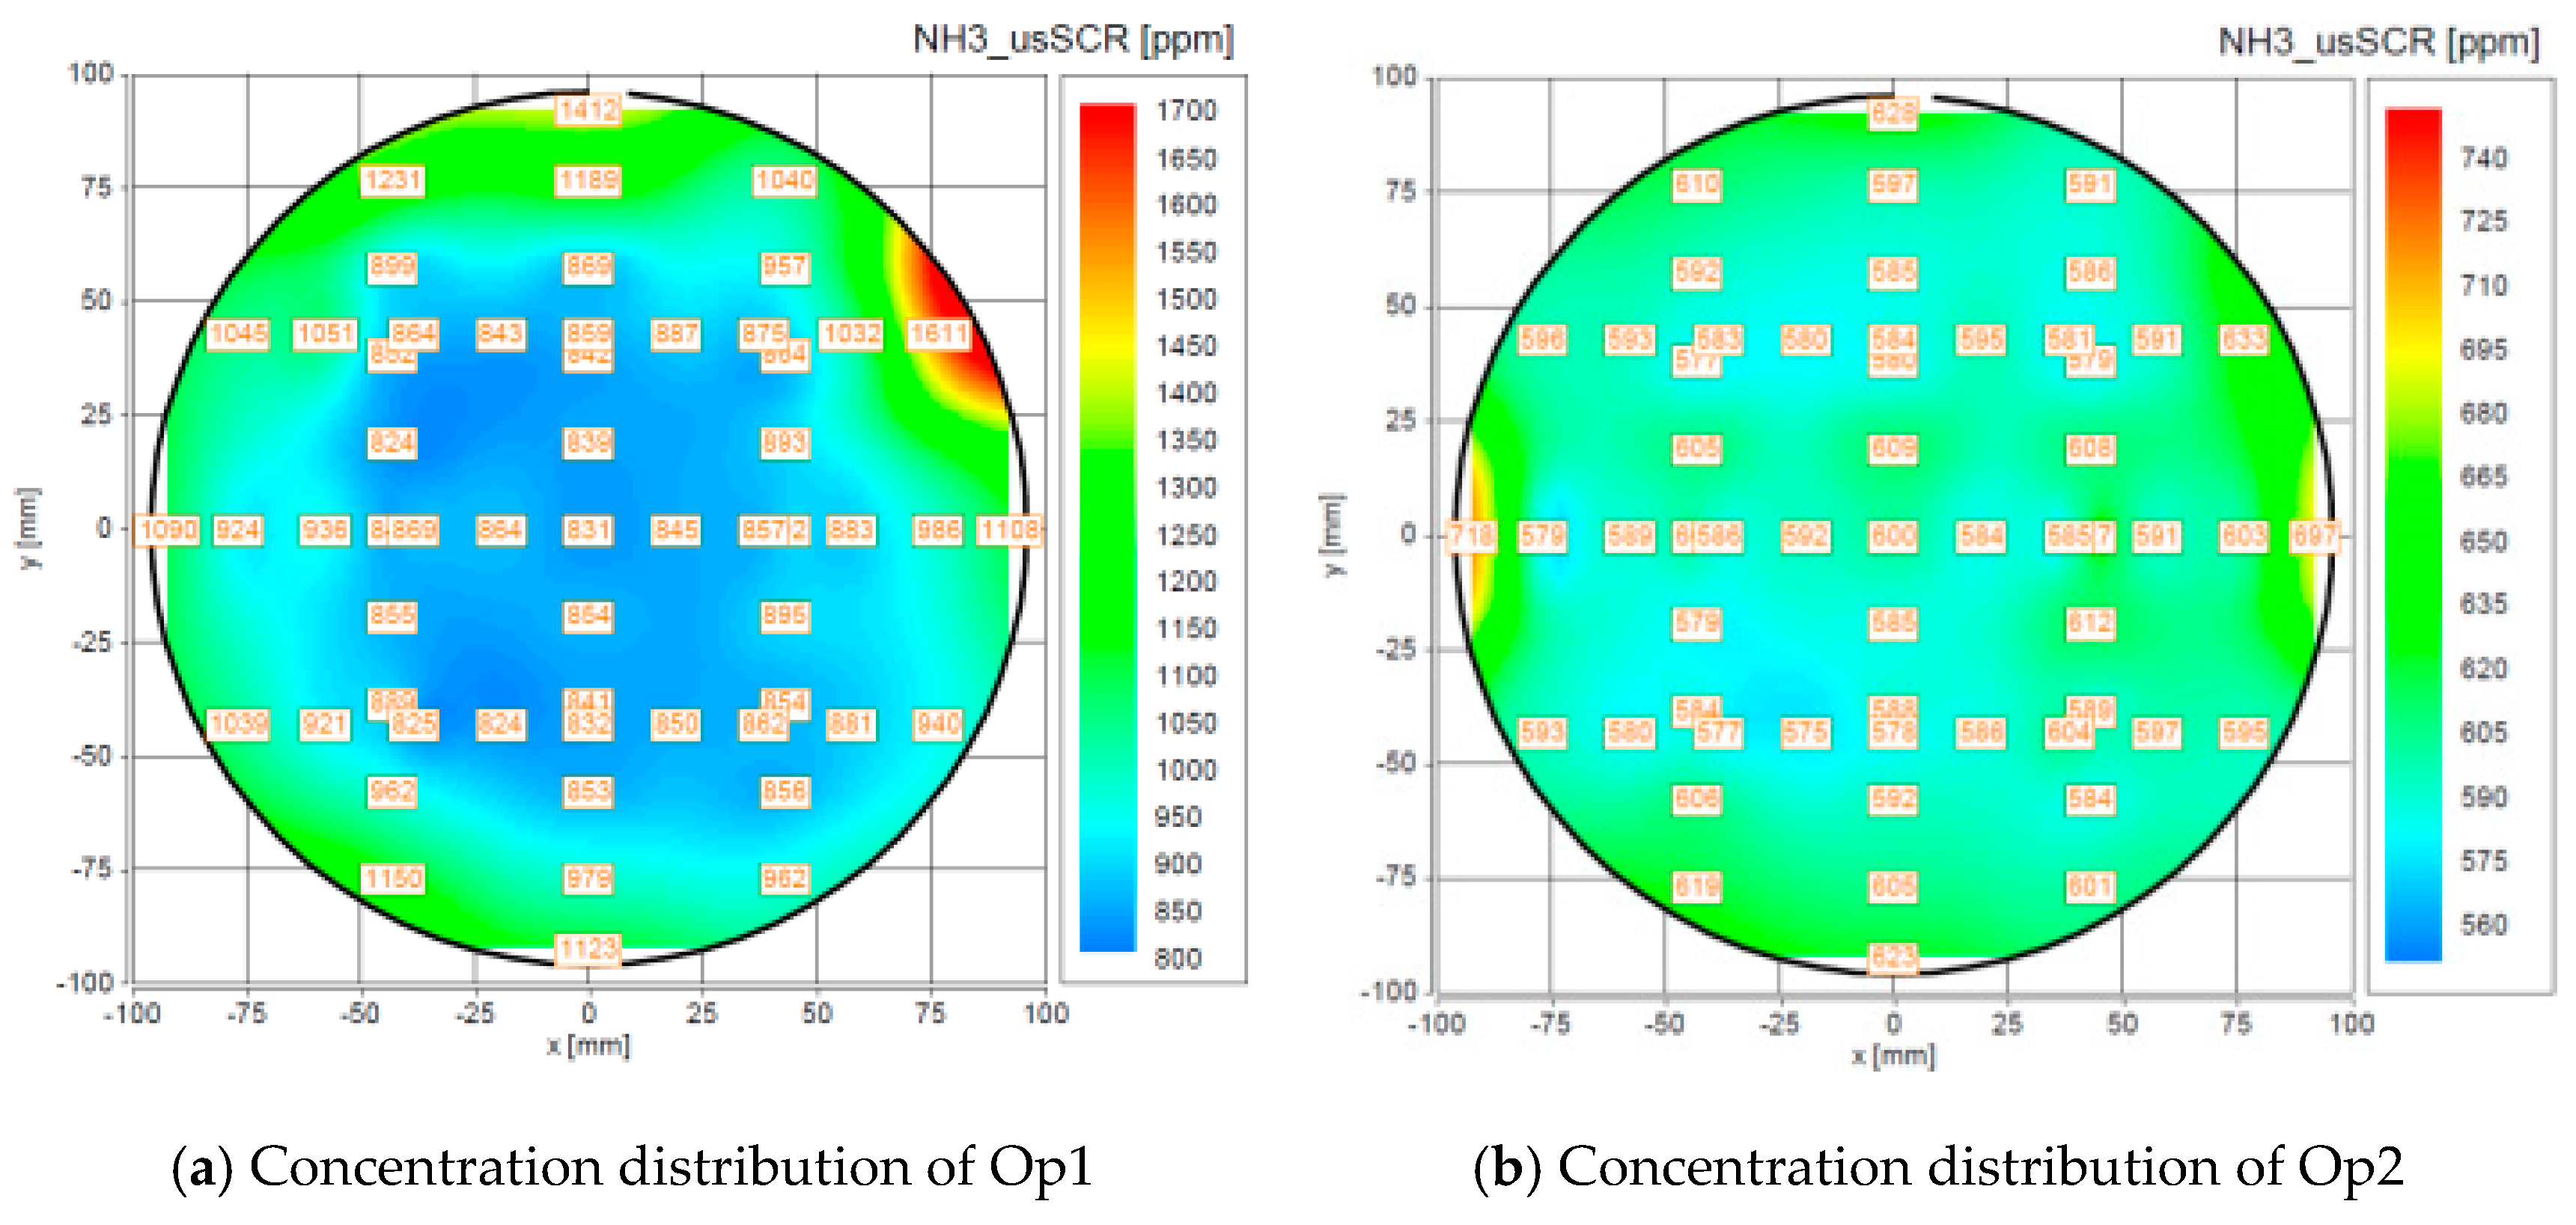
This article uses the measurement points shown in Figure 17 below. The measurement points are located between two SCR carriers, and the two measurement lines are perpendicular to each other at 90 degrees. The measurement results are shown in Figure 18 and Table 16 below. The measurement results are two experimental comparison data, and the average of the two experimental data is taken to draw the ammonia uniformity distribution chart.
By comparing the experimental and simulation results, it can be seen that the experimental and simulation results are very close in the uniformity value. Under the first and second working conditions, the ammonia uniformity is the smallest, the flow rate is large, and the urea and the airflow are not sufficiently mixed. At low flow, that is, three or four working conditions, urea has enough time to mix, and ammonia uniformity is high. Judging from the distribution trend, the distribution of the two is almost the same, and the experiments and simulations have a high degree of similarity, which verifies the actual performance of the product.

4.1.2. Risk Assessment of Crystallization

The crystallization experiment was carried out for each operating point, and the results are shown in Figure 19 below.
It can be seen from the figure that there is a slight crystal in the mixing chamber, which is concentrated at the bottom of the central mixing sheet. This position is the jet landing point. Under the action of the swirling gas, most of the urea solution is taken away and mixed with the air flow. A small part remains on the wall and forms crystals. In the second working condition, due to the largest injection amount, the crystallization amount is also the largest. In the other working conditions, there is less crystallization, and there is almost no crystal in the blade mixer. The experimental results are in the same position as the simulation calculations, which verifies the accuracy of the simulation and experimental results.

4.1.3. Conversion Efficiency Test

Figure 20 is a graph of conversion efficiency and ammonia leakage curve of the post-processing device under various operating conditions. With α value increases, the urea injection amount increases, and the NOX conversion efficiency gradually improves. When α is 1.2, the NOx conversion efficiency under each working condition can reach above 0.96. When the NOx conversion efficiency reaches 1, an increase in α value will cause an increase in ammonia leakage and cause secondary pollution.

4.2. Vehicle Road Test

The bench test is very different from the actual road operating conditions. The product is loaded into the vehicle for road testing. The product loading is shown in Figure 21. By running in different test environments, the performance stability of the product in different environments is verified.
In different extreme environments, the crystallization status of the mixer at the end of the after-treatment system after the vehicle endurance test is shown in Table 17 below. It can be seen that in different regions, there is slight crystallization inside the mixer. In the test environment of the sub-arctic region, the amount of crystallization is the largest, mainly because its ambient temperature is relatively low, which is likely to cause the low temperature precipitation of urea. After regeneration conditions, the crystals are dissolved at high temperature, and the performance of the mixer of the product will not be affected by the crystals. In the overall conditions, the product performance meets the test requirements.

5. Conclusions

In this paper a compact mixer and canning design is proposed to provide higher conversion efficiency and excellent anti-crystallization performance to meet the China VI emission standards. Both CFD simulation and experimental validation are conducted to assess this new design.
The mixing performance and crystallization risk of the canning structure were evaluated with main focus on the velocity uniformity index, ammonia uniformity index and the wall film thickness combined with localized temperature. Through the above research, it is reasonable to conclude that:
(1)
The package structure provides sufficient flow uniformity on all catalytic modules (DOC, DPF, and SCR), and its speed uniformity is higher than 0.95.
(2)
The structure of the mixer has excellent ammonia concentration and gradient uniformity. The average ammonia uniformity value is 0.96, and the ammonia distribution gradient does not exceed 1.318, which is very important to improve the efficiency of the chemical reaction.
(3)
The mixer has excellent anti-crystallization performance, and the crystallization amount after regeneration is 0 g, which has been proved by bench tests and strict road verification.
Based on the promising test results, the design of this new canning structure is recommended to work together with OEM project for the China VI emission standard.

Author Contributions

Methodology, D.L., C.Z.; software, S.L.; validation, K.L., C.Z. and D.L.; formal analysis, K.L., C.Z.; investigation, K.L.; resources, K.L., C.Z., D.L.; data curation, C.Z.; writing—original draft preparation, K.L.; writing—review and editing, Y.Z.; visualization, Y.Z.; supervision, D.L.; project administration, C.Z.; funding acquisition, K.L., C.Z. All authors have read and agreed to the published version of the manuscript.

Funding

This research received no external funding.

Conflicts of Interest

The authors declare no conflict of interest.

References

  1. Zhang, Y.; Lou, D.; Tan, P.; Hu, Z. Experimental study on the durability of biodiesel-powered engine equipped with a diesel oxidation catalyst and a selective catalytic reduction system. Energy 2018, 159, 1024–1034. [Google Scholar] [CrossRef]
  2. Zhang, Y.; Lou, D.; Tan, P.; Hu, Z. Experimental study on the particulate matter and nitrogenous compounds from diesel engine retrofitted with DOC + CDPF + SCR. Atmos. Environ. 2018, 177, 45–53. [Google Scholar] [CrossRef]
  3. Zhang, C.; Sun, C.; Wu, M.; Lu, K. Optimisation design of SCR mixer for improving deposit performance at low temperatures. Fuel 2019, 237, 465–474. [Google Scholar] [CrossRef]
  4. Choi, C.; Sung, Y.; Choi, G.M.; Kim, D.J. Numerical analysis of NOx reduction for compact design in marine urea-SCR system. Int. J. Nav. Archit. Ocean Eng. 2015, 7, 1020–1033. [Google Scholar] [CrossRef] [Green Version]
  5. Zhang, X.; Romzek, M. 3-D Numerical Study of Flow Mixing in Front of SCR for Different Injection Systems; No. 2007-01-1578; SAE Technical Paper; SAE International: Warrendale, PA, USA, 2007. [Google Scholar]
  6. Zheng, G.; Palmer, G.; Salanta, G.; Kotrba, A. Mixer Development for Urea SCR Applications; No. 2009-01-2879; SAE Technical Paper; SAE International: Warrendale, PA, USA, 2009. [Google Scholar]
  7. Seo, J.W.; Lee, K.I.; Oh, J.T.; Choi, Y.H.; Lee, J.H.; Park, J.I. The study on the effects of mixer configurations on fluid mixing characteristics in SCR systems. Trans. Korean Soc. Automot. Eng. 2008, 16, 192–199. [Google Scholar]
  8. Choi, C.; Sung, Y.; Choi, G.M.; Kim, D.J. Numerical analysis of urea decomposition with static mixers in marine SCR system. J. Clean Energy Technol. 2015, 3, 39–42. [Google Scholar] [CrossRef] [Green Version]
  9. Kusaka, J.; Sueoka, M.; Takada, K.; Ohga, Y.; Nagasaki, T.; Daisho, Y. A basic study on a urea-selective catalytic reduction system for a medium-duty diesel engine. Int. J. Engine Res. 2005, 6, 11–19. [Google Scholar] [CrossRef]
  10. Eichelbaum, M.; Farrauto, R.J.; Castaldi, M.J. The impact of urea on the performance of metal exchanged zeolites for the selective catalytic reduction of NOx: Part I. Pyrolysis and hydrolysis of urea over zeolite catalysts. Appl. Catal. B Environ. 2010, 97, 90–97. [Google Scholar] [CrossRef]
  11. Kuhnke, D. Spray/Wall Interaction Modelling by Dimensionless Data Analysis; Shaker: Düren, Germany, 2004. [Google Scholar]
  12. Wang, T.J.; Baek, S.W.; Lee, S.Y.; Kang, D.H.; Yeo, G.K. Experimental investigation on evaporation of urea-water-solution droplet for SCR applications. AIChE J. 2009, 55, 3267–3276. [Google Scholar] [CrossRef]
  13. Zheng, G.; Fila, A.; Kotrba, A.; Floyd, R.A. Investigation of Urea Deposits in Urea SCR Systems for Medium and Heavy Duty Trucks; No. 2010-01-1941; SAE Technical Paper; SAE International: Warrendale, PA, USA, 2010. [Google Scholar]
  14. Oh, J.; Lee, K. Spray characteristics of a urea solution injector and optimal mixer location to improve droplet uniformity and NOx conversion efficiency for selective catalytic reduction. Fuel 2014, 119, 90–97. [Google Scholar] [CrossRef]
  15. Schmid, J.; Zarikos, I.; Terzis, A.; Roth, N.; Weigand, B. Crystallization of urea from an evaporative aqueous solution sessile droplet at sub-boiling temperatures and surfaces with different wettability. Exp. Therm. Fluid Sci. 2018, 91, 80–88. [Google Scholar] [CrossRef]
  16. Birkhold, F.; Meingast, U.; Wassermann, P.; Deutschmann, O. Modeling and simulation of the injection of urea-water-solution for automotive SCR DeNOx-systems. Appl. Catal. B Environ. 2007, 70, 119–127. [Google Scholar] [CrossRef]
  17. Birkhold, F.; Meingast, U.; Wassermann, P.; Deutschmann, O. Analysis of the Injection of Urea-Water-Solution for Automotive SCR DeNOx-Systems: Modeling of Two-Phase Flow and Spray/Wall-Interaction; No. 2006-01-0643; SAE Technical Paper; SAE International: Warrendale, PA, USA, 2006. [Google Scholar]
  18. Liao, Y.; Eggenschwiler, P.D.; Furrer, R.; Wang, M.; Boulouchos, K. Heat transfer characteristics of urea-water spray impingement on hot surfaces. Int. J. Heat Mass Transf. 2018, 117, 447–457. [Google Scholar] [CrossRef]
  19. Wanker, R.; Raupenstrauch, H.; Staudinger, G. A fully distributed model for the simulation of a catalytic combustor. Chem. Eng. Sci. 2000, 55, 4709–4718. [Google Scholar] [CrossRef]
  20. Park, T.; Sung, Y.; Kim, T.; Lee, I.; Choi, G.; Kim, D. Effect of static mixer geometry on flow mixing and pressure drop in marine SCR applications. Int. J. Nav. Archit. Ocean Eng. 2014, 6, 27–38. [Google Scholar] [CrossRef] [Green Version]
  21. Tan, L.; Feng, P.; Yang, S.; Guo, Y.; Liu, S.; Li, Z. CFD studies on effects of SCR mixers on the performance of urea conversion and mixing of the reducing agent. Chem. Eng. Process. Process Intensif. 2018, 123, 82–88. [Google Scholar] [CrossRef]
  22. Capetillo, A.; Ibarra, F. Multiphase injector modelling for automotive SCR systems: A full factorial design of experiment and optimization. Comput. Math. Appl. 2017, 74, 188–200. [Google Scholar] [CrossRef]
  23. Ström, H.; Lundström, A.; Andersson, B. Choice of urea-spray models in CFD simulations of urea-SCR systems. Chem. Eng. J. 2009, 150, 69–82. [Google Scholar] [CrossRef]
  24. Lockyer, T.O.; Reid, B.A.; Hargrave, G.K.; Gaynor, P.; Wilson, J. Optical Investigation on the Ability of a Cordierite Substrate Mixing Device to Combat Deposits in SCR Dosing Systems; SAE Technical Paper; SAE International: Warrendale, PA, USA, 2015. [Google Scholar]
  25. Smith, H.; Lauer, T.; Schimik, V.; Gabel, K. Evaluation and prediction of deposit severity in SCR systems. SAE Int. J. Engines 2016, 9, 1735–1750. [Google Scholar] [CrossRef]
  26. Shilimkan, R.V.; Stepanek, J.B. Effect of tube size on liquid side mass transfer in co-current gas-liquid upward flow. Chem. Eng. Sci. 1977, 32, 1397–1400. [Google Scholar] [CrossRef]
Figure 1. Traditional conception of after-treatment system layout for China V emission regulation.
Energies 13 00734 g001
Figure 2. Proposed new canning structure for China VI emission regulation.
Energies 13 00734 g002
Figure 3. Illustration of hybrid components used for the new mixer structure.
Energies 13 00734 g003
Figure 4. Cold flow back pressure test device.
Energies 13 00734 g004
Figure 5. Droplet size distribution of the tested urea-water solution.
Energies 13 00734 g005
Figure 6. Measurement arrangement with gas analyzer.
Energies 13 00734 g006
Figure 7. Photos of after-treatment system canning and engine test bench.
Energies 13 00734 g007
Figure 8. Trajectory of flow field.
Energies 13 00734 g008
Figure 9. Contours of Velocity with Pre-DOC.
Energies 13 00734 g009
Figure 10. Contours of Velocity with Pre-DPF.
Energies 13 00734 g010
Figure 11. Contours of Velocity with Pre-SCR1.
Energies 13 00734 g011
Figure 12. Contours of Velocity with Pre-SCR2.
Energies 13 00734 g012
Figure 13. Summary of the velocity uniformity index under four operating points.
Energies 13 00734 g013
Figure 14. Contours of NH3 Concentration with Pre-SCR1.
Energies 13 00734 g014
Figure 15. Contours of NH3 Concentration with Pre-SCR2.
Energies 13 00734 g015
Figure 16. The liquid film thickness and temperature map under four operation points.
Energies 13 00734 g016aEnergies 13 00734 g016b
Figure 17. Ammonia uniformity test point.
Energies 13 00734 g017
Figure 18. Experimental point data diagram.
Energies 13 00734 g018aEnergies 13 00734 g018b
Figure 19. Crystallization experiment.
Energies 13 00734 g019aEnergies 13 00734 g019b
Figure 20. NOx conversion efficiency.
Energies 13 00734 g020
Figure 21. Vehicle road test.
Energies 13 00734 g021
Table 1. Engine operating conditions.
Operating PointMass Flow (kg/h)Inlet Temperature (°C)NOX (ppm)
Op1231503481
Op2505550414
Op395250219
Op419025087
Table 2. Parameters of the nozzle.
Number3
Hole diameter (μm)120
Initial droplet velocity (m/s)24
Cone angle (°)8
Spray angle (°)6
Droplet diameter (sauter mean diameter, SMD) (μm)95
Table 3. Engine parameters.
ItemValue
Emission legislationChina VI
Engine type2.8L-DI Diesel
Cylinder number4
Displacement/(L)2.776
Rated Power/(kW @ r/min)110 @ 3000
Exhaust Gas Recirculation, EGRCooled EGR
Table 4. Conversion efficiency experimental conditions.
ConditionsNormalized Stoichiometric Ratio (NSR) Parameter: αStabilization Time/sNOX Conversion Efficiency
(α = 1)
NOX Maximum Conversion Efficiency
(Ammonia Slip <5 ppm)
OP10, 0.5, 0.8, 0.9,
1.0, 1.1, 1.2, 1.3, 1.4
300>95%>98%
OP2300>95%>98%
OP32400>90%>90%
OP4900>95%>98%
Table 5. Road test environment requirements.
RegionTemperate ZoneDesert AreaTropical AreaSubarctic Region
Natural climateAir temperature Range (°C)+40
−15
+60
−10
+50
+15
+30
−25
Temperature Variation range (°C)20401520
Relative humidity Range (%)90
20
15
5
100
20
80
20
Maximum solar Radiation Temperature (°C)8001000900600
Air salt Concentration RequirementsNear the ocean (100–5000 m): 0.3~30 mg·m−2/day
Ship area (within 100m from the shore): 0.3~300 mg·m−2/day
Air pollutantSulfur dioxideIndustrial and urban areas:
Monthly average: 0.014~0.052 ppm
Daily average maximum:0.03~0.95 ppm
Nitrogen oxidesIndustrial and urban areas:
Monthly average: 0.06~0.47 ppm
Daily average maximum: 0.10~0.81 ppm
Carbon monoxideIndustrial and urban areas:
Monthly average: 4~16 ppm
Daily average maximum: 5.8~27.4 ppm
Table 6. Topographic test conditions.
P1P2P3P4
SubgradeFlatUneven
Asphalt or concreteSand and/or stoneAsphalt or concreteAsphalt or concrete
Highest altitude (m)2000
Table 7. After-treatment system durability test plan.
Operating Point/SurroundingsTemperate Zone, 30%
(1,050,000 km)
Desert Area, 20%
(70,000 km)
Tropical Area, 30%
(1,050,000 km)
Subarctic Region, 20%
(70,000 km)
LoadNo Load,
30%
Half Load,
30%
Full Load,
40%
No Load,
30%
Half Load,
30%
Full Load,
40%
No Load,
30%
Half Load,
30%
Full Load,
40%
No Load,
30%
Half Load,
30%
Full Load,
40%
city6,300063,00084,000735073509800110,250110,250147,000735073509800
suburb25,20025,20033,60042004200560094,50094,500126,000420042005600
highway94,50094,500126,00063006300840047,25047,25063,0008400840011,200
Non-road31,50031,50042,00031503150420063,00063,00084,000105010501400
Table 8. Velocity uniformity index with Pre-DOC.
Operating PointOp1Op2Op3Op4
UI0.9780.9560.9770.971
Table 9. Velocity uniformity index with Pre-DPF.
Operating PointOp1Op2Op3Op4
UI0.9990.9940.9820.989
Table 10. Velocity uniformity index with Pre- SCR1.
Operating PointOp1Op2Op3Op4
UI0.9930.9850.9890.988
Table 11. Velocity uniformity index with Pre- SCR2.
Operating PointOp1Op2Op3Op4
UI0.9990.9960.9890.993
Table 12. NH3 uniformity index with Pre-SCR1.
Operating PointOp1Op2Op3Op4
UI0.9570.9590.9890.967
Ratio1.3181.2971.1011.259
Table 13. NH3 uniformity index with Pre-SCR2.
Operating PointOp1Op2Op3Op4
UI0.9690.9690.9910.969
Ratio1.2341.2301.0911.250
Table 14. Crystallization risk assessment criteria.
RiskWall-film Thickness ≥1 × 10⁻⁶ m1 × 10−7 m ≤ Wall-Film Thickness <1 × 10⁻⁶ mWall-Film Thickness <1 × 10⁻⁷ m
Temperature ≤ 160 °CHighMediumLow
160 °C < Temperature < 250 °CMediumMediumLow
Temperature ≥ 250 °CMediumLowLow
Table 15. Crystallization risk for four operation conditions.
Operating PointOp1Op2Op3Op4
Wall film, m1.22 × 10−82.82 × 10−73.03 × 10−81.02 × 10⁻⁸
Temperature, °C403384155195
risklowlowlowlow
Table 16. Simulation and experimental data.
Operating PointMethodExhaust FlowExhaust Gas TemperatureAmmonia Uniformity
Op1CFD2315030.963
Test 10.944
Test 20.948
Op2CFD5055500.964
Test 10.987
Test 20.985
Op3CFD952500.990
Test 10.990
Test 20.993
Op4CFD1902500.968
Test 10.985
Test 20.978
Table 17. After-treatment system vehicle durability test crystallization status.
Test EnvironmentTemperate Zone (1,050,000 km)Desert Area (70,000 km)Tropical Area (1,050,000 km)Subarctic Region (70,000 km)
Crystallization description Energies 13 00734 i001 Energies 13 00734 i002 Energies 13 00734 i003 Energies 13 00734 i004
Whether the crystal is present after regenerationNONONONO