Article

Improving the Efficiency of PEM Electrolyzers through Membrane-Specific Pressure Optimization

1
Forschungszentrum Juelich GmbH, Institute of Energy and Climate Research, IEK-14, Electrochemical Process Engineering, 52425 Juelich, Germany
2
Faculty of Mechanical Engineering, RWTH Aachen University, 52072 Aachen, Germany
*
Author to whom correspondence should be addressed.
Energies 2020, 13(3), 612; https://doi.org/10.3390/en13030612
Submission received: 20 December 2019 / Revised: 22 January 2020 / Accepted: 23 January 2020 / Published: 1 February 2020
(This article belongs to the Special Issue Polymer Electrolyte Membrane Fuel Cells and Electrolyzers)

Abstract

:
Hydrogen produced in a polymer electrolyte membrane (PEM) electrolyzer must be stored under high pressure. It is discussed whether the gas should be compressed in subsequent gas compressors or by the electrolyzer. While gas compressor stages can be reduced in the case of electrochemical compression, safety problems arise for thin membranes due to the undesired permeation of hydrogen across the membrane to the oxygen side, forming an explosive gas. In this study, a PEM system is modeled to evaluate the membrane-specific total system efficiency. The optimum efficiency is given depending on the external heat requirement, permeation, cell pressure, current density, and membrane thickness. It shows that the heat requirement and hydrogen permeation dominate the maximum efficiency below 1.6 V, while, above, the cell polarization is decisive. In addition, a pressure-optimized cell operation is introduced by which the optimum cathode pressure is set as a function of current density and membrane thickness. This approach indicates that thin membranes do not provide increased safety issues compared to thick membranes. However, operating an N212-based system instead of an N117-based one can generate twice the amount of hydrogen at the same system efficiency while only one compressor stage must be added.

1. Introduction

Water electrolysis plants are used to produce storable electric energy by converting it into hydrogen as an energy carrier [1]. There are different types of water electrolyzers today, ranging from solid oxide electrolyzers [2] to alkaline electrolyzers [3] and polymer electrolyte membrane (PEM) electrolyzers [4]. Due to its efficiency and potential dynamic operation, PEM electrolysis is a promising method for generating hydrogen from wind energy and photovoltaics, which are, by their nature, fluctuating electric energy suppliers [5]. Accordingly, much research and development is in progress to improve the efficiency and reduce the costs of these technologies [6]. At the nanometer scale, new catalyst particles are being developed to improve the electrochemical behavior of electrodes [7]. At the micrometer scale, the manufacturing and characterization of functional layers are also under investigation [8]. At the meter scale, process engineers are developing novel stacks and system technology [9]. In some cases, an improvement on one scale means a worsening on another. Therefore, it is indispensable to communicate between the different levels of development in order to achieve the highest overall performance.
In order to store hydrogen at a pressure of between 30 and 800 bar [10,11], this paper discusses whether the gas should be compressed electrochemically in the electrolyzer or by subsequent gas compression. At the system level, it is desired to increase the pressure in the electrolysis cell to reduce the number of compressors needed to store hydrogen at higher pressure as costs and system complexity decrease [12]. On a functional layer level, hydrogen permeation across the membrane will increase when increasing the pressure in the electrodes [13]. The crossover flow of oxygen from the anode side to the cathode side and the crossover flow of hydrogen from the cathode side to the anode side are not only a problem of product loss but also a safety issue [14]. Different ideas have been proposed for reducing these flows by developing novel membrane materials [15] or using catalyst particles in the membrane for recombining oxygen and hydrogen to form water [16]. While recombination could eliminate the safety issue, the product loss can only be reduced by increasing the membrane thickness. Unfortunately, thicker membranes are responsible for higher voltage drops in the electrolyzer by which the cell efficiency decreases. From this point of view, it is very reasonable to use thin membranes and operate these at atmospheric pressure to ensure low crossover flows. It is obvious that this opposing approach must be discussed in combination with the inclusion of relevant processes on the functional layer and system levels.
The existing literature shows approaches to model the total efficiency of a PEM electrolysis system. Schalenbach et al., for instance, published a model for calculating the efficiency of a system that focuses on hydrogen permeation across the membrane and whether the product gas should be compressed electrochemically or subsequently by compressors [17,18]. They determined that subsequent compression is more efficient than electrochemical compression for a 50 µm membrane. In contrast to this result, Tjarks et al. described the optimum operation for a 175 µm membrane and obtained a cathode pressure of 20 bar for current densities of up to 3 A cm−2 [19]. According to Bensmann et al., a differential pressure mode is recommended for pressures up to 40 bar [20]. In this case, four mechanical compression steps can be saved when the storage pressure is 100 bar; the membrane thickness is not given in this work. However, Suermann et al. concluded that the use of a Nafion 117 membrane allows a reduction in permeation to low levels, and, hence, a cathode pressure of 100 bar [21]. Moreover, several other studies have been conducted that focus on improving PEM electrolysis system operation and efficiency [22,23,24,25,26]. All of these studies have neglected essential process steps in common, for example, the current density effect on the hydrogen permeation losses, or the modeling that is too specifically described for a system setup, for instance, in assuming a certain membrane thickness.
In this study, the essential processes are collected to generate a simple model. The PEM electrolysis system is described, while the variability of the relevant parameters is considered. For this reason, quantitative results are used to make more general statements about the relationship between membrane thickness and cathode pressure. Ultimately, this helps to illuminate whether a thinner or thicker membrane is preferable with respect to the issues of safety, efficiency, and feasibility.

2. Model

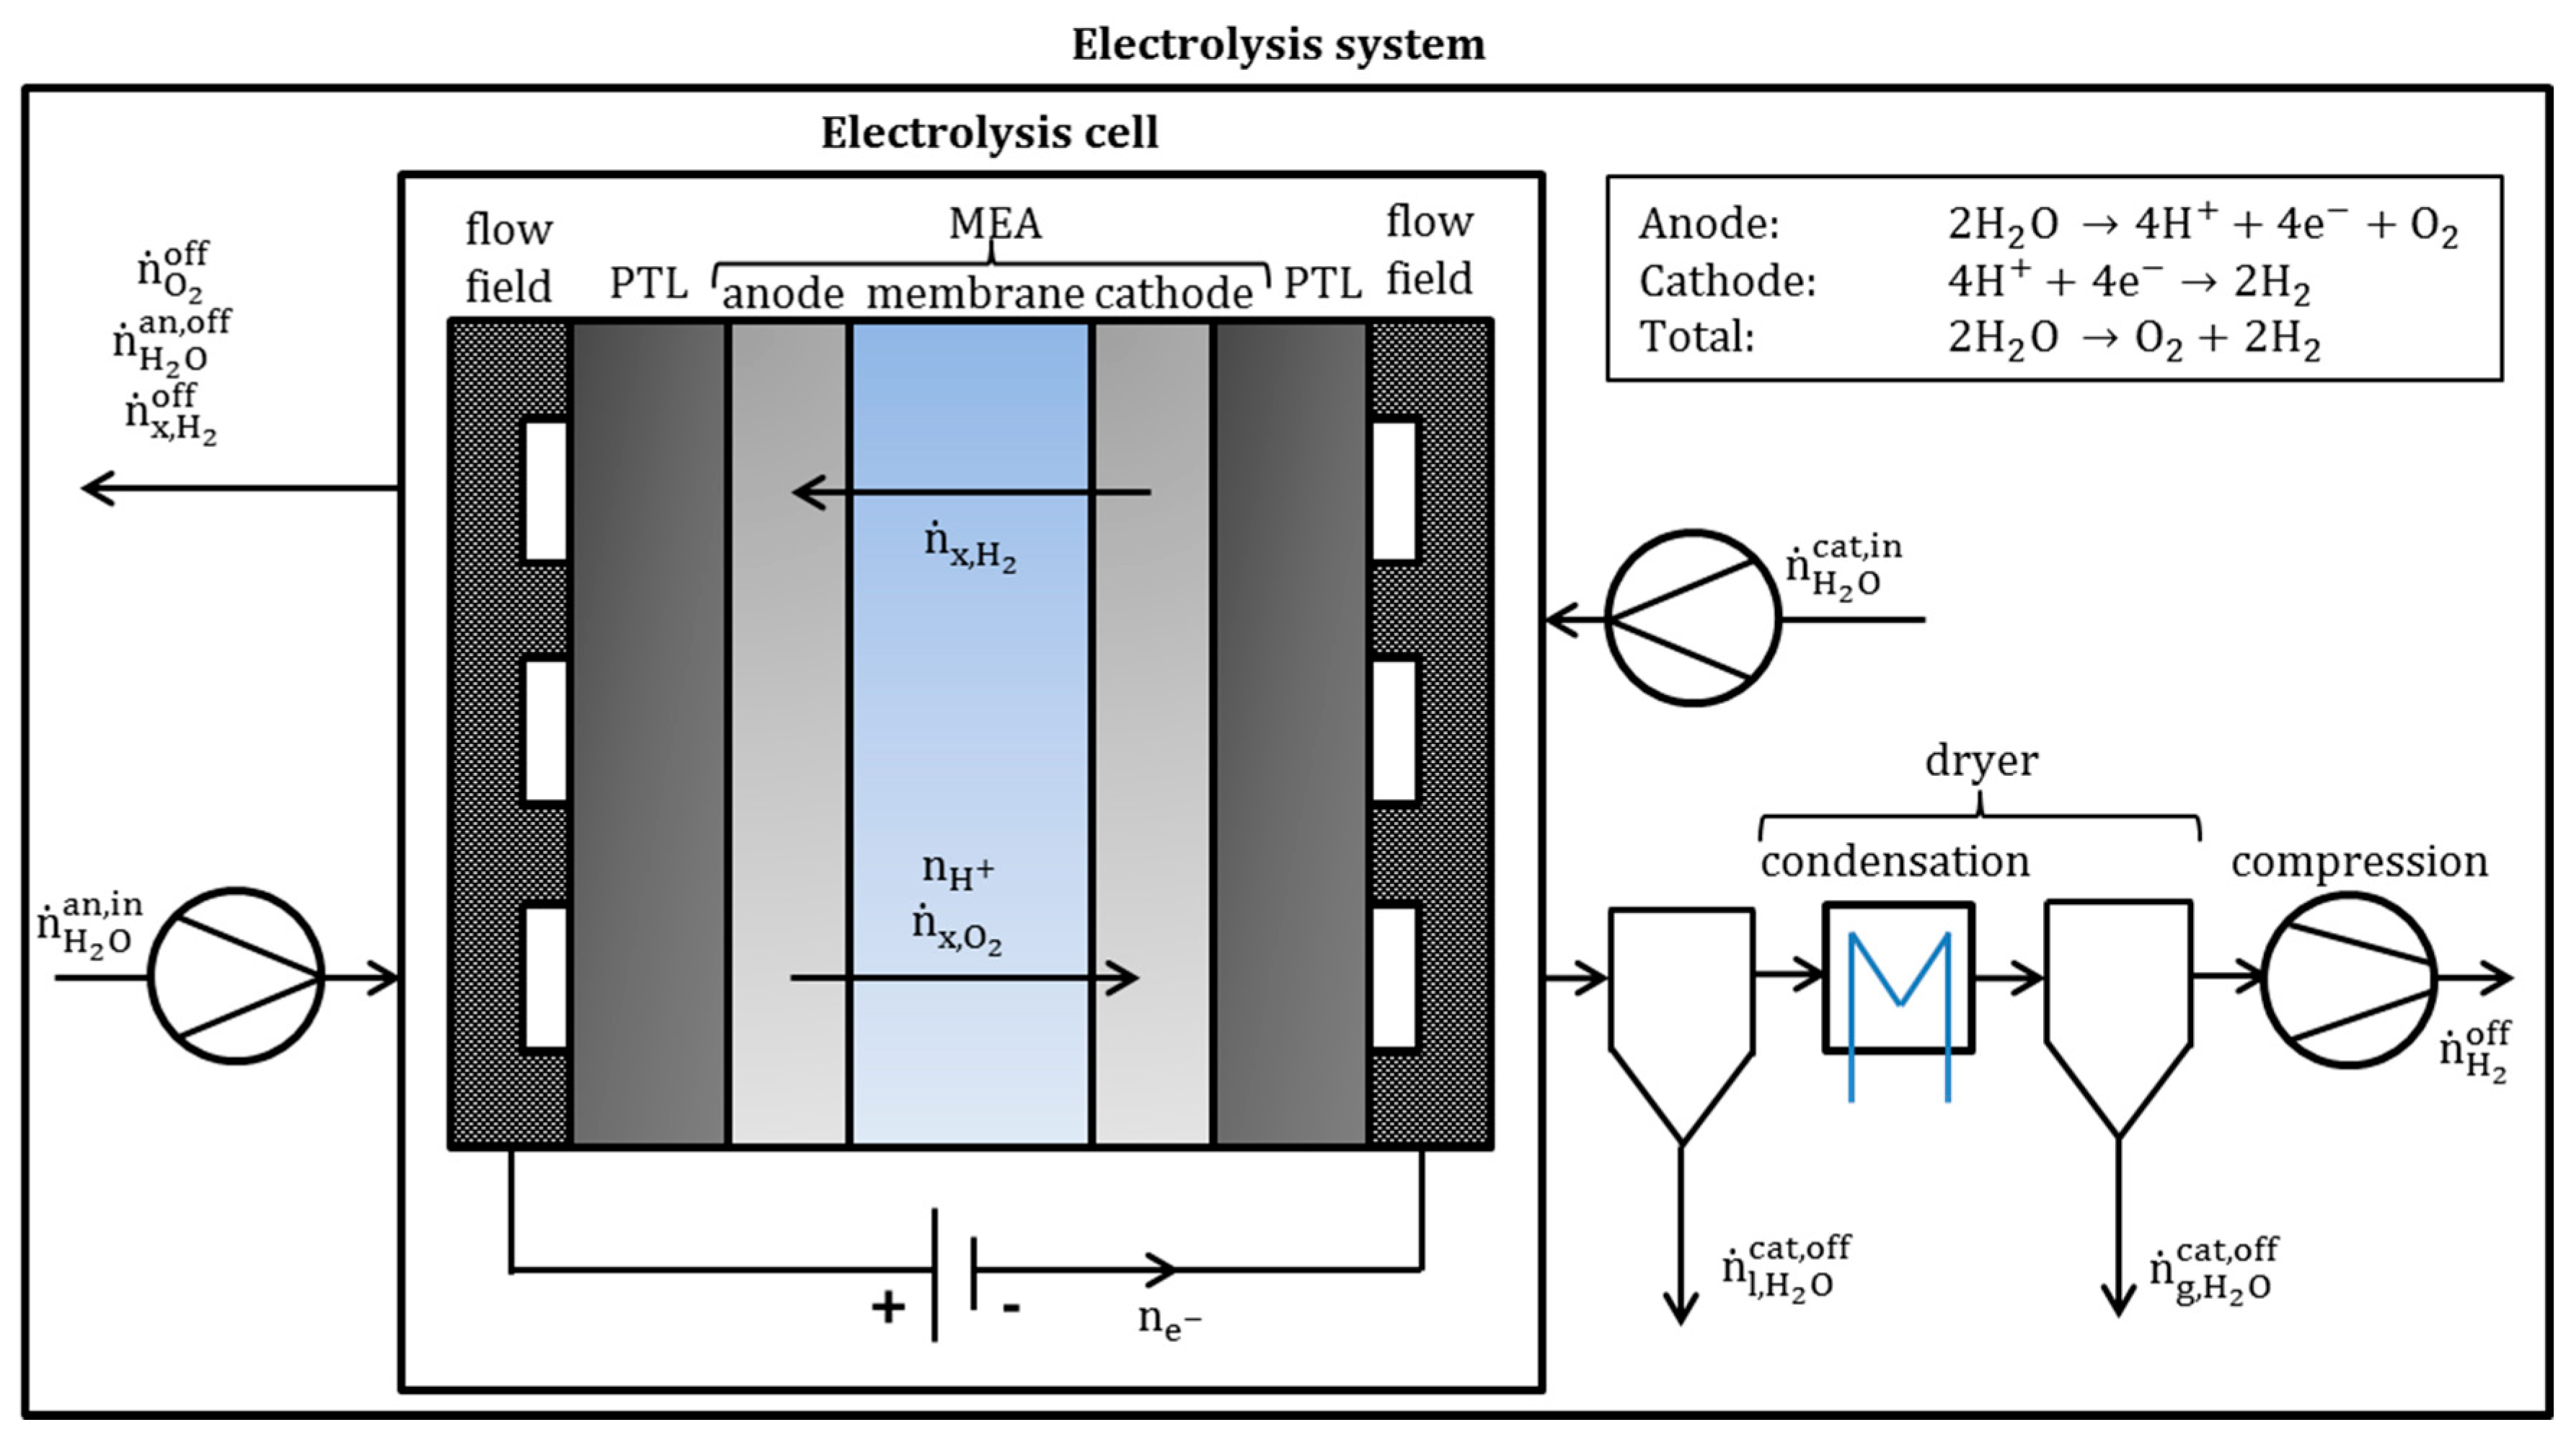
2.1. Electrolysis Cell and System

The electrolysis cell and system operate as shown below and with reference to Figure 1: Water, ( n ˙ H 2 O a n , i n ) streams in the flow field on the anode side. The water is distributed by a porous transport layer (PTL) and transported into the anode. At the anode, the water is oxidized to protons and electrons at a catalyst while oxygen is produced; as catalyst iridium oxide is frequently used. Most of the oxygen is released from the electrode to the flow field ( n ˙ O 2 o f f ) , while a minor part permeates across the membrane to the cathode ( n ˙ x , O 2 ) . The protons are transported along the ionic phase of the electrode and through the membrane to the ionic phase of the cathode. In PEM electrolysis, a typical ionomer that is used for this purpose is Nafion®. The electrons are transferred in the outer circuit to the cathode where the reduction of protons to hydrogen takes place. The most common catalyst on this side is carbon-supported platinum. Equivalent to the anode side, most of the hydrogen is released through the PTL into the flow field ( n ˙ H 2 o f f ) ; however, a small amount permeates across the membrane to the anode ( n ˙ x , H 2 ) . For heat management, the circulation rate of water in the flow field can exceed the value needed for the electrochemical reaction by up to 3 orders of magnitude. In addition, the cathode side is also flowed through by water ( n ˙ H 2 O c a t , i n ) . The mixture of hydrogen and liquid water released from the cathodic flow field is separated ( n ˙ l , H 2 O c a t , o f f ) , and the water-loaded hydrogen gas is dried ( n ˙ g , H 2 O c a t , o f f ) . If the cell pressure differs from the storage pressure, the produced hydrogen will be compressed to the desired storage pressure in the gas compressor afterward. It is also an option for the same procedure to store pure oxygen from the anode reaction [4].

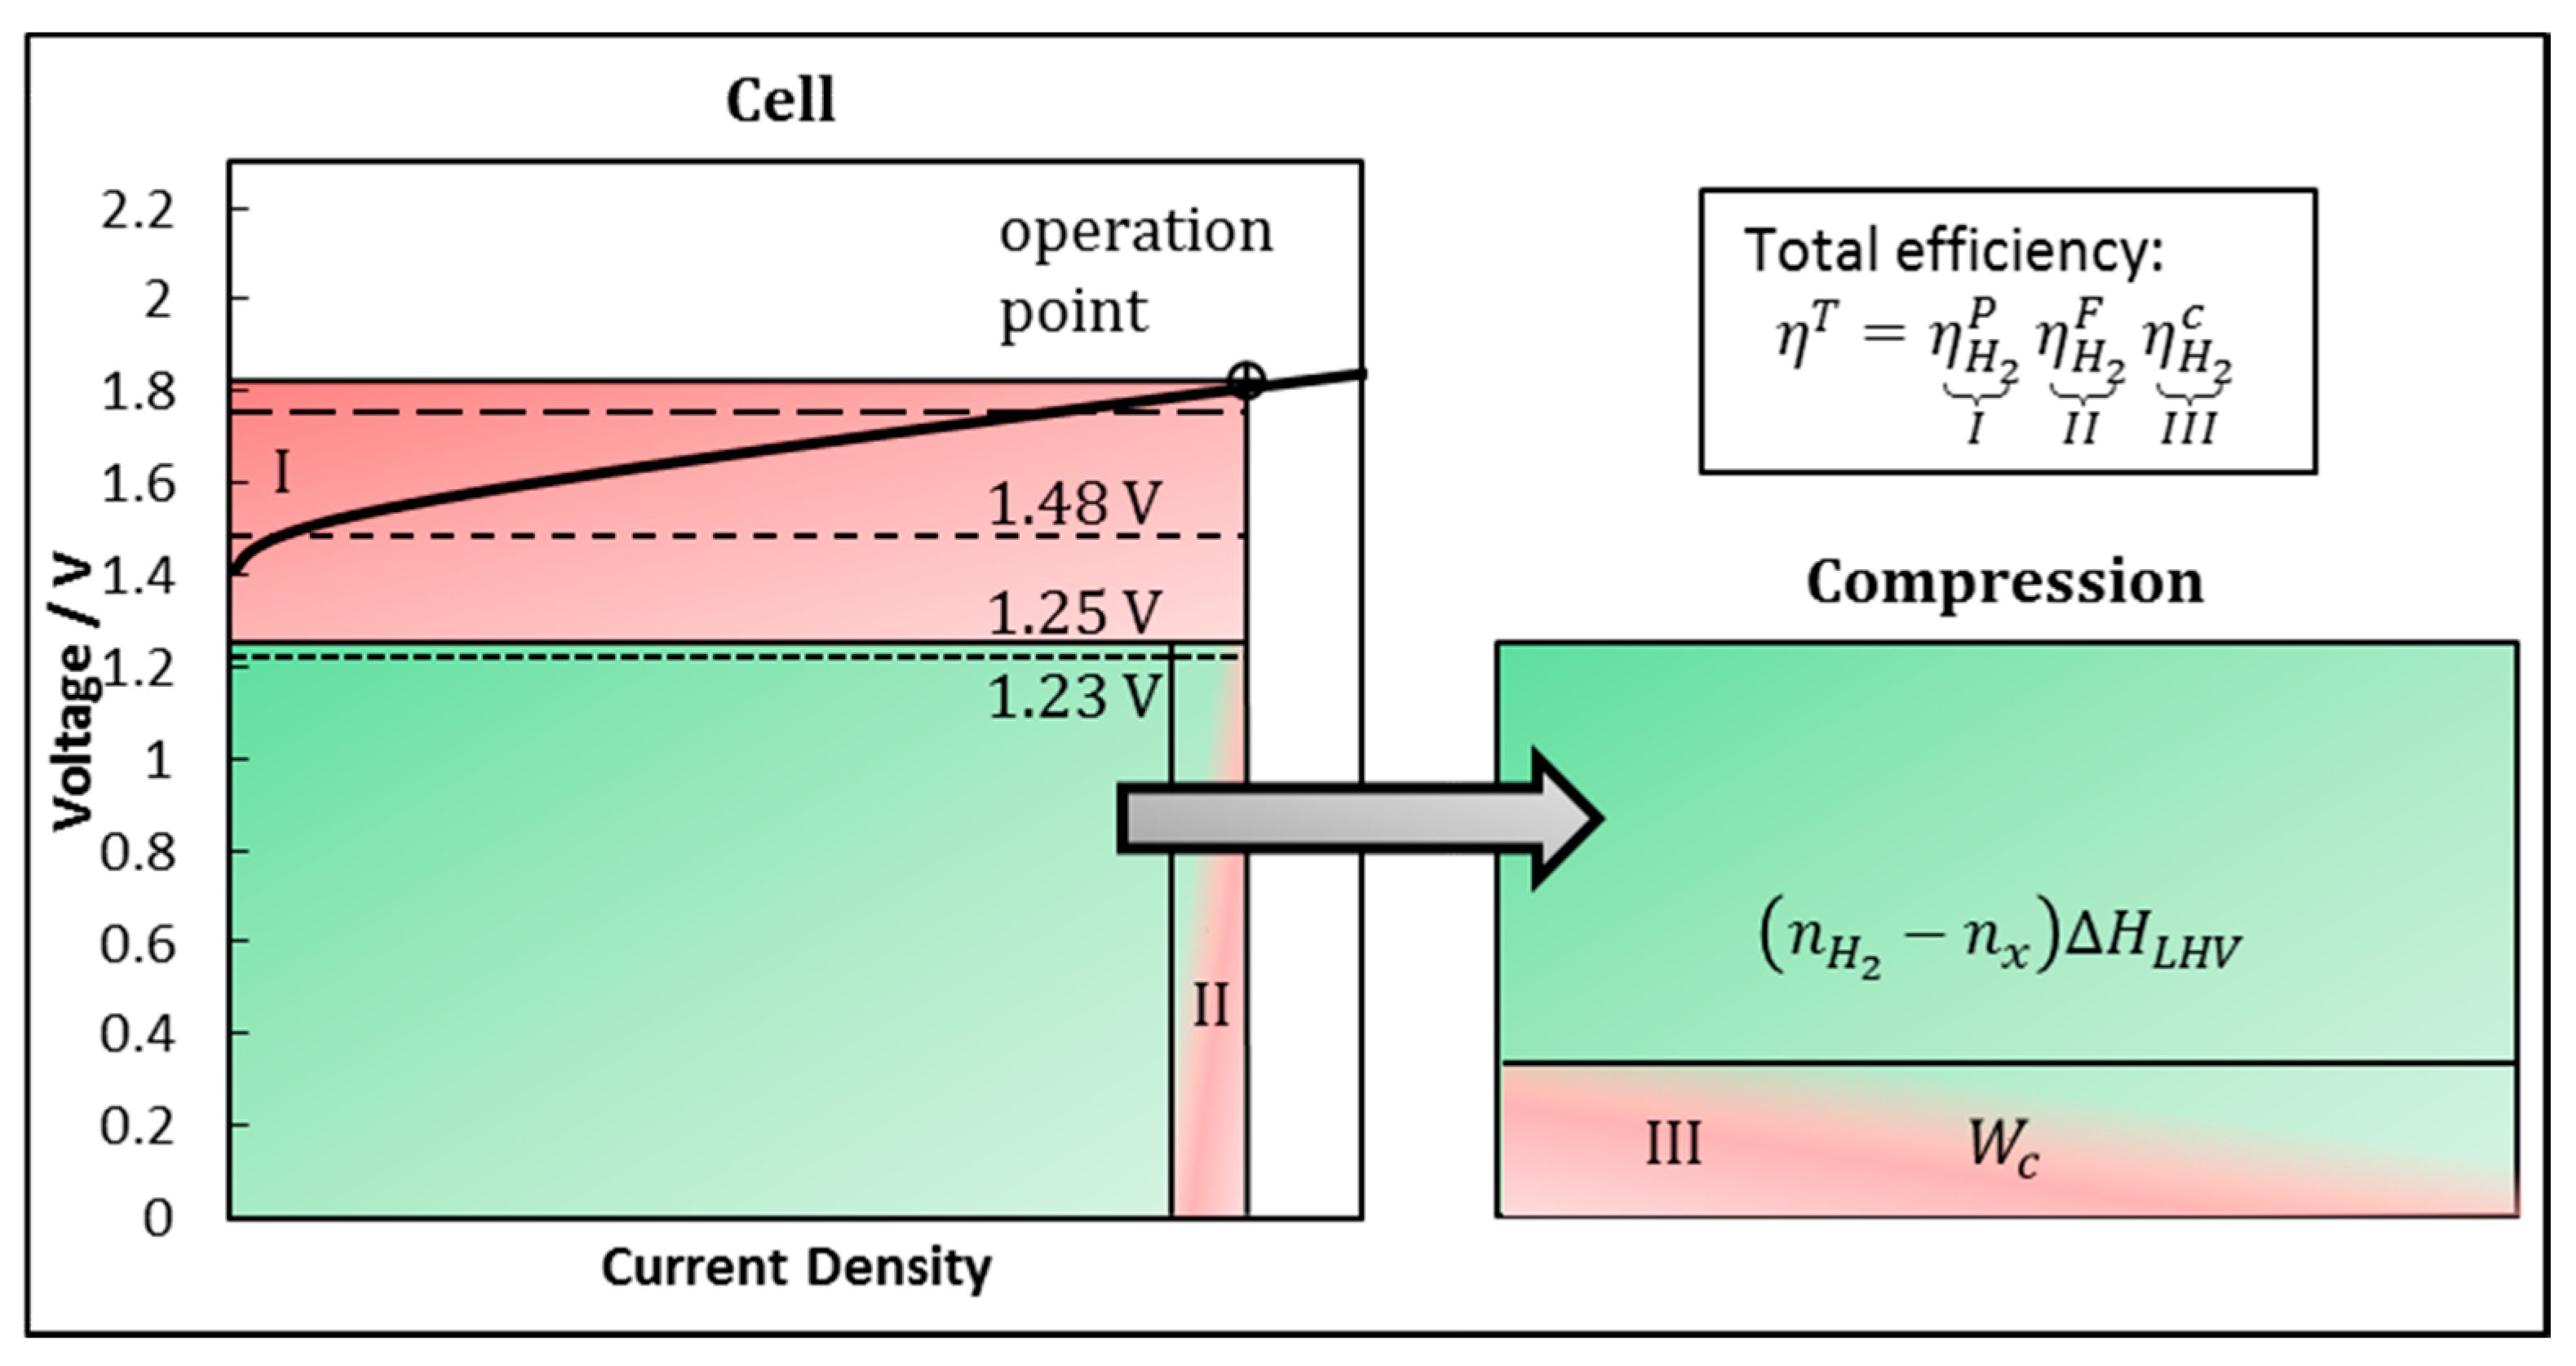
2.2. Fundamentals of System Efficiency

For the splitting of water to produce hydrogen and oxygen, energy is required, as the reaction is an endothermic process. The amount of energy is determined by the enthalpy change, ΔH, which is the sum of the Gibbs free energy, ΔG, and heat energy, TΔS. While heat can be consumed from the environment, the Gibbs free energy defines the minimum decomposition potential that is necessary for an electrochemical reaction. In the case of PEM water electrolysis, water is supplied in its liquid form, which requires additional energy for vaporization. At standard conditions (T = 298 K, p = 1.013 bar, pH = 7), the enthalpy of change for the splitting of liquid water is ΔH = 286 kJ mol−1 and the Gibbs free energy is ΔG = 237 kJ mol−1. The Gibbs free energy can be converted into the standard electrode potential of 1.23 V and the enthalpy into the thermoneutral voltage of 1.48 V [27].
In an electrolyzer, the applied voltage exceeds the reversible voltage to enhance the charge transfer in the membrane electrode assembly (MEA), as the current density is directly proportional to the hydrogen production rate. The difference in the experimentally observed voltage and the thermodynamically determined value is called overpotential. This means that the output of hydrogen-bonded chemical energy, Eout, is lower than the energy required for its production, Ein. The ratio of these values is defined as the voltage efficiency of the cell, η H 2 , e l p . The energies can also be expressed as the input power, Pin, and the output power, Pout.
The output power is the product of the hydrogen production per second, n ˙ H 2 p , and the heat of combustion of hydrogen. The heating value of hydrogen is a reference value, which can refer to the upper or lower heating value, depending on whether the heat released by this process can be used. In this paper, it is assumed that heat is not usable, thus referring to the lower heating value of ΔHLHV = −241 kJ mol−1, which is equivalent to a voltage of 1.25 V.
On the other hand, the input power is the sum of the electric power, Pel = UcellIcell, and the heat flow, Q ˙ , which are supplied to the system. Heat flow and electric power are closely interlinked as the external heat requirement decreases with increasing overpotential due to Joule heating. To formally describe this relationship, either the electric power must be converted into an enthalpy or the external heat flow into an equivalent electric power. In this work, the heat flow is transformed into an equivalent electric power, Q ˙ = Uheat · Icell. From these considerations, Equation (1) follows:
η H 2 p = E o u t E i n = P o u t P i n = n ˙ H 2 p Δ H L H V Q ˙ + P e l = U L H V I c e l l U h e a t I c e l l + U c e l l I c e l l = 1.25   V U h e a t + U c e l l .
Accordingly, the efficiency of hydrogen production depends on the cell voltage and the equivalent voltage that describes the additional external heat that is required. Above, it is explained that the enthalpy that includes the entropy term, TΔS, as well as the vaporization enthalpy, leads to the thermoneutral voltage of about 1.48 V. Additionally, the minimum decomposition voltage for liquid water was declared to be 1.23 V. This ultimately means that the residual 0.25 V can be supplied either electrically or by external heat. Therefore, the voltage equivalent of the external heat is the difference of the thermoneutral voltage and the actual cell voltage. However, it has to be considered that the product gases, hydrogen and oxygen, will be loaded by water vapor before they are released by the system. For this reason, additional vaporization energy is required for the loading of the gases. As previously mentioned, this vaporization energy can be transformed into a voltage equivalency, which is declared as Uload in this work. In total, the equivalent voltage to describe the required external heat, Uheat, is the thermoneutral voltage plus the vapor loading voltage equivalency. This value is reduced by the supplied electric voltage:
U h e a t = | 1.48   V + U l o a d U c e l l | .
This equation means that for positive values of the argument of Uheat, the system must be heated, and negative values mean that cooling of the system is necessary to keep the temperature constant. In the case of negative arguments, Uheat = 0 can be assumed as cooling is apparent due to the high water circulation rates through the cell with passive cooling by the environment. The energy required for pumps and cooling is insignificant in this case [28]. Therefore, the maximum efficiency of hydrogen production is only determined by the cell voltage:
η H 2 , e l p = 1.25   V U c e l l .
By contrast, if Uheat is higher than 0 V, the total amount of heat requirement limits the maximum efficiency, with the efficiency being independent of the cell voltage:
η H 2 , h e a t p = 1.25   V 1.48   V + U l o a d .
The efficiency of the system is reduced by further influences. As mentioned in the introduction, product gas permeates across the membrane. In the case of hydrogen permeation, a direct loss of storable energy carriers occurs. By contrast, when oxygen permeates across the membrane, water is produced by consumption of the electrochemically produced hydrogen. In total, nx denotes the amount of energy carriers that are lost by permeation. According to Faraday’s law, the loss rates can be expressed as a current density, jx. Therefore, the storable amount of hydrogen is lower than the current density, j, suggests. This deviation can be expressed by Faraday’s efficiency, η H 2 F , as
η H 2 F = E o u t E i n = ( n H 2 p n x ) Δ H L H V n H 2 p Δ H L H V = j j x j = 1 j x j .
In industrial contexts, the remaining hydrogen should be stored at certain storage pressures that vary depending on the intended application. It is uncertain whether this pressurization should be achieved inside the cell electrochemically, outside the cell by subsequent compression, or by a combination of both. In the case of subsequent compression, pressure-volume work, Wc, must be performed. The additional pressure-volume work can be related to the heating value of storable hydrogen. Then, the total efficiency reduces by the following factor:
η H 2 c = 1 W c ( n H 2 n x ) Δ H L H V 1 η c .
The equation takes into account the fact that gas compressors have a limited efficiency, ηc. However, Equation (6) is not equal to the compression efficiency, as it does not consider the mechanical energy stored in the pressure, instead only describing the effort to compress the gas as a fraction of stored energy.
Aside from Equations (1)–(6), all process steps such as gas drying above 2 bar or water pumping can be assumed as negligible [19,28]. Ultimately, the total efficiency or system efficiency of a PEM electrolysis system is
η T = η H 2 p η H 2 F η H 2 c .
It can also be comprehended graphically, as illustrated in Figure 2. As the effort to produce hydrogen is often given in values of kg H2 per kWh, it should be noticed that this value is given by the ratio of efficiency and heating value of hydrogen. Therefore, the effort is proportional to the efficiency.
The following describes how the voltage equivalency, Uload, cell voltage, Ucell, crossover current densities, jx, and compression work, Wc, are modeled in this study.

2.3. Hydrogen Production Efficiency

With respect to Equation (1), the efficiency of hydrogen production depends on the thermal and electric energy supplied to the system. According to Equation (2), the energy leaving the system as steam must be determined. In the first step, the molar flow of steam, n ˙ H 2 O , is calculated by assuming an ideal gas and Dalton’s law:
n ˙ H 2 O = n ˙ H 2 p H 2 O p H 2 c a t + n ˙ O 2 p H 2 O p O 2 a n .
The flow depends on the production rates of hydrogen,   n ˙ H 2 , and oxygen, n ˙ O 2 , and their partial pressures p H 2 c a t and p O 2 a n in the associated half-cells in equilibrium, as well as depending on the partial pressure of water, p H 2 O . It is assumed that the product gases are saturated with water when the gas is released. When multiplying Equation (8) with the enthalpy of vaporization, ΔHvap, and after using Faraday’s law to replace the molar flow by the electric current, the voltage equivalency, Uload, results in
U l o a d = p H 2 O 2 F ( 1 p H 2 c a t + 1 2 p O 2 a n ) Δ H v a p .
Qualitatively, this equation expresses a decreasing overpotential equivalence from the gas loading for the decreasing partial pressures of water and increasing partial pressure of the product gas.
While Uload is the thermal energy voltage equivalency, the electric cell voltage, Ucell, describes the electric energy that affects the chemical reaction. It contains the Nernst voltage, UN, and the so-called activation overpotential, Uact, as well as the resistance overpotential, Ures:
U c e l l = U N + U a c t + U res .
In this work, it is assumed that an additional so-called concentration overpotential is insignificantly low for PEM electrolyzers, as current densities of more than 14 A cm−2 were measured without showing this phenomenon in a previous work [29].
According to Nernst’s equation, the minimum voltage at which water is electrochemically split is the difference in the electrode potentials, Ean and Ecat. By means of the reversible cell voltage, E r e v 0 , and by assuming the activity of liquid water in the cell to be 1, the Nernst equation is
U N = E a n E c a t = E r e v 0 + R T c e l l 2 F ln ( p O 2 a n p 0 p H 2 c a t p 0 ) .
The reversible cell voltage can, according to Harrison [30], be calculated as follows:
E r e v 0 = 1.229   V 0.9 10 3   ( T c e l l     298   K )   V K .
Additionally, the Nernst voltage depends on the cell temperature and the partial pressures in the electrode, referred to as the reference pressure, p0. It can be seen from this equation that an increase in pressure in the cell to achieve the storage pressure without mechanical compressors causes a voltage increase and, therefore, reduces the efficiency of the system. The activation overpotential results from the reaction kinetics at the electrodes and is described precisely by the Butler-Volmer equation. However, when the applied current density is much higher than the exchange current density, j0, the Tafel equation is a sufficiently accurate approximation. As current densities in PEM electrolyzers are in the range of several A cm–2 and the exchange current densities are in the range of nA cm−2 to mA cm−2, the Tafel equation is used for the model [31]. The actual total activation overpotential is the sum of the activation overpotential at the anode and cathode catalyst. However, as α and j0 depend on the individual manufacturing process, they must be determined experimentally. In the experiments, the cathode and anode cannot be separated by analyzing the polarization curve, as the system is underdetermined. For this reason, the activation overpotential is fitted from experimental data to obtain characteristic values for α and j0 according to Equation (13):
U a c t = R T c e l l α z F ln ( j j 0 ) .
As j0 becomes a fitting parameter through this approach, it is challenging to express its naturally given temperature and pressure dependence. Therefore, a constant temperature of 80 °C is assumed in the model. However, the pressure dependency is more challenging to handle. It was shown by Grigoriev et al. that for high current densities, the cell voltage can be reduced by increasing the pressure, which is in contradiction to the Nernst equation [32]. This result was approved by Bernt et al. [33] and was shown by Suermann et al. for the balance pressure mode [21]. This finding relates to enhanced reaction kinetics, which makes j0 a function of pressure. In this study, this effect is not considered, for two reasons. First, it has not been quantitatively described in detail until now, and second, the effect on the results in this paper is low compared to the impact of other parameters.
The last term of Equation (10) contains the electric resistance of the cell, which can be divided into two parts. The electric resistance, R0, summarizes the resistances of the electrodes, PTLs, bipolar plates, and interface resistances. The ionic resistance of the membrane depends on the membrane thickness, dm, the swelling of the membrane, δm, and its conductivity, σm. Assuming Nafion as a membrane, the conductivity is a function of temperature and water activity in the membrane, a H 2 O m [34]. In this work, it is assumed that the membrane is saturated with water and its temperature is identical to the electrode temperature. In total, the resistance overpotential is calculated according to Equation (14):
U r e s = ( R 0 + d m δ m σ m ( T c e l l ;   a H 2 O m ) ) j .

2.4. Faraday Efficiency

As mentioned in the previous section, the storable amount of hydrogen is reduced due to the permeation of product gases across the membrane. It is expressed as a function of the current density and the hydrogen crossover current density. At zero current density, it is commonly supposed that the hydrogen crossover current density can be expressed by Equation (15) [35]:
j x , H 2 = 2 F P H 2 T p H 2 c a t d m δ m .
In this equation, P H 2 T symbolizes the temperature-dependent permeability coefficient and it is assumed that the anodic hydrogen partial pressure is negligible. When increasing the current density, a deviation to higher gas crossover current densities occurs. This deviation is most often described as a linear function of the current density. Even though many studies have been published on this effect, the reason for this behavior is still debated; it was postulated that a local pressure enhancement in the electrode leads to a higher permeation current density in comparison to Equation (15) [36]. In contrast to this, other studies suppose a supersaturation of the water surrounded by the ionomer, resulting in increased mass transfer to the ionic phase [37]. In addition, the occurrence of convection is also under discussion [35]. Furthermore, the cell compression appears to have an impact on the gas permeation across the membrane [38]. In this work, the effect on the gas crossover current density is described by adding a linear term with a constant, ax, to Equation (16):
j x , H 2 = 2 F P H 2 T p H 2 c a t d m δ m + a x d m δ m j .
The dependence of the crossover current density on the membrane thickness was proved to be valid for all membrane thicknesses by Albert et al. [39]. Trinke et al., in turn, showed that the slope of the current density effect on the crossover current density is a constant for all cathode pressures [40].
Finally, the total gas crossover current density, jx, described in Equation (5), is the sum of the hydrogen, j x , H 2 , and oxygen, j x , O 2 , crossover current densities. The permeability coefficient of oxygen through Nafion® is reported to be approximately twice the value of the hydrogen permeability coefficient [17,18,41]. It is assumed that the current density effect on the permeation is the same for both electrodes [17,18]. Then, the total gas crossover current density is described by Equation (17):
j x 2 [ F P H 2 T p H 2 c a t + p O 2 a n d m δ m + a x d m δ m j ] .
Aside from the crossover current density, it is important to consider that hydrogen in oxygen forms an explosive mixture if the hydrogen concentration exceeds a value of 4%. According to safety regulations, a test station is to be shut down when half of this value is reached. To calculate the volume fraction of hydrogen in oxygen, ϕ H 2   i n   O 2 , Equation (18) is used in this study:
ϕ H 2   i n   O 2 = n x , H 2 n x , H 2 + n O 2 = j x , H 2 j x , H 2 + 1 2 j .

2.5. Compression Effort

According to Equation (6), a subsequent compression of the resulting gases leads to a loss of efficiency due to the volume–pressure work, Wc, that must be performed. The efficiency is further reduced by the limited efficiency of mechanical compressors, ηc. The best case of ideal isothermal compression is not achievable from a technical point of view. By contrast, the worst case of isentropic compression is not applied. Instead, gas is cooled down to an initial temperature, Tin, at which the compression process starts. With the compression process, both the pressure and the temperature increase. At an upper temperature limit, the compression stage stops and the gas is cooled down to the initial temperature to start the next compression stage. The compression factor, cc, is the ratio of the pressure after compression and before compression. For a single compression stage, the required energy, W c 1 , is calculated as follows [42]:
W c 1 = κ κ 1 ( n H 2 p n x ) R T i n Z ( c c κ 1 κ 1 ) .
κ symbolizes the average heat capacity ratio and Z is the average compressibility factor [43]. The number of stages, sc, that are needed to increase the pressure from cell pressure to storage pressure, p H 2 s , can be calculated according to Equation (20):
s c = log ( p H 2 s p H 2 c a t ) log ( c c ) .
Therefore, the total amount of energy required for subsequent compression is
W c = s c W c 1 .
For technical reasons, the physically existing number of compressor stages must be a whole number, but for calculating Equation (21), it is a positive real number. If the number of stages and the compression factor are given, the minimum input pressure of each stage, ( p c ) i , can be calculated from a sequence:
( p c ) i = p H 2 s ( ( c c ) i ) i = 1 i m a x .

2.6. Parameter Values

2.6.1. Parameter Values from Literature

The parameter values used for the simulation are listed in Table 1. They are defined by the following: The partial pressure of water at 80 °C was calculated by use of the Magnus approximation [44]. The permeability coefficient for water at the same temperature was measured by Schalenbach et al. [17,18]. The conductivity of Nafion was calculated according to Yadav and Fedkiw [34], while Shi et al. analyzed the membrane swelling [45]. The compression ratio was chosen to be within the range of 2.5–3, as given by Bensmann et al. [20]. Therefore, cc = 2.75 was assumed, which is similar to the assumptions of a previous work [19]. According to the literature, the adiabatic efficiency of reciprocating compressors is up to 90% [46]. However, the average value is 80–85%, which also matches with the efficiency of high-class diaphragm compressors [47]. For this reason, ηc = 82.5% was chosen. Furthermore, the outlet pressure was chosen as being typical for pipelines [48].

2.6.2. Parameter Values Evaluated

The coefficients α, j0, and ax were determined from fitting experimental data at 80 °C and atmospheric pressure. Nafion 212 has been used as the membrane (dm = 51 µm), and a platinum loading of the cathode of 0.25 mg cm−2 and an iridium oxide loading of the anode of 0.96 mg cm−2 have been used. The ionomer content was set to 10 wt.%. Platinum-coated Bekaert titanium felt (350 µm) was used as the anode PTL, along with Toray carbon paper TGP-H-120. An electric resistance of 68 mΩ cm2 was measured for the cell area of 17.64 cm2 by impedance spectroscopy, which means that R0 = 27 mΩ cm2. The voltage was set to be between 0 and 1.85 V, resulting in current densities of up to 3.07 A cm−2. The results are shown in Figure 3 and the evaluated parameters are listed in Table 2.

3. Results and Discussion

The simulation protocol is as follows: First, the optimal total efficiency of a PEM electrolyzer is calculated as a function of current density (0.05 A cm−2 steps) by evaluating the best combination of hydrogen partial pressure (10 mbar steps) in the cathode and membrane thickness (1 µm steps). Afterward, the system is constrained to understand how it works under realistic conditions. In all cases, a differential pressure mode is assumed and that the heat must be supplied by the system.

3.1. The Ideal PEM Electrolyzer

The no-restriction optimization (see Figure 4) symbolizes the ideal case in which the cathode pressure and membrane thickness can be set independently of any technical restrictions. It shows which setup should be chosen to achieve the maximum system efficiency for a certain current density. At 0.5 A cm−2, the optimal membrane thickness is 88 µm and the cell should be operated at 6.2 bar in order to obtain a total efficiency of 73% at 1.59 V. By increasing the current density, the optimal pressure decreases to 3 bar at 1.2 A cm−2 and 1.62 V, while the optimal membrane thickness is 27 µm and the best total efficiency is 71%. Additionally, this condition results in a minimum hydrogen concentration in oxygen of 1.9%. By further increasing the current density, the ideal membrane thickness decreases to values lower than 10 µm and the ideal pressure rebounds. The system efficiency of the PEM electrolyzer decreases to 64% at 1.8 V, which is often used as a continuous operation point.
Figure 5A is helpful to understand why the membrane thickness and cathode pressure start at high values at low current density and then decrease to a local minimum. It is obvious that the total efficiency of the system mainly depends on the hydrogen production efficiency as the efficiency loss by hydrogen permeation across the membrane and gas compression is on the order of 5%.
At high current densities, the hydrogen production efficiency is equal to its electrical efficiency (see Equation (3)), as the required heat for the reaction and for saturating the product gas with water is produced by overpotential. Heat would be required to be supplied externally if the electrical efficiency (dashed blue line) was higher than the heat efficiency curve (dashed green line), which is between 76 and 78% at high current density. This situation can also be seen at low current density. However, according to Equation (9), the required energy can be reduced by an increase in pressure. This is precisely why Figure 4 shows an elevated pressure that decreases to a minimum at 0.9 A cm−2 or 1.62 V, as heat is increasingly supplied by overpotential. Unfortunately, the increase in pressure also promotes the permeation of hydrogen to the anode, which is why Faraday’s efficiency declines. When the voltage is above 1.62 V, heat is completely supplied by overpotential. In the following, an increase in cathode pressure is preferable to reduce the losses by subsequent gas compression.
The case of setting the membrane to be flexible in its thickness gives the following result: At low current density, thick membranes are preferable, as permeation losses must be prevented. By contrast, the hydrogen production efficiency would become worse at a high current density. Therefore, the membrane thickness should be reduced with an increase in the current density.

3.2. Voltage Limitation and Constant Membrane Thickness

In a real electrolyzer, one membrane must cover the entire current density operation range. Therefore, the membrane thickness is restricted in the model to have constant values. The chosen specifications relate to commercially available membranes (N211—25.4 µm, N212—51 µm, N115—127 µm, and N117—183 µm). Additionally, high overpotential is responsible for degradation processes. Therefore, PEM electrolyzers are normally not operated at cell voltages above 2.2 V [4]. In this work, a more conservative approach is chosen by limiting the cell voltage to 2 V. In comparison to the no-restriction case, the total efficiency curves become more complex (see Figure 6). All curves show the same qualitative behavior. Starting with 0 A cm−2, the optimum total efficiency as a function of current density increases to a maximum. The optimum pressure develops simultaneously with this behavior. With the further increase in current density, the total efficiency decreases continuously. At the same time, the optimum cathode pressure decreases from a local maximum to a local minimum, while the hydrogen concentration in oxygen follows this behavior. At higher current density, the cathode pressure and hydrogen concentration at the anode increase again. When reaching 2 V, the maximum current density is obtained under optimum pressure conditions. As the Nernst voltage is a function of gas pressure (Equation (11)), it is possible to achieve higher current densities by reducing the pressure while keeping the cell voltage constant. However, this approach causes a deviation from the optimal cell operation conditions. For this reason, the system efficiency drop per current density increases.
The complexity of the curves can be understood by noting the individual contributions to the efficiencies. The right side of Figure 5B shows the contributions when using an N211-membrane; however, all membranes qualitatively show the same behavior. While the behavior of the contributions is similar to those in the previous section at high current densities, the low current density range is more complex. Coming from high current densities where the cell voltage dominates the total efficiency, the required heat that must be supplied to saturate the product gases limits this efficiency to below 0.95 A cm−2 (also see Equation (4)). As before, the total efficiency can be increased for lower current densities when increasing the cathode pressure. Thus, reducing the current density to 0.75 A cm−2, a pressure increase from 4 bar to a local maximum of 6 bar can be seen (see Figure 6). At the same time, the permeation loss strongly increases, as the permeation flux increases due to the elevated cathode pressure and the oxygen production reduces due to the decreasing current density. In addition to these findings, the polarization curve shows an atypical kink. This relates to the cathode pressure behavior, which affects the Nernst voltage (see Equation (11)). At 0.75 A cm−2, the permeation loss becomes dominant for the process and exceeds the benefit gained by the reduced additional heat requirement. Therefore, the optimum cathode pressure reduces with decreasing current density. The occurring compression efficiency loss does not take this disadvantage into account.
When comparing the curves quantitatively, the best total efficiency of 73.7% is achieved at 0.3 A cm−2 and a 9-bar cathode pressure by the use of an N117 membrane. By the use of thinner membranes, the best overall efficiency is reduced and shifted to higher current densities, while the optimal pressure decreases. The N211 membrane has its best system efficiency of 71.7% at 0.85 A cm−2 and 4.7 bar. This advantage of the thicker membrane is due to a lower permeation loss, which allows a higher cathode pressure. This eventually reduces the heat required to saturate the gas phase and improves the system efficiency. Consequently, the local maximum pressure is higher for thicker membranes and the permeation is reduced. The advantage of higher total efficiency by the use of thicker membranes is lost when the current density is increased, as additional heat no longer contributes. In addition to the local maximum pressure (11.3 bar for N117 and 6.0 bar for N211), the local minimum pressure decreases with decreasing membrane thickness. The highest minimum is found to be at 5.9 bar for N117 at 0.4 A cm−2 and 2.9 bar for N211 at 1.25 A cm−2. In relation to the cell voltage, the local minimum is always located between 1.60 and 1.63 V.
With respect to the hydrogen permeation, the hydrogen concentration in oxygen for N211 is above 10% at 0.1 A cm−2, while N117 shows a maximum concentration of about 5.2% at this value. The location of the minimum hydrogen concentration in oxygen is shifted to higher current densities for thinner membranes, while the minimum concentration is reduced. With an increase in current density, a local minimum for the hydrogen content in oxygen is found. The value is between 1.43% (N117) and 2.17% (N211). A further increase in the current density results in slightly increasing values.
While the voltage is limited to 2 V, the optimal pressure is also limited to a membrane-specific value. The N117 membrane has the highest cathode pressure of 34.6 bar at 2.1 A cm−2. By reducing the pressure to 1 bar, a maximum current density of 2.45 A cm−2 is achievable, which is an increase of 14%. In comparison to these values, the maximum current density for the N211 membrane is 8.45 A cm−2 at 1 bar. The highest total efficiency at 2 V is achieved at 7.4 A cm−2 and 17.2 bar, which is also equal to an increase of 14%. It would seem that an additional hydrogen production of about 14% is available when the cathode pressure is reduced by sacrificing the total efficiency at the same voltage level.
It can be determined that the system efficiency at 2 V is almost the same for all membranes (56–57%). As mentioned above, at high current density and elevated pressure, the exchange current density may change, which could eliminate this advantage. Additionally, this would result in differences in high current-density total efficiency; however, it would not affect the interaction of contributions at low current density. Therefore, no qualitative changes in the behavior are expected.
These results impressively show the complexity of choosing the best membrane–cathode pressure combination. It also indicates that neither the thinnest membrane at constant low pressure to reduce the hydrogen crossover, nor the thickest membrane at constant high pressure to reduce the compression work, seems to be the best option at any current density.

3.3. Membrane Thickness and Pressure Mode

In contrast to pressure-optimized operation, PEM electrolyzers are often operated at a constant pressure level of 30 bar [49]. This leads to the discussion as to whether thin membranes at low pressure or thick membranes at high pressure are preferable. The advantages of thin membranes are higher current densities, but their disadvantage is a high permeation loss, which is why operation at a lower pressure is necessary. The use of thick membranes allows operation at high pressure, as permeation loss is reduced, but the current density is also reduced. Moreover, Tjarks et al. proposed pressure optimization as a function of current density [19].

3.3.1. System Based on an N117 Membrane

According to Equation (22), a compression ratio of 2.75, and an output pressure of 200 bar, the minimum input pressures for the compressor stages are 72.7, 26.5, 9.6, 3.5, 1.3, and 0.5 bar. Figure 7 illustrates how the total efficiency of a system with an N117 membrane is affected if no compressor ( p H 2 c a t = 200   bar ) is used and if one ( p H 2 c a t = 72.7   bar ) or two stages ( p H 2 c a t = 26.5   bar ) are used. These values can be compared to the system efficiency for the optimum cathode pressure that requires five stages. In all cases, it shows that the total efficiency is much less than in the optimum case at a low current density. However, with increasing current density, the difference becomes smaller as the permeation loss is reduced. If a relevant voltage range of 1.65–1.85 V is assumed, current densities of between 0.5 and 1.5 A cm−2 are applicable when operating at 26 bar. The total efficiency is less than 1% worse than in pressure-optimized mode. By contrast, the total efficiency is 3% to 15% worse if no compressor is used in the same current density range. A deviation resulting from improved kinetics that might improve the polarization curve should not have a significant impact on this result, as much total efficiency is lost due to permeation loss. Operating the system at 200 bar increases the hydrogen concentration in oxygen by up to 30% at 0.5 A cm−2, while, even at 1.8 A cm−2, the concentration is still above 10%. Therefore, a recombination catalyst layer is required for safety reasons. However, it is unclear how much reduction is possible with this approach. A study published by Klose et al. indicates that the recombination catalyst layer does not completely consume the permeating hydrogen, but still retains 10% of the initial permeated hydrogen [16]. As a maximum hydrogen concentration in oxygen of 2% is allowed at the stack outlet, the maximum hydrogen concentration before recombination must not exceed 20%. If this maximum value is assumed, a PEM stack with an N117 membrane and 200 bar is not operable below 1.76 V. By contrast, the N117 membrane at 26 bar can be operated for a cell voltage above 1.53 V and at 73 bar for a cell voltage higher than 1.62 V. This situation might change as soon as the efficiency of recombination catalyst layers is quantified in more detail for high permeation fluxes. However, the system efficiency is unaffected by the consumption efficiency as crossover is always a system efficiency loss.
For the given reasons, it is not recommended to operate an N117-based system at storage pressure. Instead, at least one compressor is required for an N117, but the voltage range is restricted to U > 1.62 V. The decision as to whether one or two compressors are preferable depends on the costs and the continuous operation condition of the electrolyzer. If it is assumed that the electrolyzer most often operates at 1.80 V, the one-stage and two-stage cases have a difference of 1%. In this case, it might be reasonable to save one stage and thus reduce the capital expenditure. However, the system cannot work below 1.62 V, which is a strong restriction on the partial load operating range. Therefore, a more conservative solution would be to install two compressor stages and operate at 26 bar. This result is in accordance with published studies that propose intermediate pressures [19,20].

3.3.2. System Based on N212 Membrane

While N211 would, in fact, be the thinnest membrane discussed in this paper so far, the membrane is not frequently used in real-world applications. For this reason, a system based on an N212 membrane is discussed. For the constant pressure mode, the cathode pressure is set to 3.5, 9.6, and 26.5 bar. The minimum outlet pressure of 1.3 bar is not considered, as the assumption of the negligible impact of gas drying would no longer be valid. The simulation results are shown in Figure 8.
It is demonstrated that the best pressure for an N117-based system of 26.5 bar is the worst for an N212-based system at low current density but shows the highest total efficiency at high current density. This efficiency drops by up to 5% below 1 A cm−2 or 1.66 V. Adding a third compressor stage at 9.6 bar to the system eliminates this disadvantage. By contrast, a fourth compressor (3.5 bar) would slightly decrease the total efficiency across the entire range. However, the hydrogen concentration in oxygen is the lowest in this case. Through the use of a recombination catalyst layer, this system should be operable at all cell voltages. In comparison to this, operating at 9.6 bar enables cell voltages above 1.52 and 1.59 V when the cathode pressure is set to 26.5 bar. From this point of view, it is worth considering operation at 26.5 bar; however, it could be more conservative to operate at 9.6 bar in order to expand the voltage range if this low partial load range is frequently used. This argument is in accordance with the N117-based case discussed in the previous subsection.
Aside from these considerations, installing a fourth gas compressor eliminates the need for a recombination catalyst layer at cell voltages above 1.60 V. As compressors are available in this case to compress the gas in the total range from 3.5 to 200 bar, the pressure-optimized mode is applicable to the system. Consequently, the maximum overall efficiency is achievable across the entire current density range, which reduces the operational expenditure with the result that a techno-economic study is needed to decide how to most economically run a system based on N212.

3.3.3. Economic Consideration

While it is unclear which mode is best for an N212-based PEM electrolysis system, this study indicates a strong tendency as to which membrane thickness is preferable with respect to system efficiency and economics. Therefore, an N212-based, pressure-optimized electrolyzer with three compressor stages and an N117-based, pressure-optimized electrolyzer with two compressor stages are compared. Figure 9 illustrates a higher hydrogen concentration in oxygen for N212 in terms of current density but similar concentrations when the value is related to the cell voltage. If a recombination catalyst layer is used, the minimum voltages are 1.52 V for N212 and 1.53 V for N117. As the hydrogen permeation across the membrane is similar, the best membrane choice is given by the best ratio of hydrogen production and costs. Defining a total system efficiency of 70%, the following cell voltage and current densities result for the membranes: 1.30 A cm−2 at 1.67 V (N212) and 0.65 A cm−2 at 1.69 V (N117). The hydrogen production of the N212-based system is twice that of the N117-based system at a lower cell voltage. Therefore, the cell area must be twice the size of the N117-based PEM electrolyzer. This means that the costs of manufacturing the stack are at least twice those for producing it for an N212-based system. The costs for the MEA materials, manufacturing, bipolar plates, and current collectors are 40–60% of the total system costs, independent of the system’s power class, while a reduction is not expected in the future [50,51,52,53,54]. For this reason, it is improbable that it is more cost-efficient to produce systems with thick membranes. However, it should be noted that thin membranes may show higher degradation rates [55].

4. Conclusions

It can be concluded that pressure-optimized operation is a favorable way to run a PEM electrolyzer. By comparing an N117-based system and an N212-based system, comparable total efficiencies and hydrogen concentrations in oxygen were discovered. However, the system with the thinner membrane produces a significantly larger amount of hydrogen that cannot be compensated by saving compressor stages. This result indicates that the use of thinner membranes in PEM electrolyzers is required. With regard to membrane development, permeation across the membrane is obviously not restrictive for the use of thin membranes, and so the mechanical and chemical stability of thin membranes are more preferable for improvement. The model shows that the total system efficiency is dominated by the heat supply and hydrogen crossover loss of up to 1.60–1.63 V in pressure-optimized mode. Above this value, the polarization curve is responsible for more than 90% of the system’s efficiency. In addition, between 1.60 and 1.63 V, the highest efficiency of about 74% is achieved, which is independent of the membrane thickness. By applying pressure optimization, the hydrogen concentration in oxygen is between 1.7% and 2.4% between 1.6 and 2 V. At 2 V, the system efficiency is about 56% for all membranes if no minimum pressure due to gas compressor stages is assumed. In this case, it could also be possible to extend the current density range at constant cell voltage by 14% by decreasing the cathode pressure. If the gas compressor stages are taken into consideration, it shows that operating at a storage pressure of 200 bar will result in poor system performance, as the permeation loss would be too high. By contrast, the use of thin membranes and very low pressures also proves to be a bad choice, as the required heat would limit the total efficiency.

Author Contributions

Conceptualization, F.S. and M.S.; methodology, F.S.; software, F.S.; formal analysis, F.S.; investigation, F.S.; resources, A.S. and M.S.; writing—original draft preparation, F.S.; writing—review and editing, E.R., M.M., M.S., M.C. and W.L.; visualization, F.S.; supervision, M.M. and W.L. All authors have read and agreed to the published version of the manuscript.

Funding

This research received no external funding.

Acknowledgments

We acknowledge Thomas Pütz for the technical support in carrying out the measurements and Dieter Froning and Uwe Reimer as discussion partners.

Conflicts of Interest

The authors declare no conflict of interest.

Abbreviations

Nomenclature
Aampere
acurrent density effect on permeation
c c compression factor
dmembrane thickness
Eenergy
FFaraday constant
GGibbs free energy
Henthalpy
Icurrent
jcurrent density
KKelvin
n ˙ molar flow
Ppower
P H 2 T permeability coefficient
ppressure
Q ˙ heat flow
Rgas constant
R 0 electric resistance
Sentropy
scompressor stages
Ttemperature
Uvoltage
Vvolt
Wpressure–volume work
Zcompressibility factor
znumber of transferred electrons
Greek Symbols
α charge transfer coefficient
Δ difference
δ swelling factor
η efficiency
κ average heat capacity ratio
σ conductivity
ϕ volume fraction
Subscripts
0standard
1one step
actactivation
ananode
ccompression
catcathode
elelectric
FFaraday
iindex number
loadvapor loading
NNernst
pproduction
resresistance
revreversible
sstorage
Ttotal
vapvaporization
xcrossover

References

  1. Gür, T.M. Review of electrical energy storage technologies, materials and systems: Challenges and prospects for large-scale grid storage. Energy Environ. Sci. 2018, 11, 2696–2767. [Google Scholar] [CrossRef]
  2. Zheng, Y.; Wang, J.; Yu, B.; Zhang, W.; Chen, J.; Qiao, J.; Zhang, J. A review of high temperature co-electrolysis of H2O and CO2 to produce sustainable fuels using solid oxide electrolysis cells (SOECs): Advanced materials and technology. Chem. Soc. Rev. 2017, 46, 1427–1463. [Google Scholar] [CrossRef] [PubMed]
  3. Phillips, R.; Dunnill, C.W. Zero gap alkaline electrolysis cell design for renewable energy storage as hydrogen gas. RSC Adv. 2016, 6, 100643–100651. [Google Scholar] [CrossRef] [Green Version]
  4. Carmo, M.; Fritz, D.L.; Mergel, J.; Stolten, D. A comprehensive review on PEM water electrolysis. Int. J. Hydrogen Energy 2013, 38, 4901–4934. [Google Scholar] [CrossRef]
  5. Hank, C.; Gelpke, S.; Schnabl, A.; White, R.J.; Full, J.; Wiebe, N.; Smolinka, T.; Schaadt, A.; Henning, H.M.; Hebling, C. Economics & carbon dioxide avoidance cost of methanol production based on renewable hydrogen and recycled carbon dioxide—Power-to-methanol. Sustain. Energy Fuels 2018, 2, 1244–1261. [Google Scholar]
  6. Shaner, M.R.; Atwater, H.A.; Lewis, N.S.; McFarland, E.W. A comparative technoeconomic analysis of renewable hydrogen production using solar energy. Energy Environ. Sci. 2016, 9, 2354–2371. [Google Scholar] [CrossRef] [Green Version]
  7. Chen, Z.; Higgins, D.; Yu, A.; Zhang, L.; Zhang, J. A review on non-precious metal electrocatalysts for PEM fuel cells. Energy Environ. Sci. 2011, 4, 3167–3192. [Google Scholar] [CrossRef]
  8. Xing, L.; Shi, W.; Su, H.; Xu, Q.; Das, P.K.; Mao, B.; Scott, K. Membrane electrode assemblies for PEM fuel cells: A review of functional graded design and optimization. Energy 2019, 177, 445–464. [Google Scholar] [CrossRef]
  9. Yigit, T.; Selamet, O.F. Mathematical modeling and dynamic Simulink simulation of high-pressure PEM electrolyzer system. Int. J. Hydrogen Energy 2016, 41, 13901–13914. [Google Scholar] [CrossRef]
  10. Niermann, M.; Drünert, S.; Kaltschmitt, M.; Bonhoff, K. Liquid organic hydrogen carriers (LOHCs)—Techno-economic analysis of LOHCs in a defined process chain. Energy Environ. Sci. 2019, 12, 290–307. [Google Scholar] [CrossRef]
  11. Jorschick, H.; Preuster, P.; Dürr, S.; Seidel, A.; Müller, K.; Bösmann, A.; Wasserscheid, P. Hydrogen storage using a hot pressure swing reactor. Energy Environ. Sci. 2017, 10, 1652–1659. [Google Scholar] [CrossRef] [Green Version]
  12. Sartory, M.; Wallnöfer-Ogris, E.; Salman, P.; Fellinger, T.; Justl, M.; Trattner, A.; Klell, M. Theoretical and experimental analysis of an asymmetric high pressure PEM water electrolyser up to 155 bar. Int. J. Hydrogen Energy 2017, 42, 30493–30508. [Google Scholar] [CrossRef]
  13. Trinke, P.; Haug, P.; Brauns, J.; Bensmann, B.; Hanke-Rauschenbach, R.; Turek, T. Hydrogen crossover in PEM and alkaline water electrolysis: Mechanisms, direct comparison and mitigation strategies. J. Electrochem. Soc. 2018, 165, F502–F513. [Google Scholar] [CrossRef]
  14. Grigoriev, S.A.; Porembskiy, V.I.; Korobtsev, S.V.; Fateev, V.N.; Auprêtre, F.; Millet, P. High-pressure PEM water electrolysis and corresponding safety issues. Int. J. Hydrogen Energy 2011, 36, 2721–2728. [Google Scholar] [CrossRef]
  15. Gubler, L. Polymer Design Strategies for Radiation-Grafted Fuel Cell Membranes. Adv. Energy Mater. 2014, 4, 1300827. [Google Scholar] [CrossRef]
  16. Klose, C. Membrane Interlayer with Pt Recombination Particles for Reduction of the Anodic Hydrogen Content in PEM Water Electrolysis. J. Electrochem. Soc. 2018, 165, F1271–F1276. [Google Scholar] [CrossRef]
  17. Schalenbach, M.; Carmo, M.; Fritz, D.L.; Mergel, J.; Stolten, D. Pressurized PEM water electrolysis: Efficiency and gas crossover. Int. J. Hydrogen Energy 2013, 38, 14921–14933. [Google Scholar] [CrossRef]
  18. Schalenbach, M. Corrigendum to “Pressurized PEM water electrolysis: Efficiency and gas crossover”. Int. J. Hydrogen Energy 2016, 41, 729–732. [Google Scholar] [CrossRef]
  19. Tjarks, G.; Gibelhaus, A.; Lanzerath, F.; Müller, M.; Bardow, A.; Stolten, D. Energetically-optimal PEM electrolyzer pressure in power-to-gas plants. Appl. Energy 2018, 218, 192–198. [Google Scholar] [CrossRef]
  20. Bensmann, B.; Hanke-Rauschenbach, R.; Peña Arias, I.K.; Sundmacher, K. Energetic evaluation of high pressure PEM electrolyzer systems for intermediate storage of renewable energies. Electrochim. Acta 2013, 110, 570–580. [Google Scholar] [CrossRef]
  21. Suermann, M.; Kiupel, T.; Schmidt, T.J.; Buchi, F.N. Electrochemical Hydrogen Compression: Efficient Pressurization Concept Derived from an Energetic Evaluation. J. Electrochem. Soc. 2017, 164, F1187–F1195. [Google Scholar] [CrossRef]
  22. Marangio, F.; Santarelli, M.; Calì, M. Theoretical model and experimental analysis of a high pressure PEM water electrolyser for hydrogen production. Int. J. Hydrogen Energy 2009, 34, 1143–1158. [Google Scholar] [CrossRef]
  23. García-Valverde, R.; Espinosa, N.; Urbina, A. Simple PEM water electrolyser model and experimental validation. Int. J. Hydrogen Energy 2012, 37, 1927–1938. [Google Scholar] [CrossRef]
  24. Selamet, Ö.F.; Acar, M.C.; Mat, M.D.; Kaplan, Y. Effects of operating parameters on the performance of a high-pressure proton exchange membrane electrolyzer. Int. J. Energy Res. 2013, 37, 457–467. [Google Scholar] [CrossRef]
  25. Awasthi, A.; Scott, K.; Basu, S. Dynamic modeling and simulation of a proton exchange membrane electrolyzer for hydrogen production. Int. J. Hydrogen Energy 2011, 36, 14779–14786. [Google Scholar] [CrossRef]
  26. Santarelli, M.; Medina, P.; Calì, M. Fitting regression model and experimental validation for a high-pressure PEM electrolyzer. Int. J. Hydrogen Energy 2009, 34, 2519–2530. [Google Scholar] [CrossRef]
  27. Kurzweil, P. Brennstoffzellentechnik: Grundlagen, Komponenten, Systeme, Anwendungen, 2nd ed.; Springer Vieweg: Wiesbaden, Germany, 2013. [Google Scholar]
  28. Tjarks, G.; Stolten, D.; Weßling, M. PEM-Elektrolyse-Systeme zur Anwendung in Power-to-Gas Anlagen; Forschungszentrum, Zentralbibliothek: Jülich, Germany, 2017. [Google Scholar]
  29. Stähler, M.; Stähler, A.; Scheepers, F.; Carmo, M.; Stolten, D. A completely slot die coated membrane electrode assembly. Int. J. Hydrogen Energy 2019, 44, 7053–7058. [Google Scholar] [CrossRef]
  30. Harrison, K.W.; Hernández-Pacheco, E.; Mann, M.; Salehfar, H. Semiempirical Model for Determining PEM Electrolyzer Stack Characteristics. J. Electrochem. Energy Convers. Storage 2005, 3, 220–223. [Google Scholar] [CrossRef]
  31. Barbir, F. Chapter Three—Fuel Cell Electrochemistry. In PEM Fuel Cells, 2nd ed.; Barbir, F., Ed.; Academic Press: Boston, MA, USA, 2013; pp. 33–72. [Google Scholar]
  32. Grigoriev, S.A.; Millet, P.; Korobtsev, S.V.; Porembskiy, V.I.; Pepic, M.; Etievant, C.; Puyenchet, C.; Fateev, V.N. Hydrogen safety aspects related to high-pressure polymer electrolyte membrane water electrolysis. Int. J. Hydrogen Energy 2009, 34, 5986–5991. [Google Scholar] [CrossRef]
  33. Bernt, M.; Siebel, A.; Gasteiger, H.A. Analysis of Voltage Losses in PEM Water Electrolyzers with Low Platinum Group Metal Loadings. J. Electrochem. Soc. 2018, 165, F305–F314. [Google Scholar] [CrossRef]
  34. Yadav, R. Analysis of EIS Technique and Nafion 117 Conductivity as a Function of Temperature and Relative Humidity. J. Electrochem. Soc. 2012, 159, B340–B346. [Google Scholar] [CrossRef]
  35. Trinke, P.; Bensmann, B.; Reichstein, S.; Hanke-Rauschenbach, R.; Sundmacher, K. Hydrogen Permeation in PEM Electrolyzer Cells Operated at Asymmetric Pressure Conditions. J. Electrochem. Soc. 2016, 163, F3164–F3170. [Google Scholar] [CrossRef]
  36. Sakai, T.; Takenaka, H.; Wakabayashi, N.; Kawami, Y.; Torikai, E. Gas Permeation Properties of Solid Polymer Electrolyte (SPE) Membranes. J. Electrochem. Soc. 1985, 132, 1328–1332. [Google Scholar] [CrossRef]
  37. Matsushima, H.; Kiuchi, D.; Fukunaka, Y. Measurement of dissolved hydrogen supersaturation during water electrolysis in a magnetic field. Electrochim. Acta 2009, 54, 5858–5862. [Google Scholar] [CrossRef]
  38. Stähler, M.; Stähler, A.; Scheepers, F.; Lehnert, W.; Stolten, D. Impact of porous transport layer compression on hydrogen permeation in PEM Water electrolysis. Int. J. Hydrogen Energy 2019, 45, 4008–4014. [Google Scholar] [CrossRef]
  39. Albert, A.; Barnett, A.O.; Thomassen, M.S.; Schmidt, T.J.; Gubler, L. Radiation-Grafted Polymer Electrolyte Membranes for Water Electrolysis Cells: Evaluation of Key Membrane Properties. ACS Appl. Mater. Interfaces 2015, 7, 22203–22212. [Google Scholar] [CrossRef] [PubMed]
  40. Trinke, P.; Bensmann, B.; Hanke-Rauschenbach, R. Current density effect on hydrogen permeation in PEM water electrolyzers. Int. J. Hydrogen Energy 2017, 42, 14355–14366. [Google Scholar] [CrossRef]
  41. Sethuraman, V.A. Hydrogen peroxide formation rates in a PEMFC anode and cathode: Effect of humidity and temperature. J. Electrochem. Soc. 2008, 155, B50–B57. [Google Scholar] [CrossRef] [Green Version]
  42. Tzimas, E.; Filiou, C.; Peteves, S.; Veyret, J. Hydrogen Storage: State-of-the-Art and Future Perspective. In EU Commission, JRC Petten, EUR 20995EN; European Commission (Directorate General Joint Research Ceneter (DG JRC)): Petten, The Netherlands, 2003. [Google Scholar]
  43. Lemmon, E.W.; Huber, M.L.; Leachman, J.W. Revised Standardized Equation for Hydrogen Gas Densities for Fuel Consumption Applications. J. Res. Natl. Inst. Stand. Technol. 2008, 113, 341–350. [Google Scholar] [CrossRef]
  44. Alduchov, O.A.; Eskridge, R.E. Improved Magnus Form Approximation of Saturation Vapor Pressure. J. Appl. Meteorol. 1996, 35, 601–609. [Google Scholar] [CrossRef]
  45. Shi, S.; Weber, A.Z.; Kusoglu, A. Structure/property relationship of Nafion XL composite membranes. J. Membr. Sci. 2016, 516, 123–134. [Google Scholar] [CrossRef] [Green Version]
  46. Deffenbaugh, D.M.; Brun, K.; Harris, R.E.; Harrell, J.P.; Mckee, R.J.; Moore, J.J.; Siebenaler, S.P.; Svedeman, S.J. Advanced Reciprocating Compression Technology (ARCT); Southwest Research Institute: San Antonio, TX, USA, 2005. [Google Scholar]
  47. Dehnen, M. Hofer Diaphragm Compressors; Hofer Hochdrucktechnik GmbH: Mülheim an der Ruhr, Germany, 2007. [Google Scholar]
  48. Witkowski, A.; Rusin, A.; Majkut, M.; Stolecka, K. Comprehensive analysis of hydrogen compression and pipeline transportation from thermodynamics and safety aspects. Energy 2017, 141, 2508–2518. [Google Scholar] [CrossRef]
  49. Ayers, K.; Danilovic, N.; Ouimet, R.; Carmo, M.; Pivovar, B.; Bornstein, M. Perspectives on Low-Temperature Electrolysis and Potential for Renewable Hydrogen at Scale. Annu. Rev. Chem. Biomol. Eng. 2019, 10, 219–239. [Google Scholar] [CrossRef] [PubMed]
  50. Esposito, D.V. Membraneless electrolyzers for low-cost hydrogen production in a renewable energy future. Joule 2017, 1, 651–658. [Google Scholar] [CrossRef] [Green Version]
  51. Schmidt, O.; Gambhir, A.; Staffell, I.; Hawkes, A.; Nelson, J.; Few, S. Future cost and performance of water electrolysis: An expert elicitation study. Int. J. Hydrogen Energy 2017, 42, 30470–30492. [Google Scholar] [CrossRef]
  52. Smolinka, T.; Wiebe, N.; Sterchele, P.; Palzer, A. Study IndWEDe—Brief Overview; Fraunhofer Institute for Manufacturing Engineering and Automation IPA: Berlin, Germany, 2018. [Google Scholar]
  53. Bertuccioli, L.; Chan, A.; Hart, D.; Lehner, F.; Madden, B.; Standen, E. Study on Development of Water Electrolysis in the EU; e4tech: Lausanne, Switzerland, 2014. [Google Scholar]
  54. Mayyas, A.T.; Ruth, M.F.; Pivovar, B.S.; Bender, G.; Wipke, K.B. Manufacturing Cost Analysis for Proton Exchange Membrane Water Electrolyzers; National Renewable Energy Lab. (NREL): Golden, CO, USA, 2019.
  55. Feng, Q.; Yuan, X.Z.; Liu, G.; Wei, B.; Zhang, Z.; Li, H.; Wang, H. A review of proton exchange membrane water electrolysis on degradation mechanisms and mitigation strategies. J. Power Sources 2017, 366, 33–55. [Google Scholar] [CrossRef]
Figure 1. Schematic structure of an electrolysis cell and system including the fluid flows. The indices symbolize flows into (in) the cell, off the cell (off), permeation across the membrane (x), cathode (cat), anode (an), gas (g), and liquid (l).
Energies 13 00612 g001
Figure 2. Left: The graph shows the cell voltage as a function of the current density. The areas symbolize incoming and outgoing power densities. The circle marks the operation point that is exemplarily set at 1.82 V. The green area, including area II, is the power density that is converted into chemical energy (hydrogen). For its generation, an additional power density is required that is supplied as electric energy and heat (area I). At 1.48 V, the heat released by the operation equals the required heat of combustion of the chemical reaction. In this example, the heat required to saturate the product gases with water is reached at 1.78 V, which is symbolized by a dashed line. While the cell voltage of 1.82 V is above this value, no external heat must be supplied; instead, cooling is needed to remove heat from the system. Area II marks the power density fraction that is lost due to permeation of product gases across the membrane, thereby reducing the amount of hydrogen originally generated. Right: The chemical energy of the produced hydrogen is given as the green area. Area III marks the required amount of energy for the compression of the gas.
Energies 13 00612 g002
Figure 3. Top: Cell voltage as a function of current density of the real data (orange dots) and the fit (black). Bottom: Hydrogen concentration in oxygen (line) and hydrogen crossover current density (dashed) as a function of current density. The real data are shown as orange marks.
Energies 13 00612 g003
Figure 4. Maximum total system efficiency of the polymer electrolyte membrane (PEM) electrolyzer (Equation (7)) as a function of current density determined by evaluating the optimal membrane thickness and optimal cathode pressure when no restrictions are assumed.
Energies 13 00612 g004
Figure 5. The contribution of the hydrogen production, permeation, and permeation efficiency to the total efficiency is illustrated as a function of current density for the ideal electrolyzer (A) and for a voltage-limited N211-based system (B). Additionally, the hydrogen production efficiency is separated into electricity (Equation (3)) and heat (Equation (4)). The production efficiency curve symbolizes the minimum of heat or electrical efficiency that can be achieved.
Energies 13 00612 g005
Figure 6. Top: Maximum total efficiency of the PEM electrolyzer as a function of current density by evaluating the optimal cathode pressure for commercial membranes: N211 (red), N212 (orange), N115 (green), N117 (blue). Bottom: Polarization curve and hydrogen in oxygen concentration at the anode.
Energies 13 00612 g006
Figure 7. Top: Total efficiency and cathode pressure as a function of current density. Bottom: Polarization curve and hydrogen concentration in oxygen as a function of current density. The different pressures are colorized: 200 bar (red), 72.7 bar (orange), 26.5 bar (green), pressure optimization (blue). The curves refer to the use of an N117 membrane.
Energies 13 00612 g007
Figure 8. Top: Total efficiency and cathode pressure as a function of current density. Bottom: Polarization curve and hydrogen concentration in oxygen as a function of current density. The different pressures are colorized: 26.5 bar (green), 9.6 bar (orange), 3.5 bar (red), pressure optimization (blue). The curves refer to the use of an N212 membrane.
Energies 13 00612 g008
Figure 9. Top: Total efficiency and cathode pressure as a function of current density. Bottom: Polarization curve and hydrogen concentration in oxygen as a function of current density. The colors symbolize the pressure-optimized operation of an N212-based system (orange) with three stages and an N117-based system with two stages (blue).
Energies 13 00612 g009
Table 1. Parameter values used for this work.
ParameterValueUnit
p H 2 O 47,948Pa
Δ H v a p 41,572J mol−1
P H 2 80 ° C 5.31 10 16 mol (cm s Pa)−1
σ m 0.137S cm1
δ m 1.15-
c c 2.75-
Tin300K
κ 1.4-
ηc0.825-
p H 2 o u t 200bar
Table 2. Parameter values evaluated for this work.
ParameterValueUnit
α0.43-
j0 8 10 6 A cm−2
ax 1.2 10 5 cm
R027mΩ cm2

