Abstract
Large-scale implementation of (plant) microbial fuel cells is greatly limited by high electrode costs. In this work, the potential of exploiting electrochemically active self-assembled biofilms in fabricating three-dimensional bioelectrodes for (plant) microbial fuel cells with minimum use of electrode materials was studied. Three-dimensional robust bioanodes were successfully developed with inexpensive polyurethane foams (PU) and activated carbon (AC). The PU/AC electrode bases were fabricated via a water-based sorption of AC particles on the surface of the PU cubes. The electrical current was enhanced by growth of bacteria on the PU/AC bioanode while sole current collectors produced minor current. Growth and electrochemical activity of the biofilm were shown with SEM imaging and DNA sequencing of the microbial community. The electric conductivity of the PU/AC electrode enhanced over time during bioanode development. The maximum current and power density of an acetate fed MFC reached 3 mA·m−2 projected surface area of anode compartment and 22 mW·m−3 anode compartment. The field test of the Plant-MFC reached a maximum performance of 0.9 mW·m−2 plant growth area (PGA) at a current density of 5.6 mA·m−2 PGA. A paddy field test showed that the PU/AC electrode was suitable as an anode material in combination with a graphite felt cathode. Finally, this study offers insights on the role of electrochemically active biofilms as natural enhancers of the conductivity of electrodes and as transformers of inert low-cost electrode materials into living electron acceptors.
1. Introduction
In a bioelectrochemical system (BES) application such as a (Plant) Microbial Fuel Cell, an electrode is a crucial part because of its function to accept released electrons from electrochemically active bacteria in the anode and to transfer the electrons to the final electron acceptor in the cathode [1,2]. Especially in plant microbial fuel cells with its relative low current density, large amounts of electrodes are required. One of the most utilized electrodes is graphite felt [3,4,5,6,7,8,9,10,11,12,13,14,15,16]. So far, the best two week performance of a plant microbial fuel cell (Plant-MFC) utilizing graphite felt both for the anode and the cathode, achieved a power output of 240 mW·m−2 [13]. Although graphite felt has shown itself to be a good electrode, its price (around €62 per m2) has become an inhibiting factor in real applications [17]. For instance, the electrode cost (with graphite felt) for a tubular Plant-MFC is between 30 and 78% of the total cost [17]. Therefore, it is necessary to find an alternative cheaper electrode ideally without compromising on the performance.
An innovative alternative to reducing the electrode cost is using microorganisms to fabricate bioelectrodes [13,18,19,20]. These bioelectrodes consist of the biocatalyst of electrochemically active bacteria, which grow in a biofilm that by itself can be highly conductive and act as an electrode itself [21]. Long term performance of a microbial colonization on the electrode surface structure resulted in a high current density [22,23]. Several studies show, for instance Xie et al. [23], that a conductive and macro-porous three-dimensional scaffold is the most suitable material for such a bioelectrode. In this sense, a wide variety of materials has been studied as three-dimensional bioanodes, which focus both on attaining high performing bioelectrodes and on practically implementable bioanodes as well as cost reduction [19,24,25]. Current preparation techniques on three-dimensional bioanodes include the use of advanced materials and fabrication methods such as electro-polymerization of pyrrole and carbonized sponges coated with polyaniline [22,26,27].
Desirable features to design a scalable bioanode are cost-effectiveness, high power output, good biocompatibility to support microbial growth and a bioanode that can be scaled-up [22]. Based on these features, this study considers reticulated polyurethane (PU) foam as the core three-dimensional structure using activated carbon (AC) as the coating material for a practical bioanode. On the one hand, PU foam facilitates an open structure to support internal and external biofilm growth, bacterial accessibility and efficient transport of substrates [28,29]. On the other hand, AC confers a high surface area, hydrophilicity and conductivity to the surface of the PU foams [28,30,31]. Research showed that AC was a suitable material for bioanode growth [32,33,34]. Foremost, both materials PU and AC have a lower cost (<€1 per kg) than most common electrode materials, such as graphite felt, graphene cloth, graphite foam and carbon nanotubes foam [35,36].
The use of PU foams fabricated with conductive materials as electrode materials has been successfully described before [22,28,37]. However, these electrodes were fabricated using additional high-energy input processes (e.g., carbonisation of the PU [28]), expensive material (e.g., carbon nano tubes [29,38]), and complex method (e.g., sonication and polymeration of polypyrrole [22]). To reduce the investment cost of materials we investigated the exploitation of the electrochemically active and conductive biofilm as much as possible while using PU as carrier materials and just a thin/minimum layer of conductive activated carbon materials. Therefore, the objective of this study was to validate whether the polyurethane foams coated with the activated carbon could perform as bioanodes for harvesting electric current in microbial fuel cells (MFCs). Hence, the role of the biofilm on the performance and limitations of the PU/AC bioanodes were investigated. Furthermore, the field test result of the PU/AC electrode in tubular Plant-MFCs in a paddy field is also presented.
2. Materials and Methods
2.1. Preparation of PU/AC Composites
Composites consisted of reticulated PU cubic foams (Recticel, Ltd., Brussels, Belgium) and were coated with milled AC (Norit PK 1-3, Cabot Norit Nederland BV, Amersfoort, The Netherlands). All PU foams had dimensions of 1.5 cm × 1.5 cm × 1.5 cm, a density of 30.4 kg·m−3 and a porosity of 20 pores per inch (PPI) which was approximately equal to a pore diameter of 13 μm. The AC bulk density was 240–400 kg·m−3 [39]. First, the granular AC was milled into fine particles with a miller machine (SM2000, Retsch GmbH, Haan, Germany). The particle size distribution of the activated carbon (D10 = 2.9 ± 1.25 µm, D50 = 4.5 ± 1.13 µm, D90 = 8.6 ± 1.01 µm) was measured with the Laser Diffraction Technique (LA-960 HORIBA Scientific, HORIBA Instrument, INC, Irvine, CA, USA). PU foams were washed with demineralized water and dried at 105 °C overnight. Then, a coating solution was prepared by mixing 4 g·L−1 of AC with 400 mL of demineralized water in a beaker of 600 mL under magnetic stirring. The stirring speed and water temperature were controlled at 500 to 600 rpm and 30 °C, respectively. After that, PU foams were coated in batches of four sponges by dipping them into the coating solution for one hour at constant stirring and 30 °C temperature in a climatized room. Foams were carefully dropped in sequence and kept in the middle of the vortex. Afterwards, the PU/AC composites were gently rinsed with demineralized water and dried at 105 °C overnight. Loads of activated carbon attached to the PU foams were calculated via gravimetric mass balances as given in Equation (1).
where WAC was the % of AC attached to foams, Wf was the final weight after treatment and Wi was the initial weight of the plain foams [37].
2.2. Microbial Fuel Cells (MFCs) Setup
The experimental setup consisted of six flat-plate MFCs similar to earlier work [40]. Each MFC had two single flow channels (one for the cathode and one for the anode) separated by a cation exchange membrane (Fumasep FKD-PK-75, Fumatech, Braunschweig, Germany). Each channel had a projected surface area of 22 cm2 and a volume of 33 mL. The 33 mL anode volume was filled with or without three-dimensional electrode material as described in Table 1. The cathode consisted of a flat graphite-Al2O3 blasted plate (Müller & Rössner GmbH & Co., Troisdorf, Germany) and four graphite felt layers with a thickness of 3 mm (FMI Composites Ltd., Galashiels, Scotland) inside the channel to increase the surface area. The anode integrated the anode material and two titanium current collectors with a length of 11 cm (No. 299, D = 1 mm, Ti-gr1) separated by a distance of 5.5 cm (Figure 1). Of the six reactors (Table 1), in three of them, the anode material was comprised of eleven cube foams with one coating of activated carbon (PU/AC composites). One of the MFCs with PU/AC composites (PU/AC Inoculum) was used to grow the bioanodes and used the anolyte as inoculum for the other two (PU/AC I and PU/AC II). One MFC had as the anode material a graphite felt (KFA-5 mm, SGL Carbon GmbH, Bonn, Germany) layer to confirm that the used medium and inoculum in all MFCs was not limiting the development of the bioanodes. The last two MFCs (Ti-CC I and Ti-CC II) were deprived of anodes and used only Ti wire as current collectors that possibly acted as an anode. These two MFCs were also inoculated with the same inocula and recirculated with the same growth medium as used in other MFCs to make it a proper control.

Table 1.
MFC reactors name with their anode materials and functions.
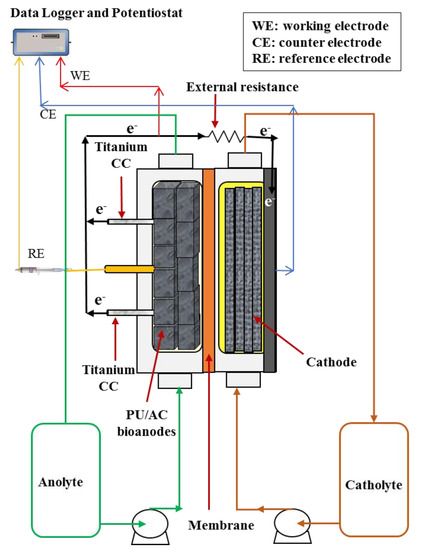
Figure 1.
Schematic illustration of the experimental set-up (MFC reactor). The number of PU/AC composites in the anode is 11 cubes. All PU/AC cubes were physically connected.
2.3. MFCs Operation
MFCs were operated under recirculation and anaerobic conditions within an acclimatized room at 30 °C. The flow rates were 3.5 mL·s−1 for the anolytes and 3.3 mL·s−1 for the catholytes. The anolytes had 0.020 M sodium acetate, 10 g·L−1 sodium 2-bromoethane sulfonate and macro and micronutrients as described earlier (Tables S1 and S2) [18]. Anolyte compartments were equipped with Ag/AgCl, 3M KCl reference electrodes (QIS, Oosterhout, The Netherlands). In the catholytes, 0.05 M potassium ferricyanide was chemically reduced in 0.05 M phosphate buffer at pH 7. On day one, both catholytes and anolytes were flushed with N2 gas (purity > 99.9%) for one hour to remove oxygen. This was done to prevent oxygen diffusion from the cathode to the anode as oxygen may hamper the development of the bioanode [4]. Then, anolytes were inoculated with 11% v/v of mixed culture bacteria grown on acetate from previous experiments [13,32]. Acetate (2 g·L−1 sodium acetate) was further regularly (about every 2–4 days) injected into the anolyte to prevent substrate depletion. MFCs were operated with an external resistance of 50 kΩ. The 50 kΩ external load was chosen so it was higher than the earlier used 1 kΩ by a similar MFC with a plain graphite felt electrode [18]. With the newly not optimised electrodes, a lower current may have occurred. Therefore, with this possible lower current a higher external load would be required to monitor a technical sufficient cell potential by the Fieldpoint modules. The pH of anolytes was manually controlled at 7 (±0.5) with anaerobic NaOH and HCl solutions to provide favourable conditions for electrochemically active bacteria [7]. Catholytes were replenished with fresh catholytes after cell voltages had decreased more than 150 mV. Anolytes were protected from the light as much as possible with aluminium foil to prevent photosynthetic microorganisms from growing. To understand whether the current collectors played a role in the current production or not, the actual current collectors were removed and replaced by clean titanium wires after successful development of bioanodes.
2.4. Measurements
2.4.1. Electrochemical Measurements
For all MFCs, anode and cathode potential were measured versus the reference electrodes placed in the anode chamber. Potentials were collected every 600 s via Fieldpoint modules (National Instruments, Austin, TX, USA) connected to a computer with Labview Software (LabVIEW 2013, National Instruments, Austin, TX, USA). All the electrochemical experiments were carried out with a potentiostat (Iviumstat, Ivium Technologies, Eindhoven, The Netherlands). To know the maximum performance of the bioanodes, polarization curves were performed in situ with a three-electrode setup from a potential of −500 mV to 50 mV, in steps of 50 mV every 600 s [2]. In this setup, anodes were the working electrodes while the cathodes were the counter electrodes. The reference electrodes were located in the anode chamber. The cells were set to open cell for 30 min before the polarization curves. The average current measured for each anode potential in the last 60 s is shown in the results.
Furthermore, to support understanding in electron transfer, in situ and ex situ cyclic voltammetries (CVs) were done under anaerobic conditions as in previous MFC research [41,42]. The in situ CVs were done with a three-electrode setup (anodes were the working electrodes) from a potential of 50 mV to −400 mV and increased back to 50 mV at a scan rate of 1 mV·s−1 [43]. Three cycles were performed considering the last cycle as the result. The in situ measurements were performed in MFCs after the start-up phase (t = 3 days), the replacement of current collectors (on days 20) and the replacement of old anolytes for fresh ones (t = 25 days). These fresh anolytes were free of inoculum and acetate and were flushed for one hour with pure N2. In addition, the ex situ CVs were performed in the replaced anolytes with a three-electrode setup using an Ag/AgCl, 3 M KCl reference electrode and two titanium wires integrating a graphite felt-layer of 1.5 × 2 cm as the counter and working electrodes (Figure S1). The counter and working electrodes were placed in the anolyte under continuous N2 flushing; the electrodes were just in contact with the anolyte. The set range for ex situ CVs was from 50 mV to −400 mV at a scan rate of 5 mV·s−1. Both scan rates, 1 mV·s−1 and 5 mV·s−1, were not destructive for the biofilm according to the literature [2,44].
Moreover, ohmic resistances of bioanodes were measured in situ over time and ex situ at the end of experiments via electrochemical impedance spectrometry (EIS) (Figure S2). All EIS were carried out with a two-electrode setup at an applied cell voltage of 0 V, an amplitude of 0.01 V and 26 frequencies in the range of 10−4 to 106 Hz [2,45]. Via this two-probes alternating current (AC)-conductivity method the ohmic resistance was taken from the x-axis intercept of the Nyquist plot as reported before [7]. Particularly for the ex situ measurements, a device with gold-plated electrodes was constructed for measuring the PU/AC bioanodes (Figure 2). The electrodes had a gold layer thickness of 3 mm (Haveman Edelmetaal, Voorburg, The Netherlands). A single PU-cube (dimensions as earlier mentioned with 1.5 by 1.5 by 1.5 cm) was fixed between the electrodes to measure resistance; the distance between the electrodes was fixed at 1.2 cm and the cube pressed with about 20% volume reduction. The measurements were under saturated conditions with acetate-free anolyte previously flushed with N2 for one hour. To achieve saturated conditions, 1.5 mL of anolyte media was injected with a syringe into the centre of the sponge and from the bottom towards the top. Between measurements, the device and electrodes were cleaned with tissues and pure ethanol. Uncoated PU foams were measured with the same technique to assess the influence of the biofilm on the conductivity of the composites. Particularly, PU/AC/BIO I had one less measurement than PU/AC/BIO II because one sample from PU/AC/BIO I went to microbial analysis.
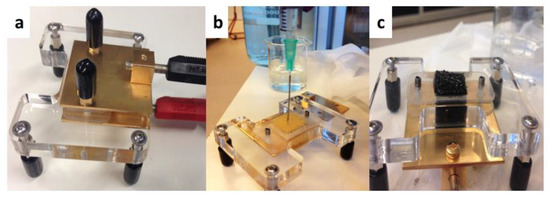
Figure 2.
(a) Ex situ conductivity device with two electrodes. (b) Overview of anolyte media injection to achieve saturated conditions. (c) Visual example of saturated conditions for ex situ electrochemical impedance spectrometry (EIS) measurement.
2.4.2. Physicochemical and Reactants Measurements
The pH was manually measured with a pH meter (MeterLab® PHM210, Radiometer Analytical SAS, Villeurbanne Cedex, France) while the conductivity of anolytes was measured with a multi-parameter meter (HQ440D, HACH, Loveland, CO, USA). Acetate, bicarbonate, ferricyanide and ferrocyanide concentrations were measured to evaluate the performance of the bioanodes [2,46]. Acetate concentrations were measured in a gas chromatographer (7890B GC Systems, Agilent Technologies, Santa Clara, CA, USA) as described in previous research [18]. Bicarbonate concentration in anolytes was measured directly in a total organic carbon analyser (TOC-LCPH E200, Shimadzu, Kyoto, Japan). Ferricyanide and ferrocyanide concentrations were determined as described by Skyllas-Kazacos et al. [47] via spectrophotometry at 260 nm and 420 nm (Infinite M200PRO, TECAN, Männedorf, Switzerland) with a cell of 10 mm (100-QS, Hellma Analytics, Müllheim, Germany) (Figure S3).
2.4.3. Microscopic and Microbial Analysis
At the end of experiments, MFCs were disassembled and bioanodes were put in a solution of 2.5% glutaraldehyde in phosphate buffer 0.1 M for scanning electrons microscopy (SEM) [48]. Subsequently, samples were rinsed three times in 0.1 M phosphate buffer pH = 7.2 and were post-fixed using 1% osmium tetroxide for 1 h. The samples were dehydrated in graded ethanol solutions in water—30%, 50%, 70%, 80%, 90%, 96%, 2 × 100% (for 10 min each). Then, samples were critical point dried (CPD) with carbon dioxide in a Leica EM CPD300 (Leica Microsystems GmbH, Wetzlar, Germany). Afterwards, samples were mounted on SEM stubs by carbon adhesive tabs (EMS, Washington, DC, USA) and subsequently coated with 12 nm Tungsten (Leica, MED 020, Wetzlar, Germany). Samples were analysed at 2 kV, 6 pA, in a field emission scanning electron microscope (Magellan 400, FEI Company, Eindhoven, The Netherlands).
Samples (anolyte and electrode) for microbial analysis were taken on day 28 (from PU/AC I) and day 70 (from PU/AC Inoculum). The samples were immediately stored in a −80 °C freezer after collection until the DNA sequencing was conducted. DNA extraction and sequencing steps were performed similar to the previous work [33,49]. DNA was extracted from the samples using the PowerSoil® DNA isolation kit according to their instruction manual. The extracted DNA was quantified using Qubit® and diluted to 5 ng·μL−1 the final template DNA concentration for PCRs. The V3–V4 regions of 16 s rDNA from the isolated DNA was amplified using the primer sets by Takahashi et al., which allowed simultaneous amplification of bacterial and archean 16 s rDNA. The illumina library generation methods were subsequently used to generate DNA sequence data [50]. Furthermore, a statistical analysis was done to pick the operational taxonomic unit (OTU) using the SILVA version 128 16S reference database and uclust [51,52]. With the same SILVA reference database, the ribosomal database project (RDP) classifier (version 2.2) was trained and used to classify the OTUs [53]. QIIME software version 1.9.1 was used to perform taxonomic analysis [54].
2.5. Calculations
The Coulombic efficiency (CE) was calculated from Equation (2):
where Imeasured is the current being produced and Iavailable is the maximum current theoretically possible given the consumed acetate [2,55].
The total Ohmic resistance of the bioanode electrodes was calculated based on earlier research [56] and in situ Ohmic resistance measurements over time (Table S3). Therefore, as in a circuit in series, the total resistance (ROhmic-bioanode) was the sum of the ohmic resistances involved (ROhmic-bioanode = RS + RBIO + RCR + RPU/AC). Thus, the studied resistances were the anolyte resistance (RS), the biofilm resistance (RBIO), the contact resistance between PU/AC electrodes and titanium current collectors (RCR) and the resistance of electrodes without biofilm (RPU/AC). Moreover, it was assumed that the RCR was equal to 1 Ω as earlier indicated by Gago et al. [57] and that the RS was the inverse of the anolyte conductivity multiplied by the distance between current collectors. For the RPU/AC, it was the initial ohmic resistance that was deducted from the measured in situ Rohmic bioanode before inoculation of anolytes. The RBIO was supposed to be zero at the start and later on deducted from the difference between RPU/AC and subsequent ohmic resistances after inoculation.
2.6. Field Test
A similar PU/AC electrode was tested in a paddy field in West Kalimantan, Indonesia. Two tubular plant microbial fuel cells (Plant-MFC) similar to previously used in the paddy field experiment but with a length of 50 cm were prepared [58]. A 10 L bucket filled with 5 L water and 100 g of activated carbon was used to prepare this electrode at 30 °C. Then the PU sheet (Medium Filter Foam 50 × 50 × 2 cm, Vijver Techniek (VT), Enschede, The Netherlands) was submerged in the bucket and mixed for 20 min with a mixer (Heidolph Type RZR1, Heidolph Instruments GmbH&CO.KG, Schwabach, Germany). In the first tubular Plant-MFCs (Figure 3), both the anode and cathode utilized the PU/AC electrode. While in the other one, the PU/AC was only utilized as the anode while the cathode still used graphite felt. Both tubular Plant-MFCs were installed as described in earlier research and operated at 1000 Ω external load [58]. The 1000 Ω external load was chosen so it had the same external resistance as the similar tested tubular Plant-MFC made from graphite felt electrodes [58]. Anode potential and cathode potential were measured against Ag/AgCl reference electrode and the potential data were logged with a voltage sensor connected to a LoRa network as described in an earlier publication [58]. Current density and power density were normalized to plant growth area (PGA = 0.02925 m2) as described earlier [58].
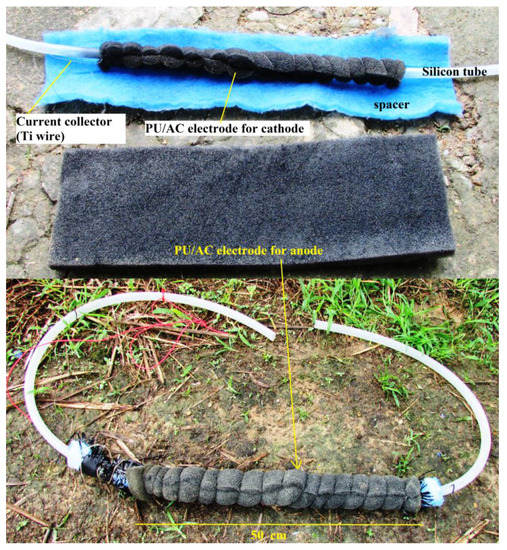
Figure 3.
Materials and completely constructed tubular Plant-MFC with PU/AC electrode.
3. Results and Discussion
3.1. A Rough Surface of Activated Carbon was Created on the Carbon-Polyurethane by a Simple Water-Based Dipping Method
In this study, a simple electrode made of activated carbon deposited on the surface of a reticulated polyurethane cube was successfully developed (Figure 4). Results showed that on average 3.3 mg/PU cube (~1 kg·m−3) of AC appeared to be adsorbed on the surface of the polyurethane cube. The activated carbon was stuck on the polyurethane surface due to the water absorption capacity of the PU foams (earlier described by [59,60]) and the high adsorption capacity of the AC particles [61] at the provided 30 °C temperature and mixing. The same procedure at room temperature resulted in less adsorption and was therefore not investigated. There was a clear difference between the uncoated and coated PU cube (Figure 4d,e). In SEM images one can see that the AC-coating created a surface no longer clean and flat but a rough surface with deposits forming crevices of different micro-sizes. Dry weight measurements confirmed that 3.3 mg per cubes of AC were deposited. Based on the total surface area available and considering an even distribution, the AC layer was estimated to be on average between 2.5 and 4 μm (typical specific surface area of 20 PPI (pore per inch) polyurethane is 984 m2·m−3 [62]). Furthermore, the remaining macro-porosity of the reticulated PU cube (Figure 4f) could potentially help to achieve internal and external bacterial colonization as well as long-term performance as demonstrated by Huysman and Xie [37,63]. In this sense, it could prevent clogging, which has been a technical challenge for three-dimensional bioanodes with pores smaller than 10 μm after six months of operation in MFCs [64].
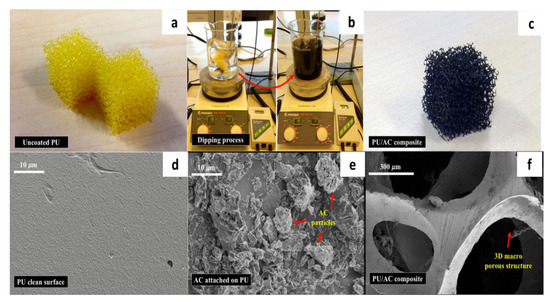
Figure 4.
(a) Uncoated clean polyurethane cube (1.5 × 1.5 × 1.5 cm); (b) water-based process to coat the PU foam with activated carbon (AC); (c) PU/AC composites after coating; (d) SEM image of the uncoated PU foam’s surface; (e) SEM Image of the PU/AC composite’s surface; (f) SEM image of the PU/AC composite’s macroscale structure.
Result showed that the activated carbon coating on the PU cube’s surface improved the PU conductivity, which was indicated by the decrease in the ohmic resistivity (Figure 5). A double coating (PU/AC/AC) with the same method on the previously coated PU/AC was not necessary because it hardly improved the conductivity (Figure 5). This might be due to the limited adsorption capacity of AC on the PU’s surface.
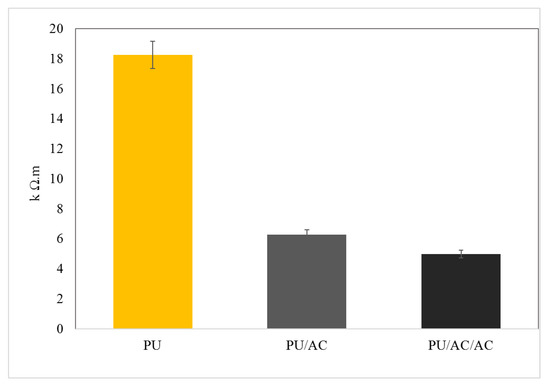
Figure 5.
Ex situ measurement of ohmic resistivity. (PU) polyurethane cube before being coated with activated carbon; (PU/AC) polyurethane cube after being coated with activated carbon; (PU/AC/AC) polyurethane cube double coated with activated carbon. For comparison, the ohmic resistivity of the graphite felt was based according to the specifications (exact method not provided) < 1 Ω.m (SGL Carbon).
3.2. PU/AC Works as a Bioanode and Likely Electrochemically Active Bacteria Grown on the PU/AC Improved its Conductivity
The newly developed PU/AC electrode acted as an electron acceptor in an MFC anode. The PU/AC electrode accepted electrons that were liberated by the EAB and transported them via the external load to the graphite felt cathode, thus electricity was generated. Figure 6 shows that the PU/AC MFCs delivered electricity when used as the anode while the blanks (only current collector/Ti wire) delivered no significant electricity. Both reactors, PU/AC I and PU/AC II, produced electricity in the same order with a maximum power density of 22 mW·m−3 and 10.4 mW·m−3, respectively. When the current collectors were removed (dashed red line) and replaced with a new one, the PU/AC MFCs delivered no current anymore. This could be explained by a disturbance of the connection of the current collector (CC) to the PU/AC. Possibly, there were also EAB grown in the biofilm that improved connectivity of the current collector to the PU/AC. Another explanation could be that the removed current collector contained the primary EAB; however, since the blank experiments (only current collectors) showed no significant electricity generation the role of the current collector as an electrode could be neglected. Figure 7a supports that the biofilm enabled the development of a PU/AC electron acceptor because a SEM image of the surface of a CC showed no bacterial attachment. The poor biofilm attachment to the current collectors demonstrated their unsuitability as an anode material possibly due to their reduced biocompatibility and micro and macro-porous features [23]. With this proof-of-principle of a PU/AC bioelectrode, the current and power density reached 3 mA·m−2 projected surface area of anode compartment and 22 mW·m−3 anode compartment, respectively. Columbic efficiency was low. The PU/AC I and PU/AC II only reached 0.07% and 0.02%, respectively. This low columbic efficiency could be caused by competing processes in the anode such as syntrophic acetate oxidizing microbes that convert acetate into CO2 and H2, which were flushed out via the anolyte bottle. However, improvement will be required to reach more significant current densities reached for the bioanode in the order of 25 kA·m−3 [65]. For example, by longer-term performance or use of different AC particle sizes, a better bioanode may be developed. Additionally, the resilience of the AC attached to the cubes should be monitored to reveal whether AC is lost over time or not. So far, there was no visible loss determined by the naked eye. Once the electrode is optimised a costs benchmark can be done by comparing with more often used electrodes like stainless steel or graphite felt in a similar designed comparable operated system [66,67,68].
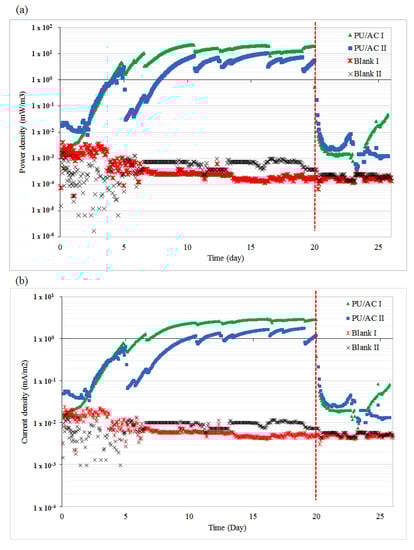
Figure 6.
PU/AC electrode is able to deliver electricity in an MFC. (a) Power densities obtained in PU/AC bioanodes and blanks; the anode compartment volume was used for normalization. (b) Current densities obtained overtime and cathode and anode potentials; the projected surface area of anode compartment was used for normalization. The dashed (red) lines indicate the replacement of current collectors on day 20.
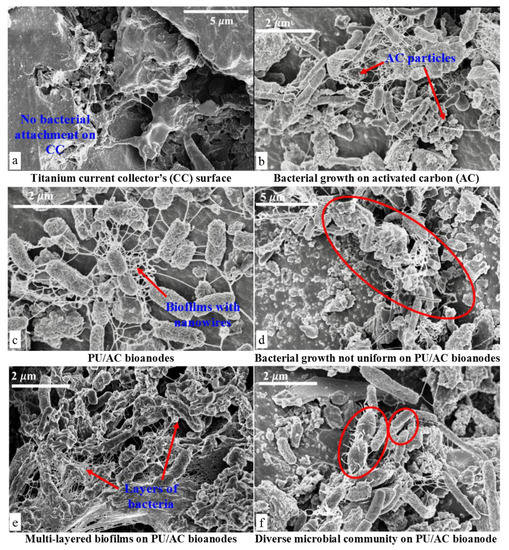
Figure 7.
SEM Images of electrochemically active bacteria (EAB). (a) Surface of the Titanium current collector after de-construction of MFCs. (b) Biofilm development on PU/AC composite showing a strong interaction between microbial nanowires and AC particles. (c) PU/AC composite with a self-assembled biofilm, showing nanowires (pili) development. (d) Biofilm growth was not uniformly developed on PU/AC composites. (e) Multi-layered biofilm formation and solid deposits after 70 days of operation in the reactor where anolyte was used as inoculum. (f) Diverse microbial community on the PU/AC bioanode.
Electrochemically active bacteria (EAB) seemingly did grow on the PU/AC electrode. The SEM images (Figure 7) indicated that PU/AC foams were colonized by microbial communities spread onto the surface and formed wire structures. These observed structures could be the remains of extracellular polymeric substances part of biofilms [44] and/or (nano) wires connections also called conductive pili [69], which act as long-distance electron transport carriers. The biofilms were transforming the inert PU/AC composites into living electron acceptor terminals. The growth of the biofilm suggested that the mechanism of electron transport was through these wires (Figure 7c shows a spider-web kind of wire and (f) shows short wires of microbes connecting to the electrode). However, these wires could (e.g., partly) also be exocellular polymer substances (EPS) of which biofilms are made of. However, direct electron transfer or indirect through mediators have been described for MFCs [25,70]. It is not possible to define the exact mechanism of electron transfer for a mixed culture with the current state of knowledge [25].
Results also showed that the EAB also increased the PU/AC conductivity. In the end of the experiment, ex situ ohmic resistivity was measured. Clean PU, Clean PU/AC (not used in the experiment) and PU/AC with biofilms (from MFC 1 and 2) were measured with a gold-plated device as described in the Materials and Methods section. Figure 8 clearly shows that PU/AC electrodes with a biofilm have lower (~4 times) ohmic resistivity compared to the clean PU/AC. This ohmic resistivity is still ~400 times higher than one of graphite felt (insert picture in Figure 8).
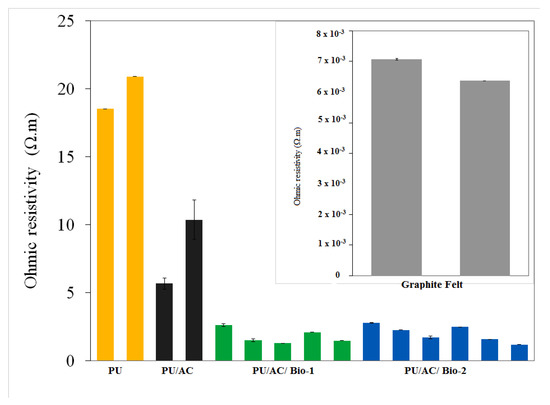
Figure 8.
Ex situ Ohmic resistivity measured in the end of the experiment. Insert is the measured ohmic resistivity (Ω.m) of graphite felt. The same colour bars are replicates. PU/AC/BIO I has one less measurement than PU/AC/BIO II because one sample from PU/AC/BIO I went to microbial analysis.
The conductivity of the biofilm developed on the PU/AC composites was on average ~1.5 mS·cm−1 (Table 2). Therefore, the increment of the conductivity of the PU/AC composites suggested that biofilms could modify the surface of the electrodes, which was of interest for MFCs development. For instance, this bio-conductivity may be of great importance for the minimum use of electrode material. In this sense, biofilms can be carefully developed for an optimal design of electrodes in which the biofilm enriches the conductivity [71]. This finding is consistent with other studies that have also indicated the bio-conductivity of biofilms. Table 2 shows that electrochemically active biofilms (EABFs) are conductive while different types of biofilm are less conductive or natural insulators [21,71,72]. Since the conductivity and current density of this PU/AC study was lower than other bioanodes, there is likely to be room for improvement. A longer-term operation or fed-batch adding of AC materials may enhance the performance due to more biofilm development or encapsulation of conductive AC properties. This potential improvement is supported by earlier work to enhance the performance of bioanodes for microbial electro synthesis, which showed that adding carbon nanotubes during operation did improve performance [73]. Furthermore, research on conductive biofilms has shown that the conductivity of a biofilm varies between microorganisms [21] and that higher conductivity is achieved in biofilms with nanowire structures in both biofilms with mixed and pure cultures [72]. Therefore, the observed nanowire structures (Figure 7) may have contributed to the bio-conductivity in the PU/AC/BIO.
Table 2.
Biofilm conductivities reported in the literature.
For the bioanolyte, its role was shown with cyclic voltammetries (Figure 9). The ex situ CVs done in the anolytes removed from MFCs gave interesting findings (Figure 9a,b). One can see that in all anolytes indistinctly of the anode material a redox peak was observed around −200 mV. Therefore, it is evident that the bacteria were producing exogenous mediators [41,70,77] as no peaks were observed in the fresh abiotic anolyte (Figure 9). The presence of exogenous mediators suggested that bacteria capable of electron transport through redox mediators were present in the bioanolyte.
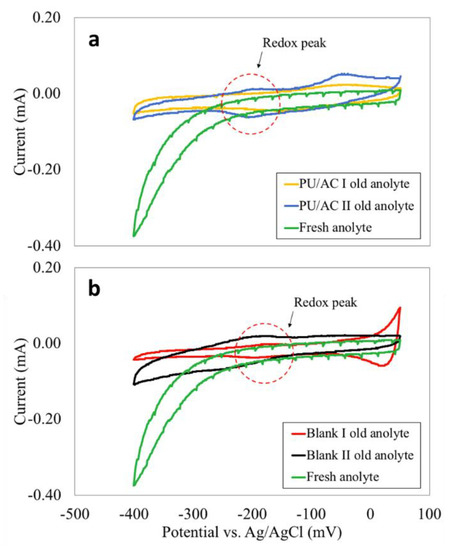
Figure 9.
(a) Ex situ CVs in old and fresh anolyte from PU/AC I and PU/AC II. (b) Ex-situ CVs in old and fresh anolyte from Blank I and Blank II.
3.3. Diverse Microbial Community both in the Bioanode and Bioanolyte Predominantly by Proteobacteria
The microbial analysis showed that there was no apparent difference between microbial communities in the anolyte and on the PU/AC electrode (sponges). Figure 10 shows the microbial community relative abundance (>1%) in samples. The microbial communities were predominantly by Proteobacteria phyla, followed by Bacteriodetes, Synergistetes, Firmicutes and Spirochaetae, respectively. The electricity was possibly generated by some genera within Proteobacteria phyla that are known to be electrochemically active such as Geobacter, Deferrisoma, and Desulfobulbus [78]. Additionally, Table S5A–E show all the microorganisms that were relatively abundant (≥1%) from phyla to genera level.
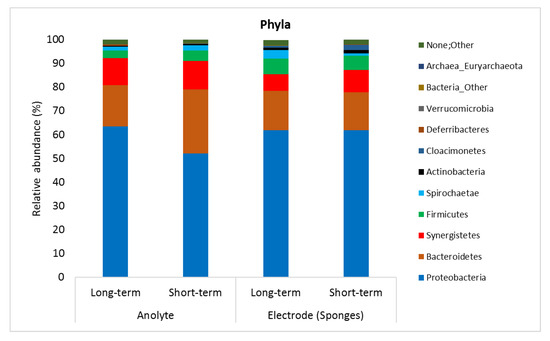
Figure 10.
Bacterial communities in the bioanodes of Microbial Fuel Cell in a long-term (70 days from PU/AC Inoculum) and short-term (28 days from PU/AC I) operation.
3.4. Field Test: PU/AC Electrode Delivers Electrical Current in a Plant-MFC When Used as an Anode
The field test result shows that the PU/AC electrode was able to deliver electric current when used as an anode and coupled with a graphite felt cathode (Figure 11a). However, the PU/AC electrode could not act as a cathode. Figure 11b shows that the PU/AC failed as a cathode to provide an access for oxygen reduction. The fact that the PU/AC failed as a cathode could be due to various reasons (e.g., a too low AC load) although it was reported that oxygen reducing biocathodes have conductivity [79]. Further study is required to understand the failure of PU/AC electrode as a cathode material.
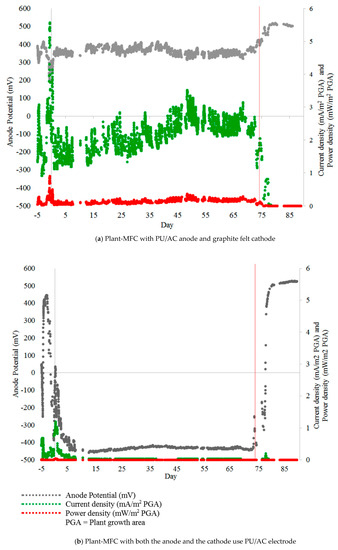
Figure 11.
Anode potential, Current density and Power density of Plant-MFCs with (a) PU/AC anode electrode and graphite felt cathode, (b) both anode and cathode used the AC/PU electrode. Both Plant-MFCs were operated with a 1000-ohm external load. The red vertical line indicates that the water flow in the paddy field was stopped. Transplanting Day (TD) was at day 0 and Harvesting Day was at day 87.
On average, current density and the power density of the Plant-MFC with PU/AC anode were 2 ± 1 mA·m−2 plant growth area (PGA) and 0.2 ± 0.1 mW·m−2 PGA, respectively. This current density was 48 times lower than the power density of similar tubular Plant-MFC with a graphite felt anode in the same paddy field [58]. The maximum current density (5.6 mA·m−2 PGA) and the maximum power density (0.9 mW·m−2 PGA) (Day-1 and -2 on Figure 11a) were reached just after the nearby soil was ploughed and fertilized before rice was transplanted [58]. Further polarisation curves should be done to find a more optimal maximum power point. Hereby maximum power point trackers can be useful as the systems performance is dynamic [80].
4. Conclusions
This study shows a proof of principle that an alternative electrode can be developed by coating a PU cube with activated carbon (AC) using a water-based dipping-drying process. This production process creates a biocompatible surface without additional energy need for PU-carbonisation or use of toxic chemicals. Biofilms were able to grow on the PU/AC electrode and enhanced conductivity. Electricity production with PU/AC bioanodes reached up to 22 mW·m−3 anode in lab MFCs and 0.9 mW·m−2 plant growth area (PGA) in field test tubular Plant-MFC.
Supplementary Materials
The following are available online at https://www.mdpi.com/1996-1073/13/3/574/s1, Figure S1: Schematic for ex situ CVs in the bioanolytes, Figure S2: (a) Real experimental set-up and (b) schematic of the setup for in-situ EIS measurements in the bioanodes, Figure S3: Ferricyanide calibration curves and equations to calculate ferrocyanide, Table S1: Composition of anolytes and Wolfe’s vitamin solution, Table S2: Modified Wolfe’s micronutrient solution, Table S3: Total Ohmic resistance of the bioelectrodes, Table S4: Biofilm conductivity calculation, Table S5: Relatively abundant (≥1%) of bacteria in the paddy field soil from phylum to genus level. The PU/AC inoculum was first developed as bioanode and consequently used to develop the PU/AC I.
Author Contributions
Conceptualization, E.S. and D.P.B.T.B.S.; methodology, E.S. and D.P.B.T.B.S.; validation, E.S. and D.P.B.T.B.S.; formal analysis, E.S., P.Y.C.D., M.C., R.L., C.S., and D.P.B.T.B.S.; investigation, E.S., P.Y.C.D., M.C., R.L., C.S., and D.P.B.T.B.S.; resources, E.S. and D.P.B.T.B.S.; data curation, E.S., P.Y.C.D., M.C., R.L., C.S., and D.P.B.T.B.S.; writing—original draft preparation, E.S., and P.Y.C.D.; writing—review and editing, E.S., P.Y.C.D., M.C., R.L., C.S., D.P.B.T.B.S., and C.J.N.B.; visualization, E.S. and P.Y.C.D.; supervision, E.S., D.P.B.T.B.S and C.J.N.B.; project administration, E.S., D.P.B.T.B.S., and C.J.N.B.; funding acquisition, E.S., D.P.B.T.B.S., and C.J.N.B. All authors have read and agreed to the published version of the manuscript.
Funding
This research was funded by the Government of Landak Regency, West Kalimantan Province, Republic of Indonesia under an MoU with Wageningen University and Research, No 616003015.
Acknowledgments
We thank Marcel Giesbers from Wageningen Electron Microscopy Center for his assistance on the SEM analysis. We also acknowledge Pim de Jager of Wageningen University and Plant-e B.V. for the support on the development of the data logging system.
Conflicts of Interest
The authors declare no conflict of interest.
References
- Hamelers, H.V.M.; Ter Heijne, A.; Sleutels, T.H.J.A.; Jeremiasse, A.W.; Strik, D.P.B.T.B.; Buisman, C.J.N. New applications and performance of bioelectrochemical systems. Appl. Microbiol. Biotechnol. 2010, 85, 1673–1685. [Google Scholar] [CrossRef] [PubMed]
- Logan, B.E.; Hamelers, B.; Rozendal, R.; Schröder, U.; Keller, J.; Freguia, S.; Aelterman, P.; Verstraete, W.; Rabaey, K. Microbial Fuel Cells: Methodology and Technology. Environ. Sci. Technol. 2006, 40, 5181–5192. [Google Scholar] [CrossRef] [PubMed]
- Arends, J.B.A.; Speeckaert, J.; Blondeel, E.; De Vrieze, J.; Boeckx, P.; Verstraete, W.; Rabaey, K.; Boon, N. Greenhouse gas emissions from rice microcosms amended with a plant microbial fuel cell. Appl. Microbiol. Biotechnol. 2014, 98, 3205–3217. [Google Scholar] [CrossRef] [PubMed]
- Helder, M.; Strik, D.P.B.T.B.; Hamelers, H.V.M.; Kuijken, R.C.P.; Buisman, C.J.N. New plant-growth medium for increased power output of the Plant-Microbial Fuel Cell. Bioresour. Technol. 2012, 104, 417–423. [Google Scholar] [CrossRef]
- Kaku, N.; Yonezawa, N.; Kodama, Y.; Watanabe, K. Plant/microbe cooperation for electricity generation in a rice paddy field. Appl. Microbiol. Biotechnol. 2008, 79, 43–49. [Google Scholar] [CrossRef]
- Kouzuma, A.; Kasai, T.; Nakagawa, G.; Yamamuro, A.; Abe, T.; Watanabe, K. Comparative Metagenomics of Anode-Associated Microbiomes Developed in Rice Paddy-Field Microbial Fuel Cells. PLoS ONE 2013, 8, e77443. [Google Scholar] [CrossRef]
- Strik, D.P.B.T.B.; Hamelers (Bert), H.V.M.; Snel, J.F.H.; Buisman, C.J.N. Green electricity production with living plants and bacteria in a fuel cell. Int. J. Energy Res. 2008, 32, 870–876. [Google Scholar] [CrossRef]
- Takanezawa, K.; Nishio, K.; Kato, S.; Hashimoto, K.; Watanabe, K. Factors Affecting Electric Output from Rice-Paddy Microbial Fuel Cells. Biosci. Biotechnol. Biochem. 2010, 74, 1271–1273. [Google Scholar] [CrossRef]
- Timmers, R.A.; Strik, D.P.B.T.B.; Hamelers, H.V.M.; Buisman, C.J.N. Long-term performance of a plant microbial fuel cell with Spartina anglica. Appl. Microbiol. Biotechnol. 2010, 86, 973–981. [Google Scholar] [CrossRef]
- Timmers, R.A.; Rothballer, M.; Strik, D.P.B.T.B.; Engel, M.; Schulz, S.; Schloter, M.; Hartmann, A.; Hamelers, B.; Buisman, C. Microbial community structure elucidates performance of Glyceria maxima plant microbial fuel cell. Appl. Microbiol. Biotechnol. 2012, 94, 537–548. [Google Scholar] [CrossRef]
- Timmers, R.A.; Strik, D.P.B.T.B.; Hamelers, H.V.M.; Buisman, C.J.N. Electricity generation by a novel design tubular plant microbial fuel cell. Biomass Bioenergy 2013, 51, 60–67. [Google Scholar] [CrossRef]
- Ueoka, N.; Sese, N.; Sue, M.; Kouzuma, A.; Watanabe, K. Sizes of Anode and Cathode Affect Electricity Generation in Rice Paddy-Field Microbial Fuel Cells. J. Sustain. Bioenergy Syst. 2016, 6, 10–15. [Google Scholar] [CrossRef]
- Wetser, K.; Sudirjo, E.; Buisman, C.J.N.; Strik, D.P.B.T.B. Electricity generation by a plant microbial fuel cell with an integrated oxygen reducing biocathode. Appl. Energy 2015, 137, 151–157. [Google Scholar] [CrossRef]
- Wetser, K.; Liu, J.; Buisman, C.; Strik, D. Plant microbial fuel cell applied in wetlands: Spatial, temporal and potential electricity generation of Spartina anglica salt marshes and Phragmites australis peat soils. Biomass Bioenergy 2015, 83, 543–550. [Google Scholar] [CrossRef]
- Wetser, K.; Dieleman, K.; Buisman, C.; Strik, D. Electricity from wetlands: Tubular plant microbial fuels with silicone gas-diffusion biocathodes. Appl. Energy 2017, 185, 642–649. [Google Scholar] [CrossRef]
- Xu, P.; Xiao, E.-R.; Xu, D.; Zhou, Y.; He, F.; Liu, B.-Y.; Zeng, L.; Wu, Z.-B. Internal nitrogen removal from sediments by the hybrid system of microbial fuel cells and submerged aquatic plants. PLoS ONE 2017, 12, e0172757. [Google Scholar] [CrossRef] [PubMed]
- Wetser, K. Electricity from Wetlands: Technology Assessment of the Tubular Plant Microbial Fuel Cell with An Integrated Biocathode; Wageningen University: Wageningen, The Netherlands, 2016. [Google Scholar]
- Ter Heijne, A.; Hamelers, H.V.M.; Saakes, M.; Buisman, C.J.N. Performance of non-porous graphite and titanium-based anodes in microbial fuel cells. Electrochim. Acta 2008, 53, 5697–5703. [Google Scholar] [CrossRef]
- Wei, J.; Liang, P.; Huang, X. Recent progress in electrodes for microbial fuel cells. Bioresour. Technol. 2011, 102, 9335–9344. [Google Scholar] [CrossRef]
- Wei, J.; Liang, P.; Cao, X.; Huang, X. Use of inexpensive semicoke and activated carbon as biocathode in microbial fuel cells. Bioresour. Technol. 2011, 102, 10431–10435. [Google Scholar] [CrossRef]
- Malvankar, N.S.; Lau, J.; Nevin, K.P.; Franks, A.E.; Tuominen, M.T.; Lovley, D.R. Electrical Conductivity in a Mixed-Species Biofilm. Appl. Environ. Microbiol. 2012, 78, 5967–5971. [Google Scholar] [CrossRef]
- Perez-Rodriguez, P.; Ovando-Medina, V.M.; Martinez-Amador, S.Y.; Rodriguez-de la Garza, J.A. Bioanode of polyurethane/graphite/polypyrrole composite in microbial fuel cells. Biotechnol. Bioprocess Eng. 2016, 21, 305–313. [Google Scholar] [CrossRef]
- Xie, X.; Criddle, C.; Cui, Y. Design and fabrication of bioelectrodes for microbial bioelectrochemical systems. Energy Environ. Sci. 2015, 8, 3418–3441. [Google Scholar] [CrossRef]
- Stoll, Z.A.; Ma, Z.K.; Trivedi, C.B.; Spear, J.R.; Xu, P. Sacrificing power for more cost-effective treatment: A techno-economic approach for engineering microbial fuel cells. Chemosphere 2016, 161, 10–18. [Google Scholar] [CrossRef] [PubMed]
- Santoro, C.; Arbizzani, C.; Erable, B.; Ieropoulos, I. Microbial fuel cells: From fundamentals to applications. A review. J. Power Sources 2017, 356, 225–244. [Google Scholar] [CrossRef]
- Yuan, Y.; Kim, S. Improved performance of a microbial fuel cell with polypyrrole/carbon black composite coated carbon paper anodes. Bull. Korean Chem. Soc. 2008, 29, 1344–1348. [Google Scholar]
- Yuan, Y.; Zhou, S.G.; Liu, Y.; Tang, J.H. Nanostructured Macroporous Bioanode Based on Polyaniline-Modified Natural Loofah Sponge for High-Performance Microbial Fuel Cells. Environ. Sci. Technol. 2013, 47, 14525–14532. [Google Scholar] [CrossRef]
- Liu, M.M.; Zhou, M.H.; Yang, H.J.; Zhao, Y.Y.; Hu, Y.S. A cost-effective polyurethane based activated carbon sponge anode for high-performance microbial fuel cells. RSC Adv. 2015, 5, 84269–84275. [Google Scholar] [CrossRef]
- Xie, X.; Ye, M.; Hu, L.; Liu, N.; McDonough, J.R.; Chen, W.S.; Alshareef, H.N.; Criddle, C.S.; Cui, Y. Carbon nanotube-coated macroporous sponge for microbial fuel cell electrodes. Energy Environ. Sci. 2012, 5, 5265–5270. [Google Scholar] [CrossRef]
- Jin, Z.; Yan, X.D.; Yu, Y.H.; Zhao, G.J. Sustainable activated carbon fibers from liquefied wood with controllable porosity for high-performance supercapacitors. J. Mater. Chem. A 2014, 2, 11706–11715. [Google Scholar] [CrossRef]
- Zhao, F.; Rahunen, N.; Varcoe, J.R.; Chandra, A.; Avignone-Rossa, C.; Thumser, A.E.; Slade, R.C. Activated carbon cloth as anode for sulfate removal in a microbial fuel cell. Environ. Sci. Technol. 2008, 42, 4971–4976. [Google Scholar] [CrossRef]
- Borsje, C.; Liu, D.; Sleutels, T.H.J.A.; Buisman, C.J.N.; ter Heijne, A. Performance of single carbon granules as perspective for larger scale capacitive bioanodes. J. Power Sources 2016, 325, 690–696. [Google Scholar] [CrossRef]
- Sudirjo, E.; Buisman, C.J.N.; Strik, D.P.B.T.B. Activated Carbon Mixed with Marine Sediment is Suitable as Bioanode Material for Spartina anglica Sediment/Plant Microbial Fuel Cell: Plant Growth, Electricity Generation, and Spatial Microbial Community Diversity. Water 2019, 11, 1810. [Google Scholar] [CrossRef]
- Sudirjo, E.; Buisman, C.J.N.; Strik, D.P.B.T.B. Marine Sediment Mixed With Activated Carbon Allows Electricity Production and Storage From Internal and External Energy Sources: A New Rechargeable Bio-Battery With Bi-Directional Electron Transfer Properties. Front. Microbiol. 2019, 10, 934. [Google Scholar] [CrossRef] [PubMed]
- AC Price. Available online: https://www.alibaba.com/product-detail/Coal-granular-Activated-Carbon-In-Water_62059260531.html? (accessed on 30 September 2019).
- King Sponge PU. Available online: https://www.alibaba.com/product-detail/Factory-Directly-Sell-Custom-10-15_60507687115.html? (accessed on 30 September 2019).
- Xie, X.; Yu, G.; Liu, N.; Bao, Z.; Criddle, C.S.; Cui, Y. Graphene–sponges as high-performance low-cost anodes for microbial fuel cells. Energy Environ. Sci. 2012, 5, 6862–6866. [Google Scholar] [CrossRef]
- Xie, X.; Hu, L.; Pasta, M.; Wells, G.F.; Kong, D.; Criddle, C.S.; Cui, Y. Three-Dimensional Carbon Nanotube−Textile Anode for High-Performance Microbial Fuel Cells. Nano Lett. 2011, 11, 291–296. [Google Scholar] [CrossRef]
- Cabot, N.A.C. SDS Norit PK1-3. Available online: http://www.cabotcorp.nl/solutions/products-plus/activated-carbon/granulated (accessed on 21 October 2019).
- Ter Heijne, A.; Schaetzle, O.; Gimenez, S.; Navarro, L.; Hamelers, B.; Fabregat-Santiago, F. Analysis of bio-anode performance through electrochemical impedance spectroscopy. Bioelectrochemistry 2015, 106, 64–72. [Google Scholar] [CrossRef]
- Fricke, K.; Harnisch, F.; Schroder, U. On the use of cyclic voltammetry for the study of anodic electron transfer in microbial fuel cells. Energy Environ. Sci. 2008, 1, 144–147. [Google Scholar] [CrossRef]
- Marsili, E.; Sun, J.; Bond, D.R. Voltammetry and Growth Physiology of Geobacter sulfurreducens Biofilms as a Function of Growth Stage and Imposed Electrode Potential. Electroanalysis 2010, 22, 865–874. [Google Scholar] [CrossRef]
- Harnisch, F.; Freguia, S. A Basic Tutorial on Cyclic Voltammetry for the Investigation of Electroactive Microbial Biofilms. Chem. Asian J. 2012, 7, 466–475. [Google Scholar] [CrossRef]
- Babauta, J.; Renslow, R.; Lewandowski, Z.; Beyenal, H. Electrochemically active biofilms: Facts and fiction. A review. Biofouling 2012, 28, 789–812. [Google Scholar] [CrossRef]
- Bard, A.J.; Faulkner, L.R.; Leddy, J.; Zoski, C.G. Electrochemical Methods: Fundamentals and Applications; Wiley: New York, NY, USA, 1980; Volume 2. [Google Scholar]
- Sleutels, T.H.J.A.; Hamelers, H.V.M.; Rozendal, R.A.; Buisman, C.J.N. Ion transport resistance in Microbial Electrolysis Cells with anion and cation exchange membranes. Int. J. Hydrog. Energy 2009, 34, 3612–3620. [Google Scholar] [CrossRef]
- Skyllas-Kazacos, M.; Chakrabarti, M.H.; Hajimolana, S.A.; Mjalli, F.S.; Saleem, M. Progress in Flow Battery Research and Development. J. Electrochem. Soc. 2011, 158, R55–R79. [Google Scholar] [CrossRef]
- Zhang, Y.Z.; Mo, G.Q.; Li, X.W.; Zhang, W.D.; Zhang, J.Q.; Ye, J.S.; Huang, X.D.; Yu, C.Z. A graphene modified anode to improve the performance of microbial fuel cells. J. Power Sources 2011, 196, 5402–5407. [Google Scholar] [CrossRef]
- De Smit, S.M.; de Leeuw, K.D.; Buisman, C.J.N.; Strik, D.P.B.T.B. Continuous n-valerate formation from propionate and methanol in an anaerobic chain elongation open-culture bioreactor. Biotechnol. Biofuels 2019, 12, 132. [Google Scholar] [CrossRef] [PubMed]
- Takahashi, S.; Tomita, J.; Nishioka, K.; Hisada, T.; Nishijima, M. Development of a Prokaryotic Universal Primer for Simultaneous Analysis of Bacteria and Archaea Using Next-Generation Sequencing. PLoS ONE 2014, 9, e105592. [Google Scholar] [CrossRef]
- Edgar, R.C. Search and clustering orders of magnitude faster than BLAST. Bioinformatics 2010, 26, 2460–2461. [Google Scholar] [CrossRef]
- Quast, C.; Pruesse, E.; Yilmaz, P.; Gerken, J.; Schweer, T.; Yarza, P.; Peplies, J.; Glöckner, F.O. The SILVA ribosomal RNA gene database project: Improved data processing and web-based tools. Nucleic Acids Res. 2012, 41, D590–D596. [Google Scholar] [CrossRef]
- Wang, Q.; Garrity, G.M.; Tiedje, J.M.; Cole, J.R. Naive Bayesian classifier for rapid assignment of rRNA sequences into the new bacterial taxonomy. Appl Environ. Microbiol. 2007, 73, 5261–5267. [Google Scholar] [CrossRef]
- Caporaso, J.G.; Kuczynski, J.; Stombaugh, J.; Bittinger, K.; Bushman, F.D.; Costello, E.K.; Fierer, N.; Peña, A.G.; Goodrich, J.K.; Gordon, J.I.; et al. QIIME allows analysis of high-throughput community sequencing data. Nat. Methods 2010, 7, 335. [Google Scholar] [CrossRef]
- Strik, D.P.B.T.B.; Timmers, R.A.; Helder, M.; Steinbusch, K.J.J.; Hamelers, H.V.M.; Buisman, C.J.N. Microbial solar cells: Applying photosynthetic and electrochemically active organisms. Trends Biotechnol. 2011, 29, 41–49. [Google Scholar] [CrossRef]
- Ter Heijne, A.; Schaetzle, O.; Gimenez, S.; Fabregat-Santiago, F.; Bisquert, J.; Strik, D.P.B.T.B.; Barriere, F.; Buisman, C.J.N.; Hamelers, H.V.M. Identifying charge and mass transfer resistances of an oxygen reducing biocathode. Energy Environ. Sci. 2011, 4, 5035–5043. [Google Scholar] [CrossRef]
- Gago, A.S.; Ansar, A.S.; Gazdzicki, P.; Wagner, N.; Arnold, J.; Friedrich, K.A. Low Cost Bipolar Plates for Large Scale PEM Electrolyzers. ECS Trans. 2014, 64, 1039–1048. [Google Scholar] [CrossRef]
- Sudirjo, E.; de Jager, P.; Buisman, C.J.N.; Strik, D.P.B.T.B. Performance and Long Distance Data Acquisition via LoRa Technology of a Tubular Plant Microbial Fuel Cell Located in a Paddy Field in West Kalimantan, Indonesia. Sensors 2019, 19, 4647. [Google Scholar] [CrossRef] [PubMed]
- Bowen, H.J.M. Absorption by Polyurethane Foams—New Method of Separation. J. Chem. Soc. A Inorg. Phys. Theor. 1970. [Google Scholar] [CrossRef]
- Thirumal, M.; Khastgir, D.; Singha, N.K.; Manjunath, B.S.; Naik, Y.P. Effect of foam density on the properties of water blown rigid polyurethane foam. J. Appl. Polym. Sci. 2008, 108, 1810–1817. [Google Scholar] [CrossRef]
- Pinto, M.L.; Pires, J.; Carvalho, A.P.; de Carvalho, M.B.; Bordado, J.C. Characterization of adsorbent materials supported on polyurethane foams by nitrogen and toluene adsorption. Microporous Mesoporous Mater. 2005, 80, 253–262. [Google Scholar] [CrossRef]
- FXI Technical Products Function Sheet Polyurethane Foams. Available online: http://fxi.com/assets/pdf/FS_MEC4.pdf (accessed on 28 October 2019).
- Huysman, P.; Vanmeenen, P.; Vanassche, P.; Verstraete, W. Factors Affecting The Colonization of Non Porous and Porous Packing Materials in Model Upflow Methane Reactors. Biotechnol. Lett. 1983, 5, 643–648. [Google Scholar] [CrossRef]
- Qiao, Y.; Bao, S.J.; Li, C.M.; Cui, X.Q.; Lu, Z.S.; Guo, J. Nanostructured polyanifine/titanium dioxide composite anode for microbial fuel cells. ACS Nano 2008, 2, 113–119. [Google Scholar] [CrossRef]
- Chen, S.; Hou, H. Three-dimensional laminar wavelike carbon anode material of microbiological fuel cell and preparation method thereof 2014, 8.
- Peixoto, L.; Parpot, P.; Martins, G. Assessment of Electron Transfer Mechanisms during a Long-Term Sediment Microbial Fuel Cell Operation. Energies 2019, 12, 481. [Google Scholar] [CrossRef]
- Martins, G.; Peixoto, L.; Teodorescu, S.; Parpot, P.; Nogueira, R.; Brito, A.G. Impact of an external electron acceptor on phosphorus mobility between water and sediments. Bioresour. Technol. 2014, 151, 419–423. [Google Scholar] [CrossRef]
- Molenaar, S.D.; Mol, A.R.; Sleutels, T.H.J.A.; ter Heijne, A.; Buisman, C.J.N. Microbial Rechargeable Battery: Energy Storage and Recovery through Acetate. Environ. Sci. Technol. Lett. 2016, 3, 144–149. [Google Scholar] [CrossRef]
- Logan, B.E.; Regan, J.M. Electricity-producing bacterial communities in microbial fuel cells. Trends Microbiol. 2006, 14, 512–518. [Google Scholar] [CrossRef] [PubMed]
- Marsili, E.; Rollefson, J.B.; Baron, D.B.; Hozalski, R.M.; Bond, D.R. Microbial Biofilm Voltammetry: Direct Electrochemical Characterization of Catalytic Electrode-Attached Biofilms. Appl. Environ. Microbiol. 2008, 74, 7329–7337. [Google Scholar] [CrossRef] [PubMed]
- Li, C.; Lesnik, K.L.; Liu, H. Conductive properties of methanogenic biofilms. Bioelectrochemistry 2018, 119, 220–226. [Google Scholar] [CrossRef]
- Malvankar, N.S.; Tuominen, M.T.; Lovley, D.R. Biofilm conductivity is a decisive variable for high-current-density Geobacter sulfurreducens microbial fuel cells. Energy Environ. Sci. 2012, 5, 5790–5797. [Google Scholar] [CrossRef]
- Liang, P.; Wang, H.; Xia, X.; Huang, X.; Mo, Y.; Cao, X.; Fan, M. Carbon nanotube powders as electrode modifier to enhance the activity of anodic biofilm in microbial fuel cells. Biosens. Bioelectron. 2011, 26, 3000–3004. [Google Scholar] [CrossRef]
- Lee, H.S.; Dhar, B.R.; An, J.; Rittmann, B.E.; Ryu, H.; Domingo, J.W.S.; Ren, H.; Chae, J. The Roles of Biofilm Conductivity and Donor Substrate Kinetics in a Mixed-Culture Biofilm Anode. Environ. Sci. Technol. 2016, 50, 12799–12807. [Google Scholar] [CrossRef]
- Morita, M.; Malvankar, N.S.; Franks, A.E.; Summers, Z.M.; Giloteaux, L.; Rotaru, A.E.; Rotaru, C.; Lovley, D.R. Potential for Direct Interspecies Electron Transfer in Methanogenic Wastewater Digester Aggregates. Mbio 2011, 2. [Google Scholar] [CrossRef]
- Li, C.; Lesnik, K.L.; Fan, Y.; Liu, H. Redox Conductivity of Current-Producing Mixed Species Biofilms. PLoS ONE 2016, 11, e0155247. [Google Scholar] [CrossRef]
- Borole, A.P.; Reguera, G.; Ringeisen, B.; Wang, Z.W.; Feng, Y.J.; Kim, B.H. Electroactive biofilms: Current status and future research needs. Energy Environ. Sci. 2011, 4, 4813–4834. [Google Scholar] [CrossRef]
- Ahn, J.-H.; Jeong, W.-S.; Choi, M.-Y.; Kim, B.-Y.; Song, J.; Weon, H.-Y. Phylogenetic Diversity of Dominant Bacterial and Archaeal Communities in Plant-Microbial Fuel Cells Using Rice Plants. J. Microbiol. Biotechnol 2014, 24, 1707–1718. [Google Scholar] [CrossRef] [PubMed]
- Huang, L.; Regan, J.M.; Quan, X. Electron transfer mechanisms, new applications, and performance of biocathode microbial fuel cells. Bioresour. Technol. 2011, 102, 316–323. [Google Scholar] [CrossRef] [PubMed]
- Alaraj, M.; Park, J.-D. Net power positive maximum power point tracking energy harvesting system for microbial fuel cell. J. Power Sources 2019, 418, 225–232. [Google Scholar] [CrossRef]


© 2020 by the authors. Licensee MDPI, Basel, Switzerland. This article is an open access article distributed under the terms and conditions of the Creative Commons Attribution (CC BY) license (http://creativecommons.org/licenses/by/4.0/).