Article

Exergy Analysis of Gas Switching Chemical Looping IGCC Plants

by
Carlos Arnaiz del Pozo
1,
Ángel Jiménez Álvaro
1,*,
Jan Hendrik Cloete
2,
Schalk Cloete
2 and
Shahriar Amini
2
1
Universidad Politécnica de Madrid, Calle Ramiro de Maeztu 7, 28040 Madrid, Spain
2
SINTEF Industry, Richard Birkelands vei 2B, 7034 Trondheim, Norway
*
Author to whom correspondence should be addressed.
Energies 2020, 13(3), 544; https://doi.org/10.3390/en13030544
Submission received: 19 December 2019 / Revised: 16 January 2020 / Accepted: 17 January 2020 / Published: 22 January 2020

Abstract

:
Integrated gasification combined cycles (IGCC) are promising power production systems from solid fuels due to their high efficiency and good environmental performance. Chemical looping combustion (CLC) is an effective route to reduce the energy penalty associated with CO2 capture. This concept comprises a metal oxygen carrier circulated between a reduction reactor, where syngas is combusted, and an oxidation reactor, where O2 is withdrawn from an air stream. Parallel to CLC, oxygen carriers that are capable of releasing free O2 in the reduction reactor, i.e., chemical looping oxygen production (CLOP), have been developed. This offers interesting integration opportunities in IGCC plants, replacing energy demanding air separation units (ASU) with CLOP. Gas switching (GS) reactor cluster technology consists of a set of reactors operating in reduction and oxidation stages alternatively, providing an averaged constant flow rate to the gas turbine and a CO2 stream readily available for purification and compression, and avoiding the transport of solids across reactors, which facilitates the scale up of this technology at pressurized conditions. In this work, exergy analyses of a gas switching combustion (GSC) IGCC plant and a GSOP–GSC IGCC plant are performed and consistently benchmarked against an unabated IGCC and a precombustion CO2 capture IGCC plant. Through the exergy analysis methodology, an accurate assessment of the irreversible loss distribution in the different power plant sections from a second-law perspective is provided, and new improvement pathways to utilize the exergy contained in the GSC reduction gases outlet are identified.

1. Introduction

CO2 capture and storage (CCS) is expected to be a key technology in order to meet the climate change targets of global warming increase below 1.5 °C with respect to pre-industrial levels [1]. In order for CCS to become a cost-effective solution for energy decarbonization, it is essential to reduce the energy penalty associated with it. A promising solution for reducing the efficiency loss of CO2 abatement, which increases the specific capital cost ($/kW) of the plant and the costs related to fuel production and transport, consists of integrated gasification combined cycles (IGCC) with inherent carbon capture by means of gas fuelled chemical looping combustion (CLC) [2]. Solid fueled CLC (using coal directly) faces numerous challenges [3]; therefore, a conventional gasification step to generate a clean syngas fuel is employed in the plants investigated in the present work. A metallic oxygen carrier is transferred between interconnected fluidized reduction and oxidation reactors and exposed to syngas and air streams respectively to achieve inherent CO2 capture, obtaining two outlet streams consisting of the products of combustion, where pure CO2 is obtained after water condensation, and an O2-depleted air stream is used in the power cycle. In this way, the combustion of the fuel takes place in a N2-free environment instead of a conventional combustion chamber. However, slow progress in the scale up of pressurized interconnected fluidized beds has been reported [4]. To overcome this challenge, a solution involving a reactor cluster operating alternatively in reduction and oxidation stages, with the metallic carrier remaining in each reactor, has been proposed [5]. A set of gas switching (GS) valves controls the reduction and oxidation cycle lengths of each reactor. Several oxygen carriers have been tested in the lab scale and a nickel oxide (NiO) with alumina (Al2O3) support has proved to be mechanically stable and fluidize well at high air reactor temperatures [6], which are required to attain high thermal efficiencies [7].
Furthermore, chemical looping oxygen production (CLOP) has been suggested as a more efficient solution compared to a cryogenic air separation unit [8,9]. This concept employs an oxygen carrier that is capable of releasing free oxygen in the reduction stage that can be effectively used for oxy-combustion or as gasification agent. In the work [10], an integration of CLOP and CLC employing packed bed (PB) gas switching reactors in an IGCC plant is presented, revealing an efficiency increase of approximately 2.5% relative to the plant employing only CLC. A subsequent techno-economic assessment [11] showed that PB-CLC power plants clearly outperform the precombustion CO2 capture IGCC benchmark, but revealed a trade-off between the benefit of adding the CLOP reactors and the added complexity and increase in cost of the gasification section. This study concluded that concepts that integrate CLOP reactors will gain potential if the performance of the carrier can be improved through maximization of the O2 molar fraction in the reduction outlet. [12] shows a reduction in the energy penalty for CO2 capture of 1.8% points for a precombustion CO2 capture IGCC plant employing CLOP operating at atmospheric pressures instead of an air separation unit (ASU). In [13], a pressurized gas switching oxygen production (GSOP) cluster was integrated in a precombustion CO2 capture IGCC with approximately 6%-points higher efficiency and capture rates above 80%.
In this work, a gas switching combustion (GSC) IGCC and GSOP–GSC IGCC plant are modeled, employing bubbling fluidized beds as gas switching reactors in both clusters, while previous studies focused on plants employing packed bed reactors [10,14]. The fluidization mode allows an easier operation (activation of material and continuous replenishment) and avoids material-related challenges (strength and reactivity). Uniform temperature can be achieved throughout the reactor length, and the good mixing properties prevent fuel dilution (to avoid deposition on the carrier), but also lead to an undesired mixing of gases when switching between the oxidation and reduction stages, reducing the CO2 purity of the reduction outlet and lowering the capture ratio. The performance of the GSOP reactors operating in fluidized mode is improved with respect to the packed bed configuration, increasing the concentration difference of O2 between the reactor outlet streams relative to the values obtained in [10]. The trade-off between a more efficient generation of the oxidant stream and the lower CO2 capture ratio (resulting of the fluidized bed clusters) will be evaluated in the present analysis for the GSOP–GSC IGCC plant.
Besides inherent CO2 capture as a means to boost power plant efficiency with respect to other CO2 capture pathways, the configurations with GS technology presented in this work also incorporate hot gas clean up (HGCU) for syngas desulphurization [15]. This unit consists of interconnected fluidized beds with zinc oxide as the hydrogen sulfide adsorbent. Other sorbents are required to remove contaminants such as HCl and NH3 to acceptable ppm levels [16]. This treating technology is implemented in the novel power plant concepts presented, as it will be commercially available by the time gas-switching technology is deployed, whereas the benchmark models represent current attainable IGCC performance with and without CCS.
Literature studies involving IGCC with CCS and CLC focus on thermal analysis and the CO2 capture performance of the plant, with an energy efficiency penalty, specific emissions, CO2 avoidance, and SPECCA (Specific Primary Energy Cost of CO2 Avoided) index as key performance indicators of the proposed concepts. In the present analysis, together with the previous plant parameters, an exergy analysis is performed, introducing a rational efficiency that takes into account the fact that heat and work are not fully interchangeable. Moreover, the exergy analysis allows the identification of efficiency losses throughout all the subsections of the plant, enabling potential optimization strategies to be more effective, providing the process engineer with insights in the synthesis of alternative process line-ups and focus on items in which the greatest exergy destruction takes place, as suggested by [17].
In [17,18], an exergy analysis for IGCC plants with precombustion CO2 capture employing different syngas shift technologies and CO2 removal strategies is given, while [19] provides an exergy analysis of a plant employing CLC and compares it to unabated, oxyfuel, and precombustion CO2 capture power plants. An exergy analysis of IGCC plants using CLOP to provide O2 for post-combustion precombustion plants was performed in [20]. In the present work, the exergy analysis methodology is employed to evaluate the performance of the novel GSC IGCC and the GSOP–GSC IGCC power plants with HGCU and benchmark them against an unabated IGCC plant and an IGCC plant with precombustion CO2 capture with the same modeling baselines. The specific performance of each power plant section is determined through the exergy utilization and exergy loss contribution parameters, as defined in Section 2.3.
The plants using chemical looping considered here have been proposed recently, and more insight on how these systems generate electrical power is desirable. The exergy method is a tool that allows process engineers and researchers to understand how the foreseen efficiency gains arise, as it provides a comprehensive analysis of the different sections of the plant through identification of the flows of exergy across them. While the thermal analysis of the plant is merely based on the energy conservation, the exergy analysis determines the actual performance of each plant system relative to the maximum possible attainable, taking into account the restrictions imposed by the second law of thermodynamics. With that aim, this work also presents an auxiliary modeling tool to effectively calculate the chemical and physical exergy of mixtures appearing in the energy conversion processes of the plants.

2. Modeling

In this section, a brief description of the gas switching reactor modeling aspects and the assumptions taken for the stationary power plant simulations is given. A general outline of the power plant cases modeled is presented, as well as the theoretical framework for the exergy analysis that was performed.

2.1. Reactor Simulations

Transient reactor simulations were carried out with MATLAB using a zero-dimensional model where the fluidized bed is represented as a continuous stirred tank reactor (CSTR), assuming that chemical and thermal equilibrium are reached. This assumption is justified based on the excellent mixing of fluidized beds and the size of the industrial-scale reactors that are considered. The reader is referred to earlier work for a detailed description of the modeling methodology and reactor operating conditions for the GSC [21] and GSOP [13] reactors.
Figure 1 illustrates the behavior of the GSC and GSOP reactors in the GSOP–GSC IGCC power plant and will be discussed here briefly. In the GSC reactor (Figure 1a), the oxygen carrier (nickel oxide) is first reduced by the syngas in the reduction step (0–1 on the x-axis), producing CO2 and steam, and then oxidized in the oxidation step (1–8 on the x-axis). Due to the highly exothermic nature of the oxidation reaction, a surplus of air is fed to the reactor to limit the maximum reactor temperature. For the GSC in the GSC IGCC plant (not shown here), it is possible to recycle part of the depleted air from the gas turbine to the oxidation step in the GSC. This strategy limits the temperature variation over the cycle, allowing longer cycle times with a fixed maximum temperature and thereby limiting the undesired mixing between reactor steps (seen in Figure 1a after switching the inlet streams at x-axis values of 0 and 1), as discussed in previous publications [5,21].
In the GSOP reactors (Figure 1b), an oxygen carrier with oxygen uncoupling properties is used [10]. In the reduction step (0–1 on the x-axis), the oxygen carrier is reduced by syngas in exothermic reactions, heating the reactor while simultaneously releasing oxygen, which is utilized in the gasifier. In the oxidation step, part of the oxygen in the incoming air is used to re-oxidize the oxygen carrier while cooling the reactor. It can also be observed from the figure that the equilibrium oxygen concentration is dependent on the reactor temperature; therefore, the temperature variation over the cycle determined the oxygen content in the outlet streams.

2.2. Power Plants

A description of the models developed in Unisim Design R451 is given in this section. The benchmark cases are introduced first, and later, the GSC IGCC and GSOP–GSC IGCC plants are described. For the stationary process modeling simulations, the Peng Robinson equation of state was used to determine the thermodynamic properties of syngas/air streams, while ASME steam tables were used for the property estimations of steam in the bottoming cycle.

2.2.1. IGCC w/o CO2 Capture

The IGCC power plant without carbon capture consists of a model similar to the one described in [22], where an elevated pressure ASU delivers oxygen to a Shell gasifier operating at the conditions described in [14] with coal loading performed with N2 from the ASU. The ASU is 50% air-integrated and 100% N2-integrated with the gas turbine, in order to reduce NOx emissions by lowering the combustor flame temperature. Cold gas efficiency (CGE) is approximately 80% with a carbon conversion above 99%. After HP steam generation in the syngas effluent cooler (SEC), a portion of the syngas is sent to the hot gas quench at the top of the gasifier while the remaining stream is routed to a scrubber, which eliminates the remaining particulates, ammonia, and chlorides. A COS hydrolyzer converts traces of this component to H2S before entering a sulfur removal unit using absorption. Clean syngas is saturated (around 1% is extracted for coal drying), mixed with N2 from the ASU and heated to 200 °C with hot water before being fed to the combustor. The gas turbine outlet is routed to a heat recovery steam generator (HRSG) with three pressure levels and intermediate reheat, where extra power output is achieved. Similar modeling assumptions to [22,23] were used to build the unabated benchmark model. Coal characteristics and compositions are detailed in Table A5 in the Appendix A. The reference F-class gas turbine described in [22] was calibrated with natural gas as fuel and integrated in the IGCC plant with syngas fuel operation at the same design nominal point, turbine inlet temperature (TIT), and pressure ratio, following a similar approach as in [14], which was referred to as “advanced gas turbine” assumptions. A schematic of this power plant main process units is given in Figure 2:

2.2.2. IGCC with Precombustion CO2 Capture

In this configuration, a standalone non-integrated low pressure air separation unit (ASU) delivers oxygen (95% mol purity) to a shell gasifier as in the unabated case. Minimal or no ASU integration with the gas turbine (GT) compressor is recommended for precombustion plants [24]. Coal is loaded with CO2 available from the CO2 compression train. The oxygen consumption has been set equal to the unabated IGCC plant, resulting in a similar CGE. Syngas is cooled and sent to a water scrubber to remove remaining particulate material. A water gas shift (WGS) unit consisting of two adiabatic reactors with intercooling achieves approximately 98% conversion of CO after steam addition from the high pressure (HP) stage steam turbine outlet. The steam to CO ratio was set to 1.9, and it was assumed that thermodynamic equilibrium was reached at reactor outlets. CO2 and H2S are removed with a selective physical sorbent (Selexol), which was modeled with the parameters from [25], and the remaining H2 is saturated with water, reheated, and diluted with N2 available from the ASU before being fed to the gas turbine combustor. The TIT, pressure ratio, and blade-cooling flow fractions were assumed to be the same as that for the unabated plant. Exhaust gas heat is retrieved in an HRSG (with three pressure levels and reheating) raising steam fed to a steam turbine. The CO2 absorbed in the Selexol treating unit is compressed in a five-stage intercooled CO2 compressor. Similar modeling assumptions to [22,23] were used to build the precombustion CO2 capture benchmark model. A schematic of the power plant is given in Figure 3.

2.2.3. GSC IGCC Plant

The GSC IGCC power plant has been presented in [5,21], and a schematic of the main components is shown in Figure 4. The gasification island is similar to the precombustion CO2 capture model: a standalone ASU delivers oxygen to the gasifier, while coal is loaded to the gasifier with a fraction of the captured CO2 via lock hoppers. The HGCU unit operating at 400 °C eliminates sulfur and other contaminants from the syngas; then, this stream is delivered to the GSC cluster. The sorbent regeneration in the desulfurizer unit is done by diluting an air stream with pure N2 from the ASU in order to prevent sulfate formation in the zinc sorbent. The clean syngas is fed to the GSC cluster at high temperature after subtracting around 1% of the flow for coal drying. A total bed pressure of 0.75 bar was assumed. In order to maintain a high average oxidation temperature, which is critical for high thermal efficiency, whilst achieving a high carbon capture rate, the GSC cluster is operated with an N2 recycle from the HRSG outlet to the gas turbine compressor after cool down in order to reduce the O2 mole fraction inlet to the GSC, allowing the oxidation reaction to take place throughout the total time length of the cycle, as suggested in [26]. A slightly higher turbine back pressure (2 kPa) was specified to account for the pressure losses due to this extra cooling requirement. Afterwards, the hot N2 stream from the GSC oxidation outlet is expanded in the gas turbine, operating at the same pressure ratio as the reference plants. The HSRG unit raises steam, which is superheated in the hot reduction gases heat recovery unit, since the attainable TIT in the GSC oxidation is below 1200 °C (imposed by the oxygen carrier degradation at higher temperatures); therefore, the exhaust gases upon expansion in the GT are at a relatively low temperature (~500 °C). The cooling flow model for the stator of the GSC IGCC plant was calculated with a correlation from [27] and, due to the relatively low TIT, it was assumed that no rotor cooling is required. The GT component polytropic efficiencies are the same as the ones employed in the benchmark plants to allow a consistent comparison.
The reduction gases outlet is further cooled down in a condenser and water is knocked out, prior to a CO2 purification unit (CO2 CPU) consisting of a two-flash vessel cryogenic system similar to the one described in [28,29]. This purification step is needed because, due to the mixing occurring during the valve switch in the GSC reactors, the CO2 purity resulting after water removal is below the 96% mol. specification required for CO2 capture and storage [22,30]. A supercritical CO2 pump delivers a sequestered CO2 stream at 150 bar.

2.2.4. GSOP–GSC IGCC

The IGCC power plant employing a GSOP reactor cluster instead of an ASU and GSC in place of a combustion chamber was modeled taking into account the following considerations.
The purity of the oxidant stream (~23%mol O2) is low compared to that delivered by an ASU; therefore, the gasification technology employed consists of a circulating fluidized bed Winkler gasifier [31] operating at substantially lower temperature than the entrained flow Shell gasifier technology of the benchmark and GSC IGCC power plants. If an entrained flow gasifier was coupled to a GSOP reactor cluster, a very low CGE would be obtained, as a substantial heating value of coal would be invested in heating the species in the gasifier to high temperatures (>1400 °C). The fluidized bed gasifier was modeled assuming a syngas outlet temperature of 900 °C and fixing the ratio of the lower heating value (LHV) of methane in the syngas and coal LHV input to 11.3%, analogously to [10]. The carbon conversion achieved in the Winkler gasifier is lower than in the Shell gasifier process, and a value of 95.5% was used. Since the Winkler gasifier operates at a slightly lower pressure than the GT pressure ratio, the oxidizing stream delivered by the GSOP at elevated temperature can be effectively coupled with the gasification system (allowing for a slight oxidizer overpressure of 0.5 bar). Consequently, a booster compressor operating at a high inlet temperature must be introduced before the GS cluster to overcome the pressure losses of the gasifier–GSOP loop. The pressure drop assumed in each reactor cluster was consistent with the GSC IGCC case.
The GSOP–GSC IGCC was also modeled with HGCU for sulfur and contaminant removal operating at 400 °C, but in this case, the reduction of the O2 mole fraction in the regeneration stream is accomplished by partially recirculating part of wet flue gas desulfurization (WFGD) outlet to the regeneration stream compressor inlet, as suggested in [10]. The fraction of syngas delivered to the GSOP reactor was adjusted to achieve the specified reduction outlet temperature. The total air flow rate was manipulated to set the GSC oxidation temperature to the fixed value of 1150 °C, which gives a reasonable trade-off between thermal efficiency and CO2 capture. The portion of the recirculated GSC reduction outlet used as sweep gas in the GSOP was varied in order to achieve the desired gasifier outlet temperature and specified heat loss. The model reached the simultaneous convergence of GSOP, GSC, and gasifier blocks, meeting all design/operation specifications with error tolerances below ~0.5 °C. The oxygen-depleted air stream is expanded in the gas turbine (GT), and subsequently, heat is recovered in an HRSG unit for power generation in the steam turbine. Analogously to the GSC IGCC plant, most of the steam superheating is carried out with the hot reduction gases heat recovery unit, which allows steam temperatures to reach 565 °C. In addition, the stator cooling correlation assuming a blade temperature of 850 °C was employed, neglecting the rotor cooling flows due to the low operating temperatures. The reduction gases outlet after heat recovery and water knock out is sent to the CO2 CPU to meet the transport and storage specifications. A schematic of the GSOP-GSC plant is given in Figure 5:
In all the models, a fixed coal input is assumed, resulting in net plant power outputs between 300 and 450 MW. This approach is consistent with other studies involving the exergy analysis of plants [17,19]. Further modeling assumptions of the power plant can be found in the Appendix A.

2.3. Exergy Analysis Tool

The exergy balance suggested in [32] for each system j of the power plant is given by Equation (1) under stationary conditions and assuming that the changes in kinetic and potential energy are negligible. A system may comprise one or more unit operations defined by a control volume, which sets the boundary to which Equation (1) is applied.
0 = Q ˙ j ( 1 T 0 T ) W ˙ j I ˙ j + i E ˙ i , j
where T0 and P0 are the temperature and pressure at ambient conditions. The total exergy flow will is calculated as E ˙ i , j = e i , j m ˙ i , j . The exergy destruction term can be determined when the work W ˙ j and heat flows Q ˙ j alongside the specific exergy flow for stream i entering or leaving system j, ei,j are known. The exergy flow terms are calculated with Equation (2).
e i = e C h + e P h
e p h = h i T 0 s i ( h 0 T 0 s 0 )
The determination of the chemical and physical exergy ( e C h ,   e P h ) employing the simulation software requires the creation of an auxiliary tool which accounts for the following:
  • A series of mechanical transformations that bring a given stream mixture at certain pressure Pi and temperature Ti to the reference environment values (P0 and T0), so that the physical exergy term can be determined by accessing specific enthalpies and entropies: h i , s i .
  • A series of mechanical and chemical reaction elements that withdraw co-reactants from the reference environment, react with the mixture at T0 and P0, and release the products of the reaction to the environment at the same chemical potential (i.e., partial pressure) at which these components are found in the environment. If no devaluation reactions take place in the components of the mixture, the tool determines the chemical exergy as the concentration imbalance of the components of the mixture with respect to the environment composition. Figure 6 shows a simplified block diagram of the rationale for the determination of the chemical and physical exergy of a mixture:
When heat is rejected to the environment across the boundary of the power plant, such as in a steam condenser, it is assumed that the heat term in Equation (1) is released to a reservoir of infinite mass permanently at ambient conditions. Therefore, any heat stream leaving the power plant is considered an exergy destruction inherent to the plant subsystem stream source, as no useful work is retrieved from it. To illustrate this, if we consider the steam condenser of the actual plant, the cooling water will experience an exergy gain due to a small temperature rise. However, this exergy is later destroyed/lost in the cooling water tower auxiliary unit, and it is not practical to implement a thermal machine from which power can be produced from that stream.
The environment composition is defined with a dry air composition, vapor pressure correlation for water [33], and the relative humidity. A 60% relative humidity was assumed in the calculations. The inert thermomechanical state was taken as 25 °C and 1.01325 bar. The devaluation reactions considered in the tool include all the combustion reactions of components present in syngas and natural gas. The specific properties of the streams are determined by setting a specified thermodynamic property package; in this case, it is the Peng–Robinson equation of state. The exergy tool has been validated with data from [34] and for chemical exergies of single components with errors below 2%. Reference environment composition can be found in Table A4 in Appendix A. The exergy of coal and slag leaving the gasification system was accounted for by using a correlation provided by [34], it was assumed that the chemical exergy of the ash components was negligible compared to the organic matter.
e 0 s o l i d = ( L H V + 2442 w ) φ d r y + 9417 s
φ d r y = 1.044 + h c 0.1882 + o c 0.0610 + n c 0.0404
where w, s, h, c, o and n are the coal mass fraction of water, elemental sulfur, hydrogen, carbon, oxygen, and nitrogen, respectively.
The performance of each individual plant block can be expressed by means of the exergy utilization parameter λ, which is defined as the ratio between the sum of all exergy output from the block relative to the exergy input. It gives an idea of the degree of thermodynamic reversibility of the processes taking place in that block, and it must be evaluated together with the relative weight of the exergy destruction of that block with respect to the total of the plant, or exergy destruction contribution δ, for a comprehensive understanding.
λ j = W ˙ j , o u t + o u t E ˙ i , j | W ˙ j , i n | + i n E ˙ i , j
δ j =   I ˙ j I ˙ j
The overall exergy efficiency is defined as the ratio of the useful effect and the exergy input to the plant (provided by the coal). As a useful effect, the net power output is usually considered. However, for the plants with CCS, the exergy leaving the plant as high-purity CO2 can be considered useful, if such a stream could later be employed in a subsequent chemical plant (e.g., through the Sabatier reaction), redefining the exergy efficiency as follows:
ξ = W ˙ n e t E ˙ c o a l = 1   I ˙ j + E ˙ o u t E ˙ c o a l       ξ = W ˙ n e t + E ˙ C O 2 E ˙ c o a l

3. Results

In this section, the results for the power plant simulations are given. A thermal analysis, power breakdown, and emission performance is shown, and subsequently, the exergy analysis results for the different power plants are detailed.

3.1. Plant Power Breakdown and CO2 Emissions Performance

Table 1 shows the results of the models for the different power plants considered. It can be seen that the energy penalty associated with CO2 capture is approximately 10% points for the precombustion CO2 capture plant. The low thermal efficiency results in an elevated SPECCA index and a CO2 avoided approximately 3% points below the capture rate of the plant. The benchmark plants show similar performances to [22].
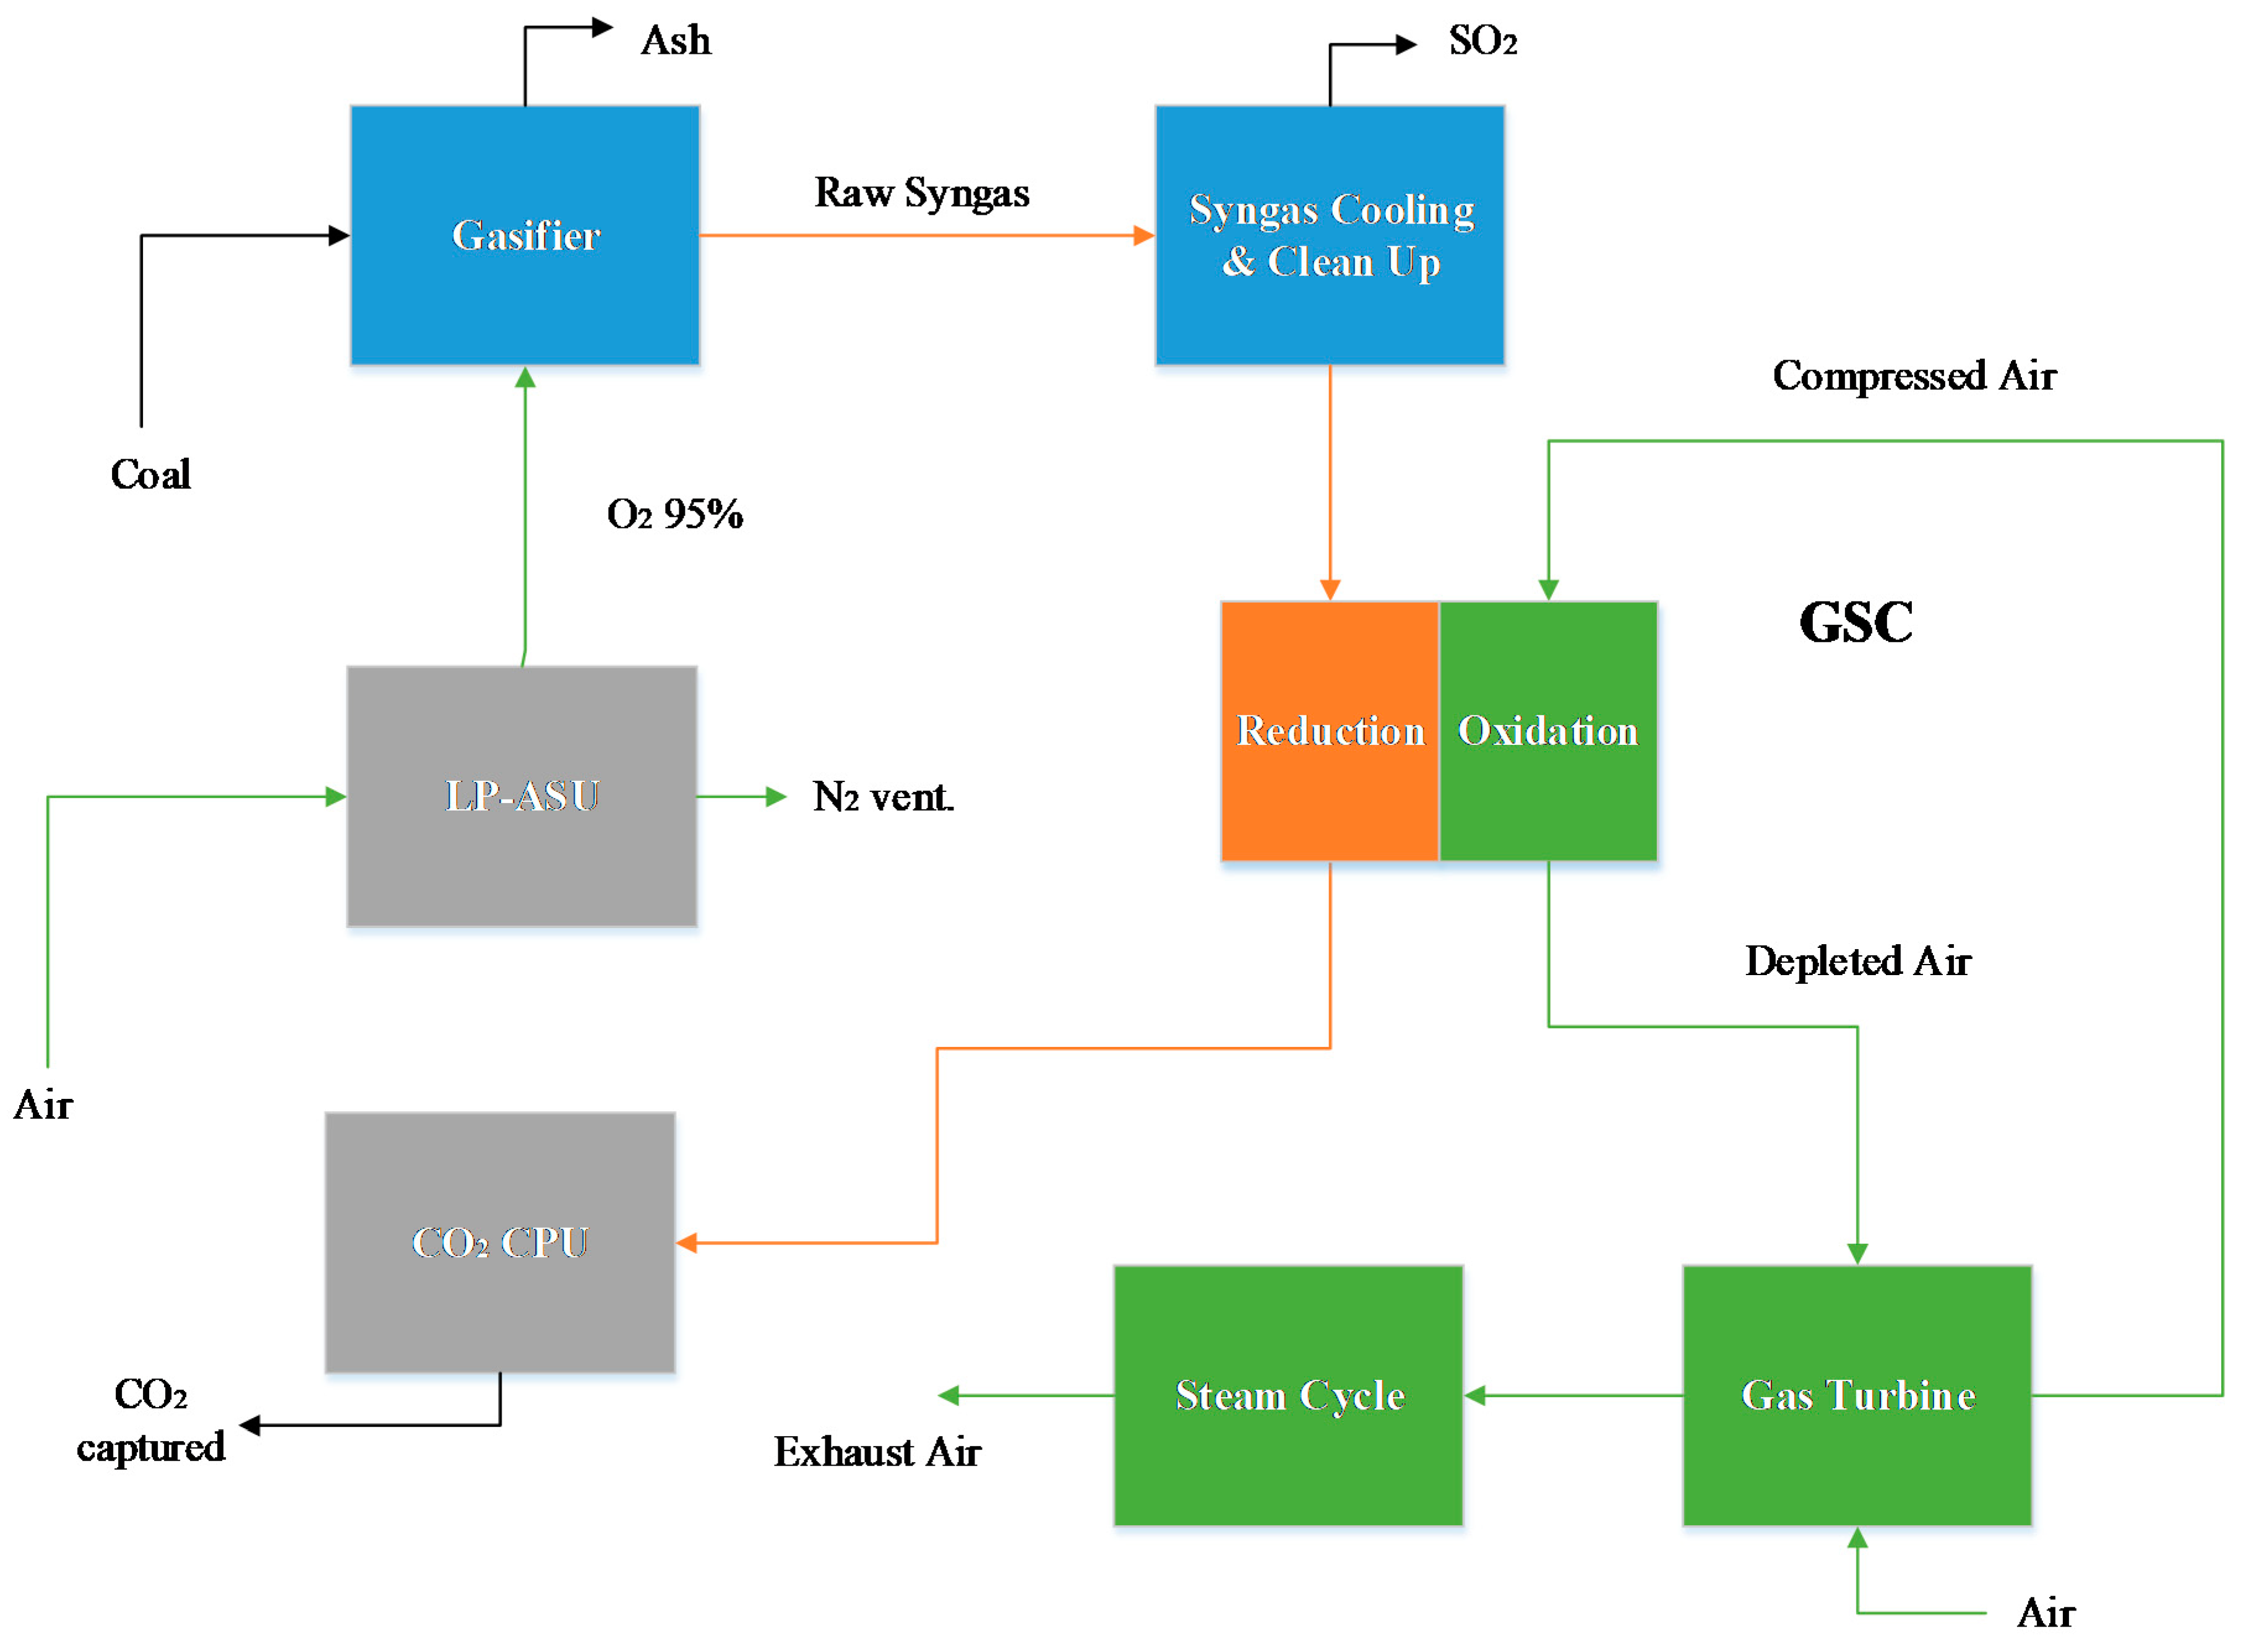
The GSC IGCC plant presents an energy penalty of approximately 4% points and a high capture rate. CO2 emissions (lock hopper venting, coal drying, GSC mixing, and CPU vent) result in a capture rate comparable to the precombustion plant, but with a higher CO2 avoided and lower SPECCA index due to the higher thermal efficiency. It is noteworthy to mention the lower auxiliary consumption for this plant, as no N2 compression is required to avoid NOx emissions. The flameless combustion in CLC has the intrinsic advantage of eliminating entirely this hazardous contaminant from these plants. Furthermore, the CO2 compression duty is reduced relative to the precombustion CO2 capture model, since the reduction gases are pressurized, requiring only two compression stages (and pump) to reach the delivery pressure. The efficiency results are comparable to the values obtained in [21].
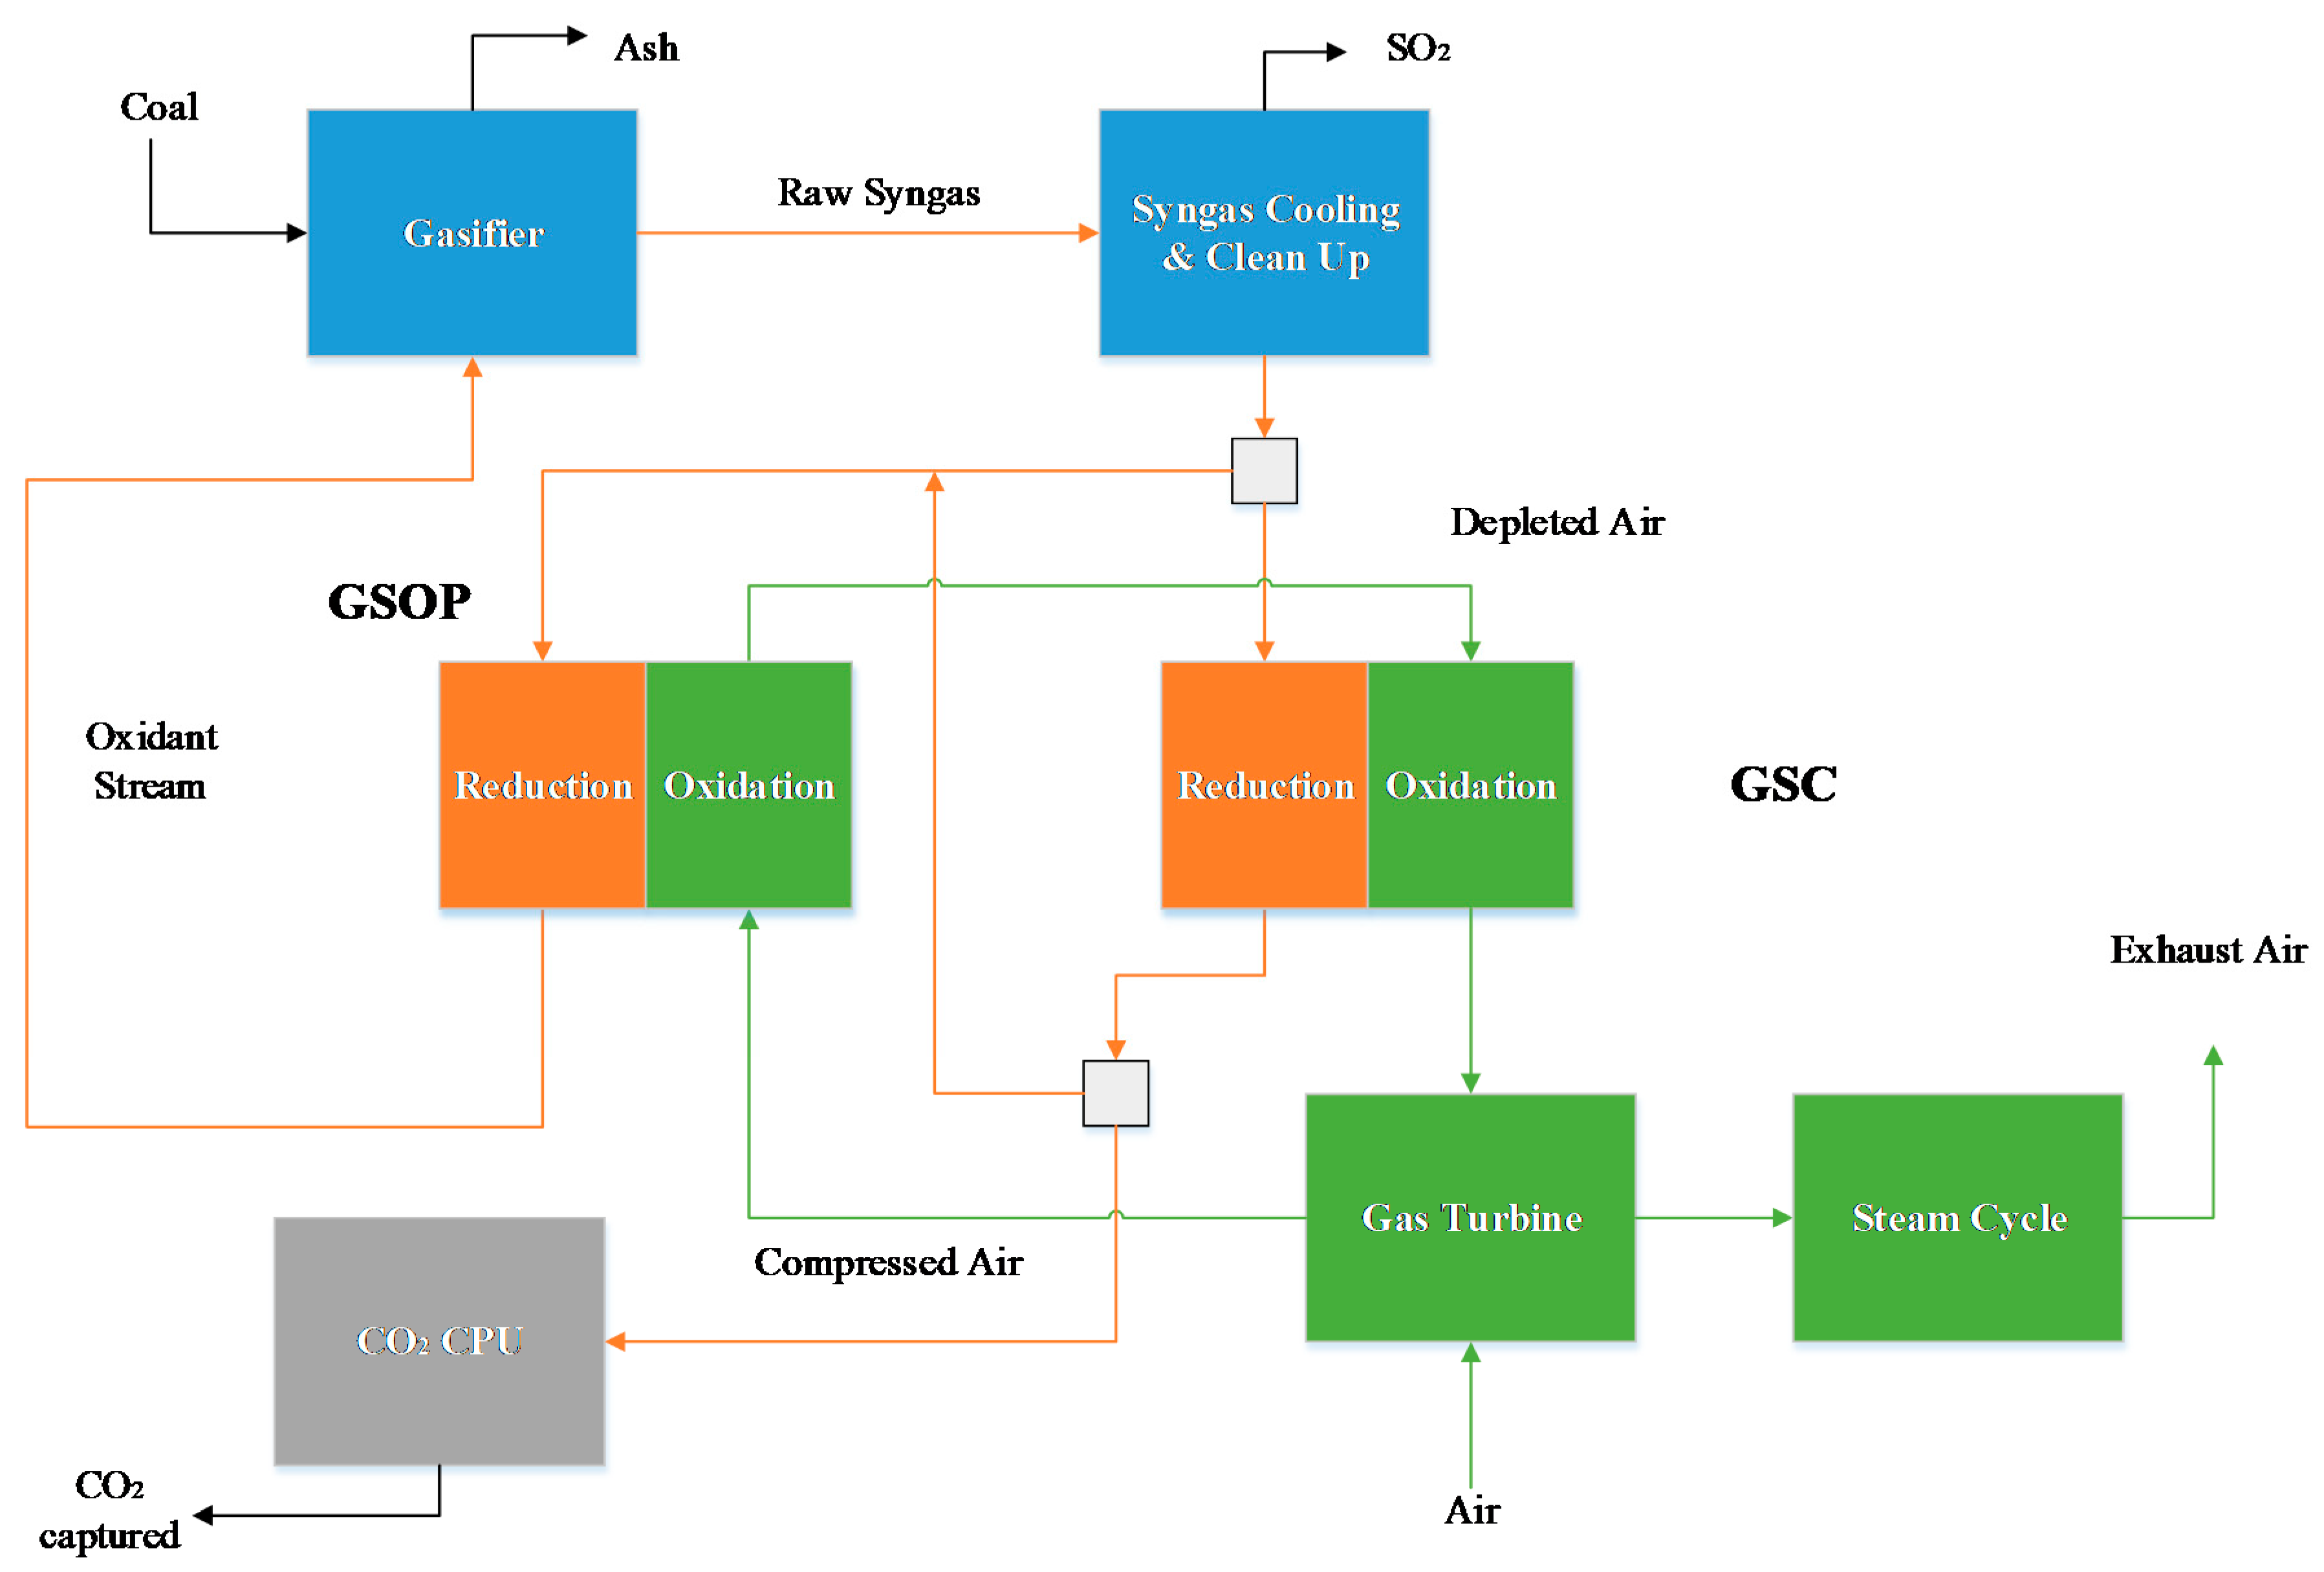
For the GSOP–GSC IGCC plant, the energy penalty is minimal: around 1.3% points. The high electrical efficiency yields a CO2 avoidance similar to the actual capture rate of the plant (note that the carbon conversion for the Winkler gasifier is lower than the Shell gasifier used in the unabated IGCC benchmark, leading to less CO2 production), and yields SPECCA indexes below 0.5 MJ/kg of CO2 captured. The energy penalty imposed by air separation units and N2 compression is very pronounced in the benchmark models (they constitute the major auxiliary consumption of these plants, approximately 80% for the unabated case). In the GSOP–GSC plant, these items are avoided and, in combination with the lower CO2 compression duty, the total auxiliary consumption is approximately 30% of that of the precombustion CO2 capture plant. The combination of the lower TIT reached with GSC cluster and the fact that the reduction gases’ GSC outlet is not expanded, (some of the heat is effectively recovered as useful work by raising steam in the hot gases heat recovery unit), results in a larger proportion of the power output being delivered by the steam cycle relative to the gas turbine compared to the reference plants. The precombustion CO2 capture model shows the lowest steam power output, as a substantial amount of IP steam is extracted and delivered to the WGS unit. As shown in Table 1, the lower TIT of the GS plants results in a higher flow rate across the turbomachinery elements for the same total heat input, while the exhaust flow is reduced due to the subtraction of O2 in the GS clusters.
Finally, when comparing the GSOP–GSC IGCC plant to the results shown in [10], where packed bed reactors are used, several aspects can be noted. The greater O2 concentration difference achieved in the GSOP reactors results in an oxidizing stream with a higher oxygen purity (23.0% mol compared to 16.8% mol), and the resulting syngas has a smaller flow rate and higher heating value comparatively. As a consequence, the heating value of the syngas can be more effectively employed in heating a higher mass flow rate of air through the gas turbine, while less HP steam is generated in the SEC. A slight efficiency improvement and a shift of power output toward the topping cycle is observed. Additionally, the different GSOP cluster operation alters the relative fractions of syngas to the GS reactors. In this study, for the HGCU case, approximately 32% of syngas was routed to the GSOP, while the reduction gases’ recirculated fraction was around 19%. Overall, the syngas mass flow rate was 20% lower than [10], with a 21% higher LHV. The CO2 capture ratio is to some extent reduced by the fluidized bed operation of the GS clusters. Since the gasifier, GSOP, and GSC cluster are highly integrated, it is not possible to resort to a N2 recycle from the HSRG outlet as in the GSC IGCC plant, and consequently, the high capture rate and high oxidation outlet temperatures that lead to high efficiencies cannot be achieved simultaneously. Alternative strategies such as purging with steam have been proposed to reduce the degree of mixing, reaching capture rates above 90% while sacrificing power output from the bottoming cycle, as described in [5].

3.2. Power Plant Exergy Analysis

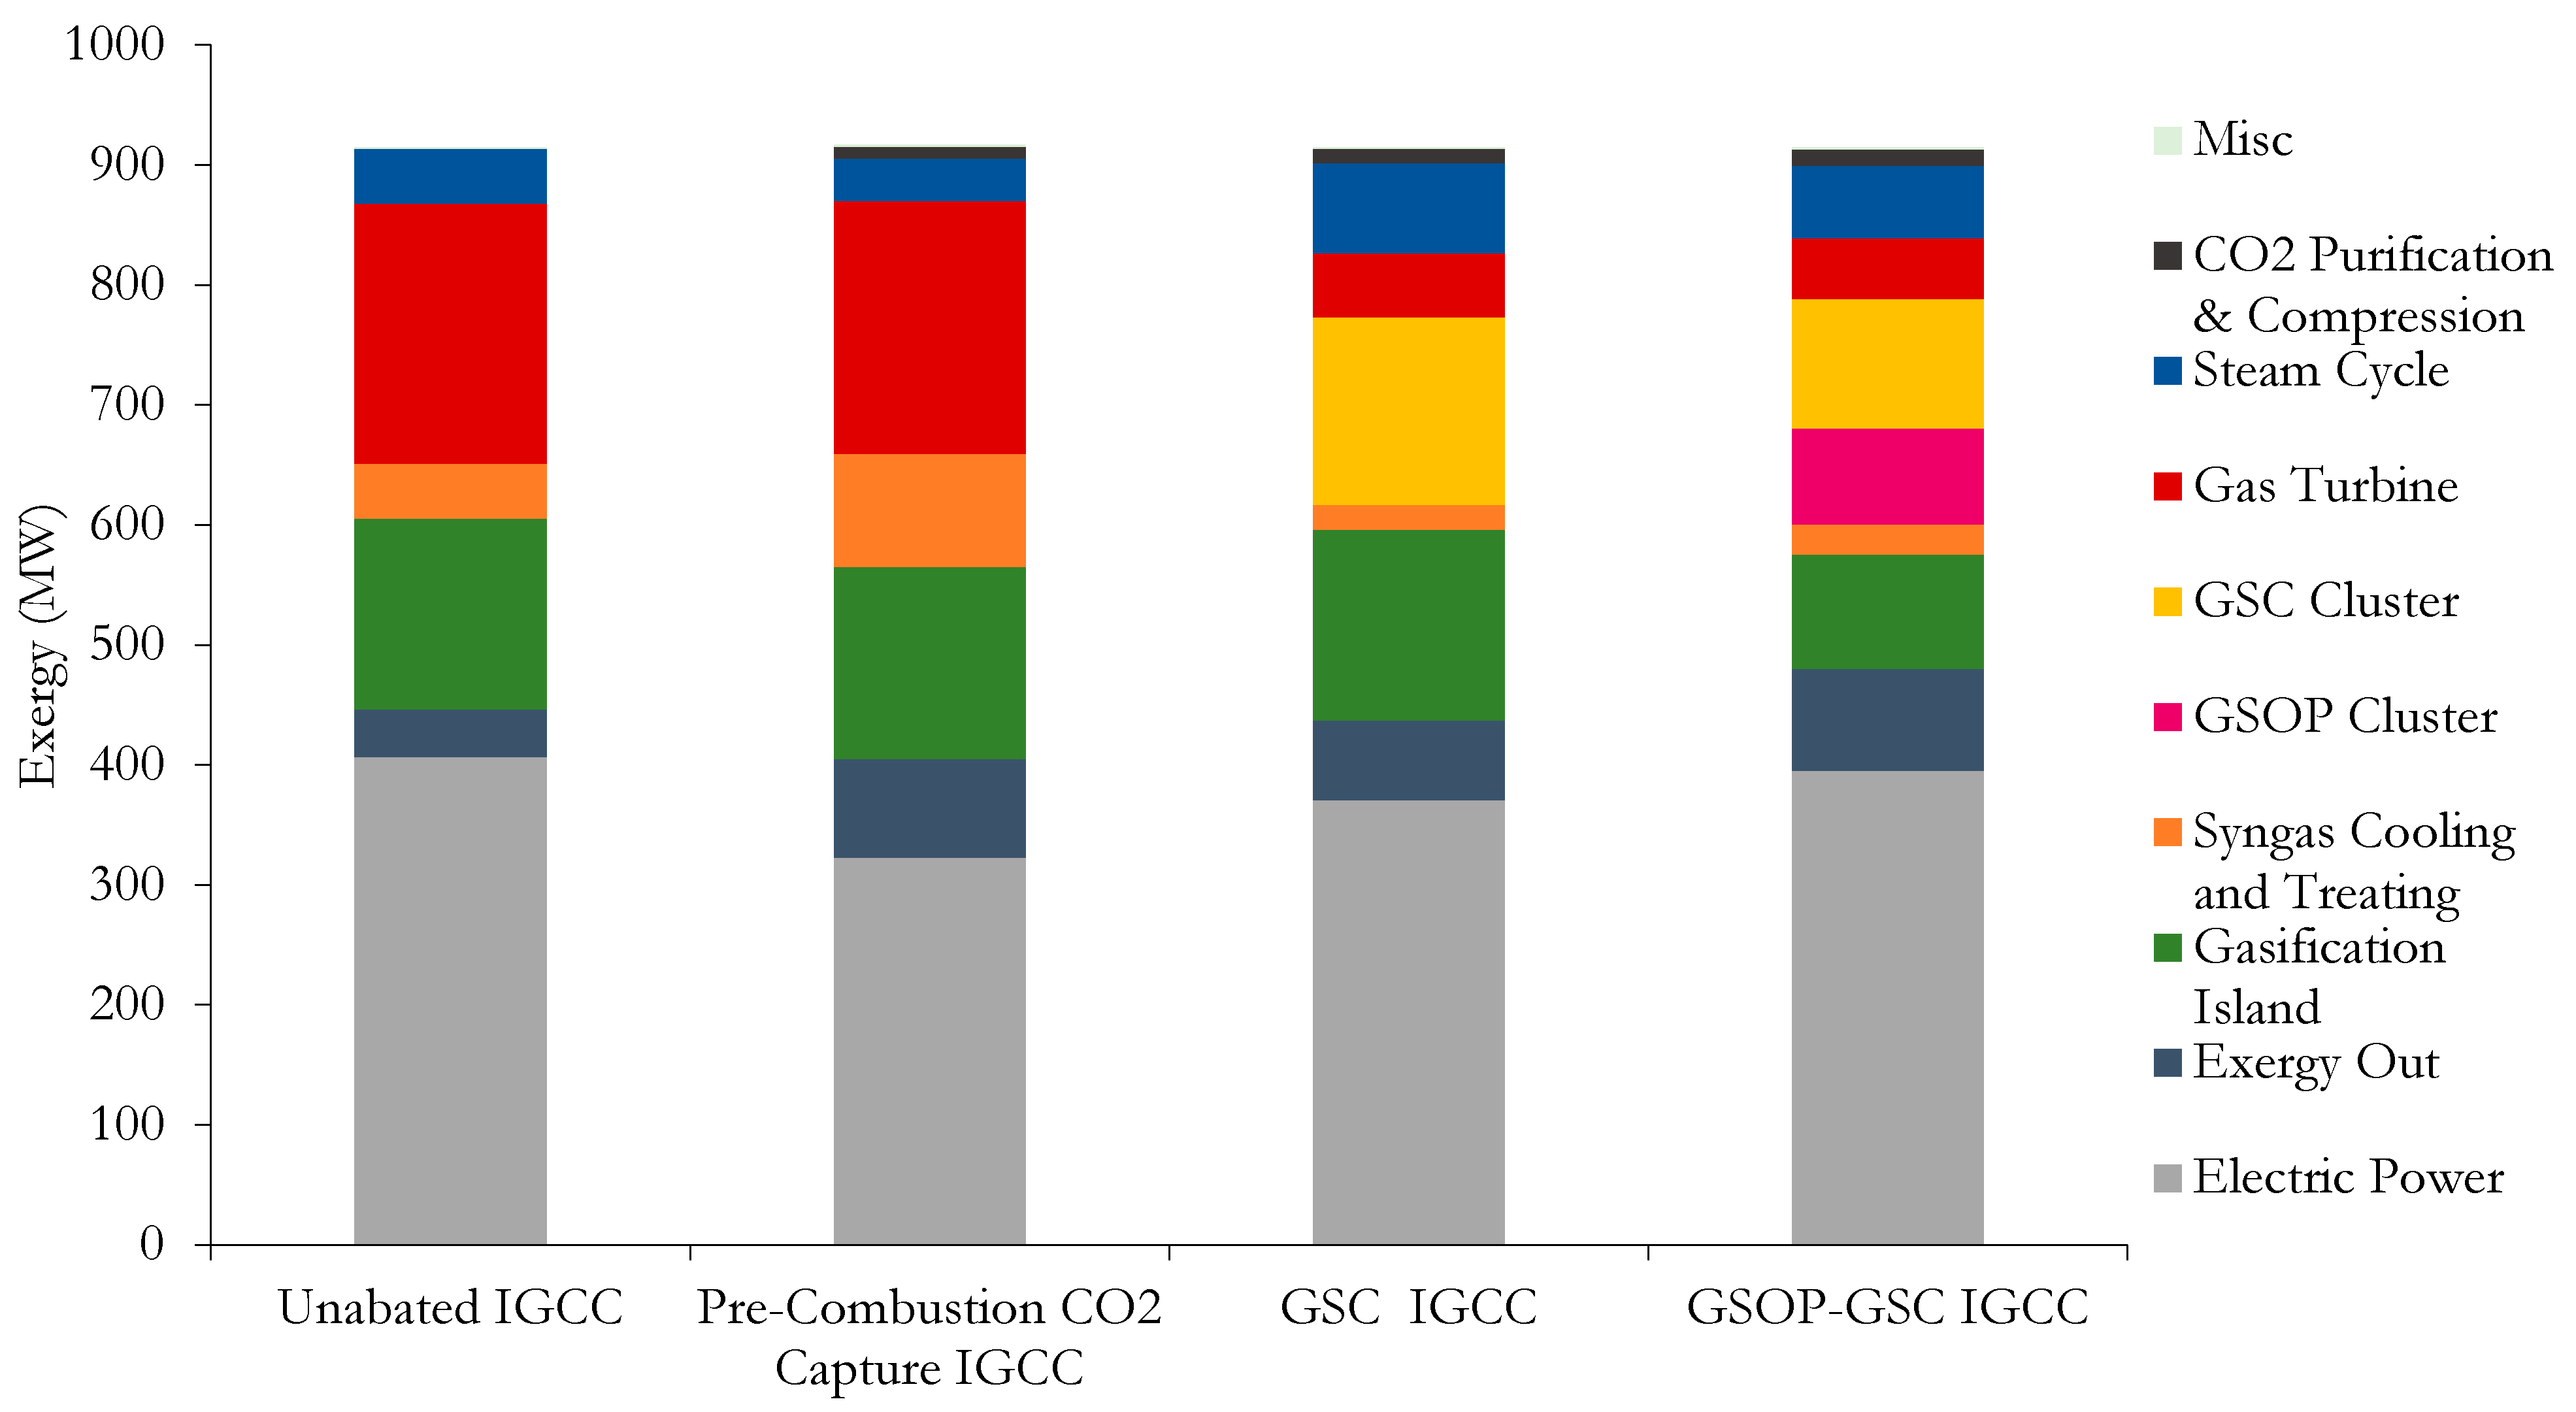
Employing the analysis procedure described in the second section, the different power plant losses were identified for each of the models employing GS technology and the benchmarks. The total exergy breakdown (in MW) is given in Figure 7, showing the electrical power output, the total exergy destruction of each power plant block, and the exergy flows leaving the plant. The “Exergy Out” block includes the main exergy flows that leave the power plant: slag from the gasifier, the exhaust gases from the HSRG outlet, the CO2 stream for the plants with CCS, and a group of different minor outlet streams such as water, H2S in the precombustion capture plant, vented N
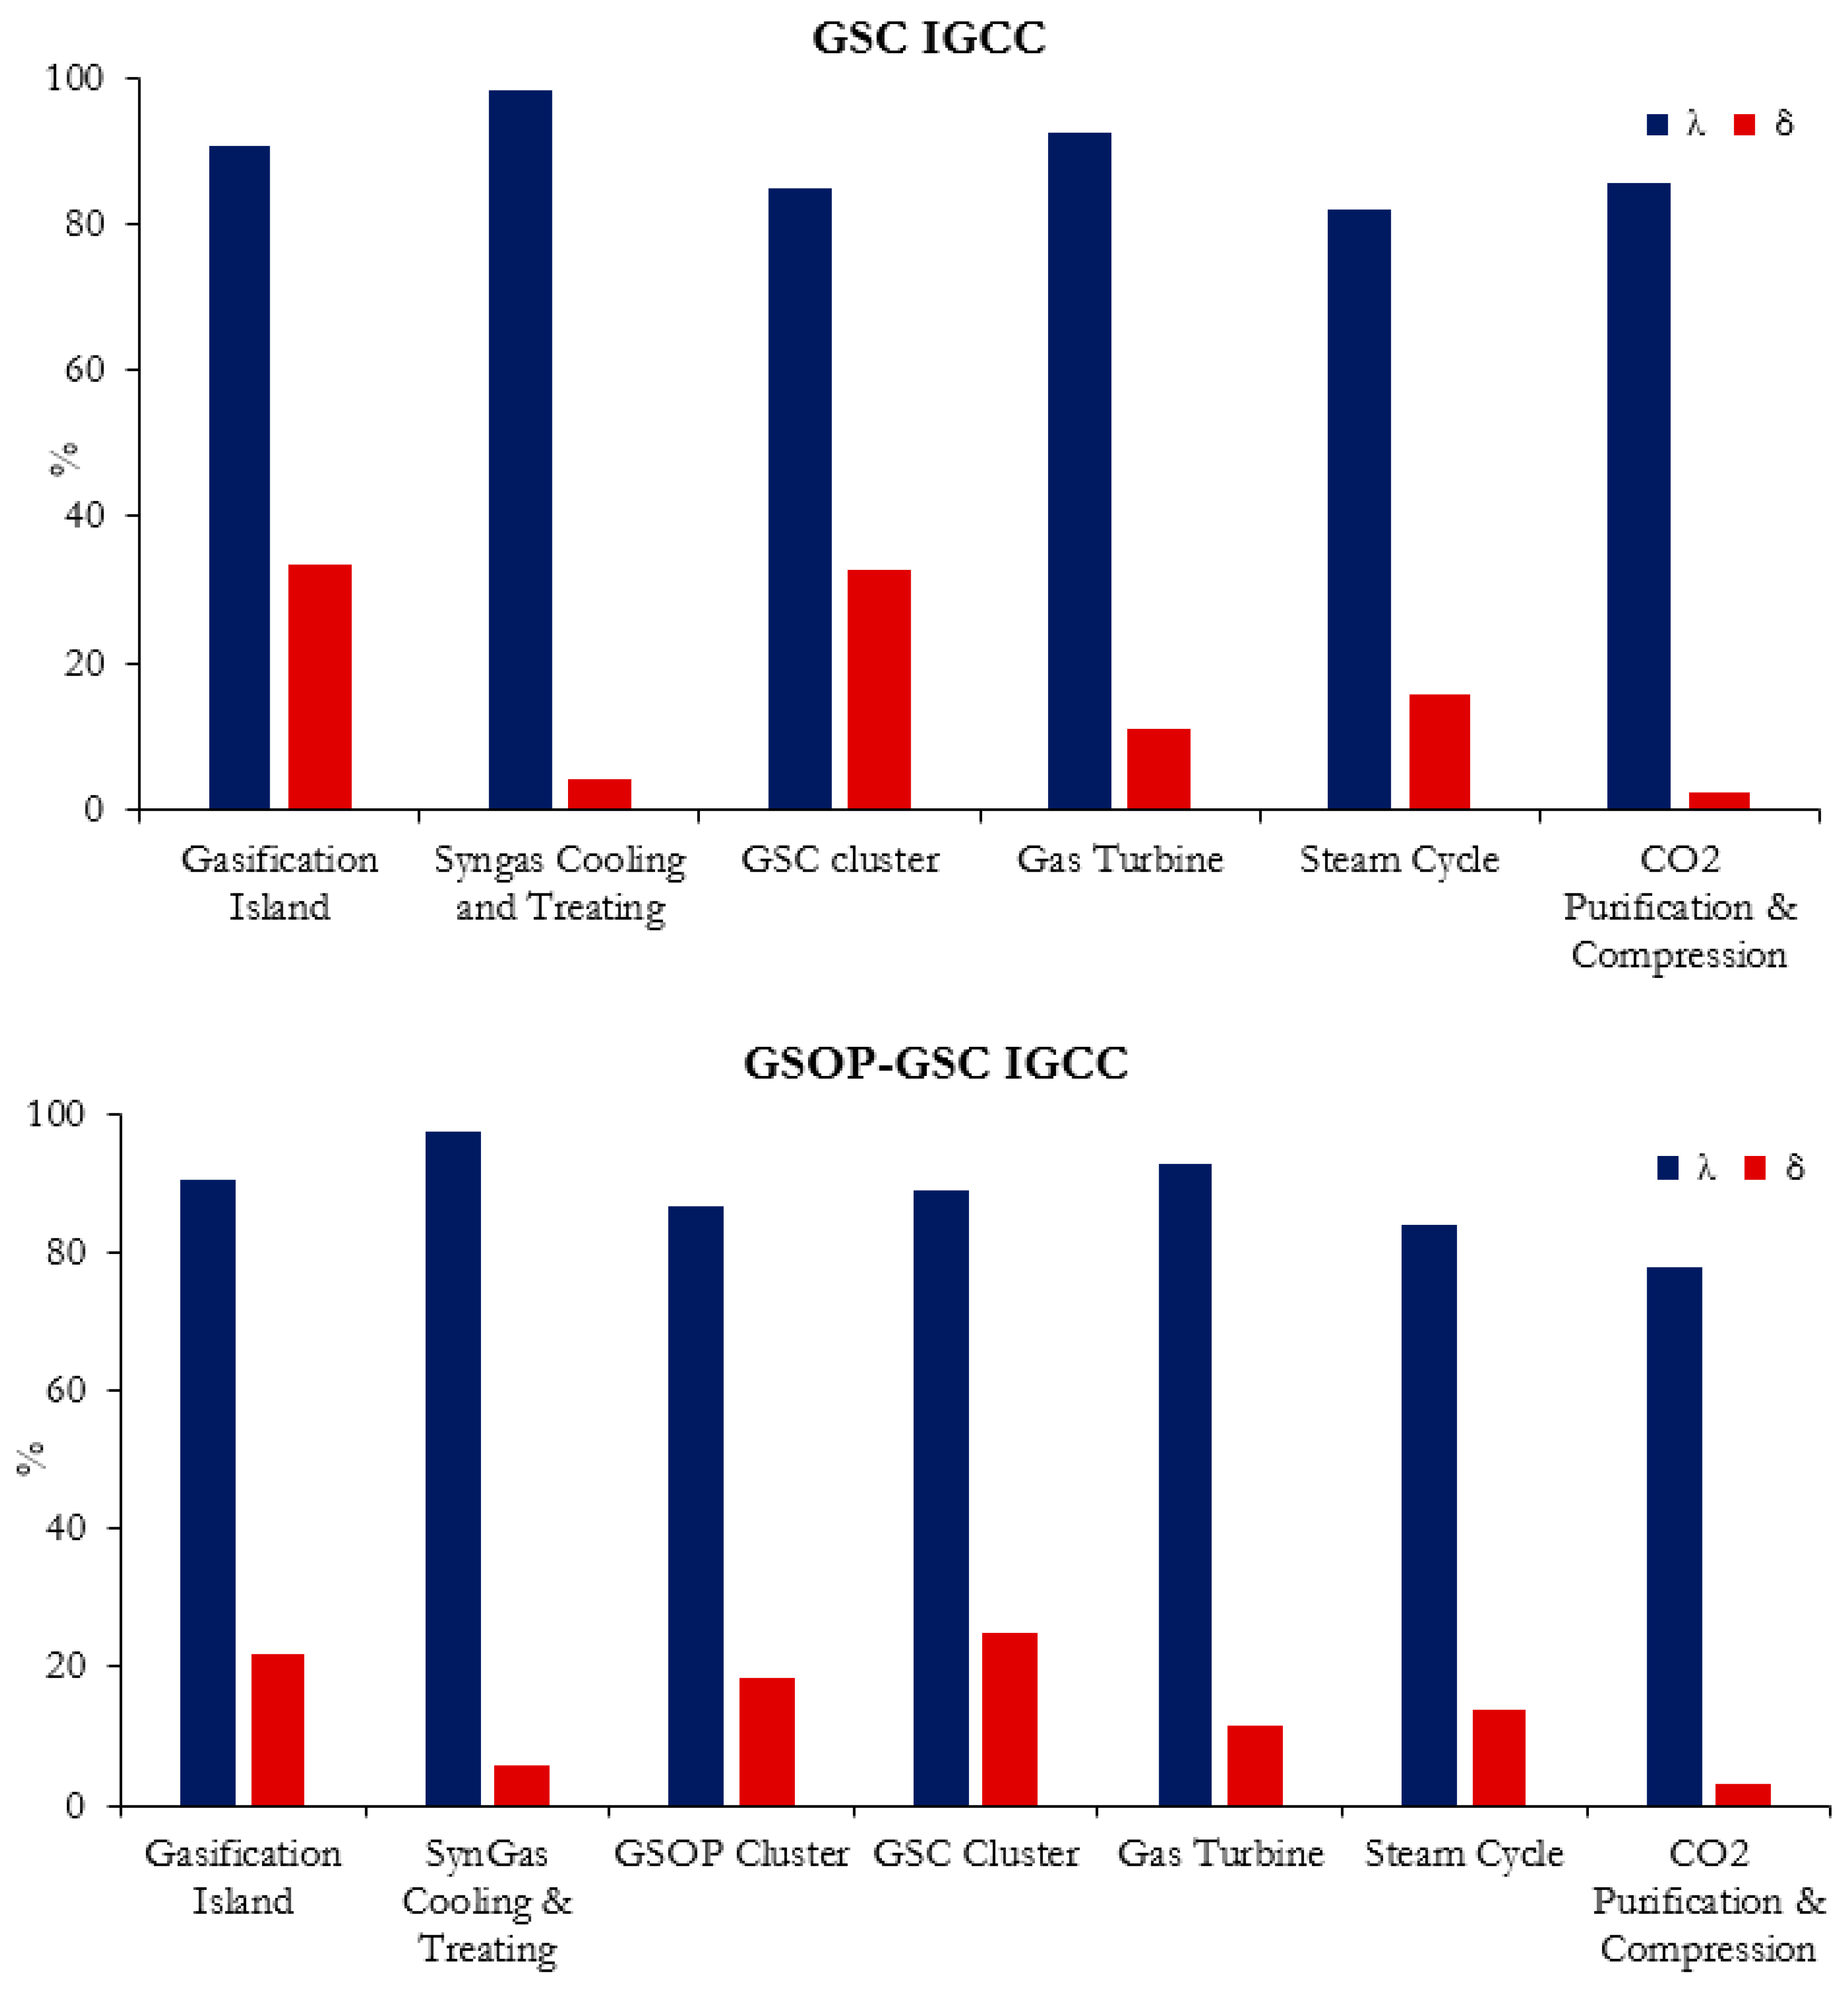
2 from the ASU, etc. The exergy utilization and exergy destruction contribution in percent is subsequently given in Figure 8 and Figure 9 for the benchmark and GS plants, respectively. The power plant losses are grouped in representative blocks of the different sections of the plant. The gasification island includes the gasification unit (with gas quench) and the ASU (if present). The syngas cooling and treating block include all the unit operations from syngas effluent coolers, candle filters, and syngas scrubbing, low-temperature heat recovery and desulfurization, the HGCU for the gas switching chemical looping plants, syngas boosters, fuel saturator and heating, and in the case of the precombustion model, the WGS unit. The gas turbine includes the compressor, combustion chamber, and turbine. For the plants with GS technology, lacking a combustion chamber or ASU, the GS clusters are shown separately. The steam cycle elements include the main HSRG, the condenser, the deaerator feedwater tank and pumps, the steam turbine, and the hot reduction gas recovery unit for the GS plants. The CO2 compression and purification unit comprises the reduction gases condenser for water knock out, the two flash vessel purification units for the GS plants, and the CO2 pump. For the precombustion CO2 capture model, the five-stage intercooled compressor is accounted for here. The detailed summary of the different process units considered in each power plant block with their respective exergy losses (total and percentage) is provided in Table A6 in Appendix A.
Taking a close look at the benchmark models’ exergy breakdown, it can be seen that most of the exergy destruction occurs in the gasifier and gas turbine (combustion chamber primarily), where the chemical degradation of the fuel takes place. Similar losses are found between the two models due to the similar assumptions made for these plant items. The high-exergy utilization of the gasifier island (>90%) is due to the large amount of incoming exergy to this plant section, although the exergy loss contribution surpasses 30%. The gas turbine presents a low-exergy utilization (around 70%) with a high overall loss contribution (approximately 45%). With regard to the precombustion CO2 capture IGCC model, substantial losses are incurred upon by adding the shift reaction step and the acid gas removal unit (AGRU), increasing the loss contribution of this block by around 10% points, and duplicating the exergy losses in this section relative to the unabated IGCC plant. A large portion of the steam is supplied to the WGS unit; therefore, the steam cycle losses are somewhat lower comparatively. Since the precombustion CO2 capture IGCC plant delivers a pure CO2 stream at 150 bar, it can be seen in Figure 7 that the exergy flow leaving the system is twice the amount of the unabated IGCC model, where the only source of exergy flow leaving the plant are the exhaust gases from the HSRG and to a lesser extent the slag and captured sulfur in the absorption treating unit.
On the other hand, for the GSC IGCC plant, it can be observed that the losses due to the GT are greatly reduced as the combustion chamber is removed, and the exergy utilization of this block significantly increases by more than 20% points. The turbomachinery elements show a different distribution of losses due to the different TIT with respect to the reference plant. The combustor losses are taken up to a great extent by the GSC cluster, with an exergy utilization and loss contribution of approximately 84% and 33%, respectively. While the gasification island remains unchanged, the effect of employing an HGCU system reduces the losses of the syngas cooling and treating section by half, relative to the unabated IGCC model. As the power ratio in the GS chemical looping plants shifts toward the steam cycle, it is observed that this item takes a greater portion of the overall exergy destruction. The extra heat recovery unit for the GSC reduction outlet and the N2 cooler also contribute significantly to this increase, reducing the exergy utilization and increasing the loss contribution relative to the unabated benchmark plants by around 3% points and 5% points, respectively. Since the exhaust gases are cooled down and recycled to the GT compressor, and all the exergy in the sulfur is assumed to be lost (as full H2S combustion takes place during absorption and regeneration), the fraction of exergy leaving the plant is reduced compared to the precombustion CO2 capture model, given that both have similar CO2 exergy output. In addition, the condensation of the reduction gases for the GSC-IGCC plant slightly increases the losses due to CO2 purification and compression, compensating for the lower compression requirements of the CO2 CPU compared to intercooled compressor of the precombustion CO2 capture model, and resulting in around 7% points higher exergy utilization, but overall with a slightly higher exergy loss contribution of around 1% point.
When analyzing the GSOP–GSC plant and comparing it to the GSC IGCC model, a great reduction in the gasifier island total exergy destruction is observed. Although the exergy utilization is similar, a reduction in the exergy loss contribution of more than 10% points is achieved. This is due to several factors: the most obvious one is the removal of the ASU with a high auxiliary consumption. Secondly, the gasification taking place with a hot oxidant stream delivered by the GSOP and occurring at lower temperature relative to the entrained flow shell gasification plants results in a better overall conversion of coal into syngas, reducing the amount of heating value in the original fuel, which is downgraded into steam. The syngas cooling and treating losses are similar to the GSC IGCC plant: although a bigger syngas booster is required to overcome the pressure losses in the Winkler gasifier–GSOP loop, in the GSC IGCC plant, a high irreversibility occurs during the pressure letdown of the syngas from the shell gasifier to GSC pressure, which suggests that a syngas expander after HGCU can be an effective way to minimize these losses. The losses that are caused by the conversion of syngas are now distributed between GSOP and GSC clusters, which increase the temperature of the compressed air sequentially with the heat released in the oxidation stage, resulting in a similar exergy utilization as in the cluster of the GSC IGCC plant. An overall greater exergy loss between both clusters relative to the GSC IGCC plant is observed, since the recirculation of some reduction gases from the GSC reduction outlet to the GSOP results in a mixing of streams at significantly different temperatures. The GT shows a minor improvement as the compressor inlet is at a lower temperature than the recirculated (cooled) gases in the GSC IGCC model. The steam cycle has a lower exergy loss contribution, since the stack must not be further cooled and recycled; therefore, a higher portion of exergy leaves the system as hot HSRG exhaust. Although the capture rate is approximately 10% points lower, the exergy leaving the system is substantially higher. This is not only due to the aforementioned stack losses but primarily because of the larger exergy content of the slag leaving the gasification system. Notably, increasing the carbon conversion of the Winkler gasifier would lead to interesting efficiency benefits, as this exergy stream corresponds to around 3% of the total.
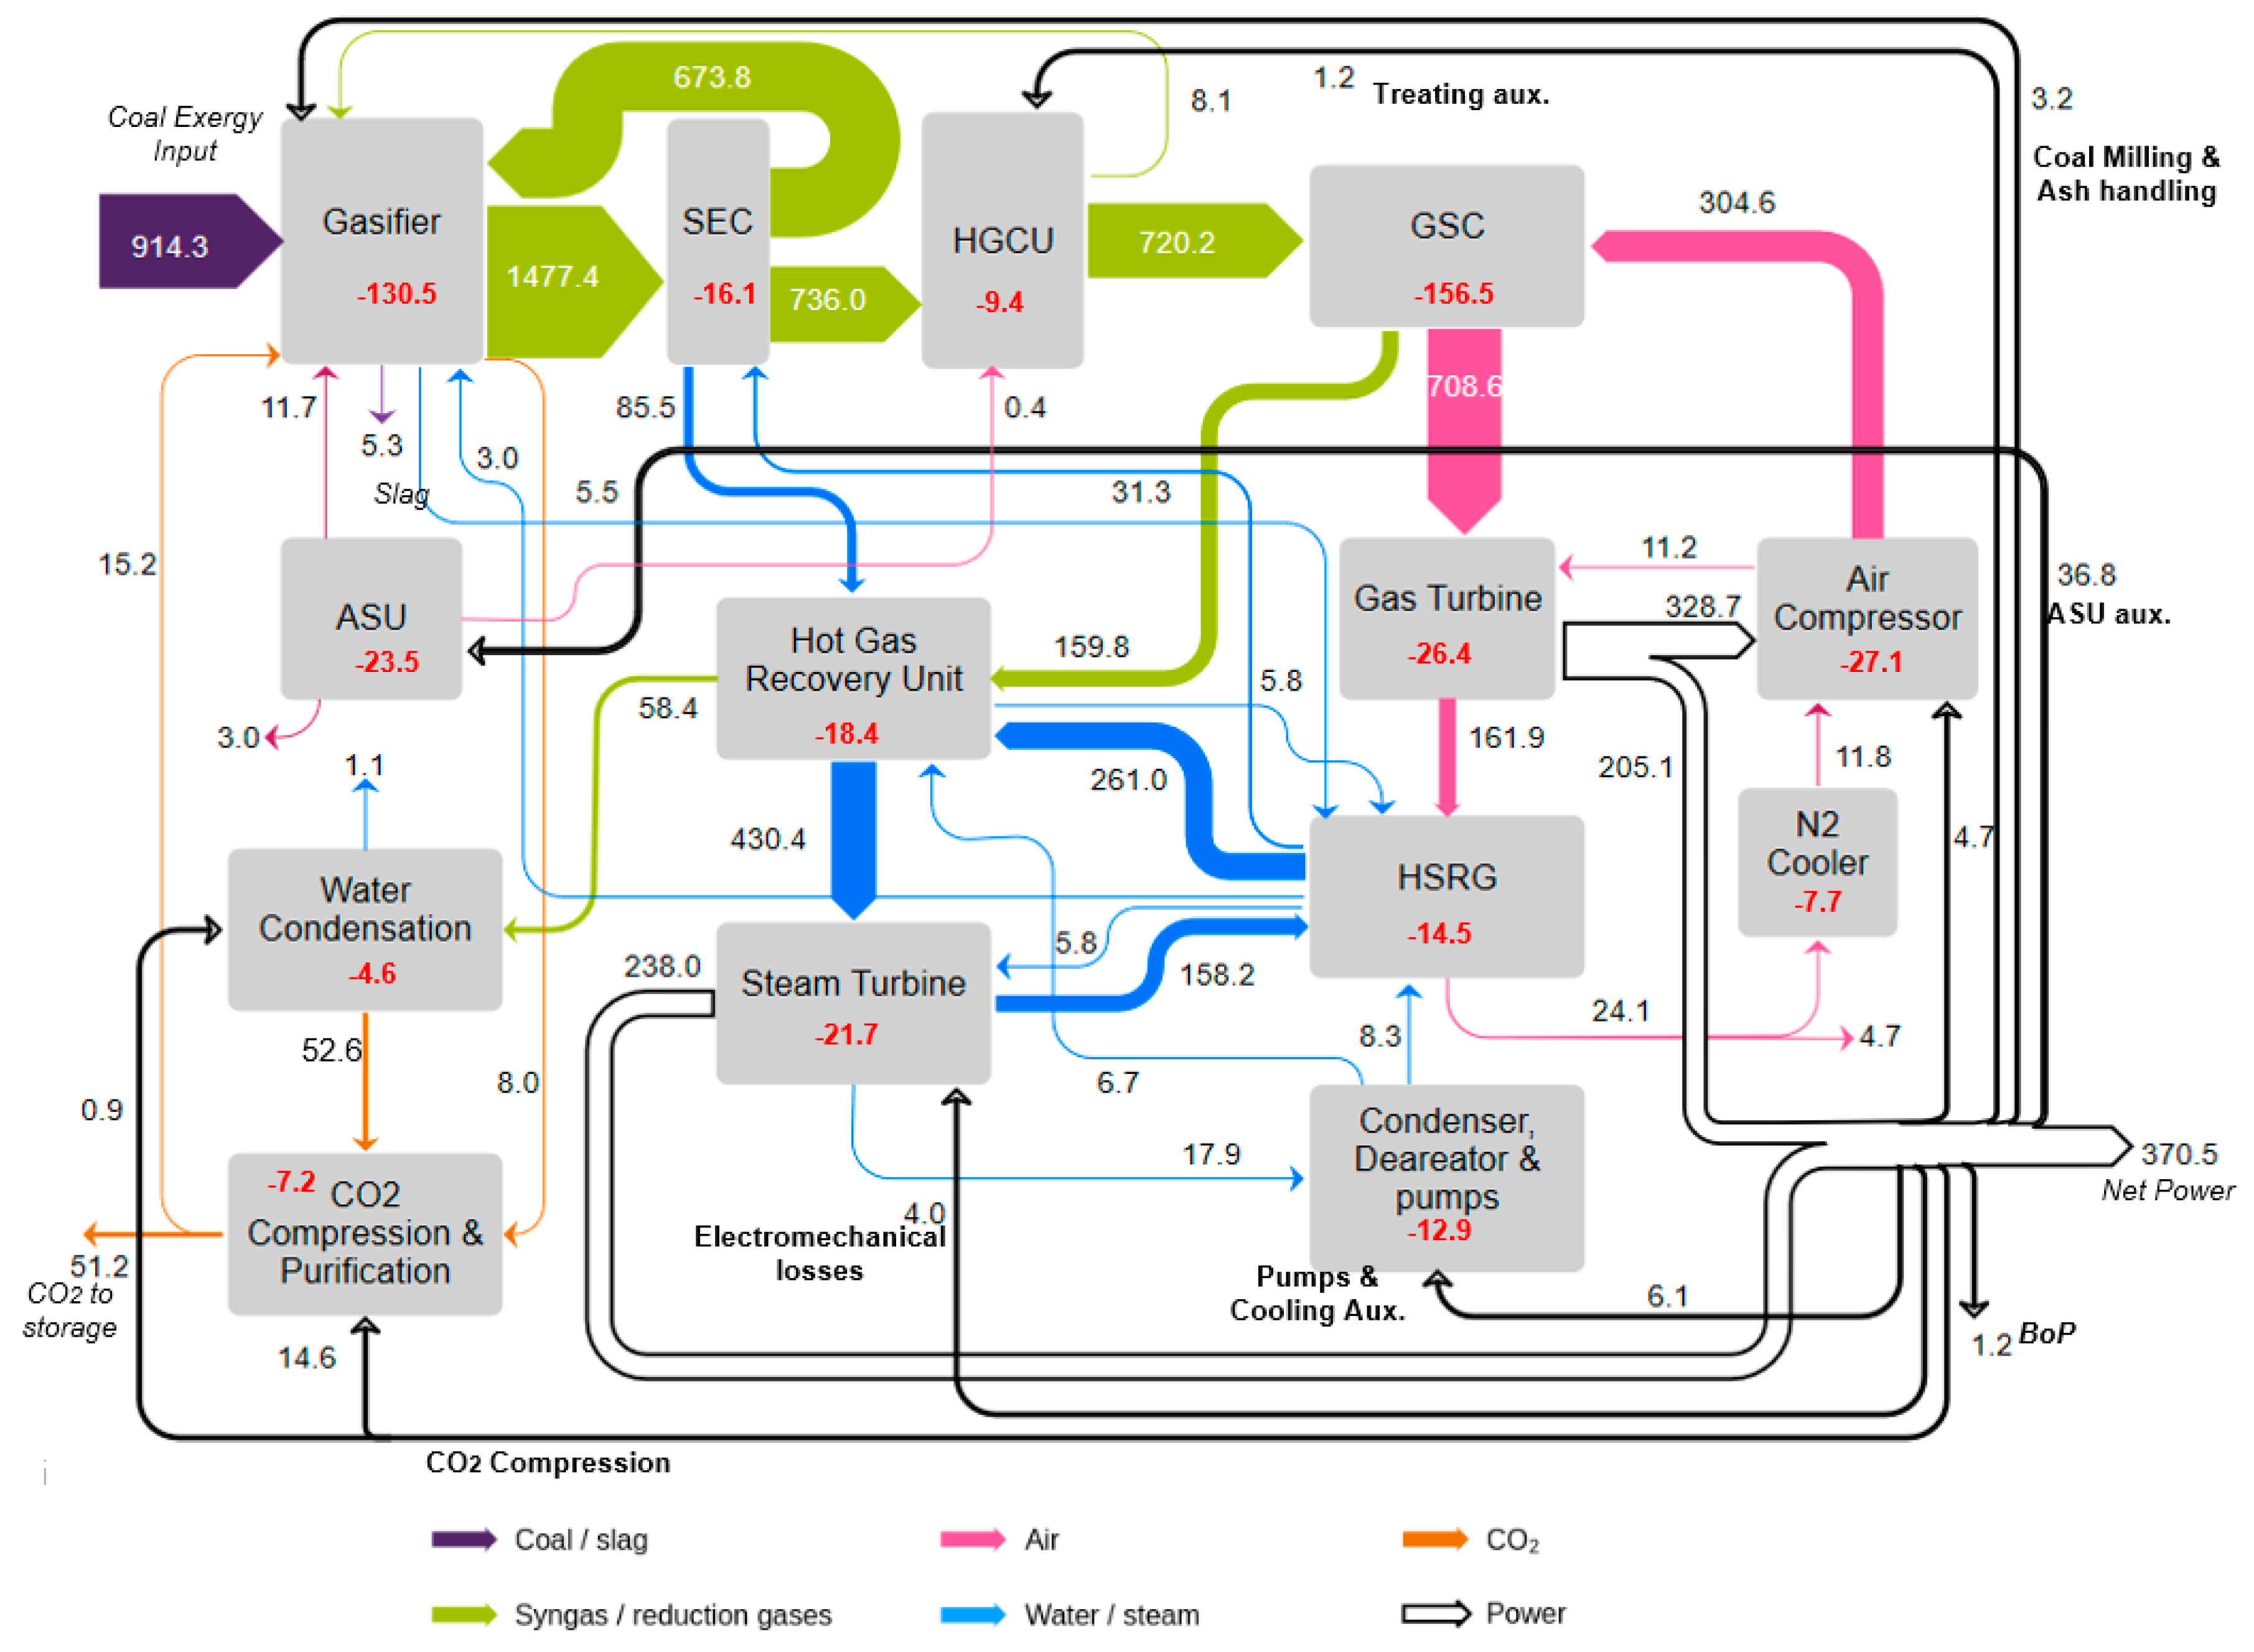
A relevant result observed from this study is that more exergy is destroyed in the hot reduction gases heat recovery unit than in the main HRSG (although the flow in the former is approximately one-sixth of the latter). These losses are due to the high temperature difference between the steam that is generated and hot reduction gases, despite the lower overall heat transferred compared to the HSRG. Alternative process line-ups could be conceived based on this insight. For instance, operation of the GT at a lower pressure ratio (to achieve a sufficiently high turbine outlet temperature (TOT) for steam superheating in the main HSRG) and syngas preheating with reduction gases outlet could be a possibility to be explored in future works. [21] shows the benefit of adding a recuperator between the hot gases and compressed air for a GSC IGCC plant with extra firing. Alternatively, a reduction gases expander could be employed, although a higher power demand and number of recompression stages for CO2 capture will lessen the attractiveness of this option. If the reduction gases have an increased flow due to a larger presence of water, which is condensed before CO2 compression (for instance in a configuration where syngas cooling is accomplished with a water quench), then the expansion of the reduction gases expander will likely be interesting, and the greater power output will compensate for the increased compression stages of the CO2. The improved benefits of a hot oxidant stream for gasification are manifest from the GSC-GSOP IGCC model, which suggests that the exergy contained in the reduction gases outlet of the GSC could be effectively invested in a coal pregasification step to enhance the CGE. Preheating to 300 °C of a coal–water slurry feed in an entrained flow gasifier showed substantial efficiency improvement [35]. These alternative configurations are left for future work.
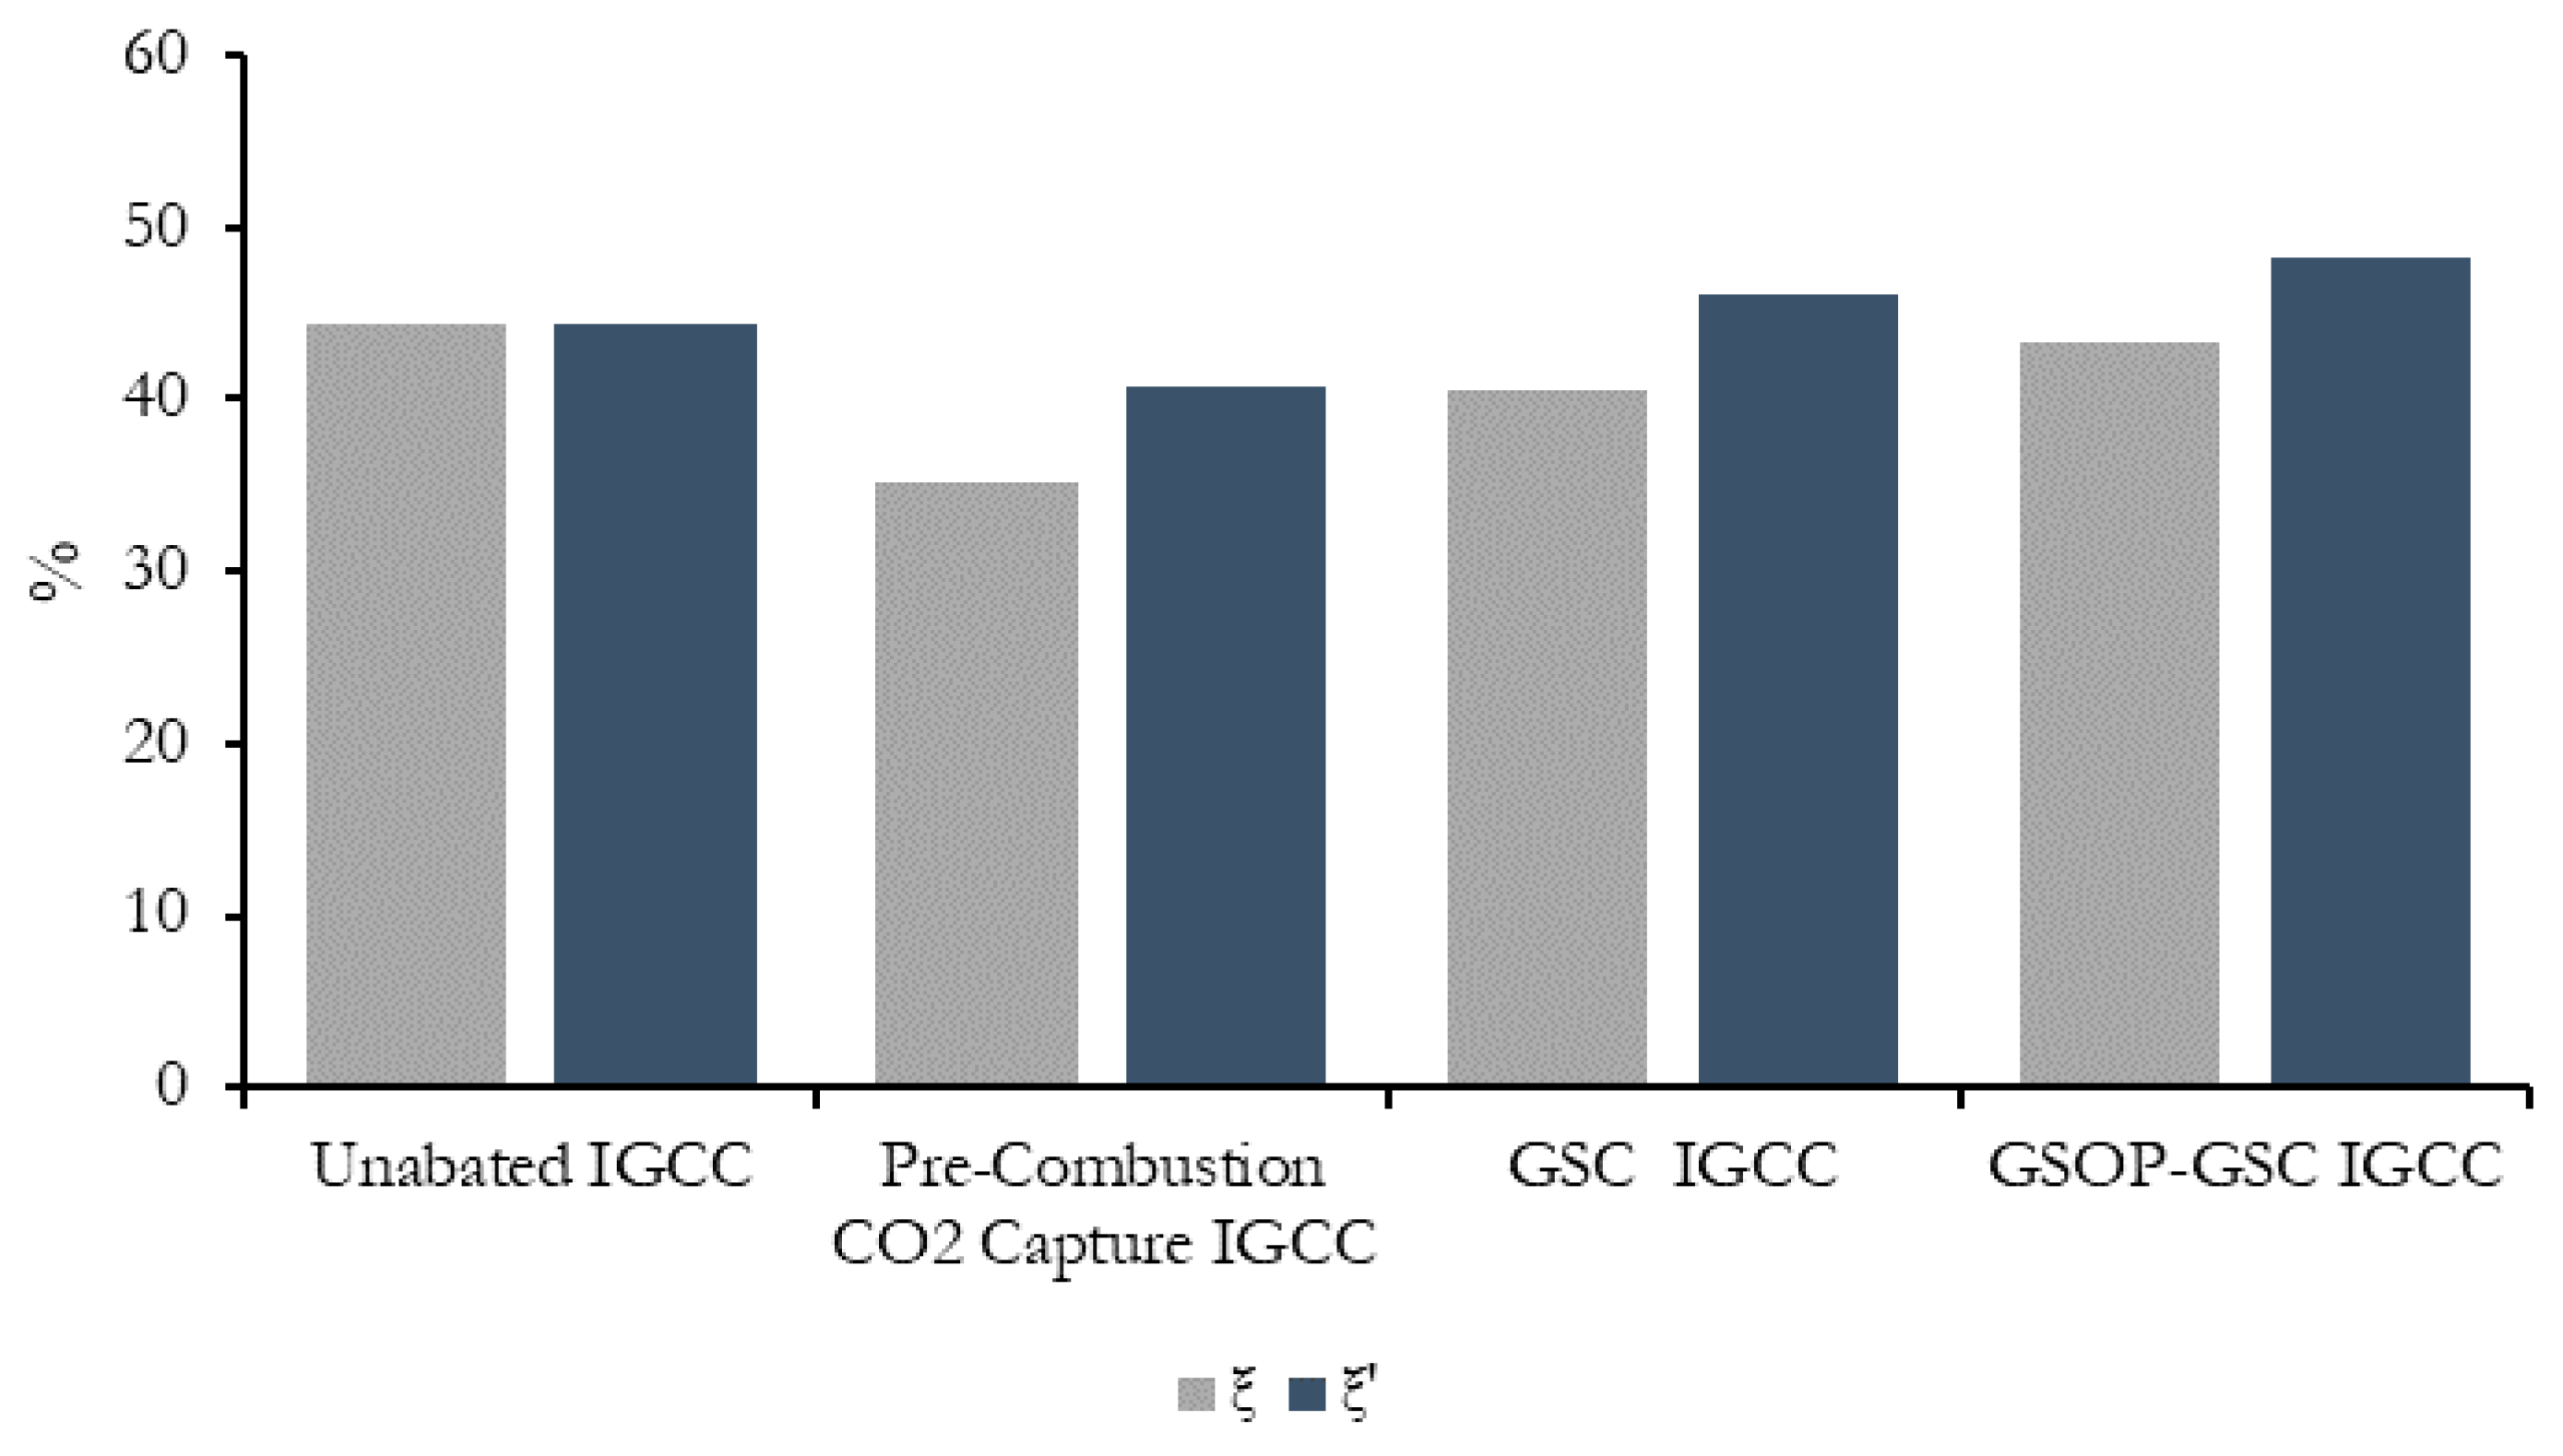
The overall exergy efficiency, based on the definitions presented in Equation (6), is compared in Figure 10, when the exergy-contained CO2 captured stream is considered as a useful effect, and when only the net power output is assumed. Since the chemical exergy of fuels predicted by Equation (3) is typically above the lower heating value, this latter exergy efficiency is around 3% points below the respective thermal efficiencies given in Table 1. Interestingly, considering the former exergy efficiency definition, the GSC IGCC and the GSOP–GSC plants with CO2 capture can outperform the unabated IGCC benchmark by around 1.5% and 3.5% points, respectively.
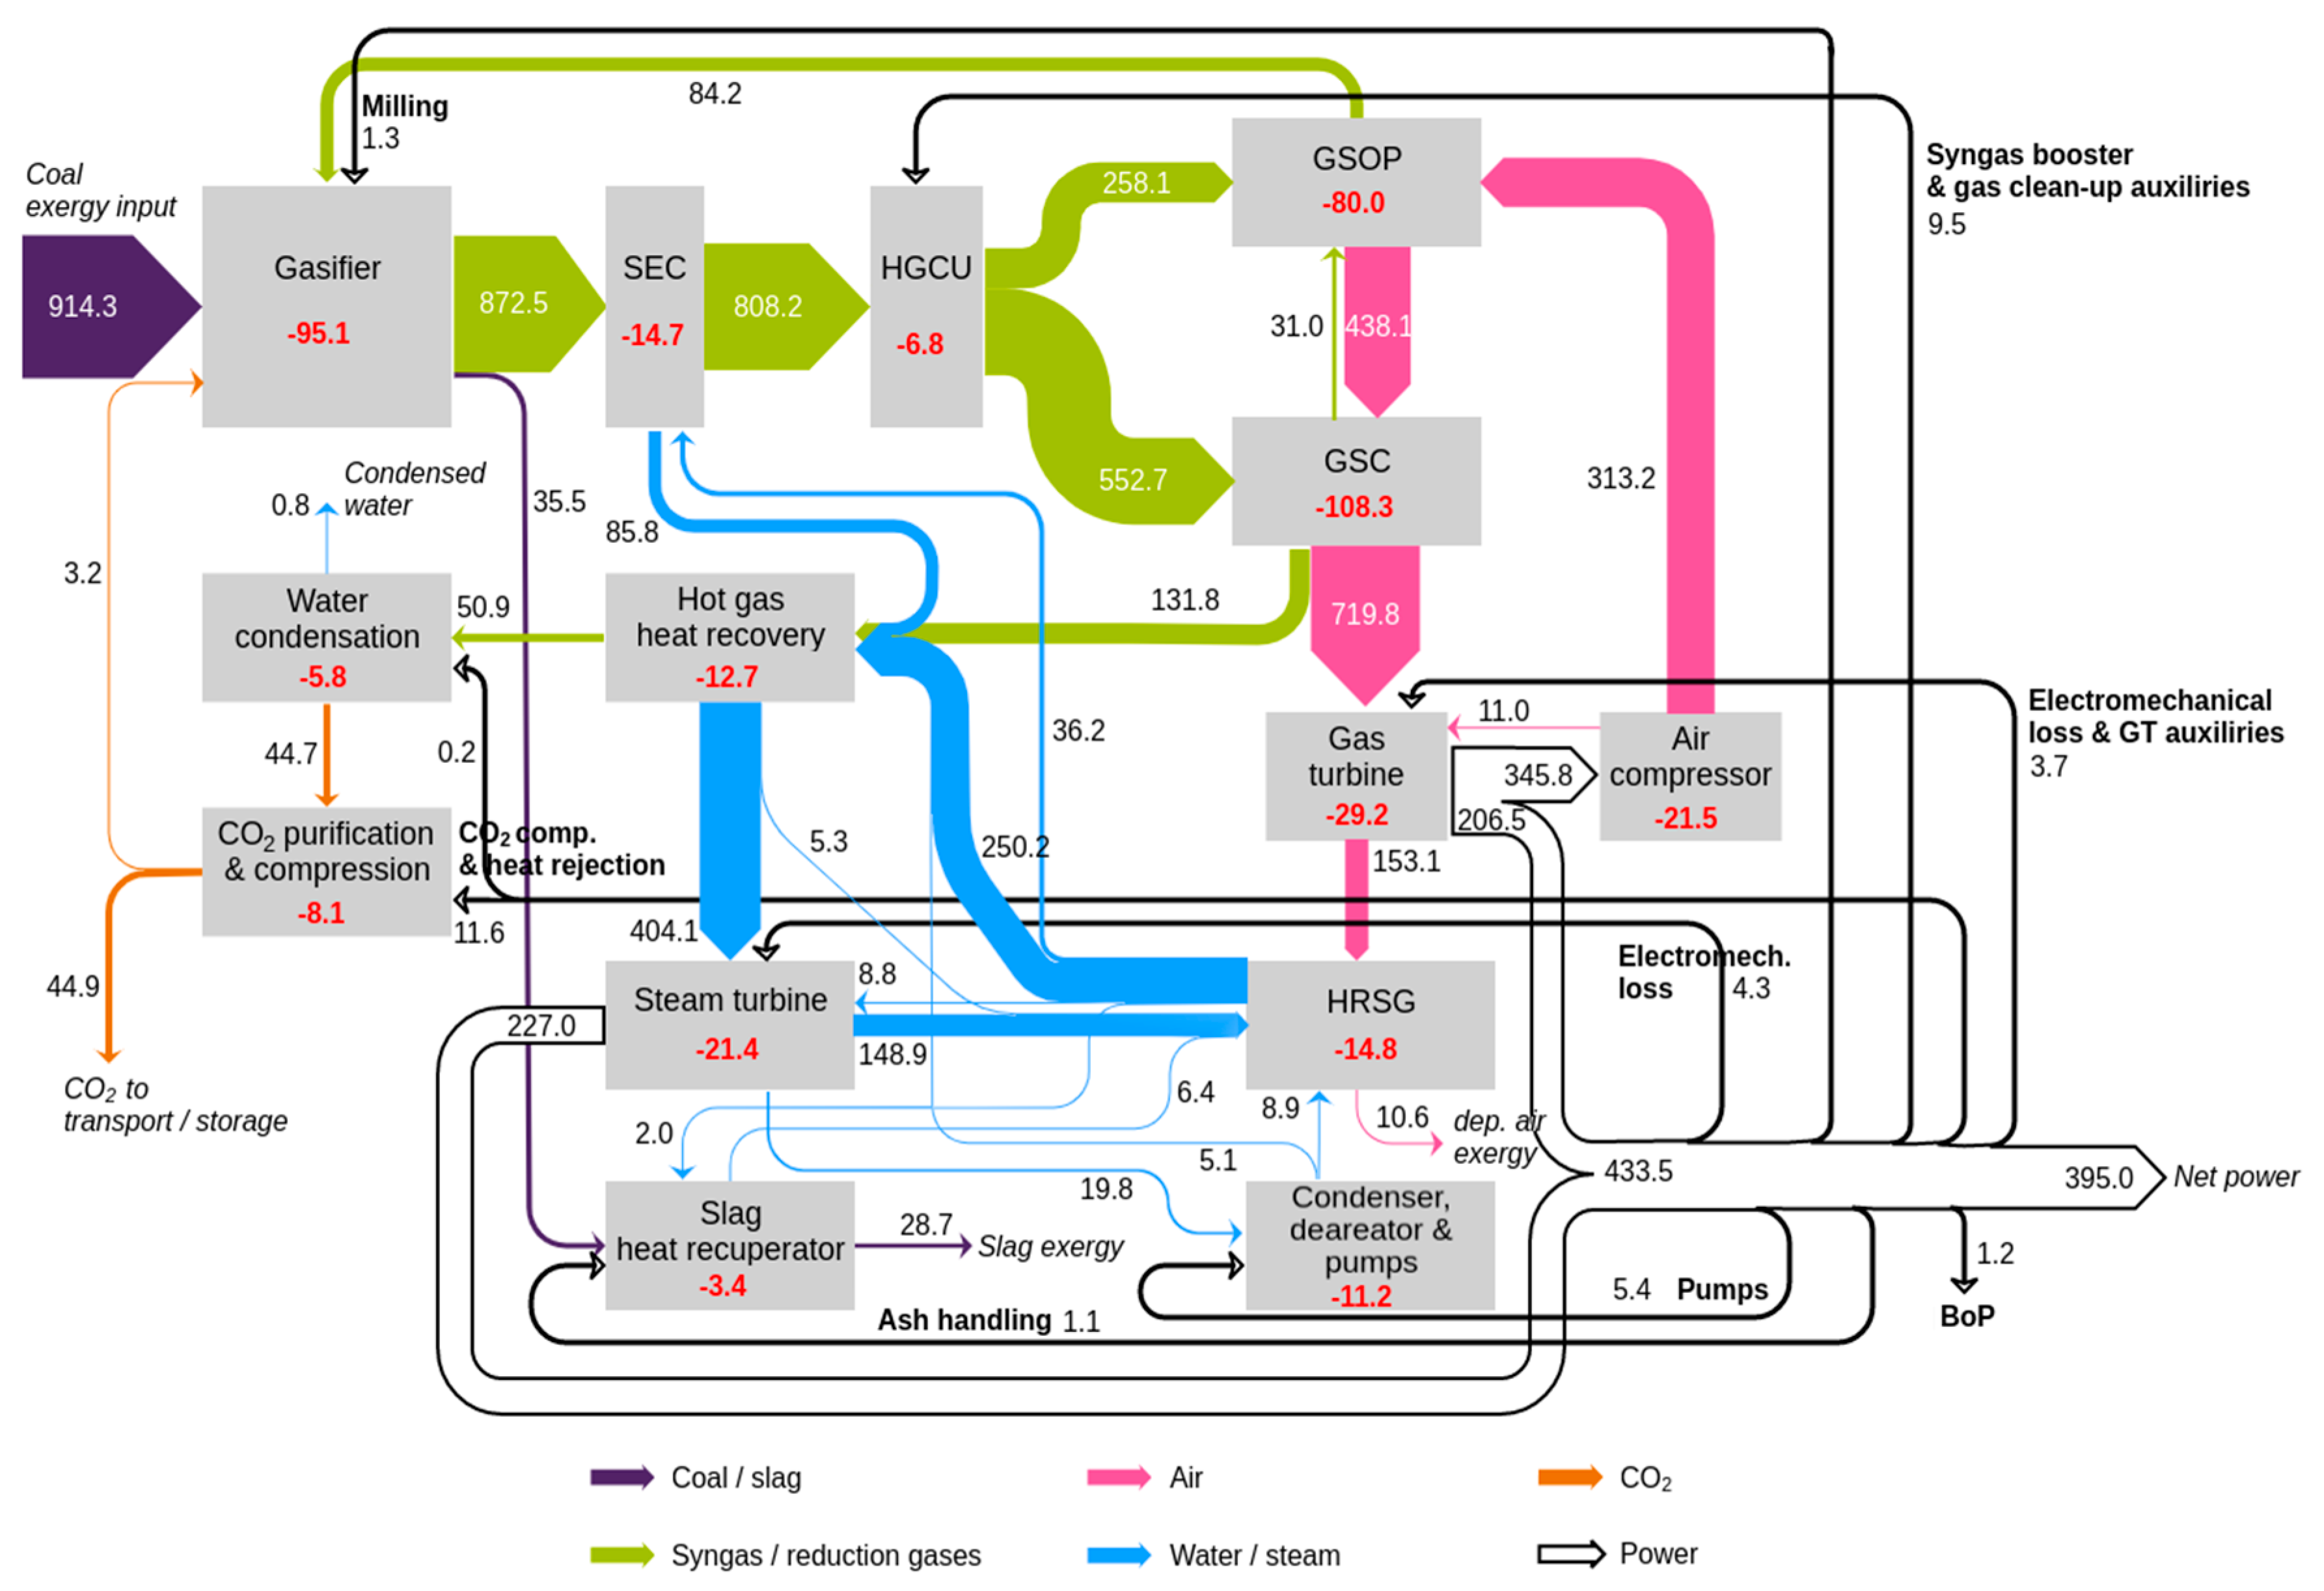
Lastly, a comprehensive tool to visualize the different flows of exergy across the plant is their representation in a Sankey flow diagram, in which the different nodes of the plant are interconnected with exergy arrows with a size that is proportional to the magnitude of these streams. In this way, an insight of the proportion of exergy flows that are exchanged between the different subsystems is given. Since GS plants involving chemical looping are less known compared to the reference plants, in this work, such diagrams are shown in Figure 11 and Figure 12 for the GSC IGCC and GSOP–GSC IGCC plants, respectively. A detailed breakdown per item of the different power plant models is presented in Table A6 in Appendix A.

4. Summary and Conclusions

In this work, two IGCC power plant concepts with CCS based on gas switching chemical looping technology were investigated: an IGCC plant with a GSC cluster using NiO as the oxygen carrier, replacing the GT combustion chamber, and an IGCC plant where, additionally, the ASU was replaced by a GSOP cluster for oxygen production. The plants were consistently benchmarked with two reference IGCC technologies: a power plant with no CO2 capture (or unabated IGCC) and a precombustion CO2 capture IGCC power plant, with a WGS unit and CO2 removal with Selexol. The GS chemical looping plants were modeled with HGCU for syngas desulfurization and contaminant removal, assuming that this treating technology will be available before GS technology deployment on a commercial scale.
The GSC IGCC plant shows a similar performance in terms of emissions and efficiency with respect to previous literature results [21]. The GSOP–GSC plant shows a thermal efficiency increase of approximately 1% point compared to the results presented in [10], because of the improved performance of the GSOP cluster operating in fluidization mode, but it led to a decrease of the capture ratio of approximately 10% points due to the increased outlet stream mixing of the clusters
Furthermore, a detailed exergy analysis of all the power plant configurations was presented, with the aid of a modeling auxiliary tool for the determination of physical and chemical exergy of the process streams. Additionally, since GS chemical looping plants are less known, a Sankey flow diagram of the exergy flows was presented for the GSC IGCC and GSOP–GSC IGCC plants. The exergy analysis methodology enabled the determination of the different sources of thermodynamic irreversibility across the power plants. The performance of the different plant sections was determined with the exergy utilization parameter λ and the exergy loss contribution δ, revealing that the largest exergy destruction takes place where the fuel is degraded to heat, i.e., the gasifier, combustion chamber, and GS clusters. The use of GS chemical looping technology improved the exergy utilization of the gas turbine section by avoidance of the combustion chamber; however, due to the lower TIT achieved, a larger portion of the total power output shifted to the bottoming steam cycle, and together with a less efficient heat recovery of the reduction gases, it resulted in a lower exergy utilization and a higher exergy loss contribution of this section relative to the benchmark cases.
The exergy analysis revealed that the efficiency gains of the GSC IGCC plant relative to the precombustion CO2 capture IGCC shown in earlier studies [21] can be to a great extent explained by the lower syngas cooling and treating exergy destruction values attained by means of inherent carbon capture (GSC) and HGCU. When a GSOP cluster is introduced, the foreseen low energy penalty suggested in [10] for the GSOP–GSC IGCC plant is corroborated through the exergy analysis, with a substantially lower exergy destruction taking place in the gasification island, due to the avoidance of the ASU and the lower operating temperature of the Winkler gasifier.
Based on these insights, several improvement pathways were suggested, which were primarily based on making better use of the exergy contained in the GSC reduction gases outlet. Optimization efforts focusing on the items where a large exergy destruction occurs have the most potential for improvement, therefore using this stream for coal pre-heating in the gasification island, are proposed and will be evaluated in future works. Although it is not the focus of the present study, it is noted that a parallel economic assessment is required to holistically determine the actual benefits of potential exergy gains. Regarding the overall exergy efficiency, when only the net power output of the plants is considered as the useful effect, the exergy efficiencies of the plants investigated were around 3% points lower than the respective thermal efficiency. When the exergy of the captured CO2 was included as a useful effect, the exergy efficiency of the GS plants with CCS surpassed the unabated IGCC benchmark.

Author Contributions

C.A.d.P. developed the power plant models, performed the model analysis and wrote the article, elaborating most of the article figures. Á.J.Á. collaborated in the analysis of the power plants, performed a work of supervision and contributed to the elaboration of the exergy diagrams. J.H.C. elaborated the models of the transient reactors and provided input to the stationary power plant simulations, as well as text revision. S.C. performed a task of supervision and reviewing of the text, providing insights on modelling of the systems evaluated. S.A., as project coordinator, performed a task of supervision and revision of the text. All authors have read and agreed to the published version of the manuscript.

Funding

This research received financial support from the ERA-NET cofund, ACT GaSTech Project number 276321 co-funded by the European Commission under the Horizon 2020 program, and ACT Grant Agreement No. 691712. The partners collaborating in this article have received funding from MINECO, Spain (reference PCIN-2017-013) and the Research Council of Norway, Norway.

Acknowledgments

The authors would like to acknowledge Honeywell for the free Academic License of Unisim Design Suite R451, which enabled the integration of the GSOP and GSC models with power plant simulations.

Conflicts of Interest

The authors declare no conflict of interest.

Abbreviations

Nomenclature
E ˙ Total Exergy Flow (kW)
I ˙ Exergy Destruction (kW)
Q ˙ Heat Flow (kW)
PPressure (bar)
TTemperature (K)
W ˙ Power (kW)
m ˙ Mass Flow (kg/s)
hSpecific Enthalpy (kJ/kg)
eExergy Flow (kJ/kg)
sSpecific Entropy (kJ/kg K)
ξExergy Efficiency (%)
λExergy Utilization (%)
δExergy Loss Contribution (%)
Subscripts & Superscripts
iStream
jSystem
chChemical
phPhysical
0Ambient Conditions
Acronyms
AGRUAcid Gas Removal Unit
ASMEAmerican Society of Mechanical Engineers
ASUAir Separation Unit
BoPBalance of the Plant
CCSCarbon Capture and Storage
CGCUCold Gas Clean Up
CGECold Gas Efficiency
CLCChemical Looping Combustion
CLOPChemical Looping Oxygen Production
CPUCryogenic Purification Unit
GSCGas Switching Combustion
GSOPGas Switching Oxygen Production
GTGas Turbine
HGCUHot Gas Clean Up
HPHigh Pressure
HSRGHeat Recovery Steam Generator
HXHeat Exchanger
IGCCIntegrated Gasification Combined Cycle
IPIntermediate Pressure
LHVLower Heating Value
LPLow Pressure
LTHRLow Temperature Heat Recovery
MITAMinimum Temperature Approach
PBPacked Bed
SECSyngas Effluent Cooler
SPECCASpecific Primary Energy Cost of CO2 Avoided
STSteam Turbine
TITTurbine Inlet Temperature
TOTTurbine Outlet Temperature
WFGDWet Flue Gas Desulphurization
WGSWater Gas Shift

Appendix A

Table A1. Gasification island assumptions.
Winkler Gasifier
ItemValueUnits
Freeboard temperature900°C
%w. CO2 for coal loading15%
% LHV CH4 in syngas11.3%
Oxidizer overpressure50kPa
HP steam superheat450°C
Fixed carbon conversion95.5%
%w. Vented CO2 in lock hoppers10%
Coal milling and handling40MJ/kg coal
Ash handling200MJ/kg ash
Shell Gasifier
ItemValueUnits
Moderator (steam) to dry coal ratio0.09kg/kg
Oxygen to dry coal ratio0.873kg/kg
Moisture in coal after drying2%
Syngas for coal drying %LHV0.9%
Fixed carbon conversion99.3%
Gasifier operating pressure44bar
Steam moderator pressure54bar
Heat loss as %LHV0.7%
Heat to membrane wall as %LHV2%
CO2 HP/HHP pressure56/88bar
CO2 temperature80°C
CO2 to dry coal ratio0.83kg/kg
Air Separation Unit
ItemValueUnits
Main air compressor polytropic efficiency89%
Booster air compressor polytropic efficiency87%
Reboiler–condenser pinch1.5°C
Heat exchanger minimum approach temperature2°C
Process stream temperature after heat rejection25°C
Oxygen purity95%
Oxygen delivery pressure48bar
Oxygen pump efficiency80%
Exchanger pressure losses/side10kPa
Intercooler pressure loss10kPa
Table A2. Syngas treating unit assumptions.
HGCU
ItemValueUnits
Adsorption temperature400°C
Regeneration temperature750°C
Filter pressure drop5%
Auxiliary consumption5.34MJe/kgH2S
Compander polytropic efficiency80%
Syngas blower polytropic efficiency80%
O2 mol fraction in regeneration stream2–5%
CGCU
ItemValueUnits
Absorption temperature30°C
Auxiliary consumption3MJe/kg H2S
LP steam requirement50MJth/kg H2S
Syngas blower polytropic efficiency80%
Selexol pump efficiency80%
% H2S to Claus unit>25%
Table A3. Power cycle assumptions.
Gas Turbine
ItemValueUnits
GT compressor polytropic efficiency91.5%
GT turbine polytropic efficiency87%
GT pressure ratio18.1-
GT electromechanical efficiency98.6%
Steam Cycle
ItemValueUnits
ST LP stage isentropic efficiency88%
ST IP stage isentropic efficiency94%
ST HP stage isentropic efficiency92%
ST electromechanical efficiency98.1%
Pressure levels HP/IP/LP144/36/4bar
Auxiliaries for heat rejection0.008MJe/MJth
Pump isentropic efficiency80%
Live steam temperature565°C
CO2 Compression
ItemValueUnits
CO2 compressor stage isentropic efficiency80%
Process stream temperature after cooler25°C
Cold exchanger MITA2°C
Table A4. Dry air composition.
ComponentMole Fraction
N20.7808
O20.2095
Ar0.0093
CO20.0004
SO20.1 PPM
Table A5. Douglas Premium coal properties.
Ultimate AnalysisMass Frac
C0.6652
N0.0156
H0.0378
S0.0052
O0.0546
Cl0.00009
Moisture0.08
Ash0.1415
Volatiles0.2291
LHV (MJ/kg)25.17
Table A6. Exergy balance per item of the different power plant models. Total values are in MW.
ModelUnabated IGCCPre-Combustion CO2 Capture IGCCGSC IGCCGSOP-GSC IGCC
BlockItemTotal%Total%Total%Total%
Gasification IslandASU17.92, 023.72.623.52.60.00.0
Air expander and cooling3.80.40.00.00.00.00.00.0
N2 compression7.00.86.50.70.00.00.00.0
Gasifier (and quench)130.314.2129.414.1130.514.395.110.4
Syngas Cooling and TreatingSEC (+Slag HX)15.91.716.21.816.11.818.12.0
HGCU (+Booster)0.00.00.00.09.41.06.80.7
Scrubbing, LTHR and CGCU15.51.70.00.00.00.00.00.0
Scrubber and WGS0.00.044.44.80.00.00.00.0
AGRU (Selexol)0.00.019.32.10.00.00.00.0
Saturator and fuel heating13.91.514.61.60.00.00.00.0
GSOP ClusterGSOP0.00.00.00.00.00.080.08.8
GSC clusterGSC0.00.00.00.0156.517.1108.311.8
Gas TurbineCompressor18.12.016.21.827.13.021.52.4
Combustion chamber165.918.1163.017.80.00.00.00.0
Turbine33.23.631.43.426.42.929.23.2
Steam CycleHSRG19.32.113.21.414.51.614.81.6
Hot gases recovery unit0.00.00.00.018.42.012.71.4
Condenser cooling and pumps9.21.07.80.912.91.411.21.2
N2 cooler0.00.00.00.07.70.80.00.0
Steam turbine17.11.914.31.921.72.421.42.3
CO2 Purification & CompressionReduction gases condenser0.00.00.00.04.60.55.80.6
CPU/CO2 compression0.00.010.31.17.20.88.10.9
Exergy OutSlag5.30.65.30.65.30.628.73.1
CO20.00.051.45.651.25.644.94.9
Stack gases28.73.120.12.24.70.510.61.2
Other (water, etc.)5.80.65.70.65.60.60.70.1
OtherMisc. (BoP)1.30.11.30.11.30.11.30.1
Useful EffectWnet406.944.5322.735.2370.540.5395.243.2
InputExergy in915.1100.0916.8100.0914.9100.0914.5100.0

References

  1. European Geosciences Union’s Reaction to IPCC Report on Global Warming of 1.5 Degrees Celsius. Targeted News Service. Available online: https://targetednews.com/.
  2. Ishida, M.; Zheng, D.; Akehata, T. Evaluation of a chemical-looping-combustion power-generation system by graphic exergy analysis. Energy 1987, 12, 147–154. [Google Scholar] [CrossRef]
  3. Wang, P.; Means, N.; Shekhawat, D.; Berry, D.; Massoudi, M. Chemical-Looping Combustion and Gasification of Coals and Oxygen Carrier Development: A Brief Review. Energies 2015, 8, 10605–10635. [Google Scholar] [CrossRef] [Green Version]
  4. Mattisson, T.; Keller, M.; Linderholm, C.; Moldenhauer, P.; Rydén, M.; Leion, H.; Lyngfelt, A. Chemical-looping technologies using circulating fluidized bed systems: Status of development. Fuel Process. Technol. 2018, 172, 1–12. [Google Scholar] [CrossRef] [Green Version]
  5. Cloete, S.; Romano, M.C.; Chiesa, P.; Lozza, G.; Amini, S. Integration of a Gas Switching Combustion (GSC) system in integrated gasification combined cycles. Int. J. Greenh. Gas Control 2015, 42, 340–356. [Google Scholar] [CrossRef]
  6. Blas, L.; Dutournié, P.; Jeguirim, M.; Josien, L.; Chiche, D.; Bertholin, S.; Lambert, A. Numerical Modeling of Oxygen Carrier Performances (NiO/NiAl2O4) for Chemical-Looping Combustion. Energies 2017, 10, 864. [Google Scholar] [CrossRef] [Green Version]
  7. Sifat, N.S.; Haseli, Y. A Critical Review of CO2 Capture Technologies and Prospects for Clean Power Generation. Energies 2019, 12, 4143. [Google Scholar] [CrossRef] [Green Version]
  8. Moghtaderi, B. Application of Chemical Looping Concept for Air Separation at High Temperatures. Energy Fuels 2010, 24, 190–198. [Google Scholar] [CrossRef]
  9. Rydén, M.; Källén, M.; Jing, D.; Hedayati, A.; Mattisson, T.; Lyngfelt, A. (Fe1-xMnx)TiyO3 based Oxygen Carriers for Chemical-looping Combustion and Chemical-looping with Oxygen Uncoupling. Energy Procedia 2014, 51, 85–98. [Google Scholar] [CrossRef] [Green Version]
  10. Cloete, S.; Giuffrida, A.; Romano, M.; Chiesa, P.; Pishahang, M.; Larring, Y. Integration of chemical looping oxygen production and chemical looping combustion in integrated gasification combined cycles. Fuel 2018, 220, 725–743. [Google Scholar] [CrossRef]
  11. Cloete, S.; Tobiesen, A.; Morud, J.; Romano, M.; Chiesa, P.; Giuffrida, A.; Larring, Y. Economic assessment of chemical looping oxygen production and chemical looping combustion in integrated gasification combined cycles. Int. J. Greenh. Gas Control 2018, 78, 354–363. [Google Scholar] [CrossRef]
  12. Cormos, C.-C. Techno-Economic Evaluations of Copper-Based Chemical Looping Air Separation System for Oxy-Combustion and Gasification Power Plants with Carbon Capture. Energies 2018, 11, 3095. [Google Scholar] [CrossRef] [Green Version]
  13. Del Pozo, C.A.; Cloete, S.; Cloete, J.H.; Álvaro Ángel, J.; Amini, S. The oxygen production pre-combustion (OPPC) IGCC plant for efficient power production with CO2 capture. Energy Convers. Manag. 2019, 201, 112109. [Google Scholar] [CrossRef]
  14. Spallina, V.; Romano, M.C.; Chiesa, P.; Gallucci, F.; Annaland, M.V.S.; Lozza, G. Integration of coal gasification and packed bed CLC for high efficiency and near-zero emission power generation. Int. J. Greenh. Gas Control 2014, 27, 28–41. [Google Scholar] [CrossRef]
  15. Giuffrida, A.; Romano, M.; Lozza, G. Thermodynamic Assessment of IGCC Plants with Hot Gas Desulphurization. Appl. Energy 2010, 87, 3374–3383. [Google Scholar] [CrossRef]
  16. Ohtsuka, Y.; Tsubouchi, N.; Kikuchi, T.; Hashimoto, H. Recent progress in Japan on hot gas cleanup of hydrogen chloride, hydrogen sulfide and ammonia in coal-derived fuel gas. Powder Technol. 2009, 190, 340–347. [Google Scholar] [CrossRef]
  17. Siefert, N.S.; Narburgh, S.; Chen, Y. Comprehensive Exergy Analysis of Three IGCC Power Plant Configurations with CO2 Capture. Energies 2016, 9, 669. [Google Scholar] [CrossRef] [Green Version]
  18. Kunze, C.; Riedl, K.; Spliethoff, H. Structured exergy analysis of an integrated gasification combined cycle (IGCC) plant with carbon capture. Energy 2011, 36, 1480–1487. [Google Scholar] [CrossRef]
  19. Mukherjee, S.; Kumar, P.; Yang, A.; Fennell, P. Energy and exergy analysis of chemical looping combustion technology and comparison with pre-combustion and oxy-fuel combustion technologies for CO2 capture. J. Environ. Chem. Eng. 2015, 3, 2104–2114. [Google Scholar] [CrossRef] [Green Version]
  20. Cao, Y.; He, B.; Ding, G.; Su, L.; Duan, Z. Energy and exergy investigation on two improved IGCC power plants with different CO2 capture schemes. Energy 2017, 140, 47–57. [Google Scholar] [CrossRef]
  21. Del Pozo, C.A.; Cloete, S.; Cloete, J.H.; Álvaro Ángel, J.; Amini, S. The potential of chemical looping combustion using the gas switching concept to eliminate the energy penalty of CO2 capture. Int. J. Greenh. Gas Control 2019, 83, 265–281. [Google Scholar] [CrossRef]
  22. Anantharaman, R.; Bolland, O.; Booth, N.; van Dorst, E.; Fernandez, E.S.; Franco, F.; Macchi, E.; Manzolini, G.; Nikolic, D.; Pfeffer, A.; et al. Cesar Deliverable D2.4.3. European Best Practice Guidelines for Assessment of CO2 Capture Technologies. Energy 2018. [Google Scholar] [CrossRef]
  23. Gazzani, M.; Macchi, E.; Manzolini, G. CO2 capture in integrated gasification combined cycle with SEWGS—Part A: Thermodynamic performances. Fuel 2013, 105, 206–219. [Google Scholar] [CrossRef]
  24. Jones, D.; Bhattacharyya, D.; Turton, R.; Zitney, S.E. Optimal design and integration of an air separation unit (ASU) for an integrated gasification combined cycle (IGCC) power plant with CO2 capture. Fuel Process. Technol. 2011, 92, 1685–1695. [Google Scholar] [CrossRef]
  25. Kapetaki, Z.; Brandani, P.; Brandani, S.; Ahn, H. Process simulation of a dual-stage Selexol process for 95% carbon capture efficiency at an integrated gasification combined cycle power plant. Int. J. Greenh. Gas Control 2015, 39, 17–26. [Google Scholar] [CrossRef] [Green Version]
  26. Cloete, S.; Zaabout, A.; Romano, M.C.; Chiesa, P.; Lozza, G.; Gallucci, F.; Annaland, M.V.S.; Amini, S. Optimization of a Gas Switching Combustion process through advanced heat management strategies. Appl. Energy 2017, 185, 1459–1470. [Google Scholar] [CrossRef]
  27. Horlock, J.H. Chapter 4—Cycle Efficiency with Turbine Cooling (Cooling Flow Rates Specified). In Advanced Gas Turbine Cycles; ScienceDirect; online; 2016; pp. 47–69. [Google Scholar]
  28. Campanari, S.; Mastropasqua, L.; Gazzani, M.; Chiesa, P.; Romano, M.C. Predicting the ultimate potential of natural gas SOFC power cycles with CO2 capture—Part B: Applications. J. Power Sources 2016, 325, 194–208. [Google Scholar] [CrossRef]
  29. Kolster, C.; Mechleri, E.; Krevor, S.; Mac Dowell, N. The role of CO2 purification and transport networks in carbon capture and storage cost reduction. Int. J. Greenh. Gas Control 2017, 58, 127–141. [Google Scholar] [CrossRef]
  30. Posch, S.; Haider, M. Optimization of CO2 compression and purification units (CO2CPU) for CCS power plants. Fuel 2012, 101, 254–263. [Google Scholar] [CrossRef]
  31. Toporov, D.; Abraham, R. Gasification of low-rank coal in the High-Temperature Winkler (HTW) process. J. South. Afr. Inst. Min. Metall. 2015, 115, 589–597. [Google Scholar] [CrossRef]
  32. Carlier, R.N. Termodinámica; Dextra: San Diego, CA, USA, 2013. [Google Scholar]
  33. Pinazo Ojer, J.M. DTIE 3.01: Propiedades del Aire Húmedo. Diagrama Psicrométrico-Transformaciones Psicrométricas; Atecyr D.L: Madris, Spain, 2009; Actualizada. [Google Scholar]
  34. Kotas, T.J. The Exergy Method of Thermal Plant Analysis; Elsevier: Amsterdam, The Netherlands, 1985. [Google Scholar]
  35. Higman, C. Gasification, 2nd ed.; Academic Press: Cambridge, MA, USA, 2008. [Google Scholar]
Figure 1. Composition and temperature over a cycle of operation for a (a) gas switching combustion (GSC) reactor (reduction stage length = 178.0 s) and (b) gas switching oxygen production (GSOP) reactor (reduction stage length = 253.7 s) in the GSOP–GSC integrated gasification combined cycles (IGCC) plant. The x-axes are normalized by the reduction stage length in each case.
Energies 13 00544 g001
Figure 2. Block flow diagram of the unabated IGCC benchmark.
Energies 13 00544 g002
Figure 3. Block flow diagram of the IGCC with pre-combustion CO2 capture benchmark.
Energies 13 00544 g003
Figure 4. Block flow diagram of the GSC IGCC plant.
Energies 13 00544 g004
Figure 5. Block flow diagram of the GSOP–GSC IGCC power plant.
Energies 13 00544 g005
Figure 6. Schematic of the modeling tool employed to determine the chemical exergy of a stream.
Energies 13 00544 g006
Figure 7. Total exergy breakdown of the different power plants.
Energies 13 00544 g007
Figure 8. Exergy utilization λ and exergy destruction contribution δ in percent for the benchmark power plants, as defined by Equations (4) and (5).
Energies 13 00544 g008
Figure 9. Exergy utilization λ and exergy destruction contribution δ in percent for the gas switching (GS) power plants, as defined by Equations (4) and (5).
Energies 13 00544 g009
Figure 10. Exergy efficiencies of the different power plants.
Energies 13 00544 g010
Figure 11. Sankey diagram of the exergy flow for the GSC IGCC power plant. Values are in MW. Red values represent exergy destruction.
Energies 13 00544 g011
Figure 12. Sankey diagram of the exergy flow for the GSOP–GSC IGCC plant. Values are in MW. Red values represent the exergy destruction.
Energies 13 00544 g012
Table 1. Power plant results. ASU: air separation unit, CPU: CO2 purification unit, GT: gas turbine, SPECCA: Specific Primary Energy Cost of CO2 Avoided.
Item/PlantUnabated IGCCPrecombustion CO2 Capture IGCCGSC IGCCGSOP–GSC IGCC
Coal Input (MW)854.0854.0854.0854.0
GT Net (MW)277.8271.7201.3203.5
Air Expander5.50.00.00.0
Steam Turbine Net (MW)189.3157.8234.0222.7
ASU (MW)26.336.836.80.0
N2 Compression (MW)28.123.70.00.0
Pumps (MW)2.73.13.22.9
Heat Rejection (MW)2.12.33.93.0
CO2 CPU/Compression (MW)0.023.414.611.4
Coal Milling (MW)1.71.71.71.4
Ash Handling (MW)0.50.50.51.1
GT Aux. (MW)1.00.90.70.7
Syngas Compressor (MW)1.11.21.08.1
AGRU Aux. (MW)1.211.71.31.2
Balance of Plant (MW)1.31.31.31.3
Total Aux. (MW)66.0104.164.831.0
Gross Plant (MW)472.7429.5435.3426.2
Net Plant (MW)406.7322.7370.5395.1
Gross Efficiency (LHV %)55.450.351.049.9
Net Efficiency (LHV %)47.637.843.446.3
Specific Emissions (kgCO2/MWh)727.386.462.6116.4
Capture Rate (%)0.090.692.283.9
CO2 Avoided (%)0.088.191.384.0
SPECCA (MJ/kgCO2)-3.071.090.36
Compressor Intake (kg/s)514.8443.4735.9818.7
Exhaust Gases (kg/s)605.2519.4690.5748.7

