Article

Ageing Tests of Samples of Glass-Epoxy Core Rods in Composite Insulators Subjected to High Direct Current (DC) Voltage in a Thermal Chamber

by
Krzysztof Wieczorek
1,*,
Przemysław Ranachowski
2,
Zbigniew Ranachowski
2 and
Piotr Papliński
3
1
Department of Electrical Engineering Fundamentals, Wroclaw University of Science and Technology, 50-370 Wroclaw, Poland
2
Department of Experimental Mechanics, Institute of Fundamental Technological Research Polish Academy of Sciences, 02-106 Warsaw, Poland
3
Environmental Impact and Overvoltage Protection Laboratory, Institute of Power Engineering-Research Institute, 01-330 Warsaw, Poland
*
Author to whom correspondence should be addressed.
Energies 2020, 13(24), 6724; https://doi.org/10.3390/en13246724
Submission received: 1 November 2020 / Revised: 7 December 2020 / Accepted: 16 December 2020 / Published: 20 December 2020
(This article belongs to the Special Issue High Voltage Insulating Materials-Current State and Prospects)

Abstract

:
In this article, we presented the results of the tests performed on three sets of samples of glass-reinforced epoxy (GRE) core rods used in alternating current (AC) composite insulators with silicone rubber housing. The objective of this examination was to test the aging resistance of the rod material when exposed to direct current (DC) high voltage. We hypothesized that the long-term effects of the electrostatic field on the GRE core rod material would lead to a gradual degradation of its mechanical properties caused by ionic current flow. Further, we hypothesized that reducing the mechanical strength of the GRE core rod would lead to the breakage of the insulator. The first group of samples was used for reference. The samples from the second group were subjected to a temperature of about 50 °C for 6000 h. The third group of samples were aged by temperature and DC high voltage for the same time. The samples were examined using the 3-point bending test, micro-hardness measurement and microscopic analysis. No recordable degradation effects were found. Long-term temperature impact and, above all, the combined action of temperature and DC high voltage did not reduce the mechanical parameters or change the microstructure of the GRE material.

1. Introduction

Progress in the construction of high voltage power converter systems and the dynamic development of electricity generation systems from so-called renewable sources have resulted in an increasing interest in the transmission of electricity through high voltage direct current (HVDC) transmission lines [1,2]. The high cost of converter stations—from alternating current (AC) to direct current (DC) and vice versa—are compensated by a significant reduction in loss of energy transmitted over long distances via HVDC transmission lines, especially when compared to systems that operate at AC voltages and have lower construction costs [3].
Current high voltage lines are more often equipped with modern composite insulators. The main advantage of this is surface hydrophobicity. In polluted environments, this property makes it impossible to create water paths that conduct leakage currents for housing composite insulators. Silicone elastomer insulator housings have the ability to hydrophobize surface pollution and regenerate temporarily in lost surface properties. Compared to ceramic and glass insulators, they are significantly lighter and, in many countries, cheaper. However, the use of HVDC for the transmission of electricity unfortunately raises some technical problems. The constant electric field, forced by the HVDC line, has a significant impact on the integrity of dielectric materials usually produced for AC applications [4]. Compared to systems operating at alternating voltages, electrostatic phenomena may cause changes in degradation processes, electrical strength [5,6] and even a four-fold increase in the accumulation of surface soiling [7]. Under such conditions, when the leakage current flows through the polluted surface without passing through the zero curve of voltage and current, the ignition of non-extinguishing concentrated surface discharges may occur. This can lead to degradation of the composite housing. The ageing process in the presence of HVDC results in an increased accumulation of spatial charge in areas where material is more degraded, thus contributing to a stronger distortion of the electric field [8]. This phenomenon may cause intensification of partial discharges. In addition, if the glass-reinforced epoxy (GRE) core material is exposed to the long-term electrostatic field, then the ionic current flow may cause gradual degradation of mechanical properties [9]. This process could be activated at increased temperatures. Electrolysis of the carrying material (glass fibers) could then lead to the breakage of such insulators and, consequently, to serious failures.
This experiment aimed to test the mechanical strength of GRE core rod samples after 6000 h of aging at a temperature of about 50 °C and in the presence of HVDC.

2. Materials and Methods

In the ageing comparative tests, we used samples of GRE material cut from the carrying rod of a typical high voltage composite insulator for AC lines. Fibers in the rod were made of ECR-glass (ECR—type of glass electrical chemical reinforced) [10,11]. Apart from silicon (SiO2,), these types of fibers contain calcium from CaCO3 (as flux and stabilizer) and aluminum from Al203 (to improve chemical resistance), which are used in the glass composition. Typical ECR-glass contains over 58% SiO2, about 22% CaO and less than 12% Al203, as well as smaller amounts of other additives. The presence of mobile sodium cations (Na+) was excluded.
The samples had a diameter of 24.0 mm and a length of 120.0 mm. The first group, marked with the letter A, were fresh reference samples and reflected the material’s initial structure. The samples of the second series, marked with the letter B, were subjected to a temperature of about 50 °C ± 2 °C for 6000 h. This temperature was selected following the measurements of the insulator housing temperature made on a sunny, cloudless day with an ambient temperature of about 27 °C. Measured temperature values under actual insulator operation conditions reached about 46 °C, as shown in Figure 1.
The samples of the third series, marked with the letter C, with electrodes applied to their front surfaces, were subjected for 6000 h to a temperature of about 50 °C ± 2 °C and a DC voltage of 20 kV. The average value of the voltage distribution along the main axis of the typical insulator was about 1 kV/cm. In this research, it was applied twice as high as the electric field strength, i.e., 2 kV/cm. Increasing the voltage was supposed to accelerate the aging process. Figure 2 shows one sample from each of the three series.
The samples were arranged in a special stand and placed in a heating chamber. Figure 3 shows the samples in the heating chamber (photograph taken with a fluke thermal imaging camera).
Samples from all three groups (both reference samples, thermally aged samples and those thermally and voltage aged) were tested using the 3-point bending test. For this purpose, a testing machine (INSTRON 1343) was used, which was extended with controllers and software by MTS. (MTS–Mathematisch Technische Software-Entwicklung GmbH, Berlin, Germany). Special adaptation of the support system was necessary as the tested samples had a cylindrical shape with a diameter of 24.0 mm. Therefore, in the steel rollers on which the samples were based, semi-circular notches with a radius of 12.0 mm and a depth of 10 mm were made at 100.0 mm of spacing. This is illustrated in Figure 4. A relatively low crosshead speed of 0.1 mm/min was set. This corresponded approximately to a force increase of 20 N/s.
The measuring system recorded the force acting on the sample, which was then converted to stress, according to the relation [12]:
σ f = 8 × F × l π × d 3 ,
where:
  • σf—is the bending stress, in MPa;
  • F—force loading the sample, recorded by the measuring system, in N;
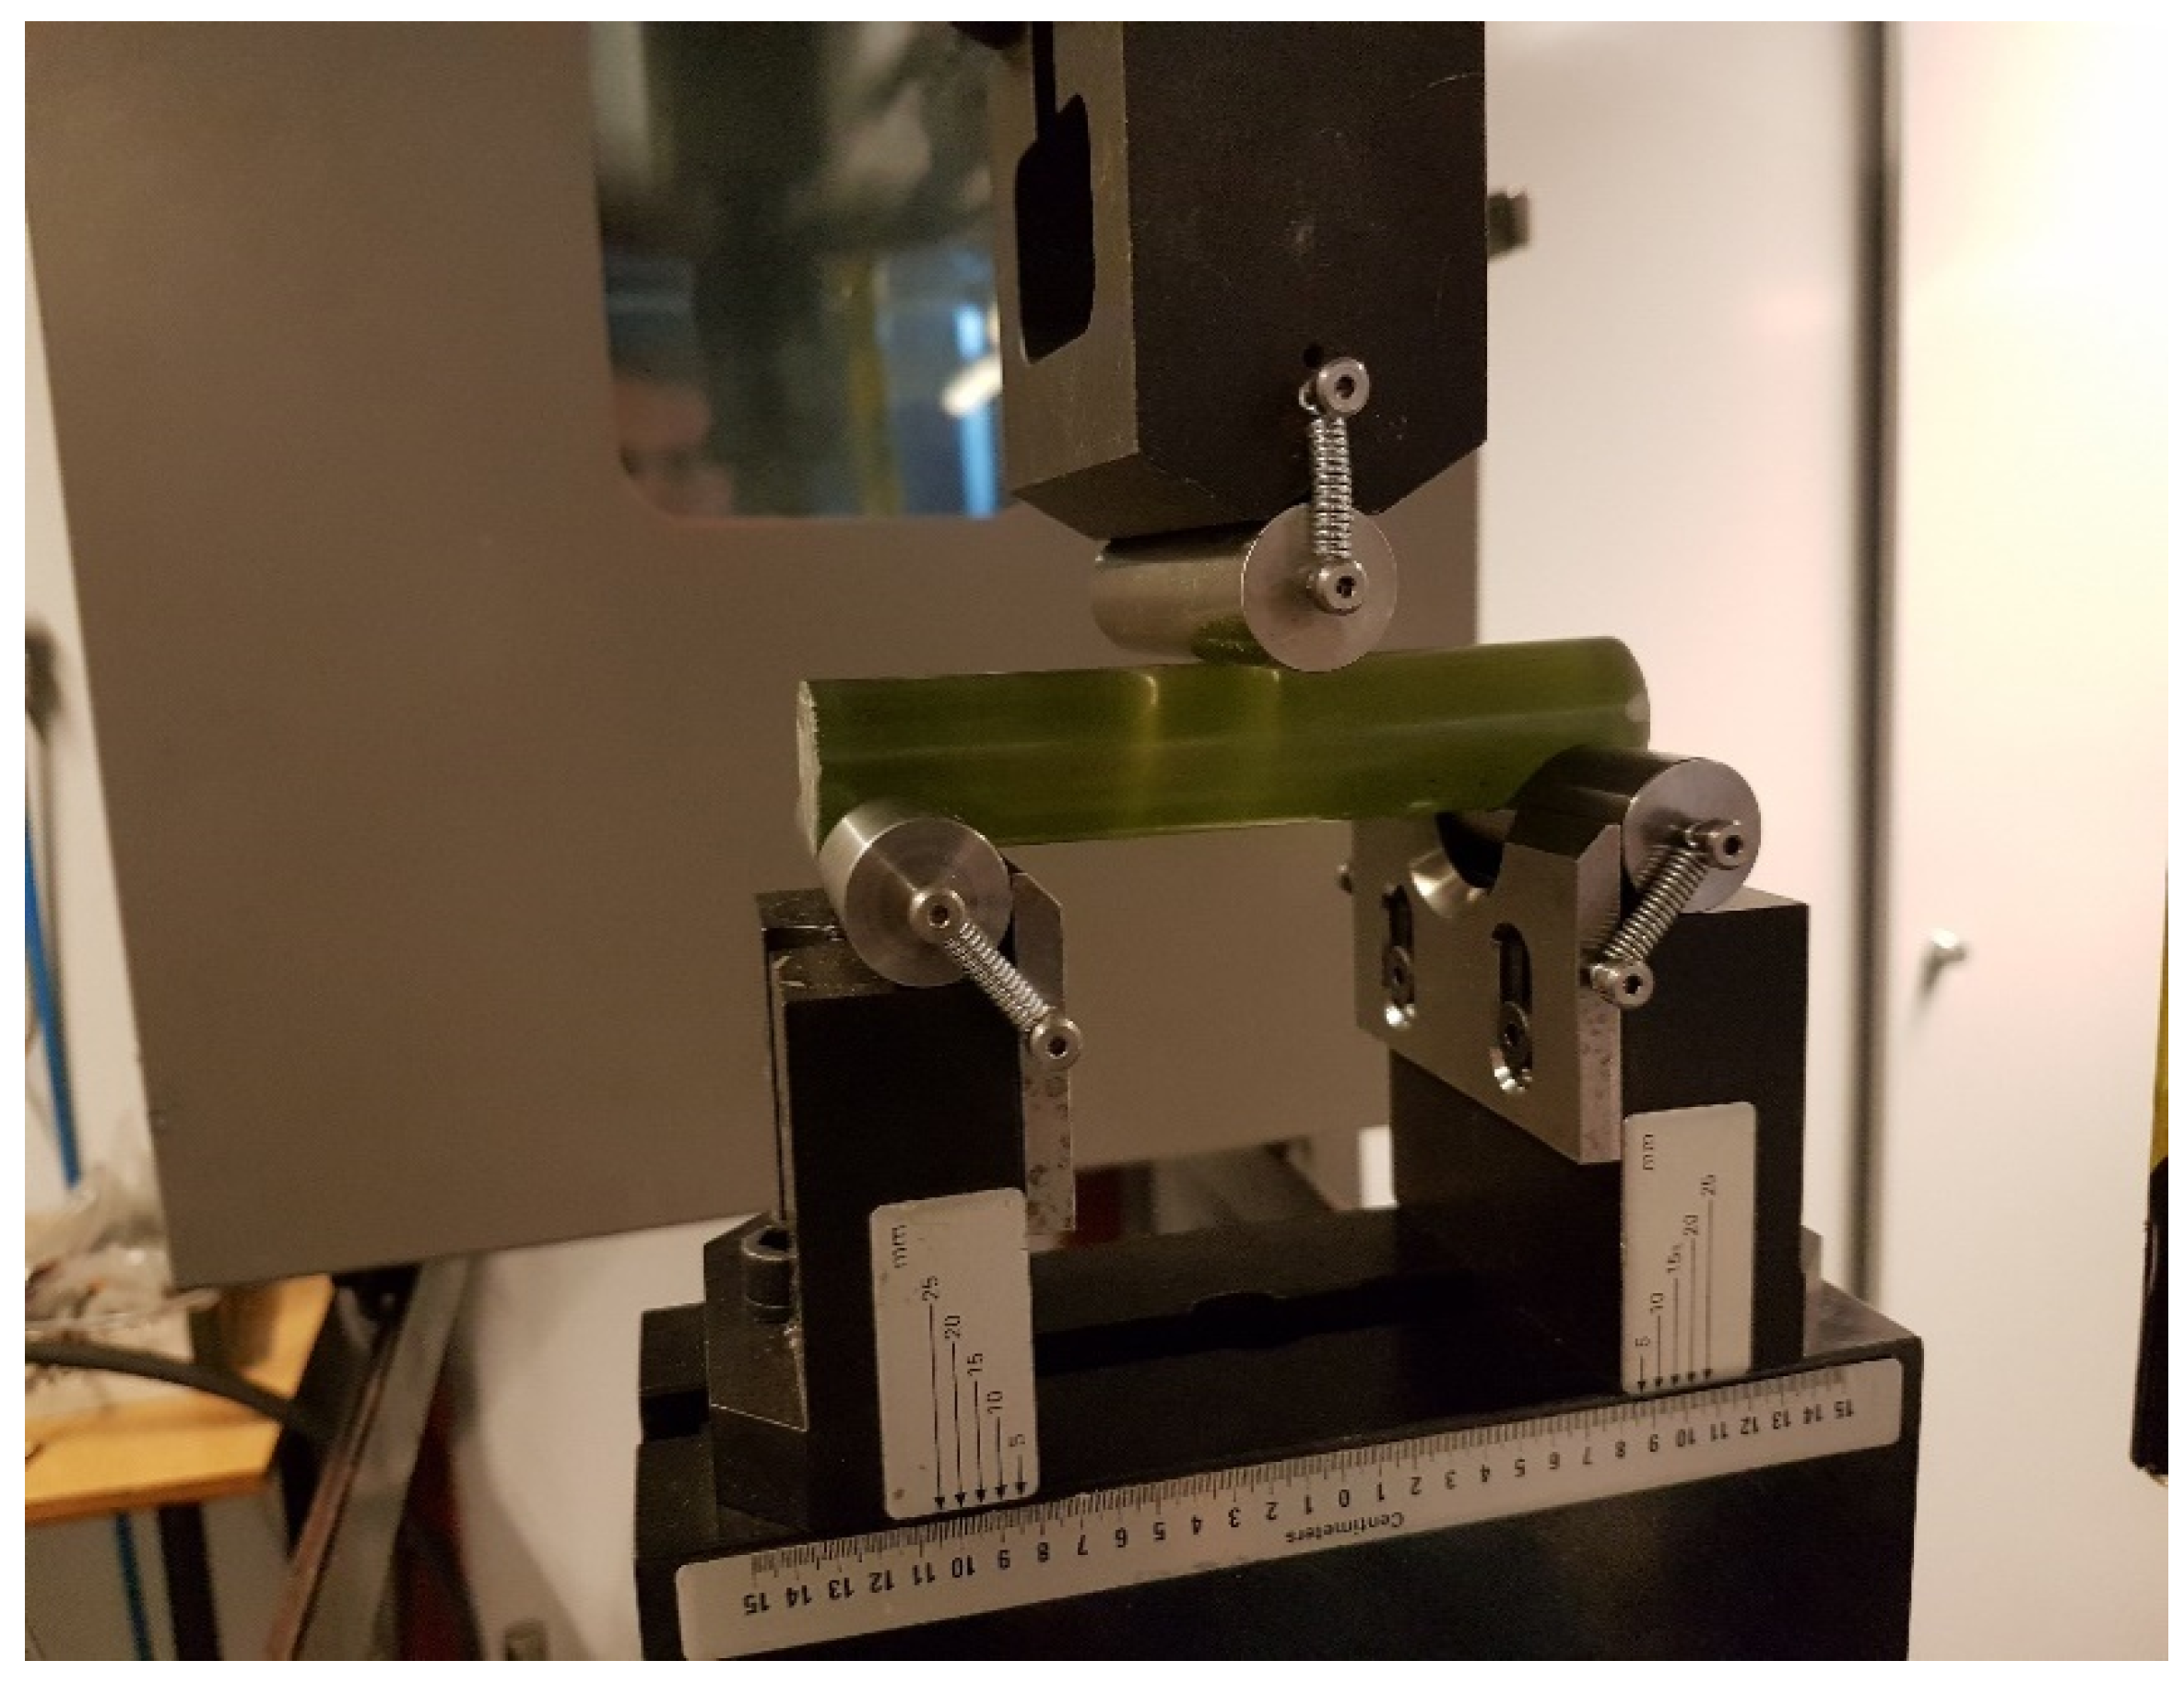
  • l—distance between supports in the measuring system, equal to 100 mm;
  • d—diameter of the cylindrical sample, equal to 24 mm.
Taking into account the fixed values occurring in relation (1):
σ f = 0.0184 × F
In addition to the 3-point bending test, we performed a micro-hardness examination of the sample material. It constituted an important supplement to the results of the optical method of the material testing. It also made it possible to independently assess the material homogeneity and cohesion. The measurements were made using the Vickers method (with a typical micro-hardness measurer) at 1 kG load of the indenter. We used a semi-automatic mode of measuring the imprint diameter. It should be emphasized that, apart from the obtained average values, the scatter of results (which proves the homogeneity of the microstructure of the material) provides important information.

3. Results

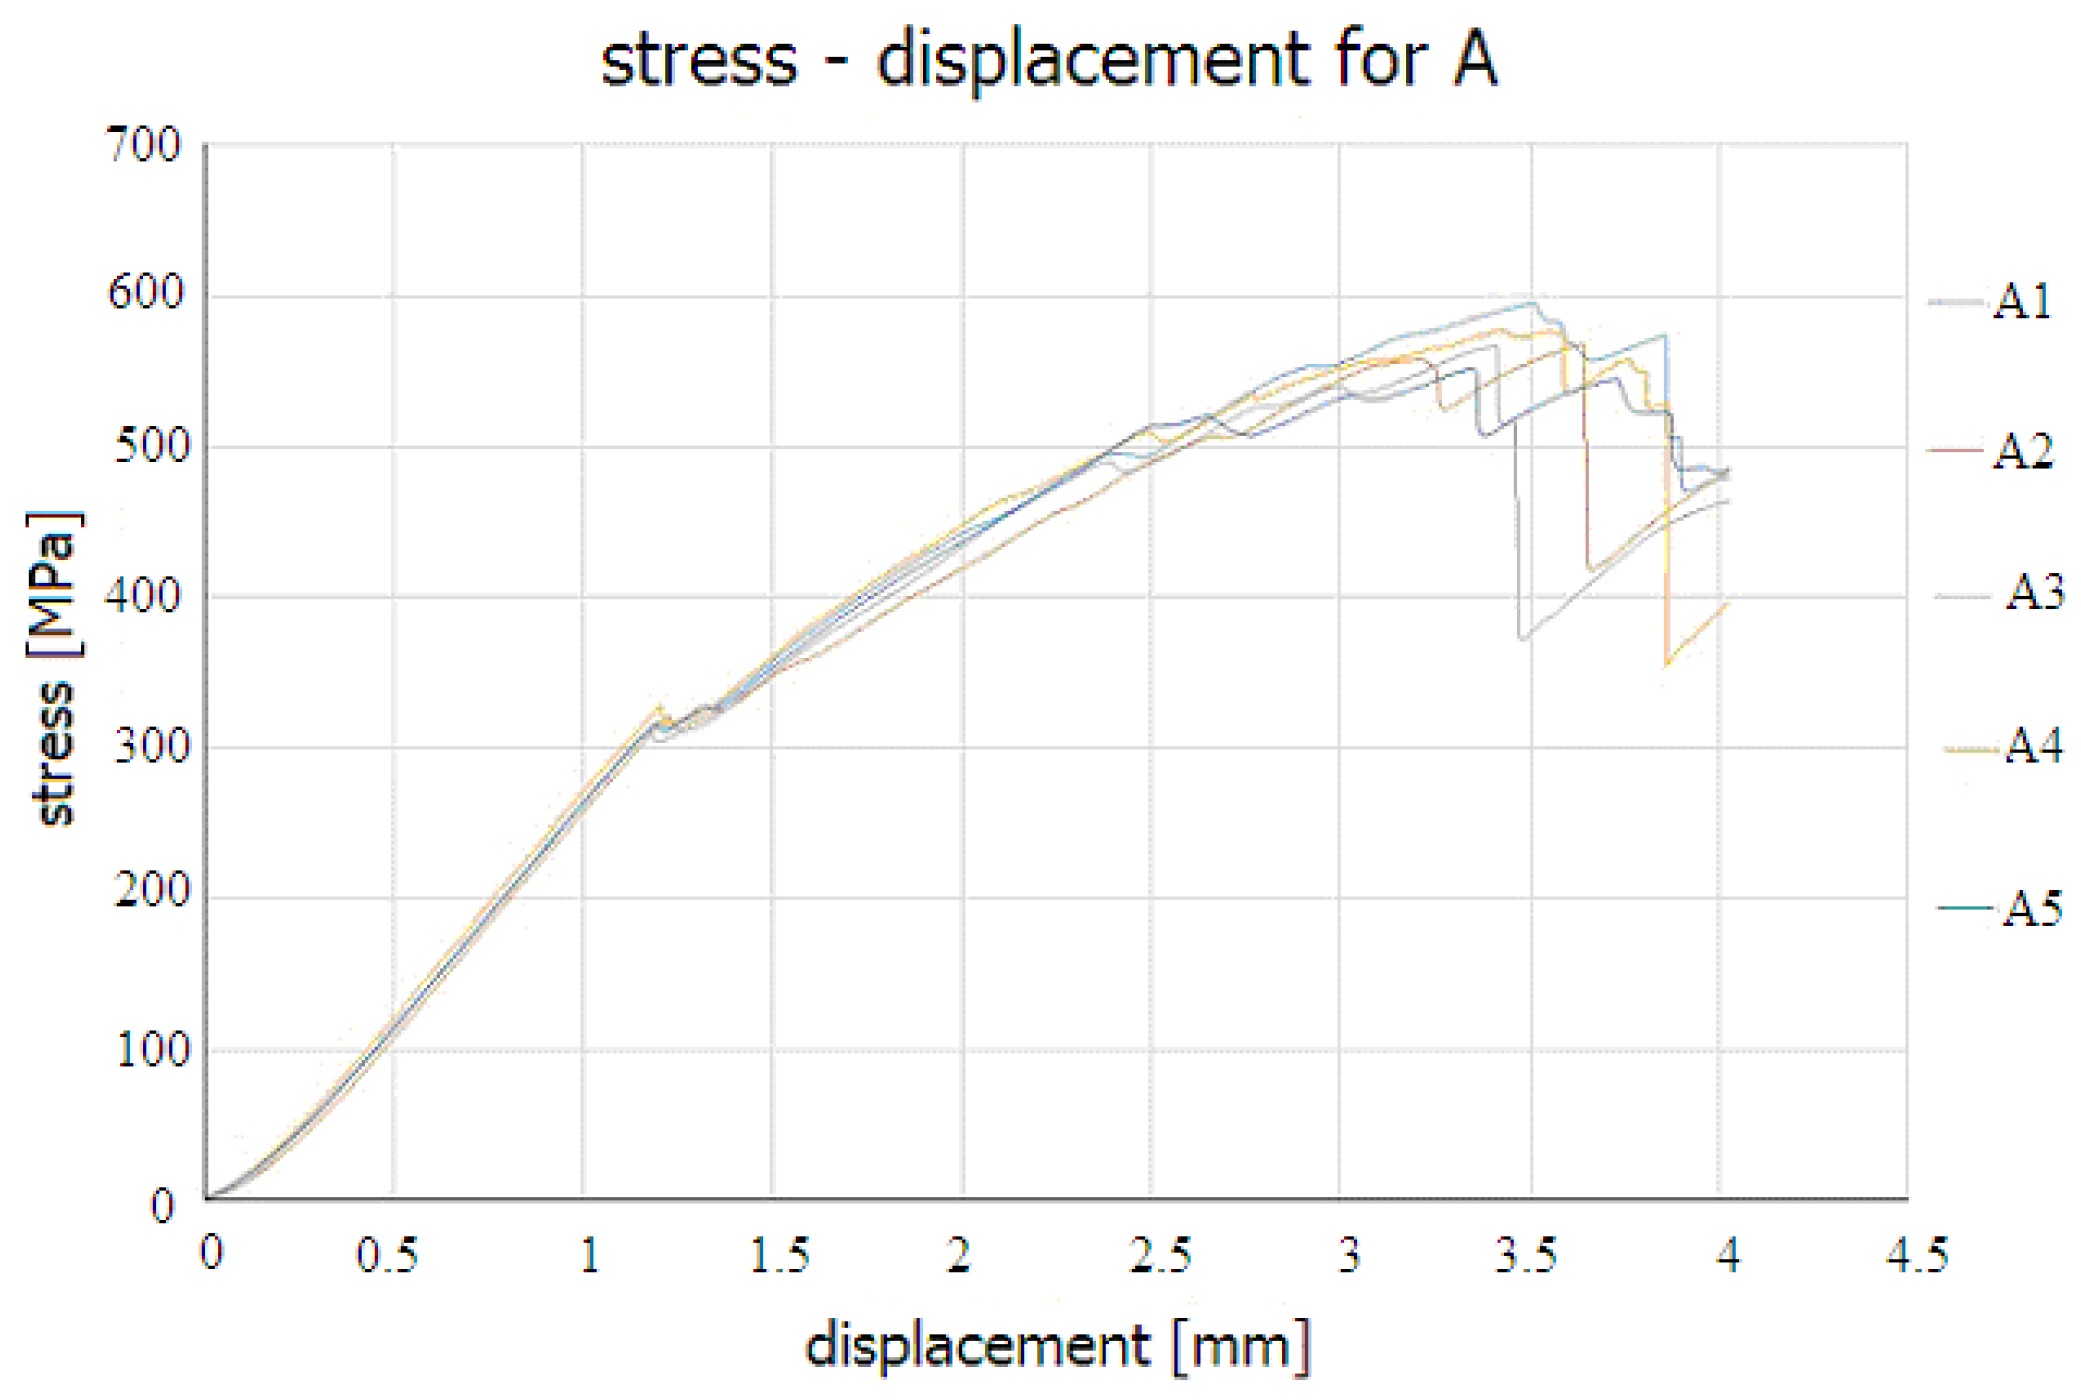
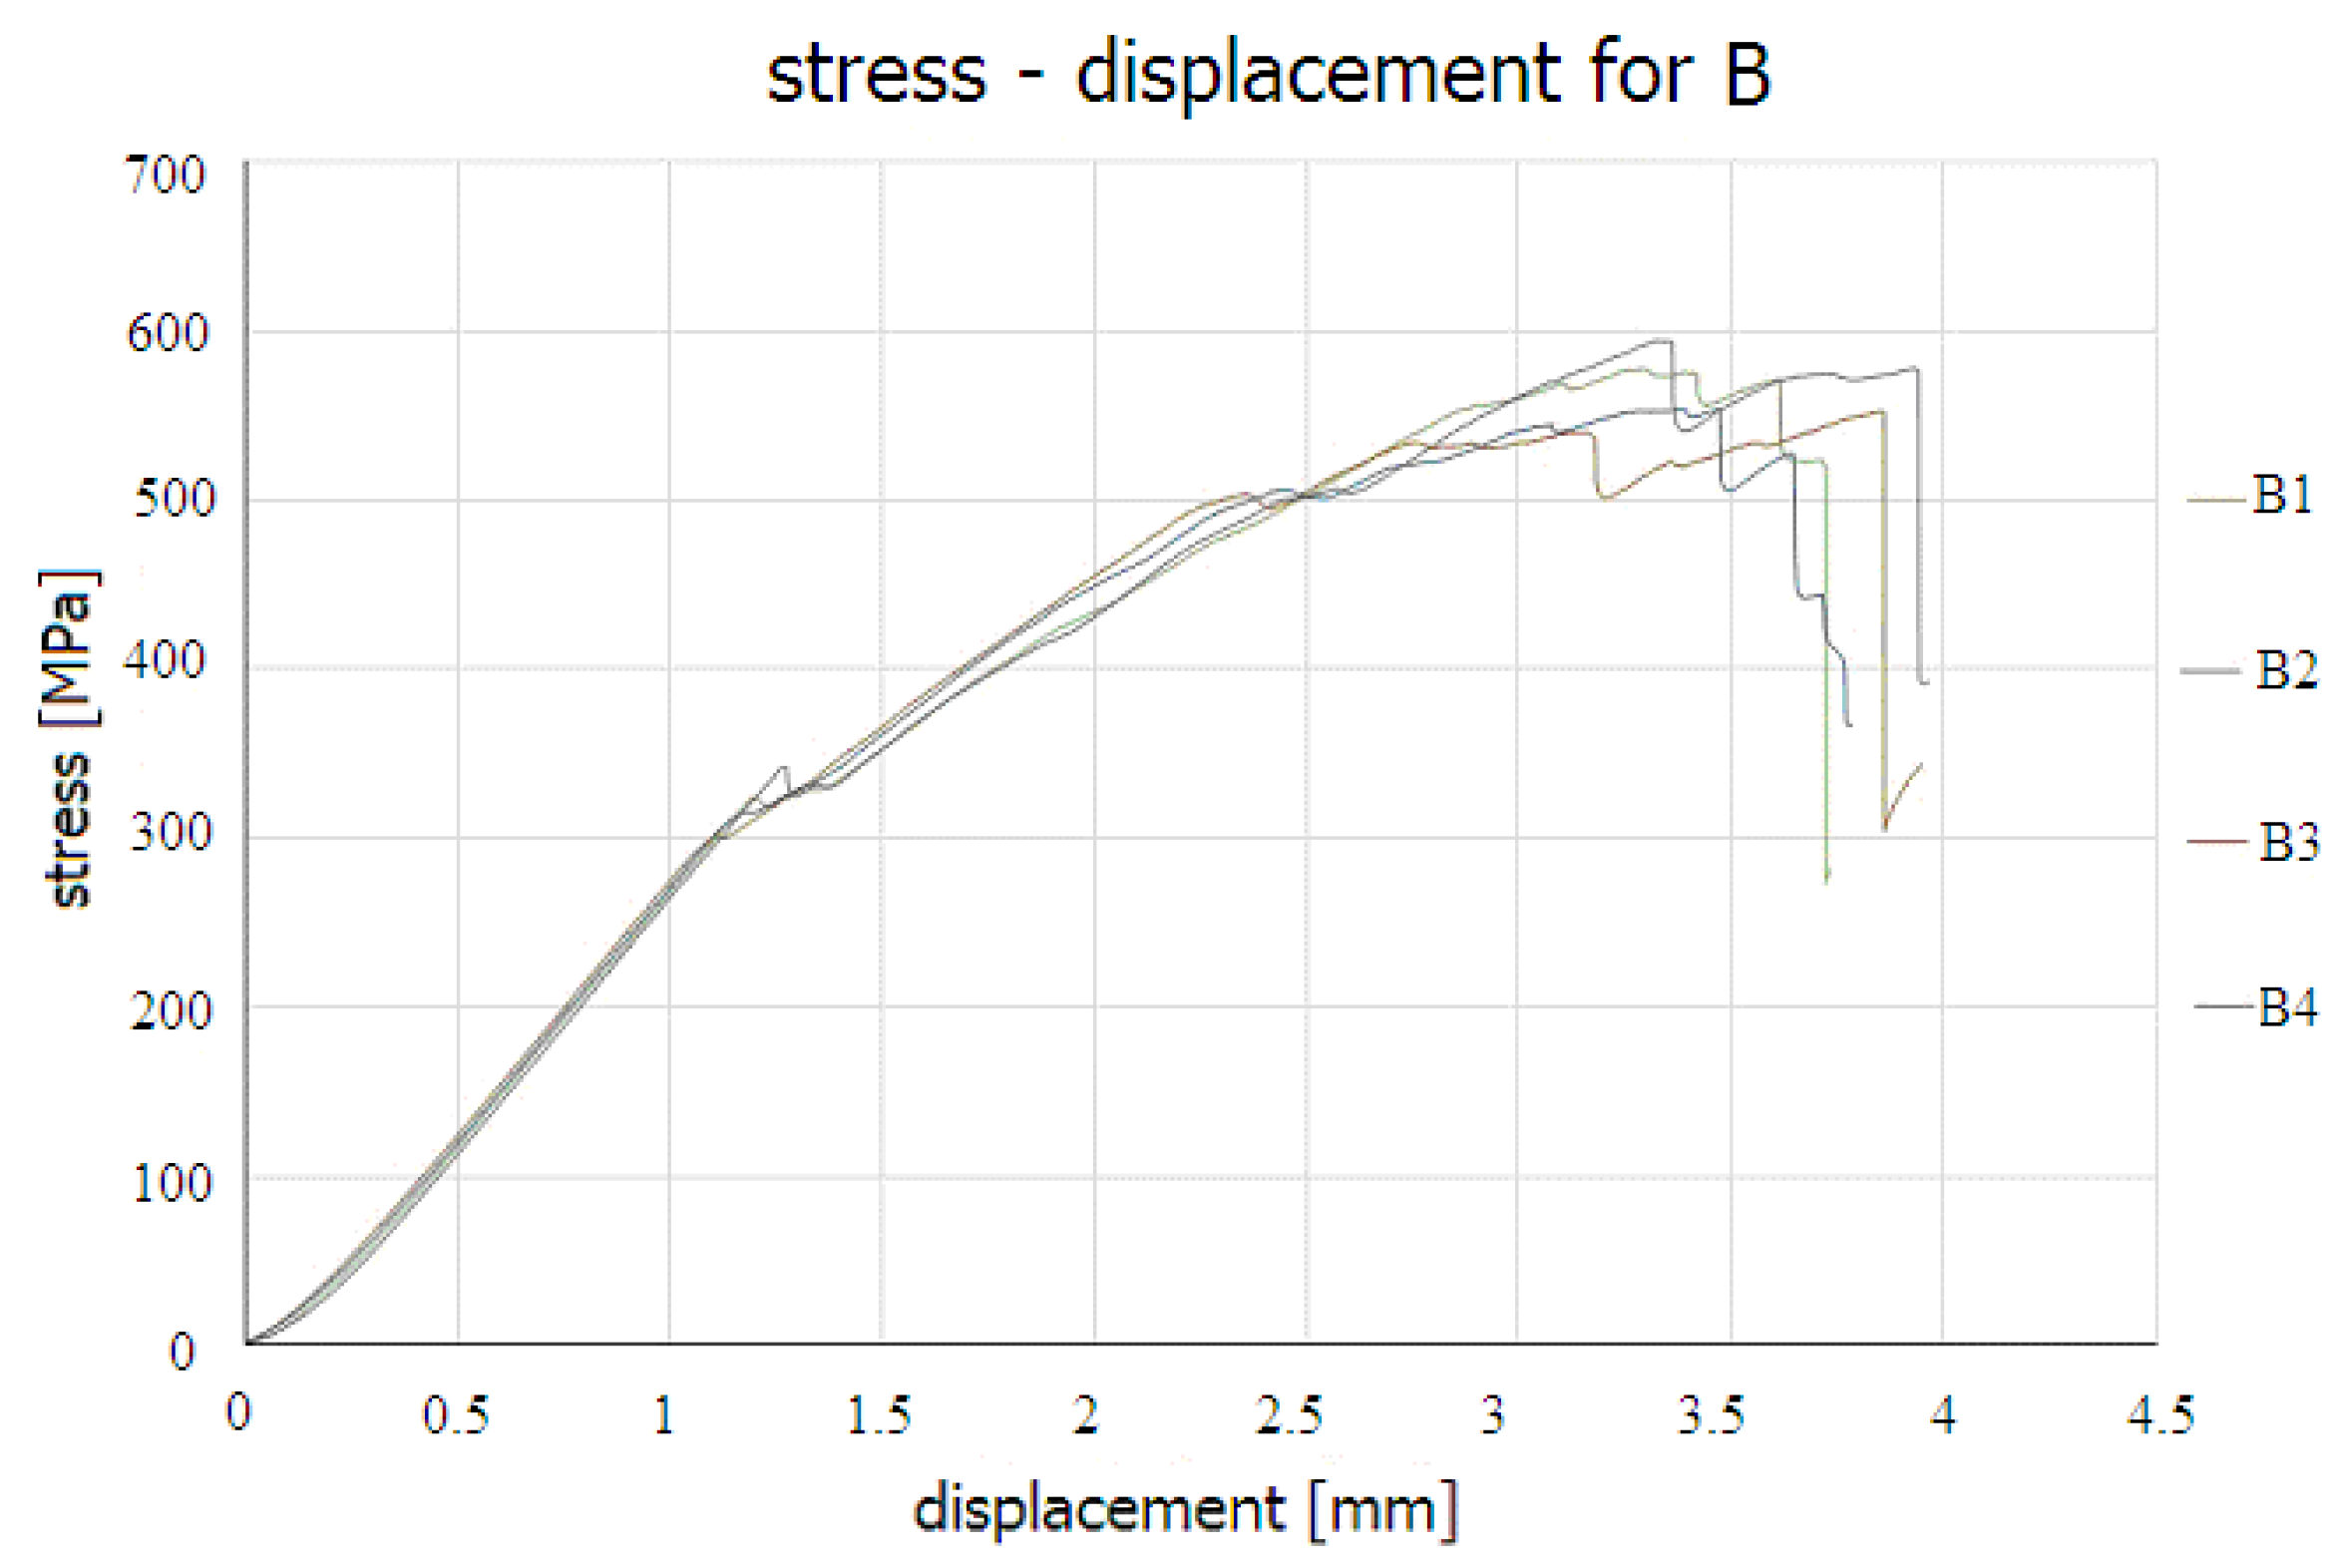
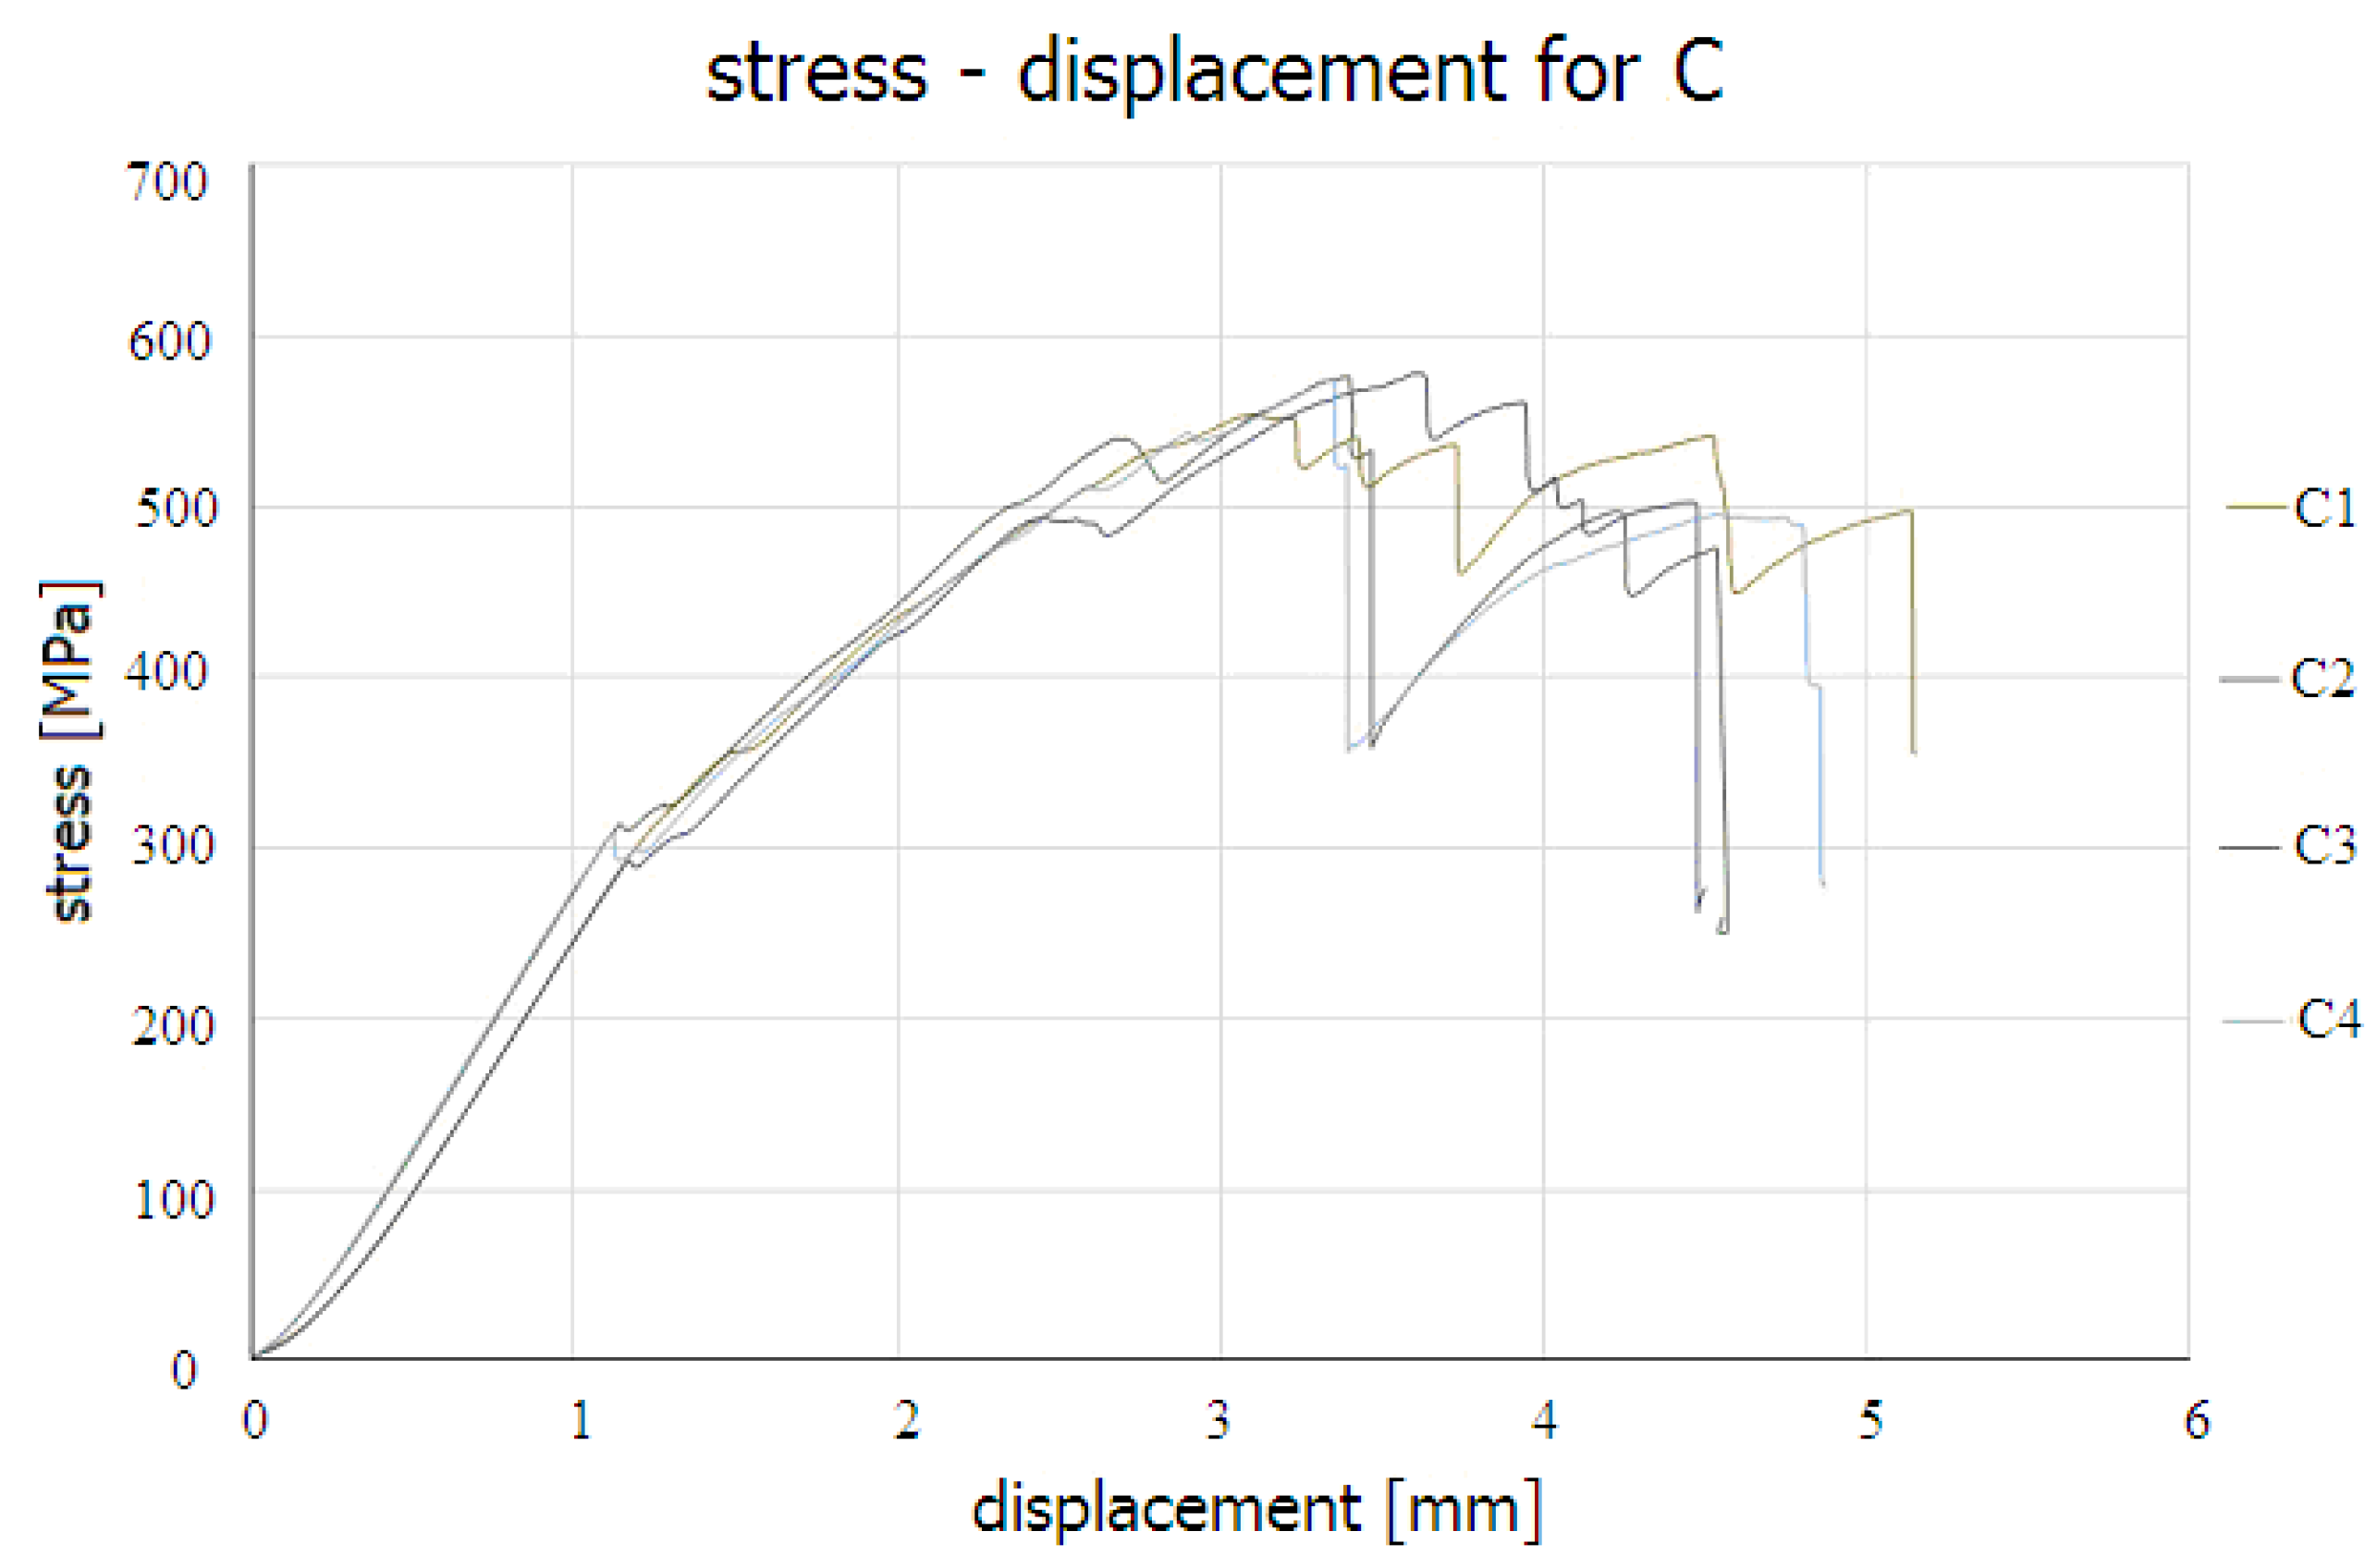
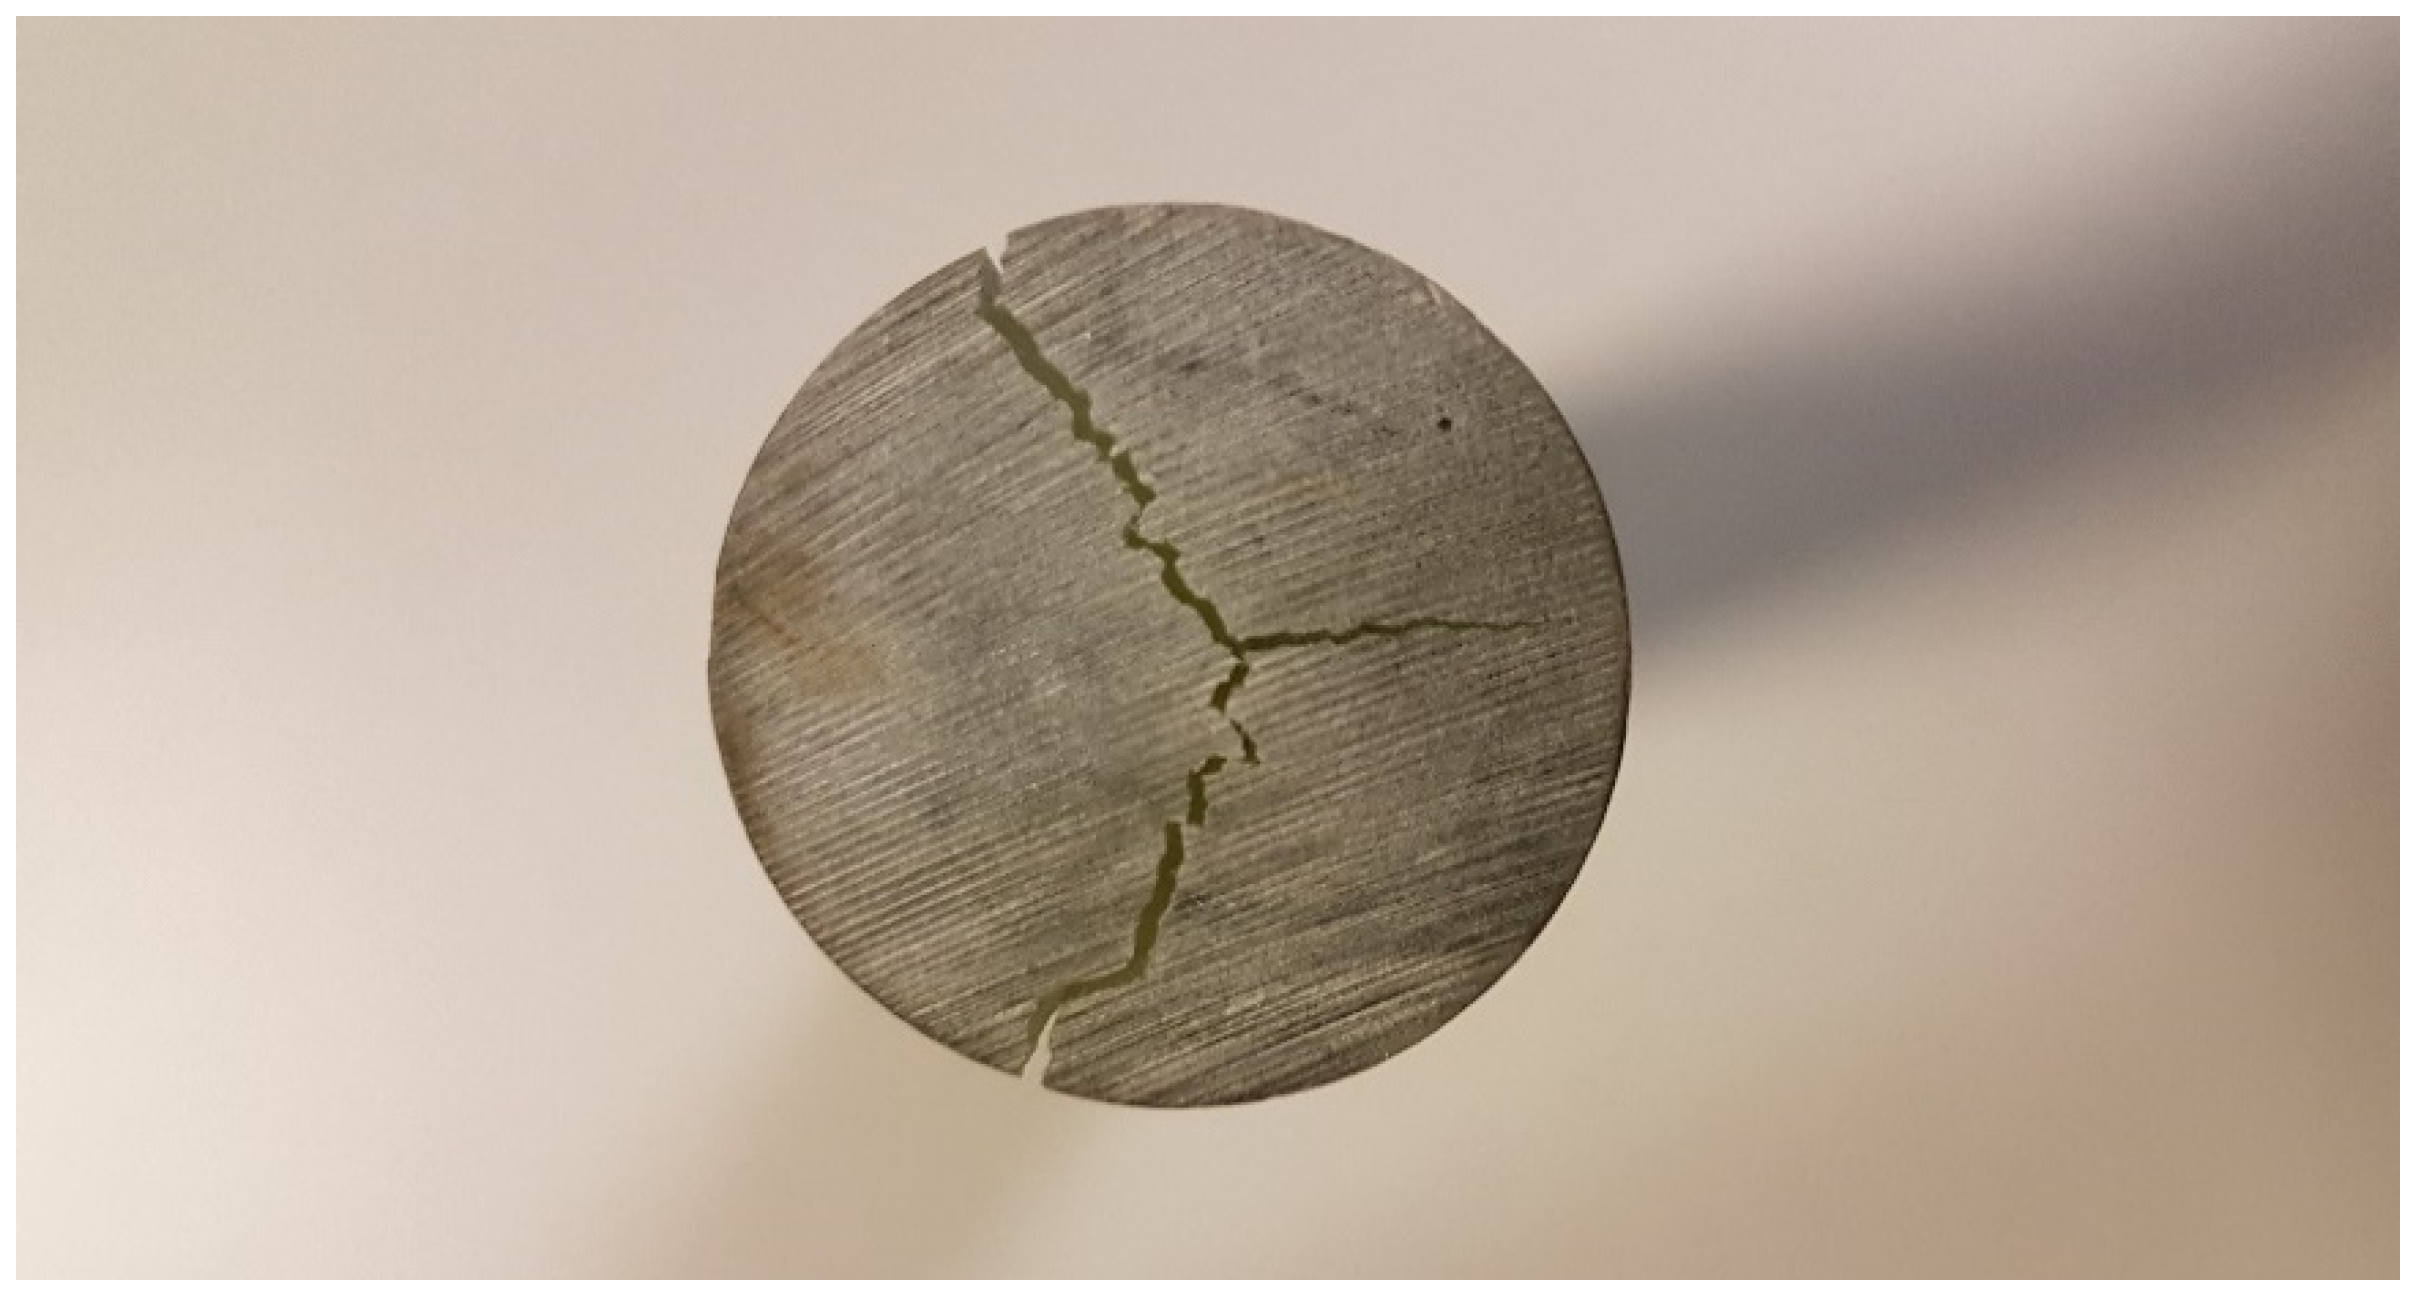
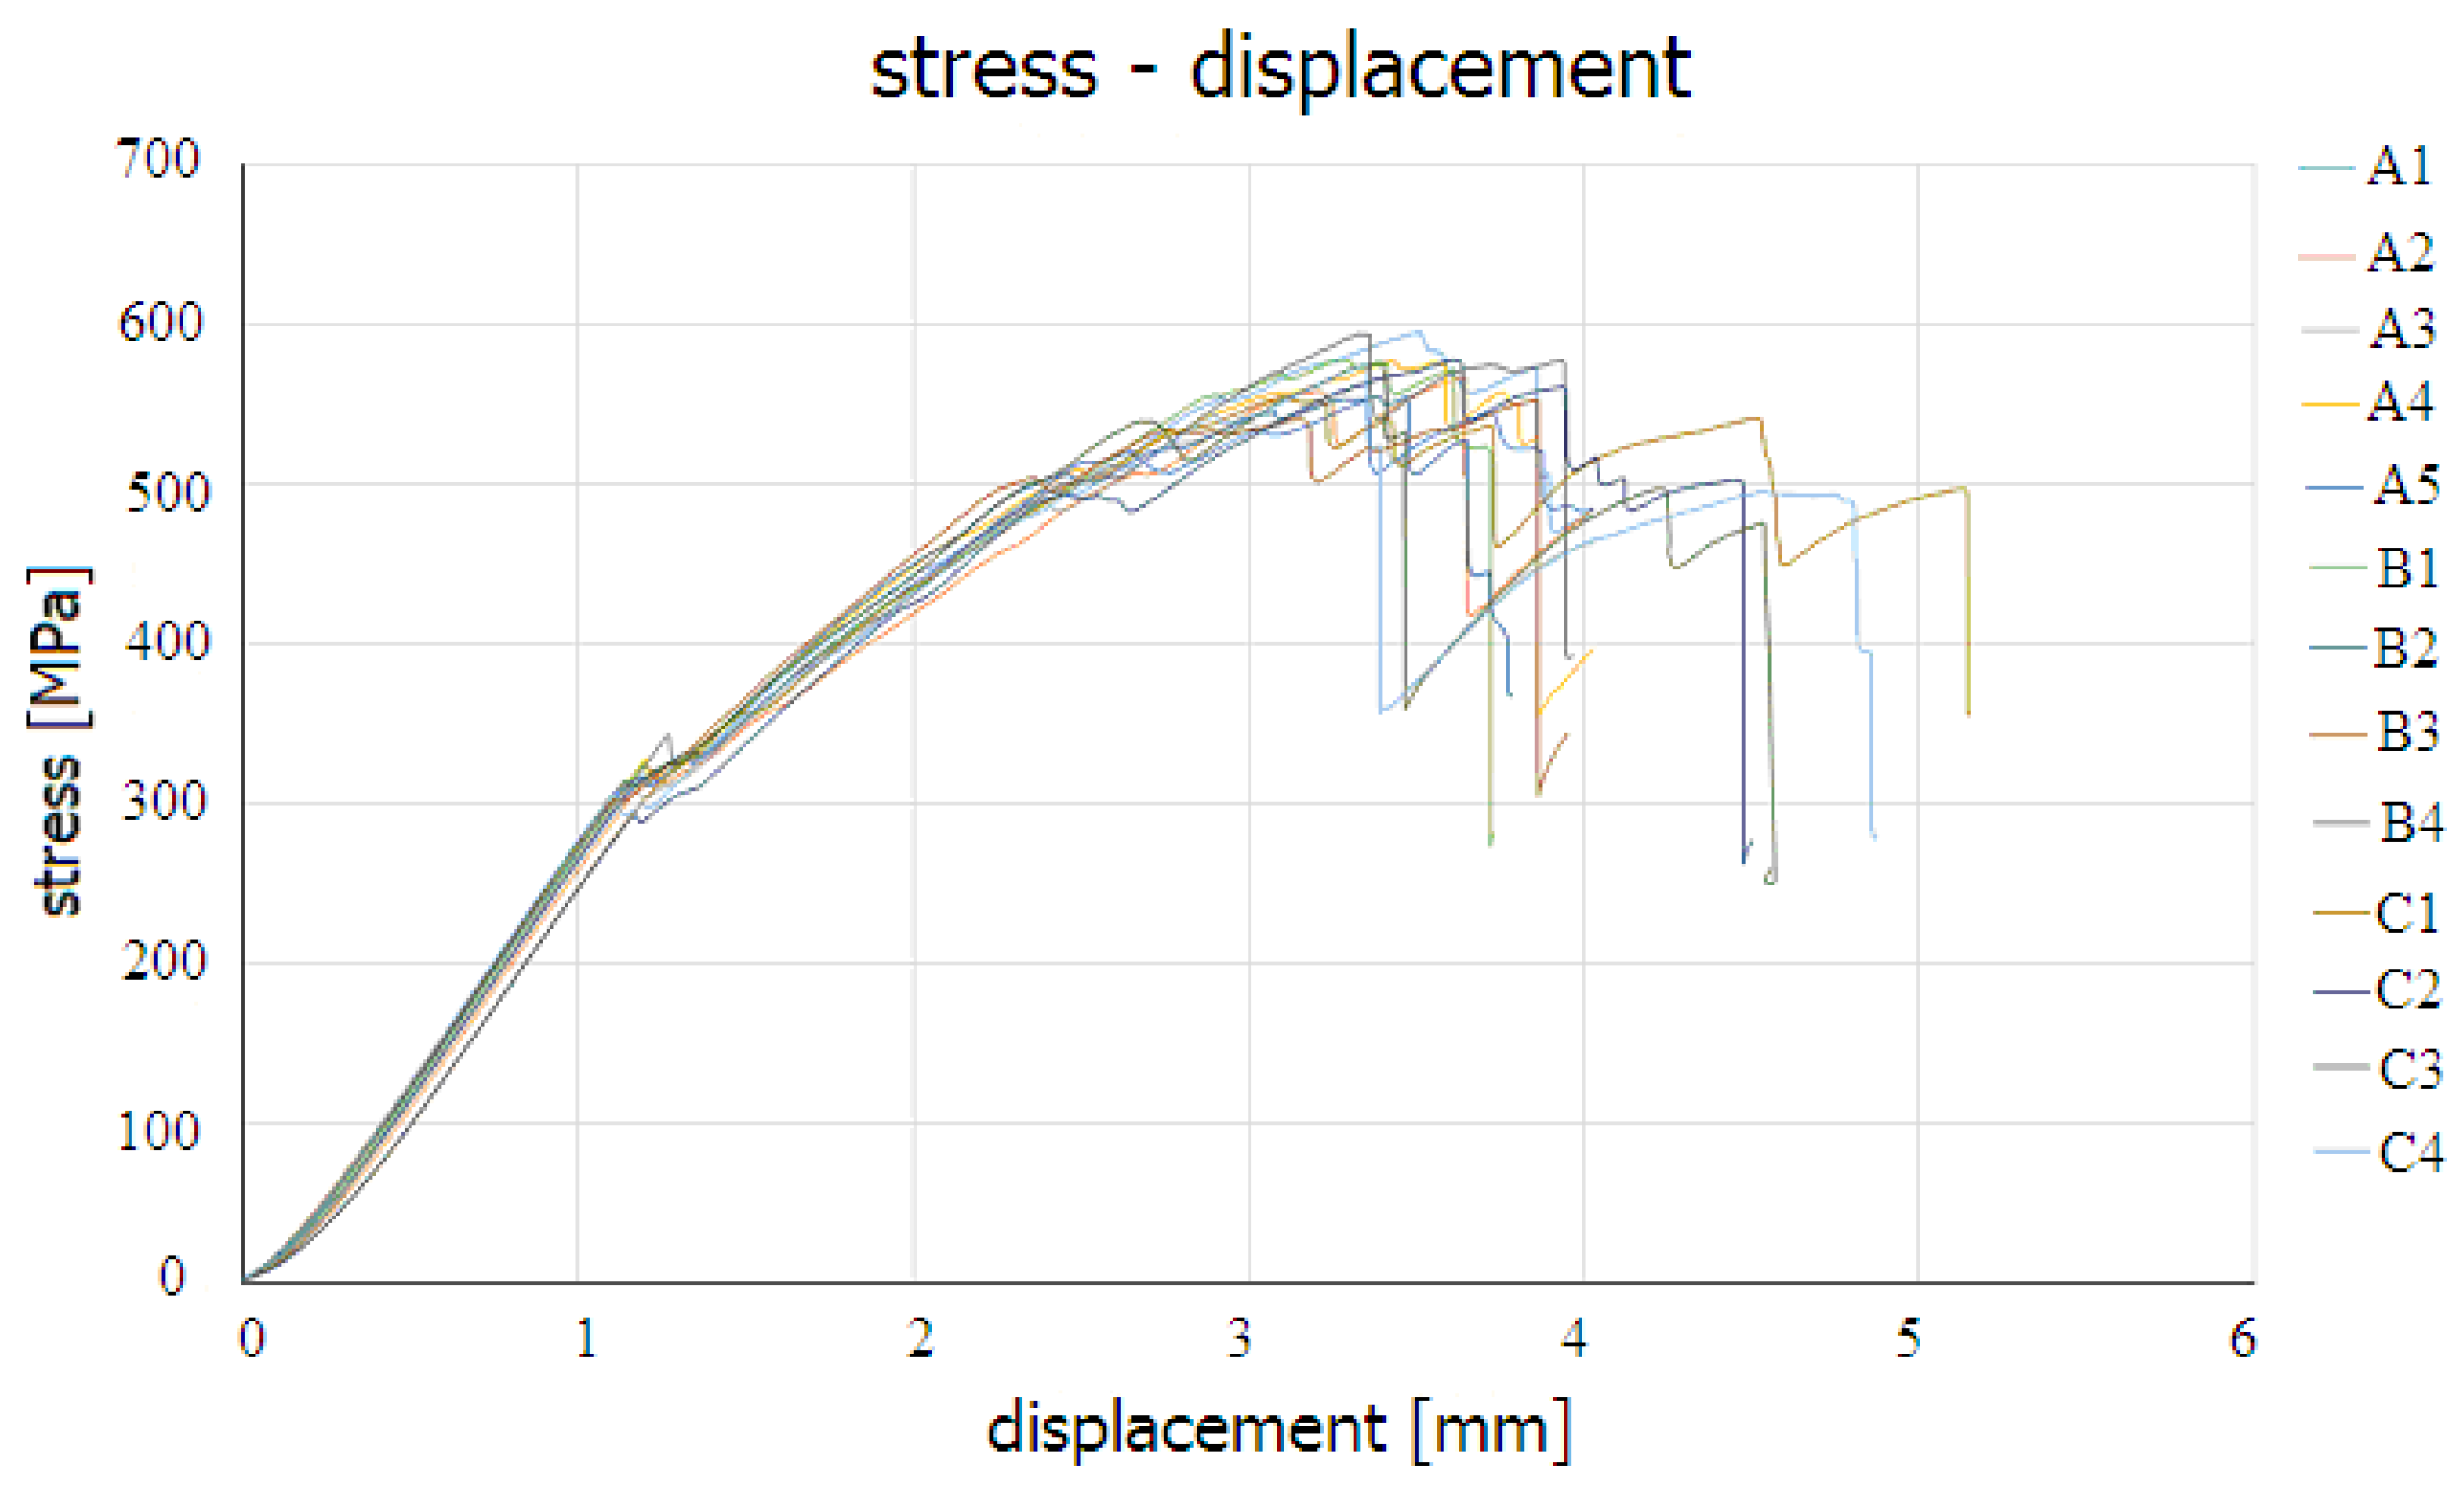
3.1. Mechanical Strength Tests

The mechanical characteristics of the 3-point bending test for all 13 tested samples showed a very high similarity (Figure 5, Figure 6 and Figure 7). Small differences occurred individually for particular samples, but there were no differences in the characteristics of the samples that would be typical for groups A, B or C. For a stress that usually slightly exceeds 300 MPa (294–345 MPa for individual samples), the displacement linearly increased when stress increased. The slope of characteristics was identical for all tested samples. A slight non-linearity at the beginning of the characteristics resulted from the arrangement of the samples in the clamping system. When the stress reached about 300 MPa, the samples broke axially. Long cracks were formed that extended symmetrically from the middle of the samples and were present on the upper and lower side of the specimens, as illustrated in Figure 8 and Figure 9. These cracks usually did not reach the ends of the samples. The formation of cracks, accompanied by a well audible crackle, was reflected by a clear fault, sometimes even two faults, on the samples’ mechanical characteristics. This effect occurred for all tested samples and only the length of axial cracks differed. The formation of these cracks can be considered as a critical point. Sample stiffness was clearly reduced and, therefore, the slope of the further part of the characteristics already showed some differences for individual samples. There were also deviations from the straightforward course of the characteristics. Additional faults, visible on the characteristics of individual samples, corresponded to the formation of consecutive cracks and the enlargement of existing ones. This was largely random, hence the significant differences in the characteristics of the different shapes. However, it should be emphasized that there was no apparent link between these discrepancies and the group to which the samples belonged.
Notwithstanding any differences in sample characteristics above the critical point (indicating the load where the breaking of the reinforcement initiates), samples exhibited high repeatability of the maximum stress value. When this value was reached, faults were produced, often with a large decrease in stress. In addition to audible cracklings, this indicates the formation of subsequent cracks that substantially reduced sample rigidity. It should also be noted that the samples did not deflect during the test. The recorded displacement of the crosshead (on the order of a few millimeters) caused the test samples to significantly indent, as illustrated in Figure 8 and Figure 10. Additionally, at higher force values, steel components of the measuring system underwent deflection. After taking the samples out of the clamping system, they did not show the slightest bend. However, most of them had cracks on flat side surfaces, as seen in Figure 11. In Table 1, Table 2 and Table 3, the values of maximum force and stress were collected for all tested samples. Table 4 shows averaged values of maximum stress, together with standard deviation, for all three groups of samples.
All recorded mechanical characteristics of the 3-point bending test were collected (Figure 12). The figures and tables illustrate the reproducibility of the results obtained from the 3-point bending test.

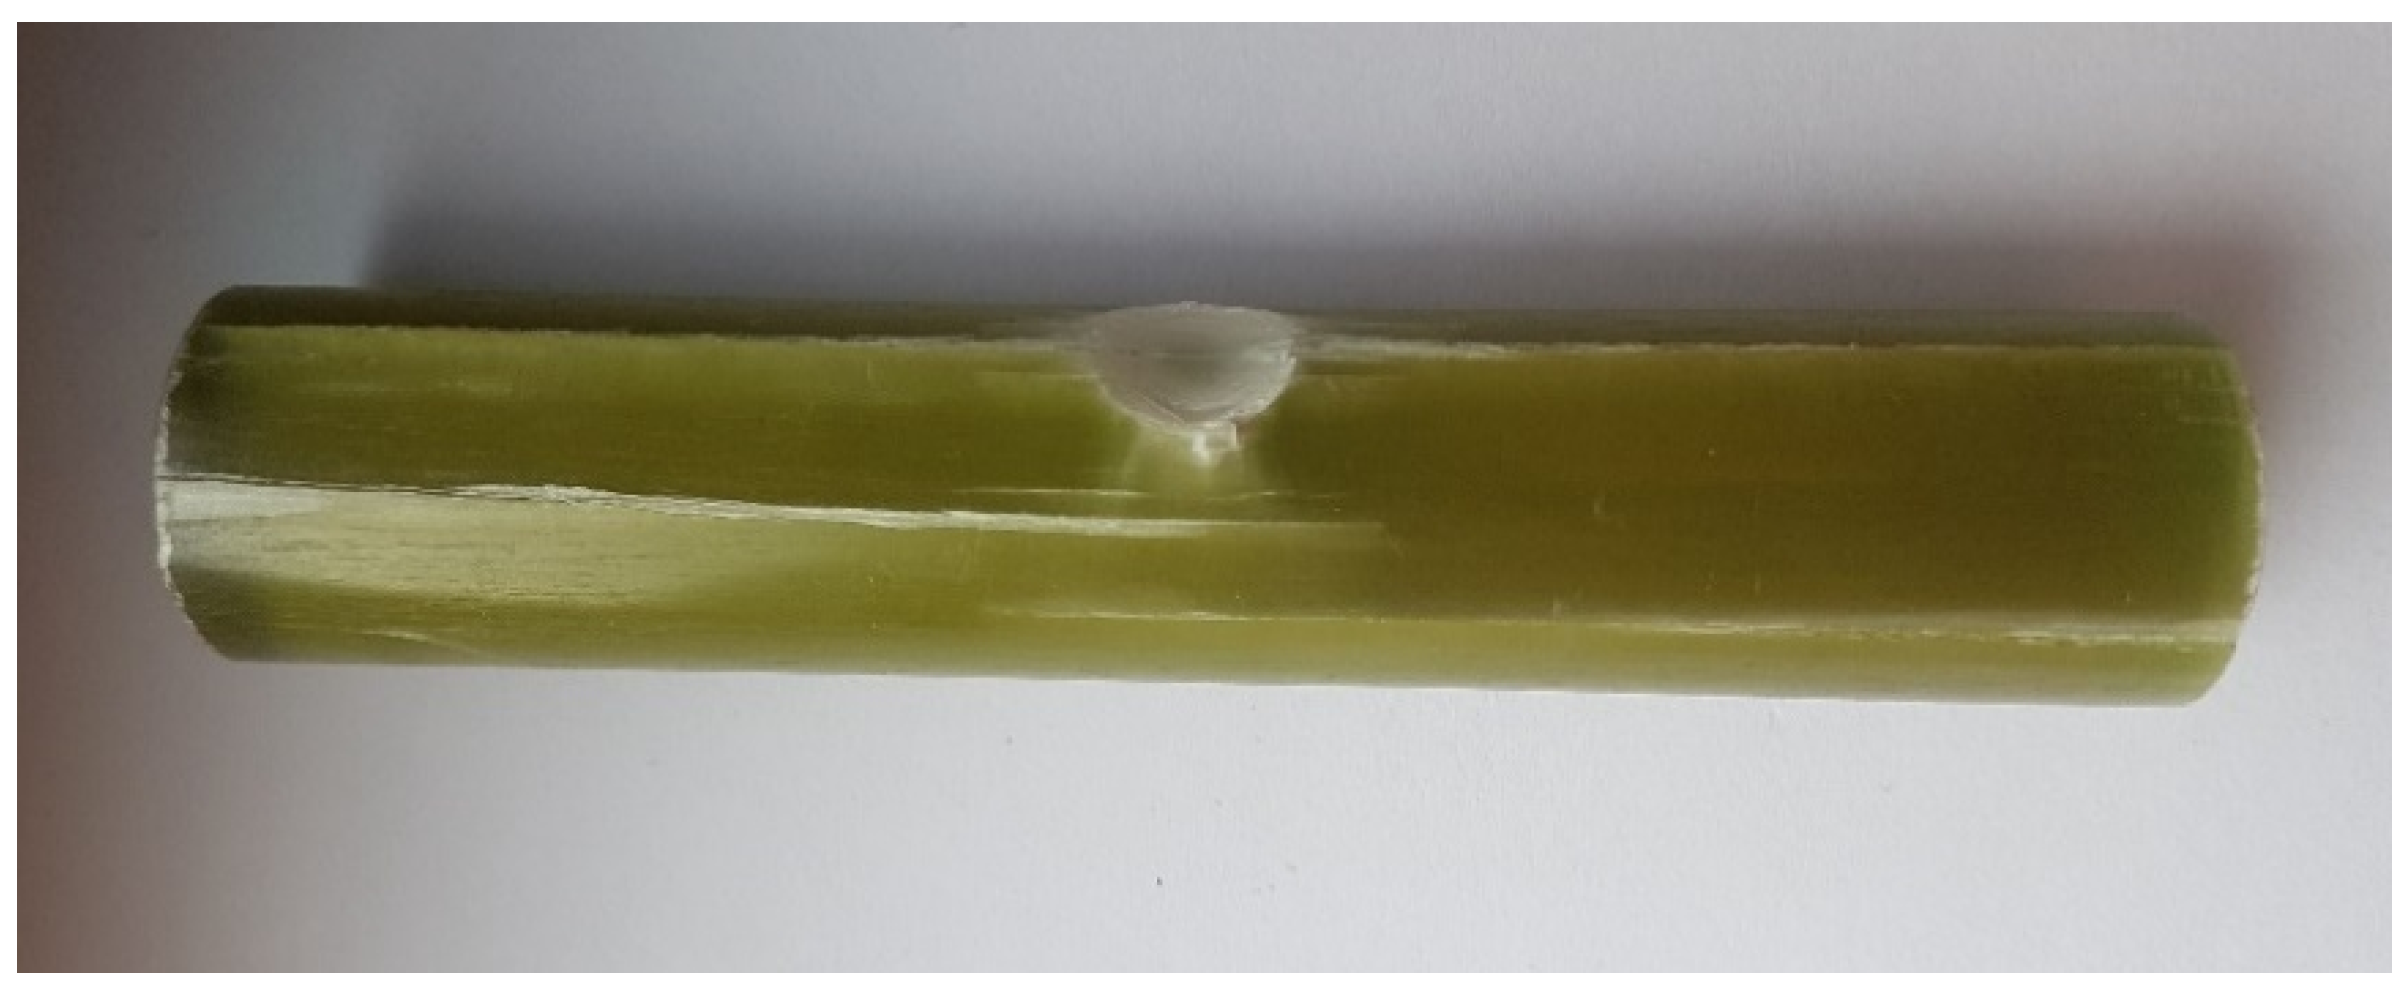
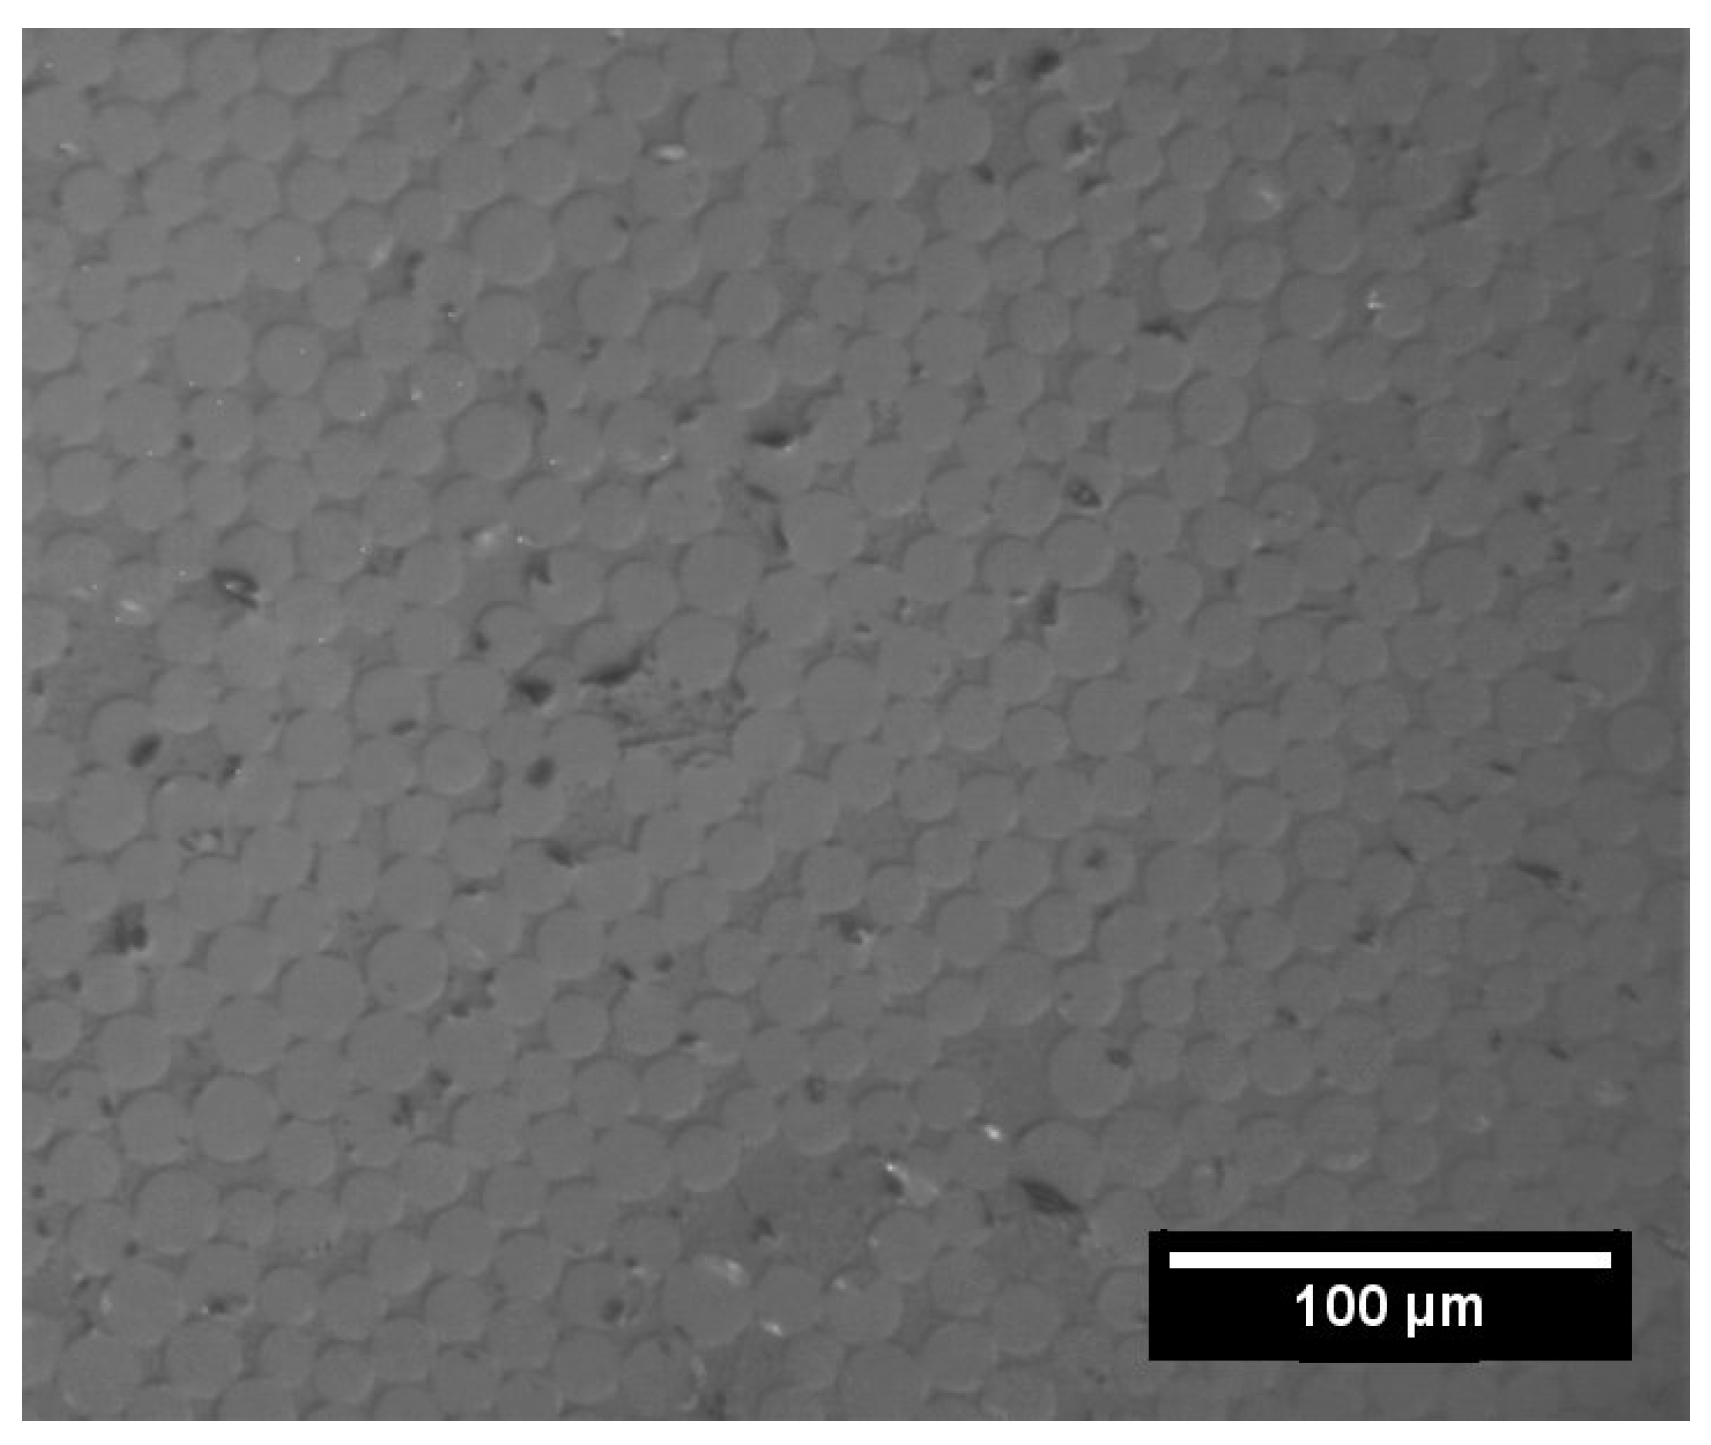
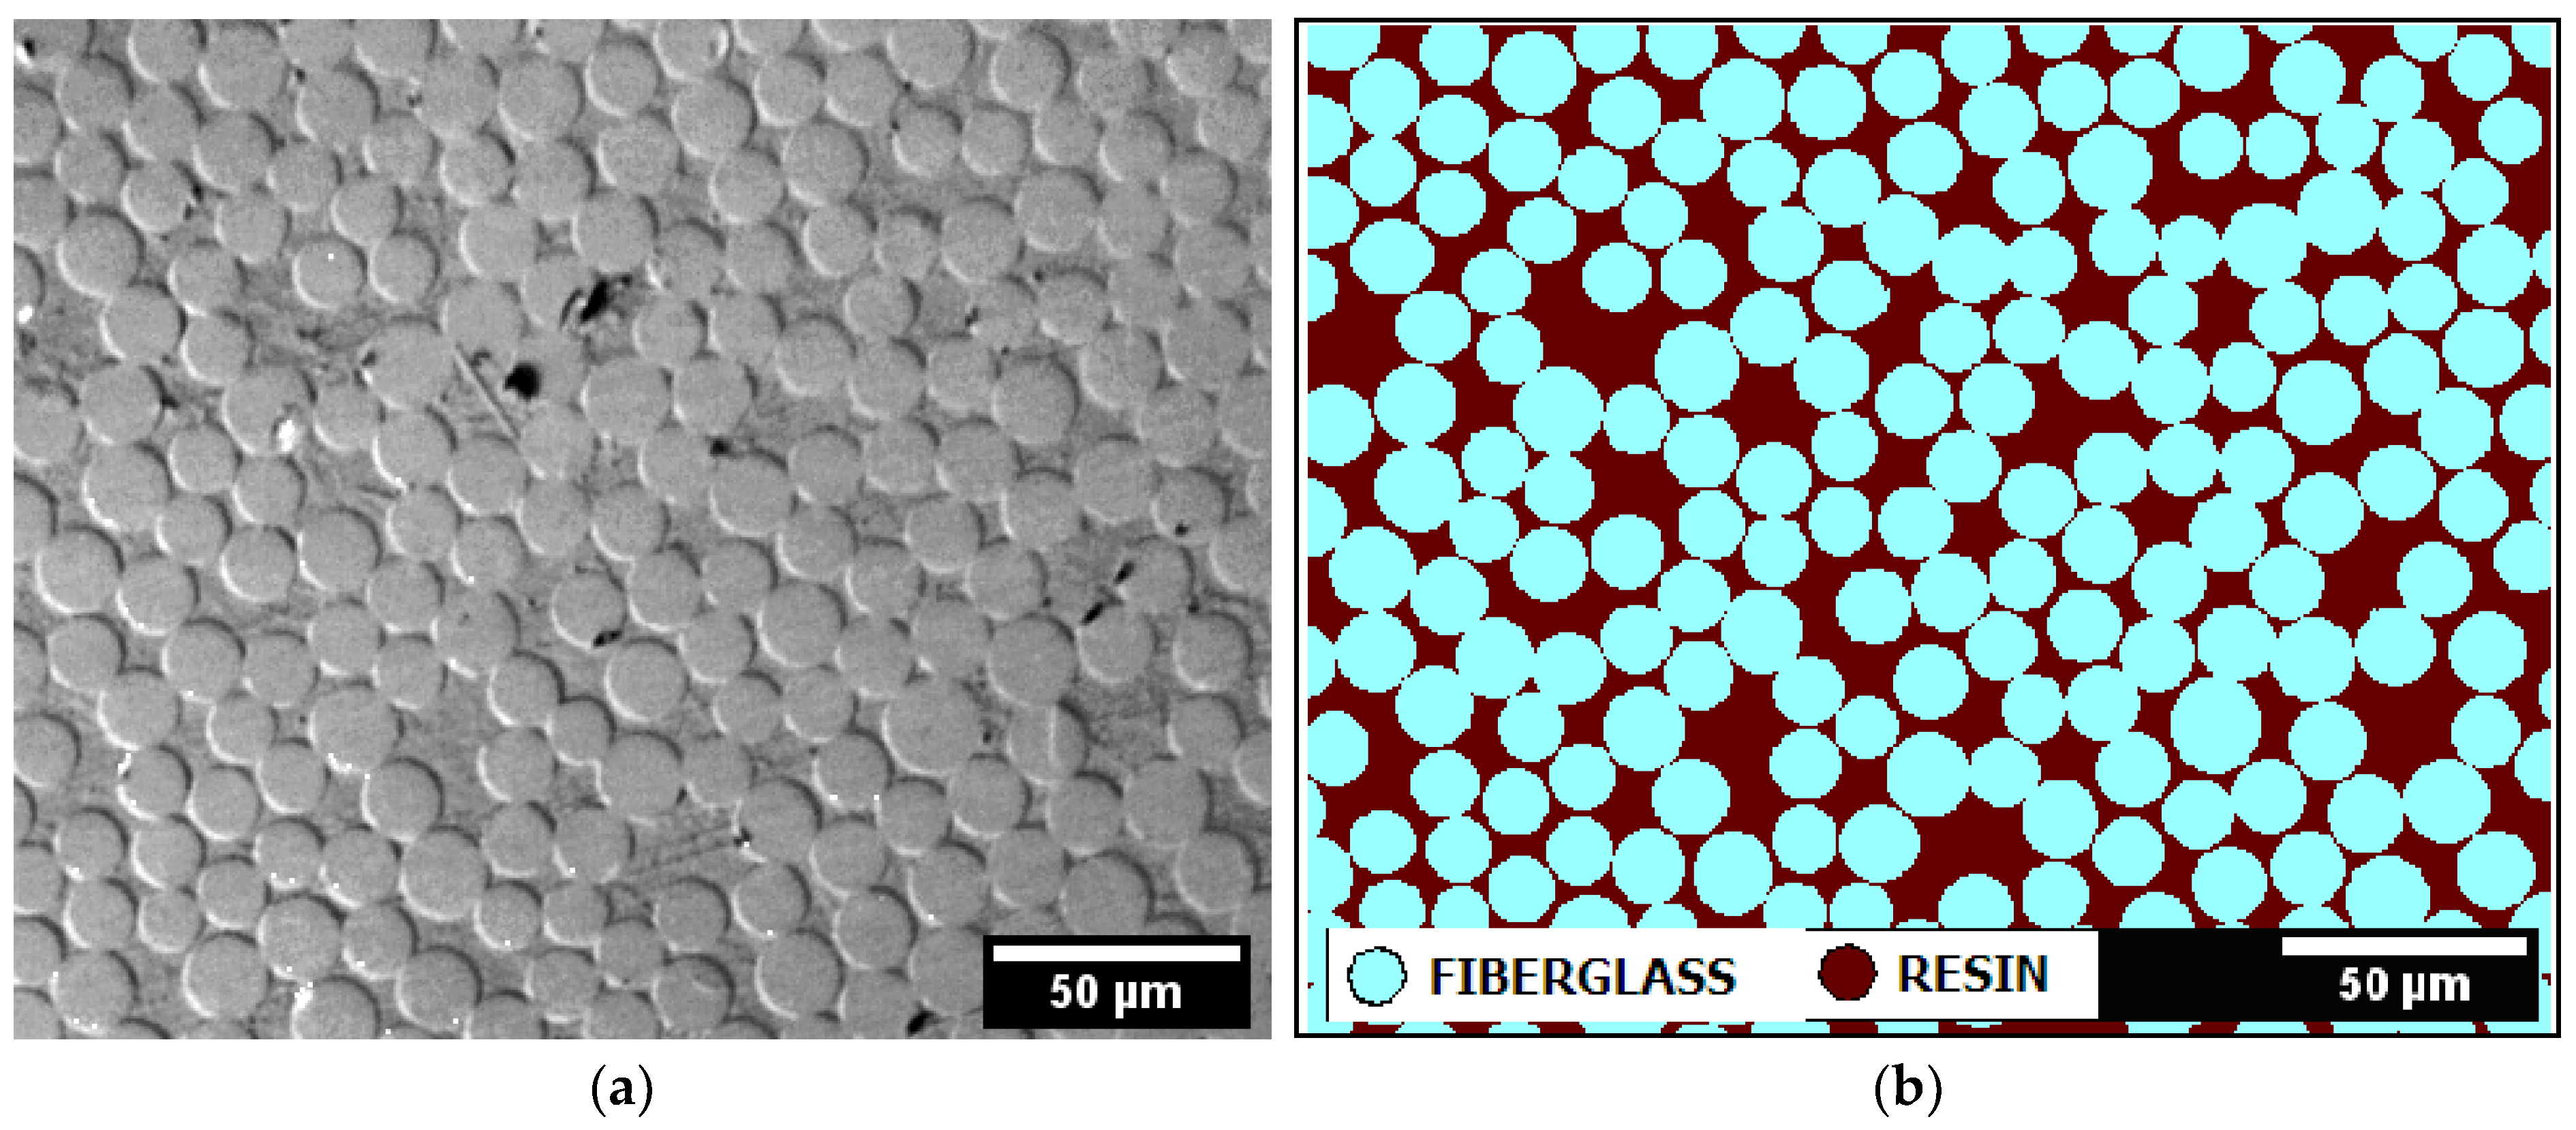
3.2. Microscopic Examination of Samples

Microscopic examinations were carried out on the flat side surfaces of the samples, which were randomly selected from all three groups: A, B and C. For this purpose, fragments of the material were cut out of the selected samples. Further, we made so-called metallographic micro-sections, which were also used in micro-hardness measurements.
The metallographic micro-sections were prepared on a Struers LaboPol-2 polishing machine. The surface of the samples were grinded using SiC abrasive papers, and then polished using Struers DiaPro diamond suspension with the grain diameters of 3 µm and 1 µm. The final polishing was carried out on a colloidal SiO2 suspension, with a grain size of 0.04 µm (Struers OP-S suspension). After each grinding and polishing step, the samples were washed in an ultrasonic washer in ethyl alcohol.
The analysis of microscopic images concluded that the microstructure of the tested material was characterized by high homogeneity. Images from different places on the tested surface, both from the same and different samples, showed no differences. The tight arrangement of fibers and binders (in the form of epoxy resin occupying about 1/3 surface) was analogous to all of the tested observation fields. The glass fiber diameter was also the same (several micrometers) with a small size dispersion. It should be emphasized that there were no differences for individual samples from groups A, B and C. Neither the long-term subjection to a temperature of about 50 °C nor the combined action of temperature and DC voltage of 20 kV caused any observable effects in the material’s microstructure, which had been found in earlier studies [9]. Microstructure images of the sample material from all three groups are presented in Figure 13, Figure 14 and Figure 15. There were few small dark chippings in the microstructure elements (i.e., fiber fragments and, less often, binder). They were created during the preparation of the surface of the samples.
After appropriate reformatting of the 8-bit grey scale images and processing of these images with an optical microscope, the areas with the glass fibers and epoxy resin binder were depicted and distinguished more clearly, allowing for more accurate measurements. Image analysis was carried out with a Clemex computer-based analyzer. The blue phase was made up of glass fibers against a dark organic phase. The binary mask that was applied to the image, as shown in Figure 15, allowed for the quantitative measurement of glass fibers and resin content in the material and facilitated the determination of fiber diameters. Figure 16 shows the size distribution of glass fiber diameters obtained by averaging three microscopic images (A, B and C, one from each sample group).
On all tested micro-sections of samples A2, B2 and C3, glass fibers represented, on average, 67.0%. The differences for individual observation fields did not exceed 2.1%. The average value of the glass fiber diameter was 14.9 mm. The whole distribution was between 11.0–18.5 mm. However, over 90% of the fibers had a diameter in a narrow range, from 13.0 to 16.5 mm. The distribution was clearly multimodal, with fibers with a diameter of 13.5–16.0 mm dominating.
The microstructure of the tested GRE material of the HVAC composite insulator carrying rod was clearly assessed as entirely appropriate, compact and homogeneous. Chipping created during the grinding and polishing process of test surfaces (mainly small fragments of glass fibers) did not exceed 3% of the surface. Tightly arranged glass fibers constituted 2/3 of the material by volume. The areas with only the resin visible in the micro-sections were not numerous and the size did not exceed several fibers. The ECR glass fibers used were uniform. Further, their diameter distribution was quite narrow and they did not raise any objections.

3.3. Micro-Hardness Measurements of Samples

Apart from the abovementioned microscopic tests, micro-hardness measurements were carried out for all samples. They allowed to access the cohesiveness and homogeneity of the material, being an important supplement to the results of other tests of the material. The measurements were carried out using the Vickers method, with a Struers Dura Scan universal micro-hardness meter with 1 kG of indenter load (HV1 – Hardness Vickers method, 1 means 1 kG). The measurements were carried out on the same side surfaces of the samples on which microscopic tests were performed. A semi-automatic mode of measuring the imprint diameter was used. If different diameters were obtained on the same imprint with generally small differences, their length was averaged (Figure 17). The following HV1 (International designation of Hardness Vickers method. HV1 means a hardness of 1 kG) values were obtained and averaged over 5 measurements on each sample:
  • Reference sample A2–165 ± 9;
  • Temperature-aged sample B2–169 ± 11;
  • Temperature- and voltage-aged sample C3–155 ± 8.
The obtained micro-hardness values were high and clearly proved the quality of the tested GRE material of the HVAC composite insulator carrying rod. This confirmed the generally high evaluation of homogeneity and cohesiveness of the tested material. The imprints were often of a regular shape, allowing for automatic diameter measurements. In the case of less regular imprints, it was necessary to correct the marker setting manually, as illustrated in Figure 17. The typical phenomenon of relaxing the energy of load interaction through microcracks, especially running from the apex of the imprint, was not observed. However, the fibers located inside the area of the indenter operation often cracked. Images of typical imprints obtained on samples from three series are shown in Figure 17, Figure 18 and Figure 19.
Compared to the average hardness of the reference sample, the thermally aged sample showed a slightly higher hardness (2.4%). The temperature and voltage-aged sample had a reduced hardness (6.1%). The differences were small and comparable to the standard deviation values. Therefore, we can conclude that the material hardness of the tested samples from all three series remain at a similar level. There is no clear impact of ageing, neither as a result of temperature or the combined action of temperature and voltage on the material hardness, especially given the fact that the mechanical strength of all three series of tested samples remained at a similar level.

4. Discussion

Numerous publications that have focused on the use of composite insulators in high DC voltage lines have mainly examined their surface properties. Meanwhile, an important research issue that has not been mentioned in the literature is the long-term mechanical strength of the GRE cores exposed to high DC voltage. Long-term exposure to high DC voltage can lead to the development of an ionic current in the GRE core. This process may reduce the mechanical strength and, consequently, the insulator can break and the line would fall to the ground. This problem has been noticed in the case of glass disc insulators [13]. However, our research showed that the mechanical properties of the tested samples of the GRE cores did not deteriorate under the experiment’s adopted conditions. Both the long-term subjection to a temperature of about 50 °C and the collective action of temperature and DC voltage of 20 kV did not cause any observable and undesirable effects in the microstructure of the material. A similar statement has been made in earlier studies [9]. The analysis of the obtained research results is presented in the conclusion.

5. Conclusions

The mechanical characteristics of the 3-point bending test for all tested samples (reference and aged) showed a high similarity. Small differences occurred individually for particular samples, but there were no differences in the characteristics of samples that would be typical for any of the sample groups—reference A, or aged B and C.
Notwithstanding the relatively small differences in sample characteristics, all tested samples showed a high repeatability of the maximum stress value. The average maximum stress values for the three sample groups (A, B and C) were almost identical.
The microstructure of the tested GRE material of the HVAC composite insulator carrying rod should be assessed as entirely appropriate, compact and homogeneous.
Tightly arranged glass fibers constituted 2/3 of the material by volume. Areas with just resin were not numerous and their size did not exceed several fibers. This is difficult to avoid in the production process. The ECR glass fibers used were uniform; their diameter distribution was quite narrow and did not raise any objections.
The obtained micro-hardness values were high and proved the quality of the tested material of the HVAC composite insulator carrying rod. A small dispersion of results (±6.5%) should be emphasized. This confirmed the overall good evaluation of homogeneity and cohesiveness of the tested material. It can be concluded that the material hardness of the tested samples from all three series (A, B and C) remained at a similar high level. Therefore, there was no clear impact of ageing neither as a result of temperature nor as the combined action of temperature and voltage on the hardness of the GRE material.
On the basis of the mechanical and microscopic tests presented above (performed on reference samples and aged GRE samples of the HVAC composite insulator carrying rod) it was found that there were no registrable degradation effects. Long-term (6000 h) interaction of temperature 50 °C and the combined action of temperature and DC voltage 20 kV, did not cause any decrease of GRE material mechanical parameters or change in its microstructure. Thus, the test results presented in [9] were fully confirmed.

Author Contributions

Conceptualization: K.W. and P.R.; methodology: K.W., P.R., Z.R., and P.P.; validation: K.W., P.R., Z.R., and P.P.; investigation: K.W. and P.R.; data curation: K.W. and P.R.; writing—original draft preparation: K.W., P.R., Z.R., P.P.; writing—review and editing: K.W., P.R., Z.R., and P.P. All authors have read and agreed to the published version of this manuscript.

Funding

This research received no external funding.

Conflicts of Interest

The authors declare no conflict of interest.

References

  1. George, J.; Lodi, Z. Design and selection criteria for HVDC overhead transmission lines insulators. In Proceedings of the 2009 CIGRE Canada Conference on Power Systems, Toronto, ON, Canada, 4–6 October 2009. [Google Scholar]
  2. Kumosa, M.; Armentrout, D.; Burks, B.; Hoffman, J.; Kumosa, L.; Middleton, J.; Predecki, P. Polymer matrix composites in high voltage transmission line application. In Proceedings of the 18th International Conference on Composites Materials (ICCM), Jeju Island, Korea, 21–26 August 2011. [Google Scholar]
  3. Osmanbasic, E. High-Voltage DC Power Transmission: Should HVDC Replace AC in Power Systems? Available online: https://www.allaboutcircuits.com/technical-articles/high-voltage-dc-power-transmission-hvdc-replace-ac-power-systems/ (accessed on 20 October 2020).
  4. Raju, M.; Subramaniam, N.P. Comparative study on Disc Insulators Deployed in EHV AC and HVDC Transmission Lines. In Proceedings of the IEEE International Conference on Circuit, Power and Computing Technologies, ICCPCT 2016, Tamilnadu, India, 18–19 March 2016. [Google Scholar]
  5. Gubanski, S. Surface Charge & DC Flashover Performance of Composite Insulators. INMR. 13 August 2016. Available online: https://www.inmr.com/surface-charge-flashover-performance-composite-insulators/ (accessed on 20 October 2020).
  6. Morshuis, P.; Cavallini, A.; Fabiani, D.; Montanari, G.C.; Azcarraga, C. Stress conditions in HVDC equipment and routes to in service failure. IEEE Trans. Dielectr. Electr. Insul. 2015, 22, 81–91. [Google Scholar] [CrossRef]
  7. Working Group C4.303 CIGRE. Outdoor insulation in polluted conditions: Guidelines for selection and dimensioning—Part 2: THE DC CASE. In Technical Brochures CIGRE; Available online: https://e-cigre.org/publication/518-outdoor-insulation-in-polluted-conditionsguidelines-for-selection-and-dimensioning---part-2-the-dc-case (accessed on 15 December 2020).
  8. Yuan, C.; Xie, C.; Li, L.; Xu, X.; Gubanski, S.M.; Zhou, Y.; Li, Q.; He, J. Space charge behavior in silicone rubber from in-service aged HVDC composite insulators. IEEE Trans. Dielectr. Electr. Insul. 2019, 26, 843–850. [Google Scholar] [CrossRef]
  9. Wieczorek, K.; Jaroszewski, M.; Ranachowski, P.; Ranachowski, Z. Examination of the properties of samples from glass-epoxy core rods for composite insulators subjected to DC high voltage. Arch. Metall. Mater. 2018, 63, 1281–1286. [Google Scholar]
  10. Kumosa, L.S.; Kumosa, M.S.; Armentrout, D.L. Resistance to brittle fracture of glass reinforced polymer composites used in composite (nonceramic) insulators. IEEE Trans. Power Deliv. 2005, 20, 2657–2666. [Google Scholar] [CrossRef]
  11. Glass Textiles—Threads—Markings; Standard PN-EN ISO2078:2011; Polish Committee for Standarization: Warsaw, Poland, 2011. (In Polish)
  12. Ceramic and Glass Insulating Materials—Part 2; Standard PN-EN 60672-2:2002; Polish Committee for Standarization: Warsaw, Poland, 2002. (In Polish)
  13. Pigini, A. Composite Insulators for DC. INMR. 28 June 2018. Available online: https://www.inmr.com/composite-insulators/ (accessed on 20 October 2020).
Figure 1. The surface temperature of the composite insulator housing measured with a thermal imaging camera.
Energies 13 06724 g001
Figure 2. Glass-reinforced epoxy (GRE) material samples of the high voltage alternating current (HVAC) composite insulator carrying rod. From the left: reference sample—group A; thermally aged sample—group B; and DC and thermally aged sample—group C, with visible electrodes attached to the sample’s front surfaces.
Energies 13 06724 g002
Figure 3. Samples placed in the heating chamber.
Energies 13 06724 g003
Figure 4. The sample of a group A from HVAC composite insulator carrying rod in a mechanical system for strength testing via the 3-point bending test. The notches in bottom supporting rollers are visible.
Energies 13 06724 g004
Figure 5. Mechanical characteristics of the 3-point bending test for reference samples–group A.
Energies 13 06724 g005
Figure 6. Mechanical characteristics of the 3-point bending test for samples subjected to temperature—group B.
Energies 13 06724 g006
Figure 7. Mechanical characteristics of the 3-point bending test for samples subjected to high direct current (DC) voltage and temperature–group C.
Energies 13 06724 g007
Figure 8. Long axial crack on top of sample A1, with an indentation caused by a crosshead of the strength testing machine.
Energies 13 06724 g008
Figure 9. Long axial crack in the lower part of sample C1.
Energies 13 06724 g009
Figure 10. Indentation at the point of operation of the crosshead of the strength testing machine, long axial crack and cracks on the side surface of sample C3.
Energies 13 06724 g010
Figure 11. Cracks on flat side surface of sample C4.
Energies 13 06724 g011
Figure 12. Mechanical characteristics of the 3-point bending test of all tested samples.
Energies 13 06724 g012
Figure 13. Microstructure image of sample A2 on its flat side surface, 200×. The ECR glass fibers in section and slightly darker epoxy resin are visible. Dark chipping of fiber fragments and less often of binder are few.
Energies 13 06724 g013
Figure 14. Microstructure image of sample B2 on its flat side surface 100×. Few dark chipping of fiber fragments and binder are visible.
Energies 13 06724 g014
Figure 15. Microstructure image of sample C3 on its flat side surface, 200×. Few chipping of fiber fragments and binder are visible (a) on the right side and (b) the same area with a colored binary mask, which enables precise measurements to be taken.
Energies 13 06724 g015
Figure 16. Size distribution of glass fiber diameters in the GRE material for the HVAC composite insulator carrying rod.
Energies 13 06724 g016
Figure 17. Image of an indenter imprint on the flat side surface of sample A2, 500×. In order to measure it correctly, the position of the markers was manually corrected. The measured values of the imprint diameter were averaged. There are no common microcracks running from the apex of the imprint, but there are visible fiber cracks as a result of the indenter operation.
Energies 13 06724 g017
Figure 18. Image of an indenter imprint on the flat side surface of sample B2, 500×. Cracks and chipping of fiber fragments and resin damage as a result of the indenter operation are clearly visible.
Energies 13 06724 g018
Figure 19. Image of an indenter imprint on the flat side surface of sample C3, 500×. Cracks and chipping of fiber fragments and resin damage in the area of the indenter operation are visible.
Energies 13 06724 g019
Table 1. Maximum force and stress values recorded for reference samples—group A.
Sample DesignationA1A2A3A4A5
Maximum force (kN)32.3330.8530.8231.3830.00
Maximum stress (MPa)595568567577552
Table 2. Maximum force and stress values recorded for samples subjected to temperature—group B.
Sample DesignationB1B2B3B4
Maximum force (kN)31.4030.1430.0632.29
Maximum stress (MPa)578555553594
Table 3. Maximum force and stress values recorded for samples subjected to high DC voltage and temperature—group C.
Sample DesignationC1C2C3C4
Maximum force (kN)31.1431.4431.3331.28
Maximum stress (MPa)555578576575
Table 4. Average values of maximum stress, including standard deviation, for the samples of all three groups.
Group of SamplesABC
Average value maximum stress (MPa)572 ± 14.1570 ± 17.1571 ± 9.7
Publisher’s Note: MDPI stays neutral with regard to jurisdictional claims in published maps and institutional affiliations.

