1. Introduction
VPP is defined as an integration of generators and energy storage systems (ESS). The characteristic features of a VPP include [
1]:
All the components included in the VPP participate in the energy market as one entity;
The basic power generators in the VPP are distributed energy resources (DER);
Electricity consumers in a VPP with DER are called prosumers;
The prosumers can act as both loads and generators.
The main advantages of a VPP are environmental protection, high efficiency, synergy, interactivity, and balance [
2].
In the literature, the most frequently discussed topics related to VPP are:
Topics associated with reducing the peak loads;
Topics associated with power flow management;
Topics associated with power quality (frequency, voltage);
Economy-related topics (costs and profits);
Energy storage related topics.
1.1. Peak Loads Reduction, Power Flow Management
Due to the constantly growing demand for electricity, the importance of the issue of reducing peak loads is increasing. On the one hand, there is the possibility of building a conventional power plant that will work to reduce peak loads, but this is an expensive solution, causing additional carbon dioxide emissions. On the other hand, there is a continuous increase of renewable energy sources in the power system. Intelligent management of such sources in cooperation with energy storage is an effective way to reduce peak loads. The solution for such an integration is a virtual power plant presented in [
3]. The application of the VPP to reduce load peaks was also presented in [
4]. The authors of the paper achieved a reduction of load peaks by finding an optimal operating plan for the ESS. The optimization method was heuristic and the obtained solution was then corrected using genetic algorithm.
One of the difficulties that can be encountered in the case of central management of DER facilities, which are located in different parts of the system, is the power flow management. The problem is described in detail in [
5]. The authors of the study proposed an algorithm to optimize the power flow. In general, the topic of power flow optimization is the subject of many interesting studies. In [
6], optimal power flow is achieved by optimizing the installed PV capacity and the ESS parameters. Optimization is based on the power flow scenario and was performed using particle swarm optimization algorithm. The results of [
7] show optimal power flow for VPP with two levels of DER integration. The first level includes wind power plants and HPPs. The power generated is dispatched directly to the grid. The second level is PV and the generated power is consumed in the VPP. The proposed model is then applied to an actual VPP in Aragon (Spain).
1.2. Power Quality, Electric Vehicles and Economy
The integration of DER within a VPP not only serves to reduce load peaks or to optimize power flow. In [
8], an interesting issue was raised, in which electric vehicles (EV) are connected within a VPP. Using the energy stored in EVs, the aim is to improve the network frequency response. A similar problem is presented in [
9], where the authors of the paper examined the possibility of using a VPP for frequency control in the power system, in which the solar thermal system, wind turbine generator, and electric vehicles have a large share.
The use of EVs in a VPP has been very popular recently. In [
10], the use of electric vehicle demand response to reduce operating costs and improve the reliability of the power system with a large share of variable renewable sources and electric vehicles is shown. The study was based on the example of Jeju Island, located in South Korea. Furthermore, reducing operating costs and maximizing profits in a VPP is also the subject of many interesting studies. For example, the authors of [
11] focus on the problem of maximizing the operating profit of a virtual power plant. Part of this VPP is based on pumped storage HPP, whose work plan consists of the objective function discussed in the article. Another example is presented in a study in Western Australia, in which the authors present an analysis of a VPP profitability [
12]. This VPP consists of, among others, a solar power plant, anadium redox flow battery, and a heat pump for hot water systems. The model analyzed in the article also allows to control some devices, e.g., washing machines, dishwashers, and dryers, located in apartments, which are also part of the VPP. Another example where operational costs were minimized is [
13]. The optimization was performed for IEEE 30 and the IEEE 57 bus test cases. Power flow was optimized using mixed integer distributed ant colony optimization.
A VPP may contain more than one type of power plant using renewable energy sources (RES). It is possible to use one power plant to support the operation of another, as presented in [
14], which details a case study of a VPP located on the island of Crete, Greece. Additional, unused energy produced by wind power plants is used to pump water in HPPs.
1.3. Storage of Electric Energy
In the era of the rapid development of renewable energy, a major technological challenge is the efficient storage of electric energy [
15]. Depending on the way the energy is stored, the energy storage facilities can be classified into [
16]:
Electrochemical (batteries, flow batteries, hydrogen);
Electromagnetic (electric, magnetic);
Thermodynamic (pressure, heat);
Mechanical (gravity, kinetic).
Among the energy storage devices, chemical batteries are increasingly used in the professional power industry [
17]. The desired characteristics of batteries are high energy density, high charging and discharging power, and a long life cycle. Other aspects are also important, for example, methods to determine the state of charge and the possibility of recycling [
18].
Currently, research on BESS facilities is focused on their optimal distribution, system location, e.g., to minimize power loss [
19], or to improve frequency [
20]. A large part of the research is also devoted to the use of BESS devices to improve energy quality parameters [
21,
22]. In [
23], the authors analyze an economically interesting case of using old BESS from EVs as a stationary energy storage system. Studies on the performance of BESS are mostly focused on the diagnosis of the condition of the storage unit. In [
24], the health condition of the BESS is analyzed based on parameters related to the capacity, internal resistance, and voltage in the open circuit of the battery. This system is located in a laboratory in Choco, Colombia. The study in [
25] focuses on the performance of the power conversion system performance among four topologies and on estimating the SoC of a lithium-ion cell by combining two methods: Coulomb and open circuit voltage measurement. The study in [
26] focuses on testing the reliability of BESS, based on Markov models. The BESS models focus on the electrochemical model, the analytical model, and the substitute circuit model [
27,
28].
To our best knowledge, there is a shortage of publications analyzing the actual characteristics of charging and discharging of BESS facilities, as well as models based on these characteristics, especially in the power systems industry. The publications written so far focus on the study of single battery cells, like [
29], where the discharge voltages are tested depending on aging levels. The analysis is carried out for lithium nickel–cobalt–manganese-oxide battery cell. The charging and discharging voltages are also tested in [
30]. The study presents charging and discharging voltages for different charging rates. This test was also carried out for lithium nickel-cobalt-manganese-oxide battery. However, the tests are also not carried out on BESS but on a single battery. Research close to applications in the power system industry was conducted in [
31]. Although the study was not performed for BESS located in the power grid, it was performed for EV, which are operating in the distribution grid.
The main contributions of the article include:
- 1.
Analyzing the operation of the actual BESS. The BESS is located in a VPP in Poland;
- 2.
Determining the actual charging and discharging characteristics of the BESS;
- 3.
Using the determined characteristics to create the BESS model;
- 4.
Investigating the possibility of controlling the BESS.
The rest of the article has the following structure.
Section 2 presents and discusses the most frequently used technologies and parameters of BESSs used in VPPs. Attention was paid to the issues of appropriate control of energy storage units and the importance of the charging and discharging characteristics of such facilities.
Section 3 presents the results. The structure of the examined VPP. The methodology of determining the actual charging and discharging characteristics of the BESS located in the analyzed VPP. The actual charging and discharging characteristics of the BESS were determined. It was also checked how the determined characteristics performed when the storage facility followed a given operational plan. The analysis was completed by examining the operation of the VPP for a given scenario of power flow control on the day with the highest demand. The presented scenario realizes the adjustment of the VPP operation to a given curve. The study was carried out for four cases: adjustment of the power consumed from the distribution system to a given level for normal power plant operation; adjustment of the same to a given level in case of lack of power plant operation; adjustment of the power consumed from the grid to two curves set as a function for normal power plant operation.
Section 4 contains a discussion of the results obtained.
Section 5 finishes with the conclusions.
2. Battery Energy Storage System
Lithium-ion batteries are most commonly used in BESSs [
18,
32]. This type of battery is recommended for long-term use due to its high energy density of 100–250 Wh/kg, high power density of 230–340 W/kg, and long lifetime of 500–6000 cycles [
33]. The disadvantages of a lithium-ion battery include its high cost and the need to use a ventilation system to ensure the cooling of the batteries. The battery requires a built-in controller to ensure that each cell operates correctly within the specified voltage, temperature, and current range during charging and discharging. To optimize the operation of the battery, the cell controller communicates with the battery management system (BMS) [
33,
34].
The battery management system provides many functions. In power system applications, this is very important because the battery usually operates under difficult conditions. The BMS must react to external conditions that can cause damage. An important function of the BMS is to determine the SoC of the battery. The BMS monitors and calculates the SoC of each battery cell. SoC is also used to determine the end of charging and discharging cycles [
35]. Excessive charging and discharging is often the cause of a battery failure; therefore, the BMS is designed to keep the battery in its operating range to deliver the required power, and to receive energy without overcharging the cells [
33,
34].
Especially the charging and discharging speed of the BESS is influenced by:
Construction;
State of charge (SoC);
Temperature.
These factors are described in detail in [
34]. For the selected BESS type, it is possible to determine the dependence of charging (discharging) power based on the SoC [
36]. In this case, the charging (discharging) speed is determined by power expressed in [W] or by a relative value in relation to the rated power of the storage unit. The SoC can be defined as energy in [Wh] or as a relative value in relation to the storage capacity.
It should be noted that these characteristics have a double meaning. Firstly, they determine the operating limitations introduced by the manufacturer, depending on the design, and secondly, they can be a tool to control the operation of the storage unit by the system operator [
32]. In the latter case, the characteristic parameters must not exceed the limits specified by the manufacturer.
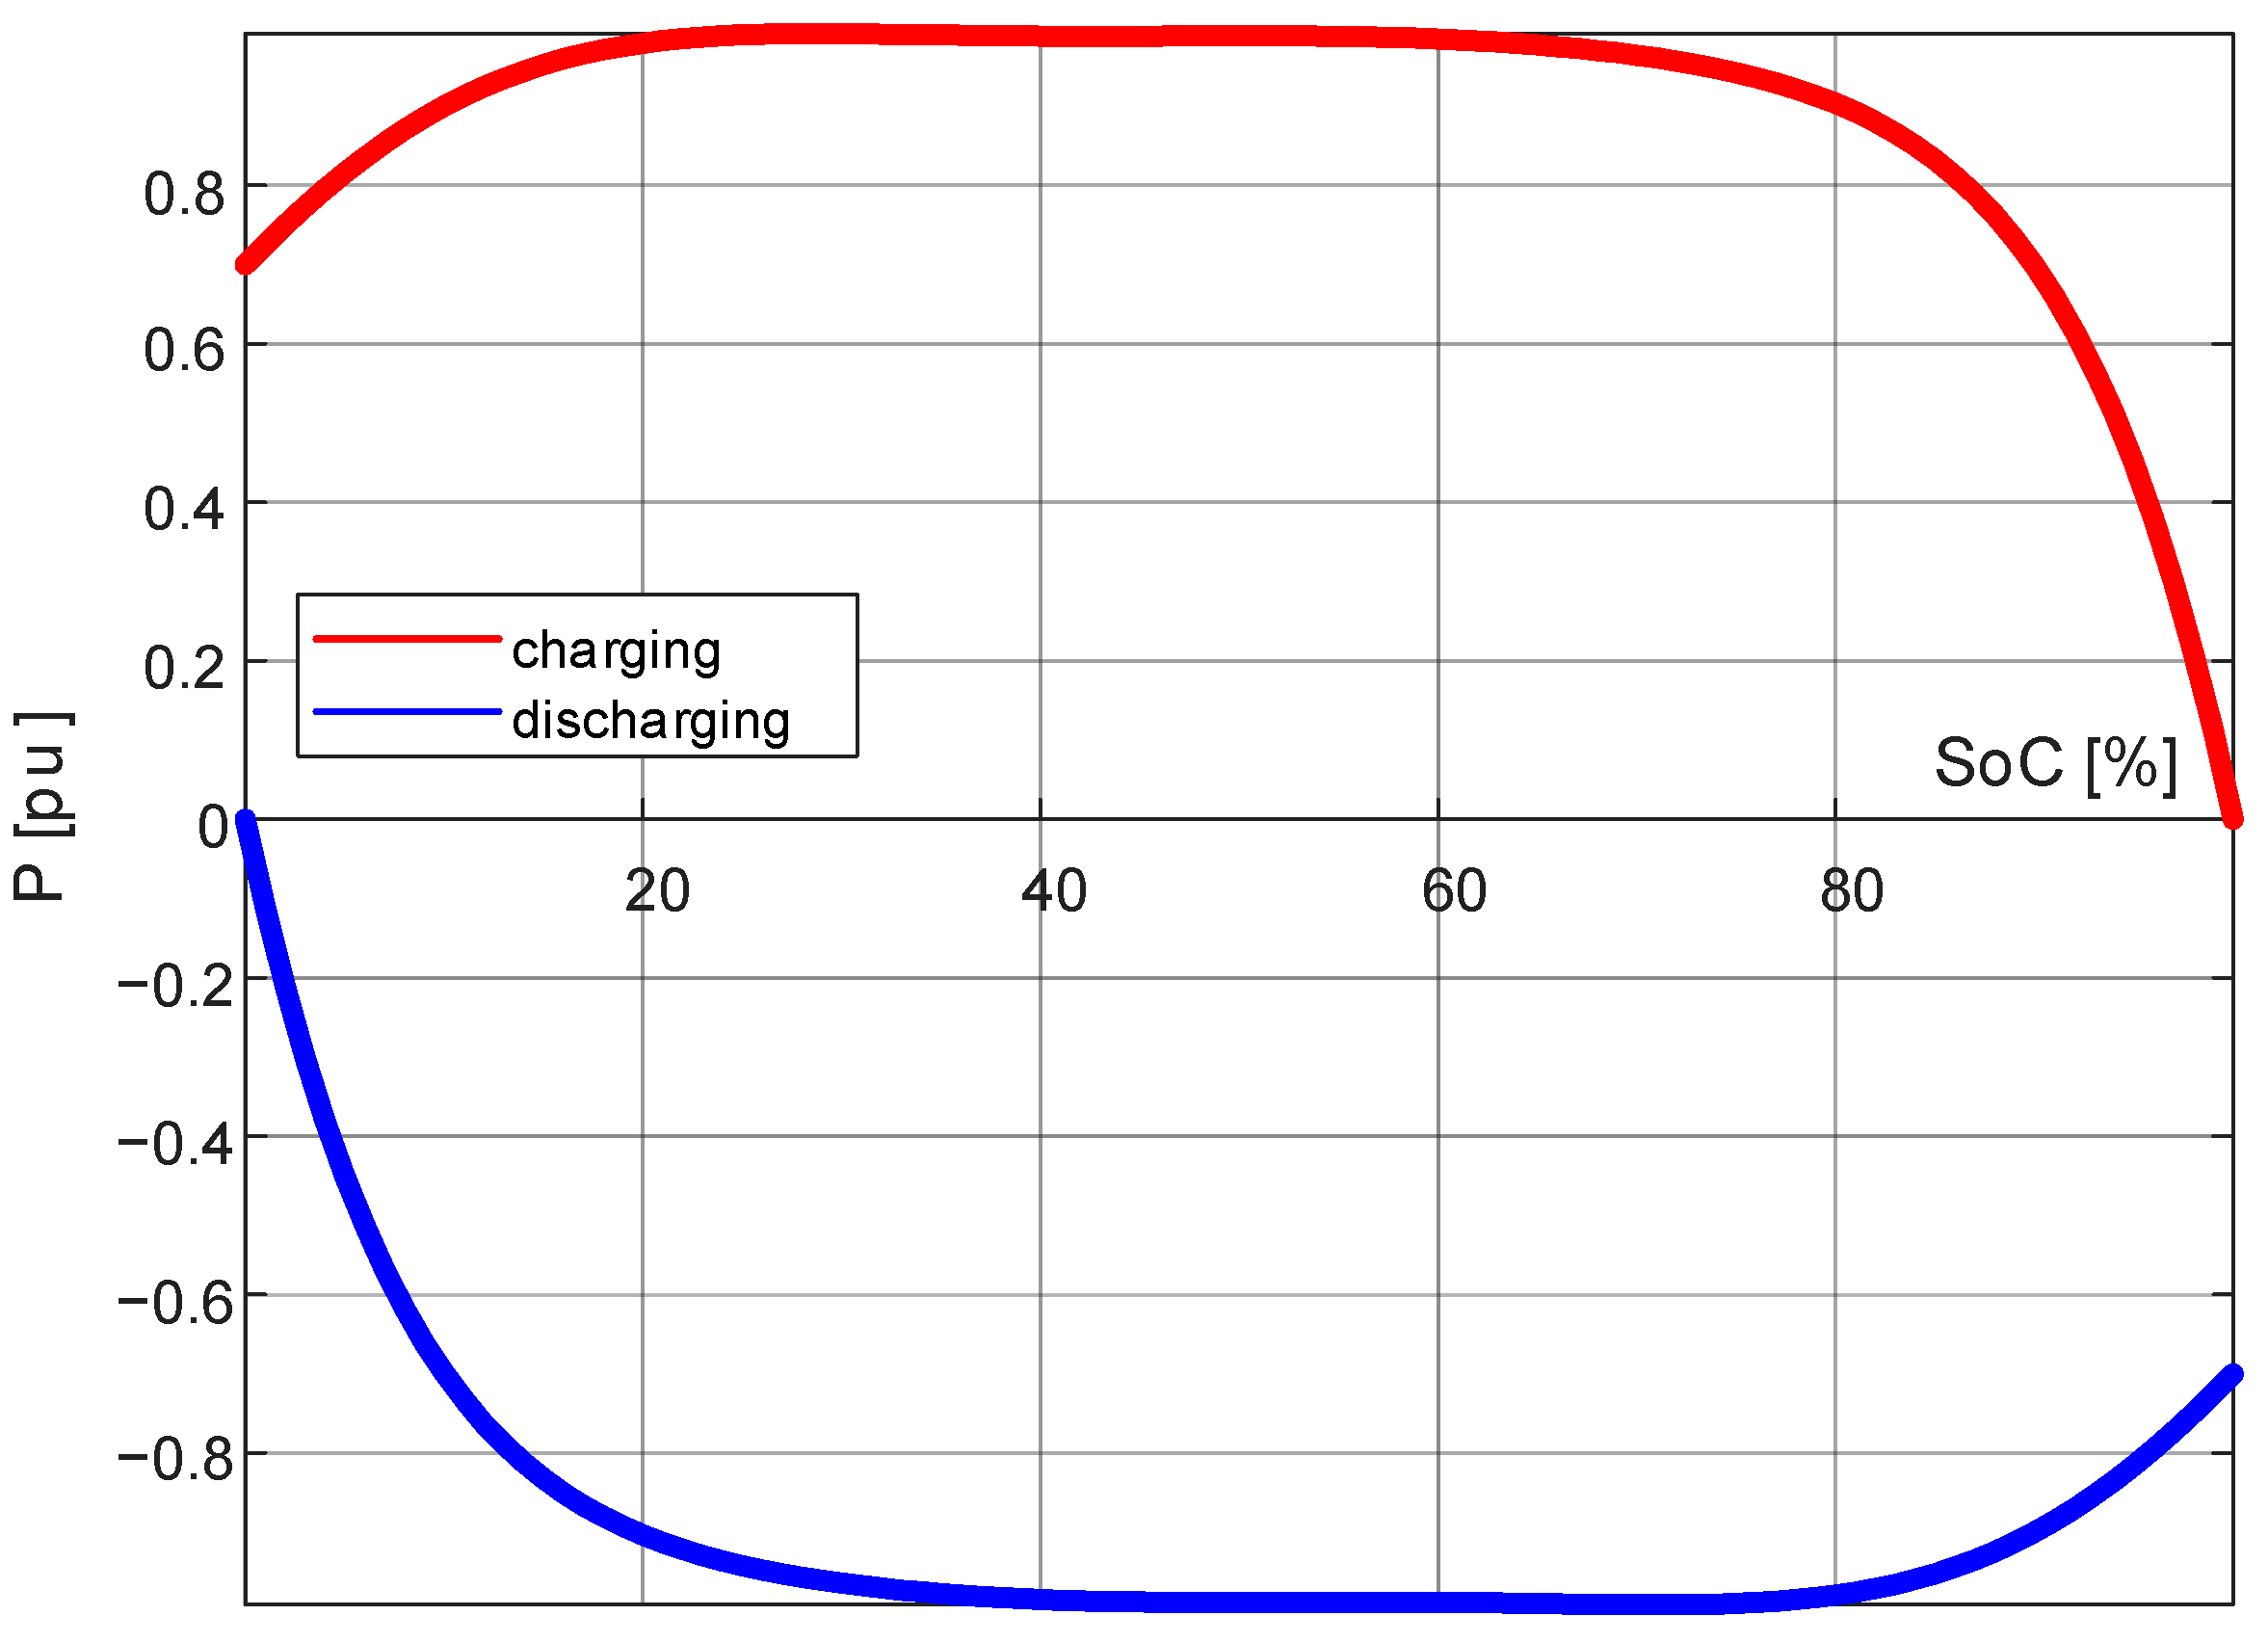
Characteristics of the dependence of the charging and discharging power of the storage facility on the state of charge are the basic dependencies required to properly control the BESS [
37]. An example of the actual characteristics of a BESS equipped with lithium-ion batteries and supervised by the BMS is shown in
Figure 1. The shape of the characteristics depends on the technical limitations of the batteries, the manufacturing technology, operating temperature, degree of usage, and the way the BESS is controlled and managed by the BMS [
38,
39].
3. Results
The chapter is divided into six subchapters. The first part is a description of the VPP in which the analyzed energy storage is located. Then, the methodology for determining the charging and discharging characteristics of the energy storage is discussed. The next part is the determination of the characteristics based on actual measurements. Then, the analysis of the influence of the characteristics of the BESS on VPP operation. The chapter ends with the analysis of the operation of the private network, in which the VPP operates for a given power flow control scenario for four cases. The analysis is performed for the day of the year with the highest peak demand.
3.1. Virtual Power Plant
In a modern power system, virtual power plants are solutions equipped with efficient and safe power flow control systems. VPPs are equipped with power generators and storage facilities. A VPP in connection with local electricity consumers creates a private network [
40]. These devices are equipped with controllers, usually, they are power-electronic converters allowing power control. Most often such networks are connected to a public distribution network. An appropriate strategy of energy storage in the BESS allows for optimal use of the electrical energy generated locally [
41].
The virtual power plant, designed to simulate the power flow, was designed on the basis of a simplified scheme of the power system in which the VPP operates in Poland. The private network consists of the hydroelectric power plant, load (including the power plant’s own needs), and the BESS.
Figure 2 presents a diagram of the dispersed control network connected to the distribution grid.
The regulations governing the operation of the electricity market must take into account the characteristics of the operation of the power system, such as the need to ensure a continuous balance of supply and demand and reliable system operation [
42,
43]. On the other hand, until recently, it was assumed that there was no possibility of storing energy immediately, which resulted in low energy price flexibility and limited generation flexibility. The development of DER, microgrid systems in which large BESS and VPP structures operate is currently of decisive importance in the transformations taking place in the modern power system.
Therefore, experimental research of the VPP for different power flow control approaches allows to verify the assumptions, scenarios, and algorithms.
The BESS, which is a part of the experimental VPP, is of key importance for the effective operation of the system in this case. Therefore, it seems necessary to point out the potential possibilities of using the storage in experimental research.
3.2. Experimental Determination of BESS Characteristics
One of the practical ways of utilizing BESS in the private network and as an important resource of a VPP may be to experimentally determine the characteristics of storage operation. Knowledge of the basic technical limitations of the installation related to the power of charging and discharging the storage, which is also associated with the speed of response to changes in covering the power demand and response to changes in local generation, is the basis for proper and effective control within the VPP. The adopted and proven method of measuring the characteristics of the energy storage operation will be able to be used in other installations of this type. The obtained results will allow for correct and optimal use of the VPP resources.
An effective method of determining the BESS characteristics may be the use of measurements during the storage facility operation. The prerequisite is access to the synchronized recording of the storage unit’s charging and discharging power, the SoC, and, if possible, the operating temperature of the batteries. As shown in [
31], with a large number of measurements, it is possible to try to determine the actual operating characteristics of BESS. The boundary areas of such determined characteristics at many points of the storage facility operation can then be approximated by the polynomial function.
The proposed way of determining points of the storage characteristics on the basis of current registrations is schematically presented in
Figure 3. With the synchronous measurement of the storage power P, (P+ for charging, P− for discharging) and SoC, it is possible to determine points of BESS characteristics for selected points of time.
Based on the technical documentation of the BESS control and parameter monitoring systems, assumptions have been made about performing measurements of the examined storage.
The tested energy storage is treated as a uniform unit. This means that the internal design, the number, and layout of the battery unit connections, as well as the supervisory and security systems and algorithms are omitted. All technological limitations and those resulting from BMS procedures are taken into account by the characteristics of the storage unit operation.
The maximum power of charging and discharging BESS is 500 kW.
The storage can be charged to a maximum of 100% SoC (500 kWh) and discharged to a minimum of 20% SoC (100 kWh). The limitation of the discharge results from the warranty provisions.
Charging the storage unit with full power is only possible during the operation of the HPP, so the test time with charging sequences can be a maximum of 3 h.
Due to the parameters of the control systems implemented in the VPP, the changes in the storage unit’s operating schedule (charging and discharging power changes) can be performed with a minimum step of 5 min.
Measurement of the electric parameters of the storage unit, such as: charging and discharging power, SoC, voltage, and current can be performed with a step of minimum 1 min (data recorded in the BMS system).
The average temperature of the batteries and the ambient temperature is recorded in a 15 min step. Initially, it is assumed that the storage unit, thanks to the temperature monitoring of the batteries by the BMS, operates within the permissible range, thus limiting the influence of the temperature on the charging and discharging characteristics.
3.3. Results of Short Term Tests for the Identification of the Actual Charging and Discharging Characteristics of BESS
The characteristics were determined using samples measured at 1 min intervals, obtaining a set of points describing the characteristics. The measurements are shown in
Figure 4.
Then the obtained results, for the extreme values, were approximated with the polynomial function, obtaining the characteristics presented in
Figure 5.
The final characteristics determined on the basis of 1 min data are as in
Figure 6.
The obtained shape of the characteristics approximately corresponds to the shape of typical characteristics of a storage unit based on chemical batteries, as shown in
Figure 1. The difference is the used range of the storage unit’s state of charge, which indicates that the unit has not been discharged below 30% SoC. Additionally, the charge and discharge power of the accumulator does not exceed 80% of the rated power.
Using the 1 min data, a map of “attendance” of the storage unit’s operating states, shown in
Figure 7, was also drawn up. The map allows to check what is the most frequently used power range and what is the SoC at that time.
The map closely correlates with the charging and discharging characteristics of the storage unit. The range of work of the storage depicted on the map is within the range of work defined by the characteristics. In addition, when analyzing the map, it can be seen that the BESS usually works with SoC in the range 90–100%. However, it rarely works at a low SoC level, within 40%.
Using 1 min data, the dependence of the storage power on the operation plan was also checked (
Figure 8). The points where the BESS worked according to the plan are on a straight line, inclined at 45°. Deviations from this line show the difference between the setpoint and actual storage power. Measurements also show that the system only applied the storage power at levels 50 kW apart.
3.4. Control of the Charging and Discharging Power of the BESS for the Assumed Operation Plan
This chapter presents the results for two operation plans. The first operation plan is shown in
Figure 9 and the simulation results are shown in
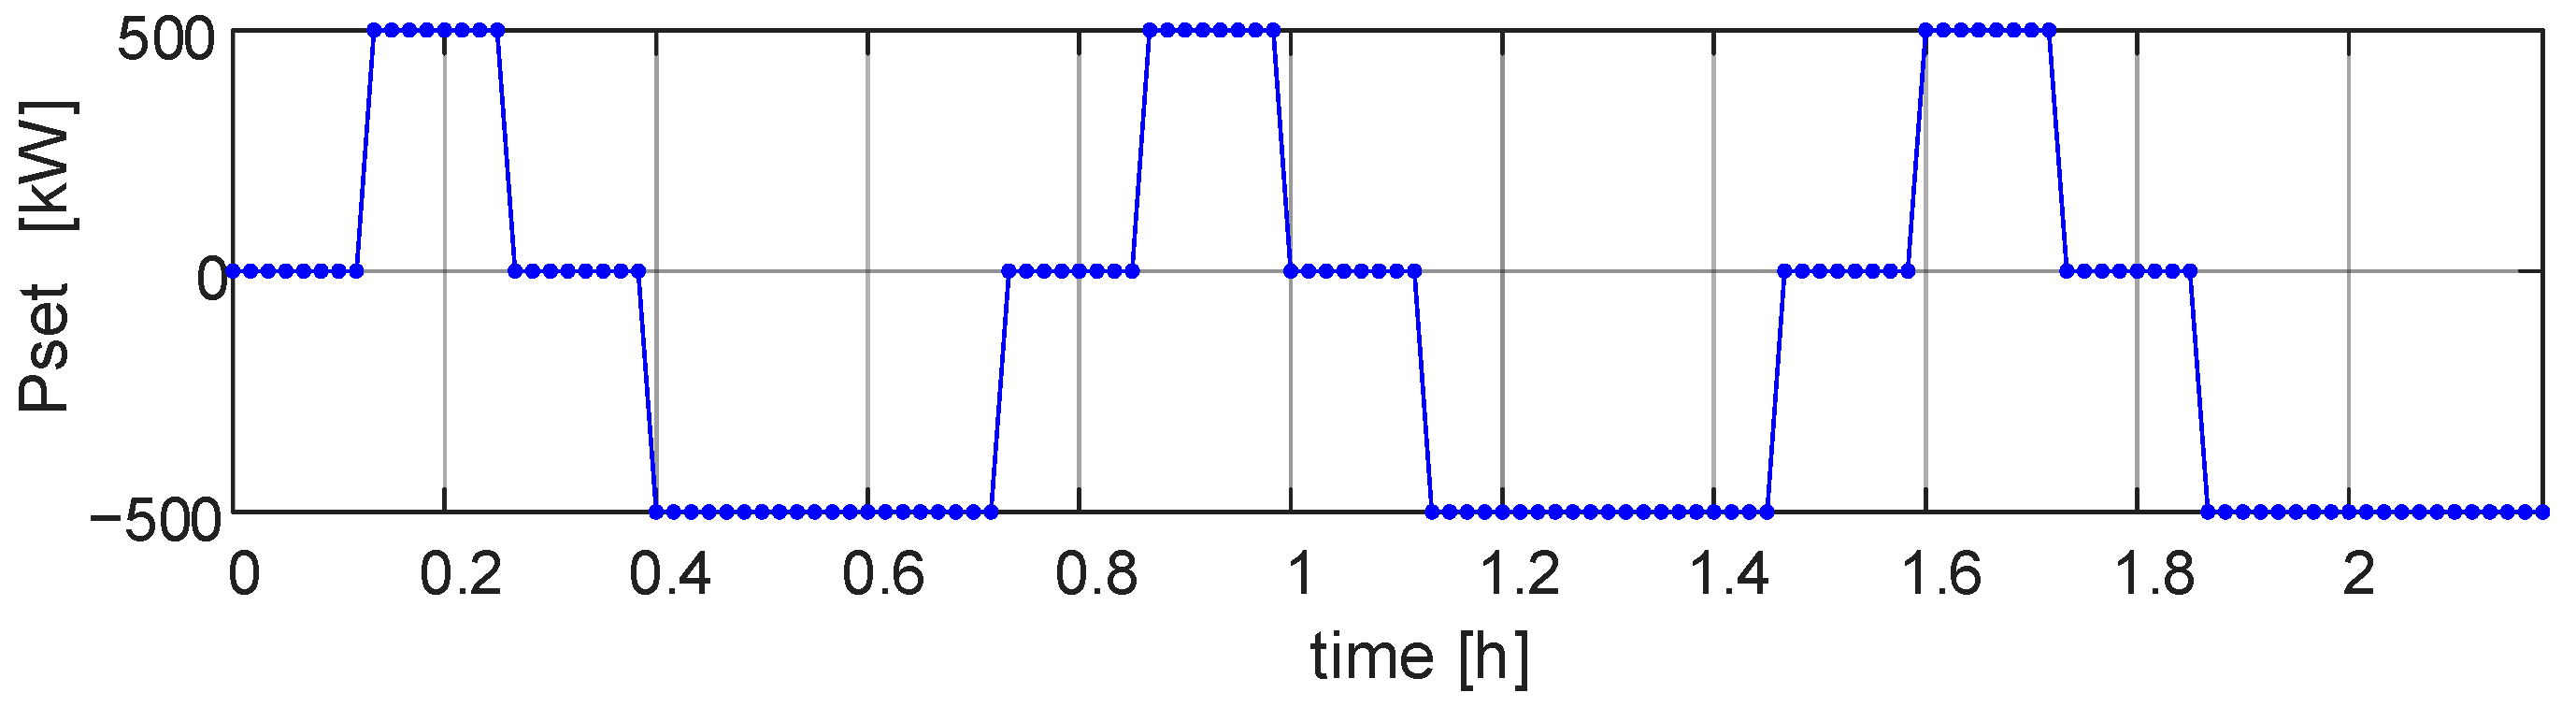
Figure 10. The second operation plan is shown in
Figure 11, while the results are presented in
Figure 12. The capacity of the 500 kWh storage device and its rated power of 500 kW corresponds to the parameters of the BESS storage device under test.
The conducted simulations allow to determine the changes in the power of the storage unit and the SoC over time for the determined real characteristics.
The analysis was performed for two storage operation plans, presented in
Figure 9 and
Figure 11.
For the presented plan (
Figure 9), the operation of the storage device, resulting from its charging and discharging characteristics, is presented in
Figure 10.
It can be seen that, initially, the storage facility works according to the plan. The difference occurs after approx. 1.3 h, despite the assumed constant performance, the storage unit gradually reduces the charging power to 0 kW. Then, after about 1.7 h, the storage facility does not increase the discharge power to 500 kW, but to about 250 kW.
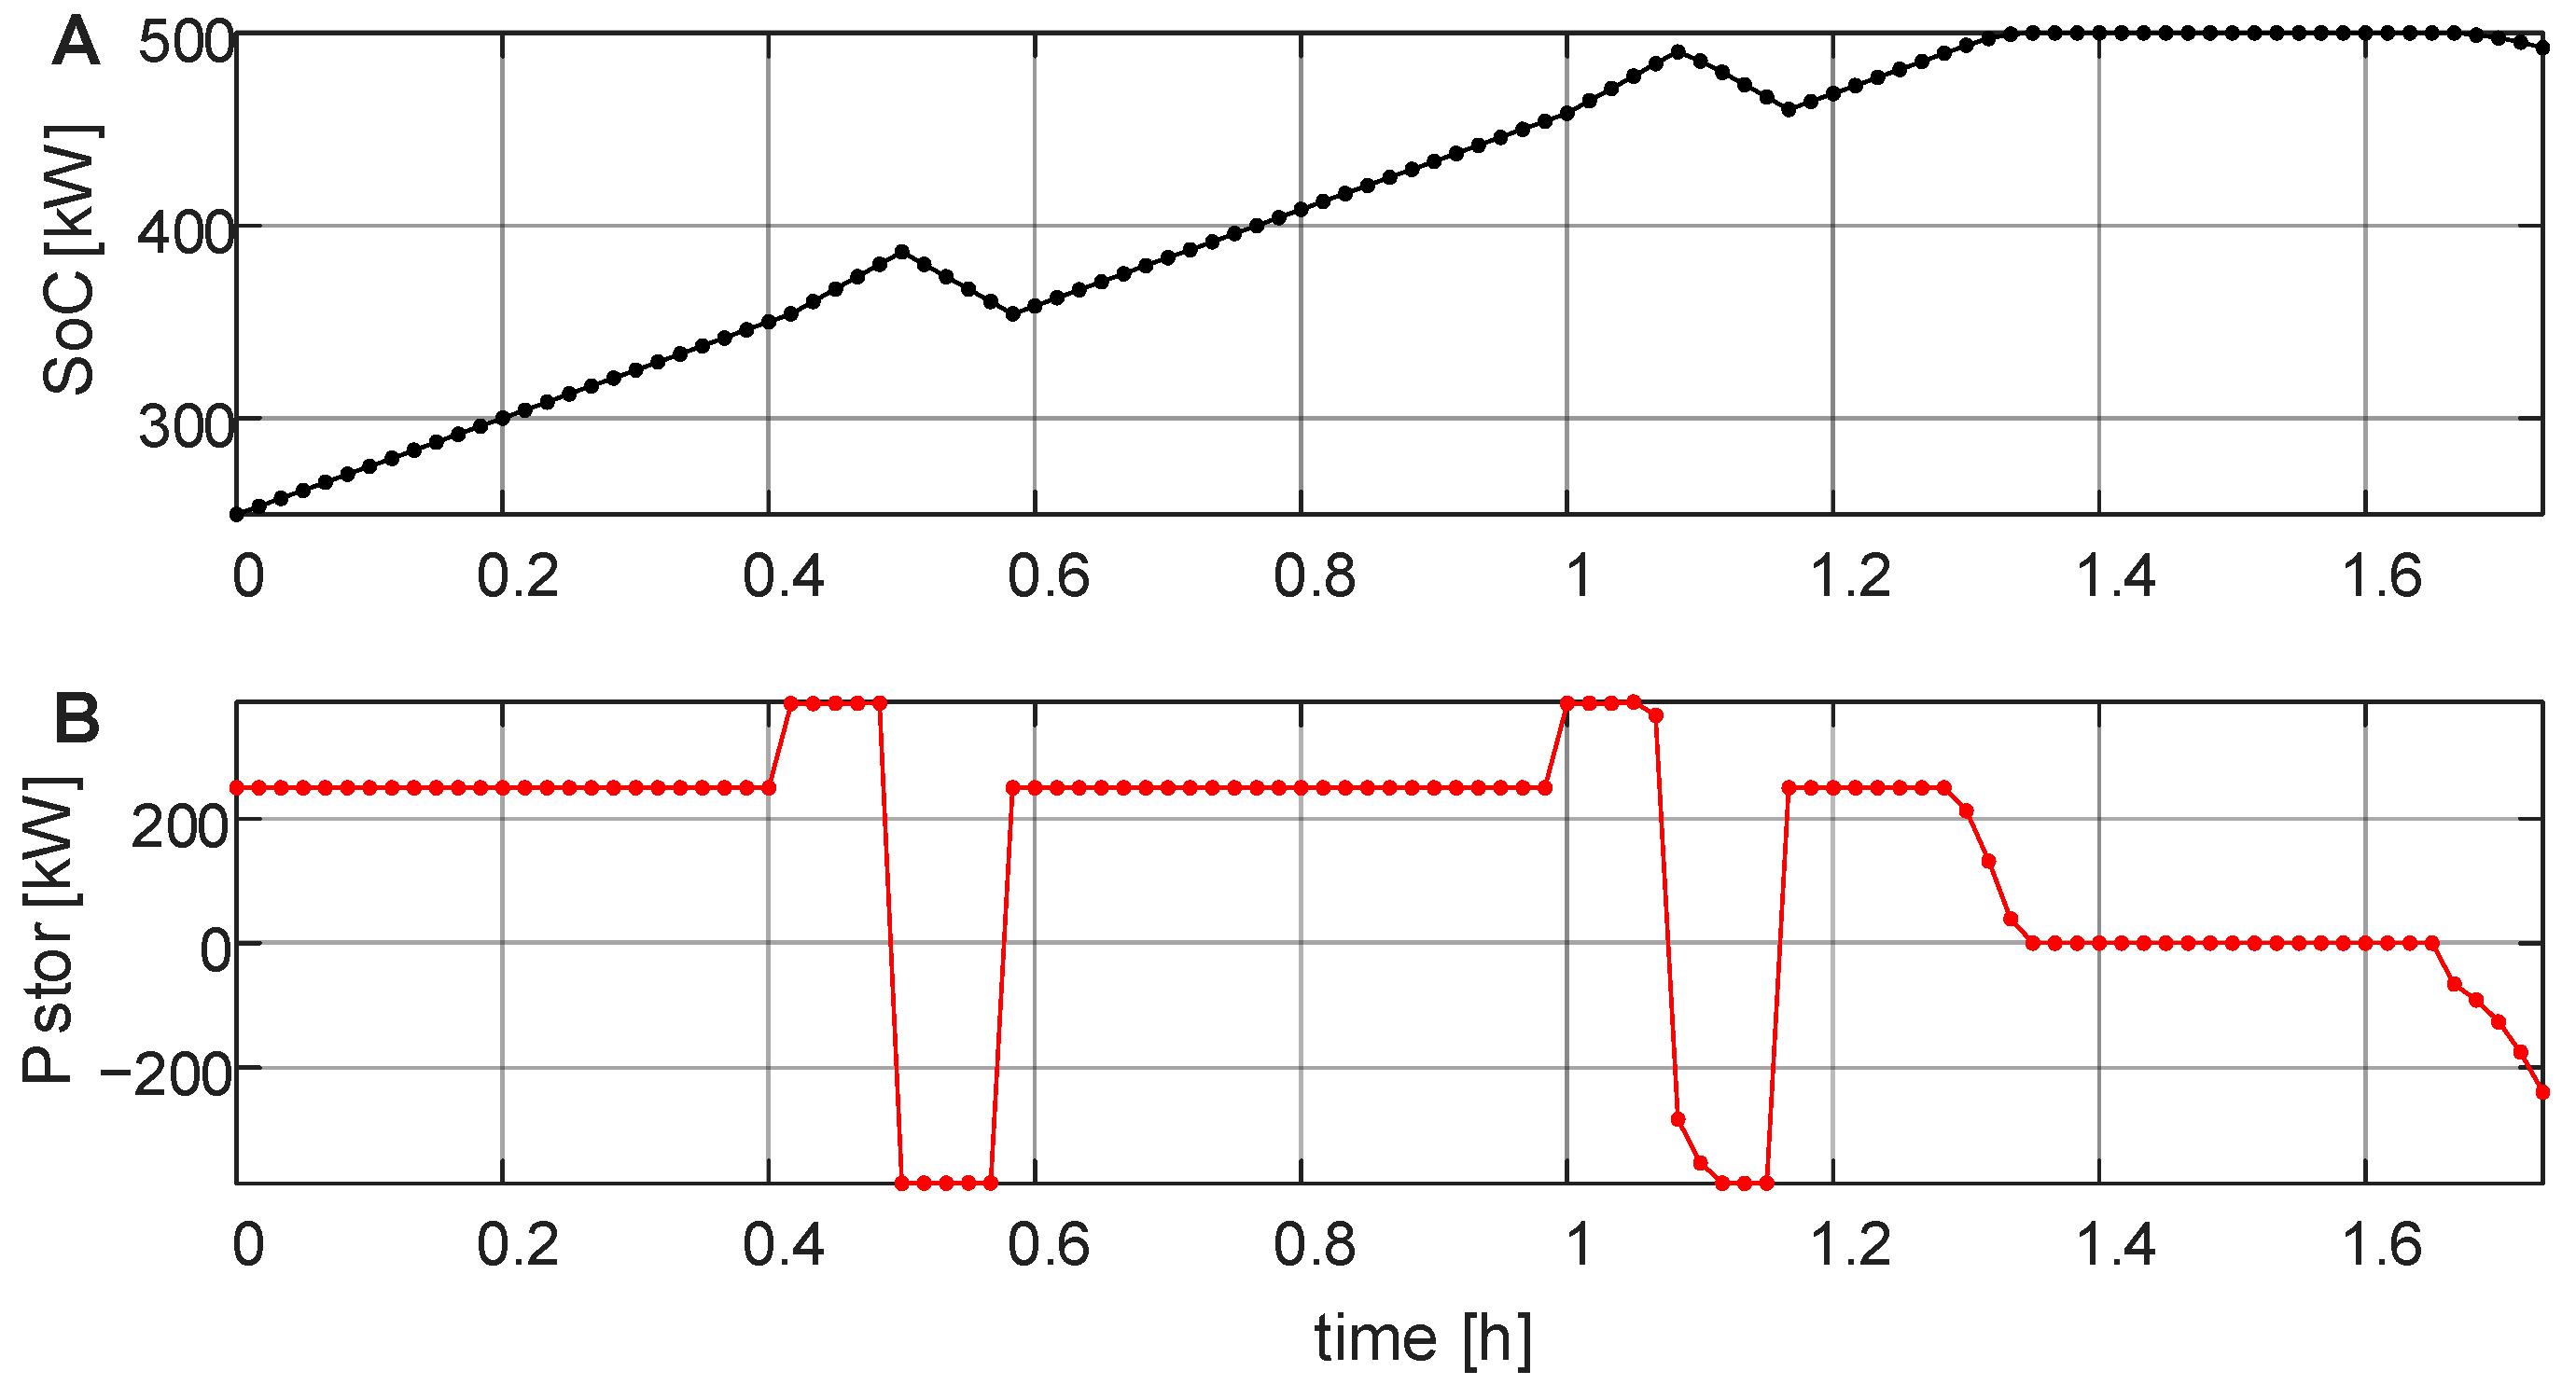
A similar analysis was performed for the work plan presented in
Figure 11.
For the presented plan (
Figure 11), the operation of the storage device, resulting from its charging and discharging characteristics (
Figure 12), is presented.
As before, the storage unit initially works according to the operation plan, the difference occurs after approx. 0.6 h. The storage starts to reduce the discharge power faster than the plan would have resulted. In about 0.9 h, the facility reaches a lower maximum charging power than planned. After approx. 1.3 h, the unit’s output is around 0 kW.
The difference between the operation plan and the actual operation of the storage device is most visible in the case of a low SoC (about 200 kWh).
3.5. Controlling the BESS in the Private Network
The main objectives of the VPP systems concern the economic aspects related to electricity trading. The VPP control algorithms provide for charging the storage facility at low energy prices from the distribution system and discharging and selling energy at peak demand at high prices.
However, technical issues cannot be overlooked when planning such solutions. For example, the voltage levels (slow and fast voltage changes) at all points of the distribution network should be within the range allowed by the standards. The same applies to current values in lines and transformer windings. Issues concerning the operation of the BESS itself are also important.
The impact of the VPP on the power system can be examined by analyzing the power flows. The daily analysis should give an answer to the question whether the changes of voltages and currents in the network caused by the generation and storage control are within acceptable limits.
Simulations of the operation of the 0.5 MWh BESS with the permissible voltage changes at the PCC site were carried out. The actual measurements of power demand by local loads were used, as well as measurements of power generation in the hydroelectric power plant. The diagram of the analyzed private network is presented in
Figure 2. For the analysis, the characteristic day with the maximum power demand in the 110 kV/SN station was selected. The power flow simulation was conducted using the DC power flow method, which only takes into account only active power. This approach is often used in developmental analyses, with high data uncertainty [
44,
45,
46,
47].
The storage control scenario (
Figure 13) is based on the technical aspect of reducing the power taken from the distribution system to a given level. The demand of local electricity consumers for power exceeding the preset margin should be covered from the local generation and from the BESS. This is one of the possible scenarios for controlling the storage unit. The comprehensive scenario should make optimal use of the energy of the BESS both for technical and economic reasons related to the costs of operating the equipment and current prices on the energy market.
The algorithm works with a given step, using measurement or forecast of power generation, load, and current SoC. The simulations assume average values on a ten minutes step basis. The basis for operation of the algorithm is to check in the first step the sum sign of power generation and load. As a result, it is possible to determine whether the generator itself can cover the demand locally. In the next steps, the algorithm chooses such power of discharging or charging the energy storage so that the energy exchange between the private network and the system remains at the set level.
The values of power and energy required to control the BESS are forecast (PG—power generation, PL—load) and measured (EST—storage energy, i.e., SoC). The storage charging or discharging power (PST) is determined as the amount set to the energy storage controller. The algorithm takes into account the limitations resulting from the characteristics of the storage facility operation (PSS—permissible power to charge the storage facility, PDS—permissible power to discharge the storage facility). The characteristics introduce limits to the storage power depending on the SoC. The discharge power decreases as the energy in the storage unit decreases to a zero value with a set minimum stored energy. Changing the shape of the characteristics enables regulation of the BESS power depending on the parameters of the active network. System power (PSY) is the excess or deficit of power while performing power balancing in the private network. As an objective function for the scenario, the power exchange between the private network and the distribution grid (PM) is set. System power (PSY) tries to match this level in subsequent steps.
It is not necessary to directly indicate the intervals for the variables used by the algorithm, because the limitations result directly from the adopted characteristics of the storage unit operation (e.g., at maximum SoC, the charging power reaches zero). Therefore, it is important to correctly define the energy storage performance.
For the analysis of the impact of the VPP on the conditions of power grid operation, the day on which the maximum power demand in the 110 kV/SN station occurs was selected, that is 19 January 2017.
3.6. Analysis of Power Flow for the Day of Maximum Demand in 110 kV/SN Station (19 January 2017)
The presented analysis covers 19 January 2017—the hydroelectric power plant operates with a power of 1 MW between 14:00 and 19:00 and the load peak is between 06:00 and 11:00. In the private network, there is a BESS with a nominal power of 500 kW and a capacity of 500 kWh. The profile of generation and load on that day is shown in
Figure 14. Four scenarios of the private network operation have been considered:
Power exchange margin with the external grid at the level of 400 kW, during normal operation of the HPP (
Figure 15 and
Figure 16);
Power exchange margin with the external grid at 400 kW and no HPP operation (
Figure 17 and
Figure 18);
Power exchange margin with the external grid set according to the curve, variable from 300 kW to 600 kW, in normal operation of the HPP (
Figure 19 and
Figure 20);
Power exchange margin with the external grid set according to the step curve, between −400 kW and 400 kW, in normal operation of the HPP (
Figure 21 and
Figure 22).
The operation of the private network with a storage facility with the actual charging and discharging characteristics was examined.
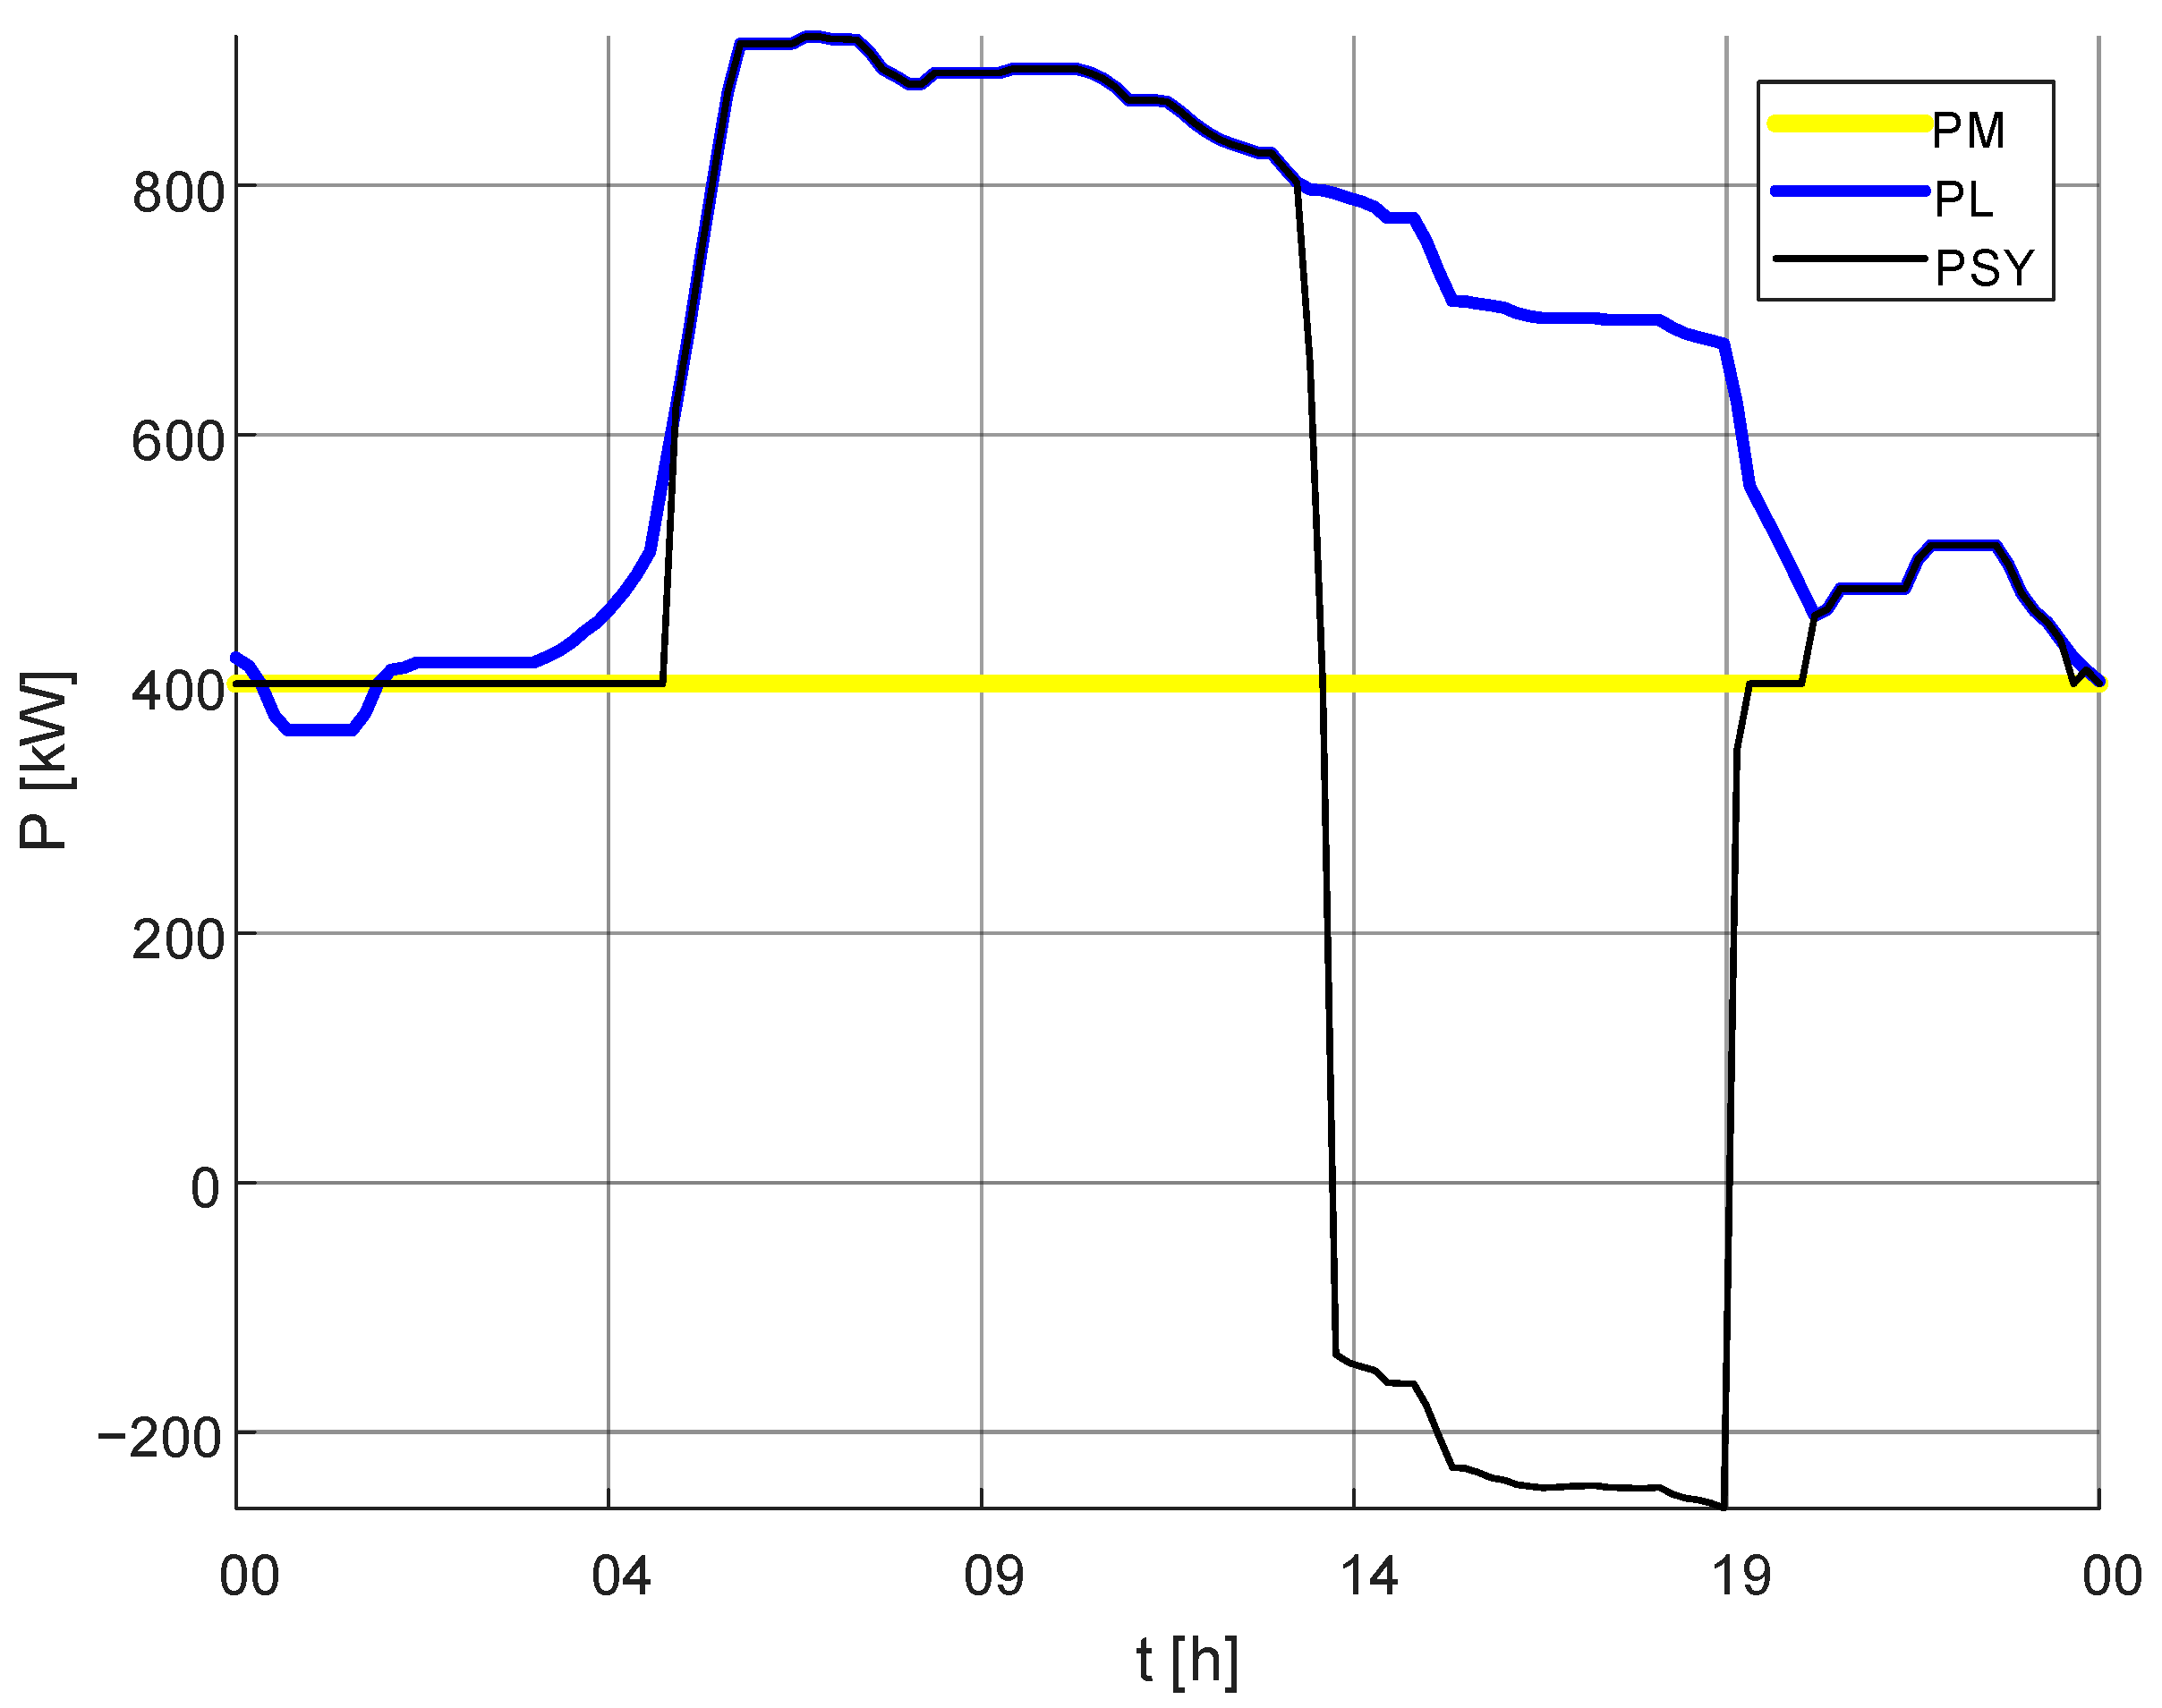
In the first step, the power flow in the private network for power generation and load was checked (
Figure 14), using a scenario (
Figure 13) that reduces the exchange power between the private and the distribution grid to a set level of 400 kW for a grid with a storage unit with real characteristics (
Figure 15 and
Figure 16).
Analyzing
Figure 15, it can be seen that the power taken from the distribution grid is at a set margin from 00:00 to about 05:00 and then for an hour, about 19:00 to 20:00. From 05:00 to about 13:00 and from 20:00 to 00:00, the power demand is covered from the distribution grid. Between 13:00 and 19:00, there is a decrease in the power taken from the network due to the operation of the HPP. The operation of the private network is reflected in the diagram of the change of energy accumulated in the storage device in time (
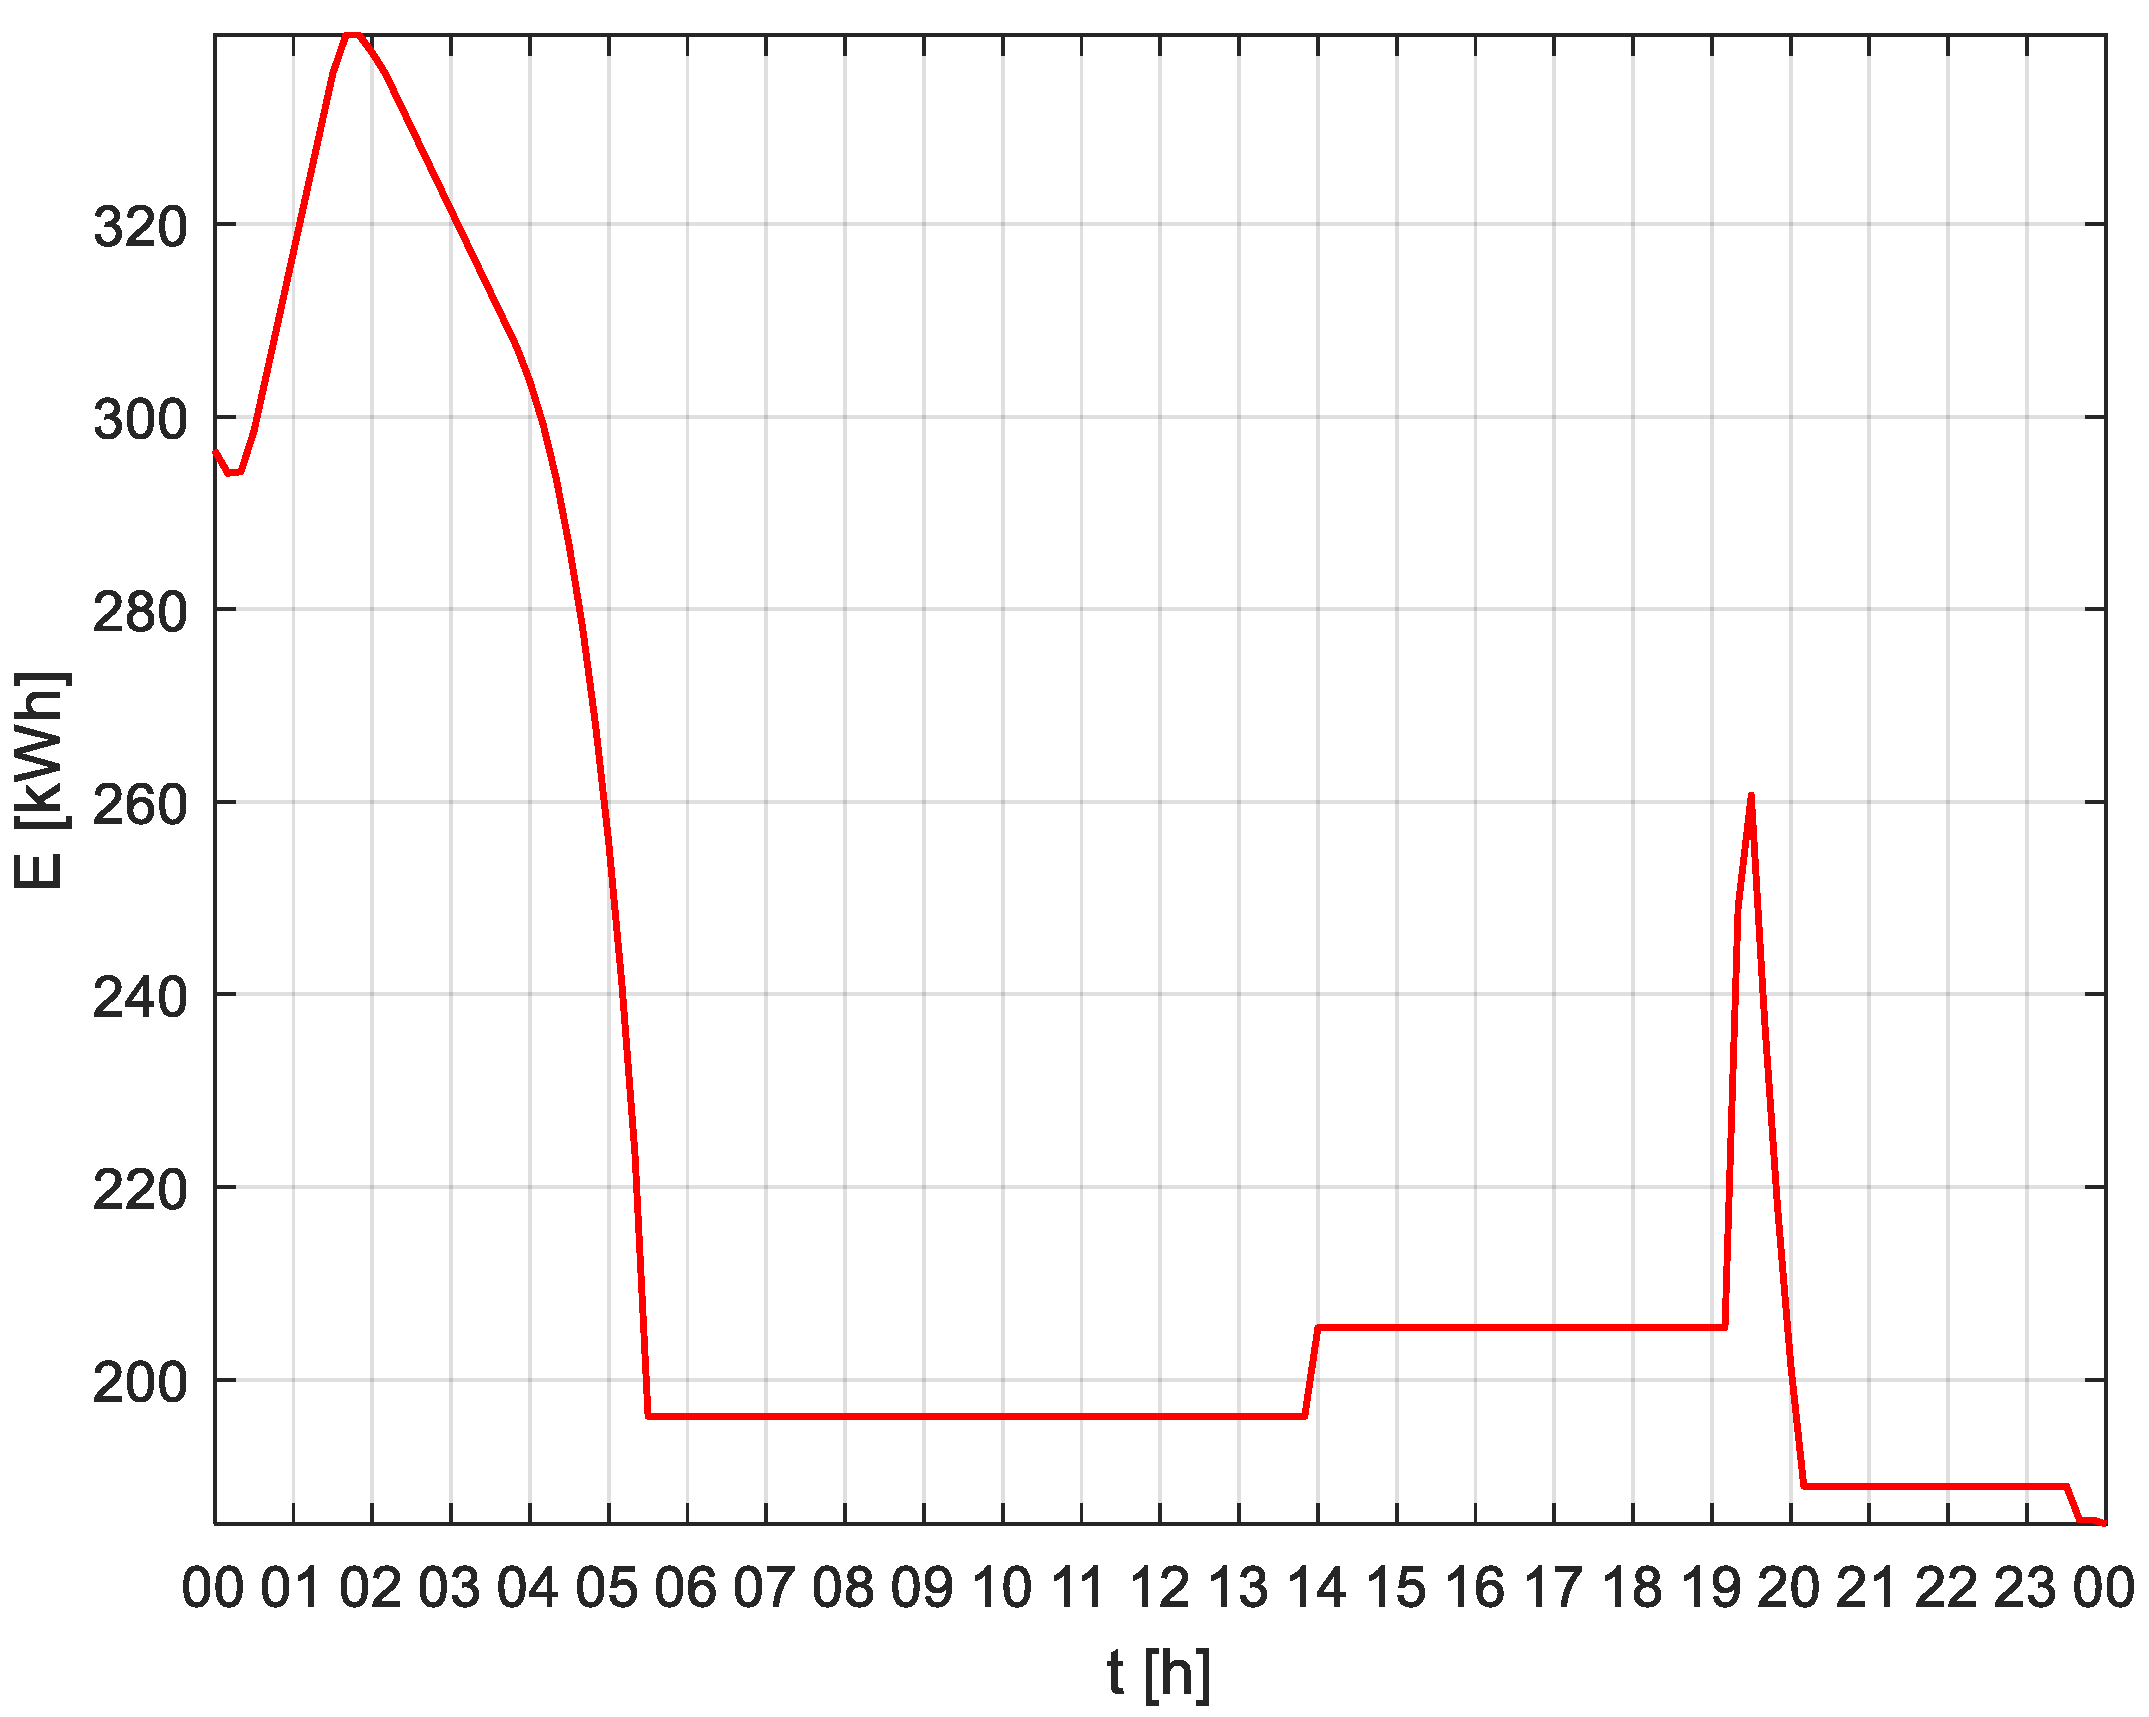
Figure 16), it can be seen that the storage device operates mainly between 00:00 and 05:00 and between 19:00 and 20:00, i.e., when the network takes the power from the distribution system by a given margin.
In the next step, it was checked how the grid will be handled in the same scenario if the HPP is not in operation. The results are shown in
Figure 17 and
Figure 18.
As in the previous analysis, from 00:00 to 05:00, the private network works with a margin setpoint power (
Figure 17). For the rest of the simulation time, the power of the demand is covered by the distribution system, except for a few minutes around 20:00. The profile of the VPP operation is also visible on the graph of energy stored in the storage unit in time (
Figure 18). The storage device operates between 00:00 and 05:00. Between 05:00 and 20:00, the SoC does not change. Around 20:00, the storage unit discharges to 180 kWh.
In the next step, the power flow for the private network was checked if the power margin is set as a function between 300–600 kW (
Figure 19 and
Figure 20).
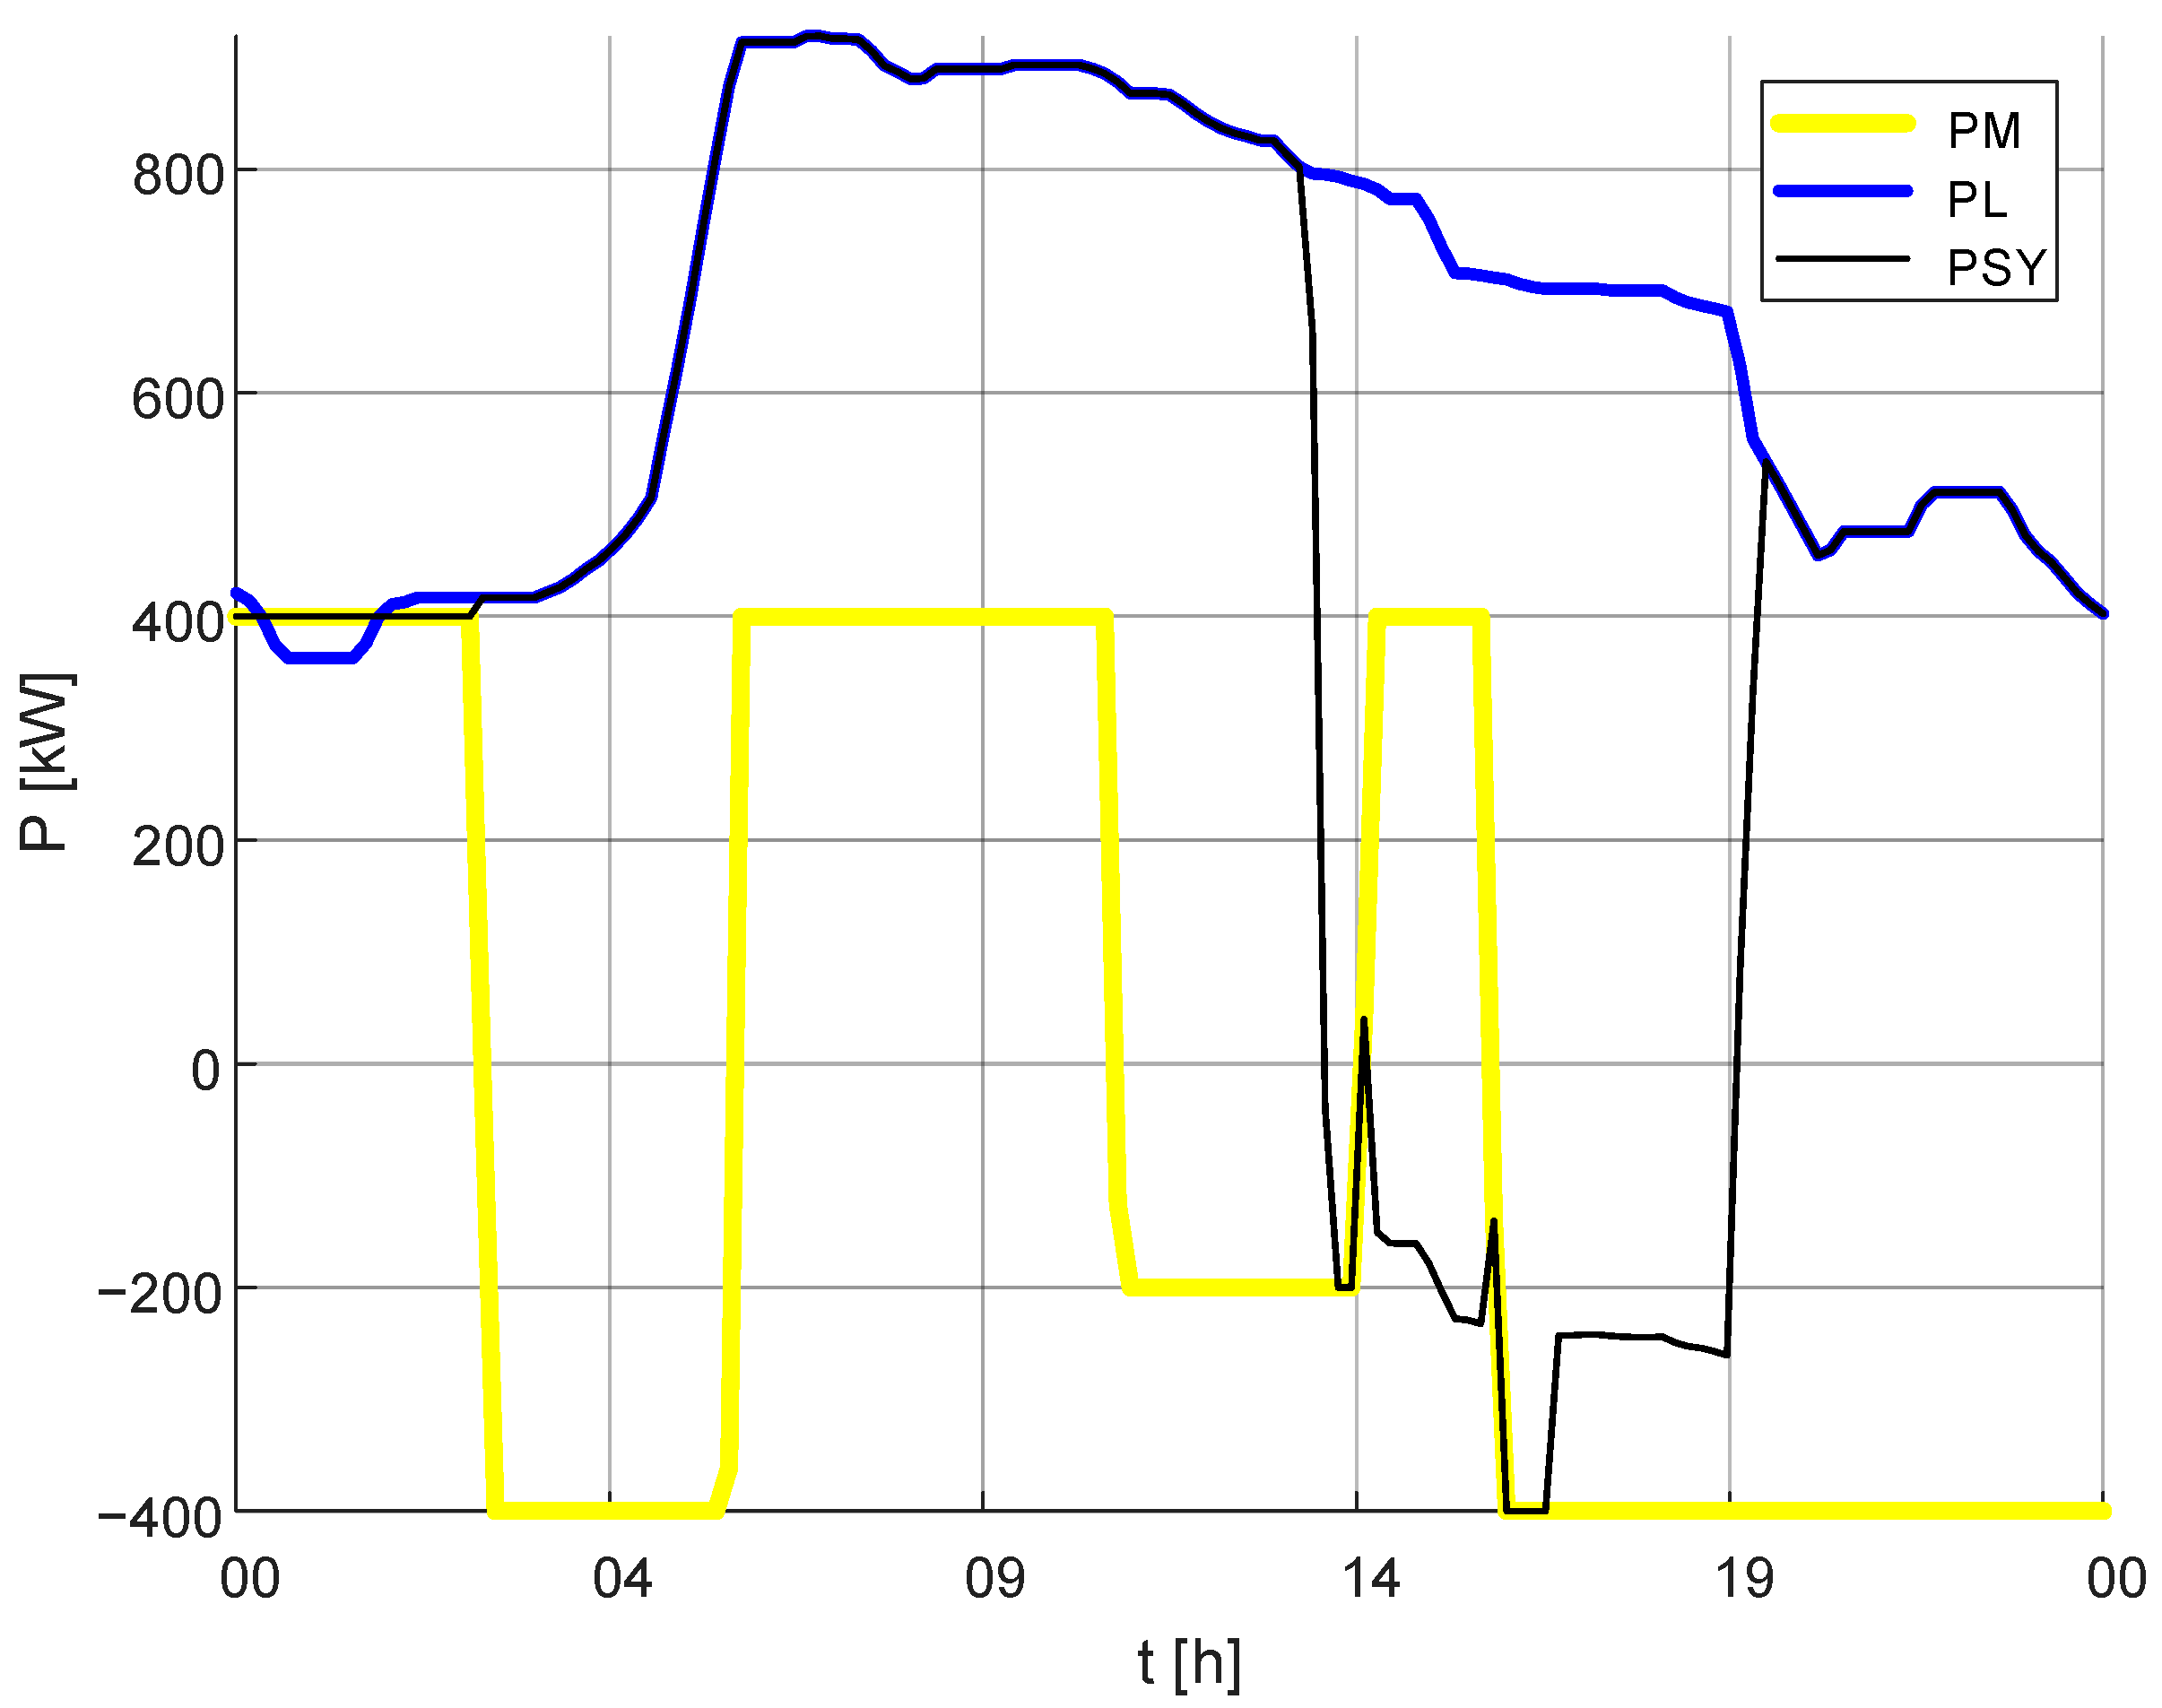
In the case under consideration, the private network works with a power value of the setpoint by a margin between 00:00 and 01:00, between 04:00 and 05:00, between 13:00 and 14:00 and between 19:00 and 20:00 (
Figure 19). The nature of the operation of the private network can be seen on the diagram of the change of energy accumulated in the storage unit in time (
Figure 20). In the analyzed case, while the network is working on the given margin, the storage unit is charged or discharged. The exception is the hours from 13:00 to 19:00, when the profile of the private network operation is dictated by the operation of the HPP.
The last scenario considered was to check the power flow for the private network if the power margin is set as a step function between −400 and 400 kW (
Figure 21 and
Figure 22).
If the margin is set as a step function, the network runs at the set level from 00:00 to about 03:00, then up to about 13:00 the demand is covered by the distribution system (
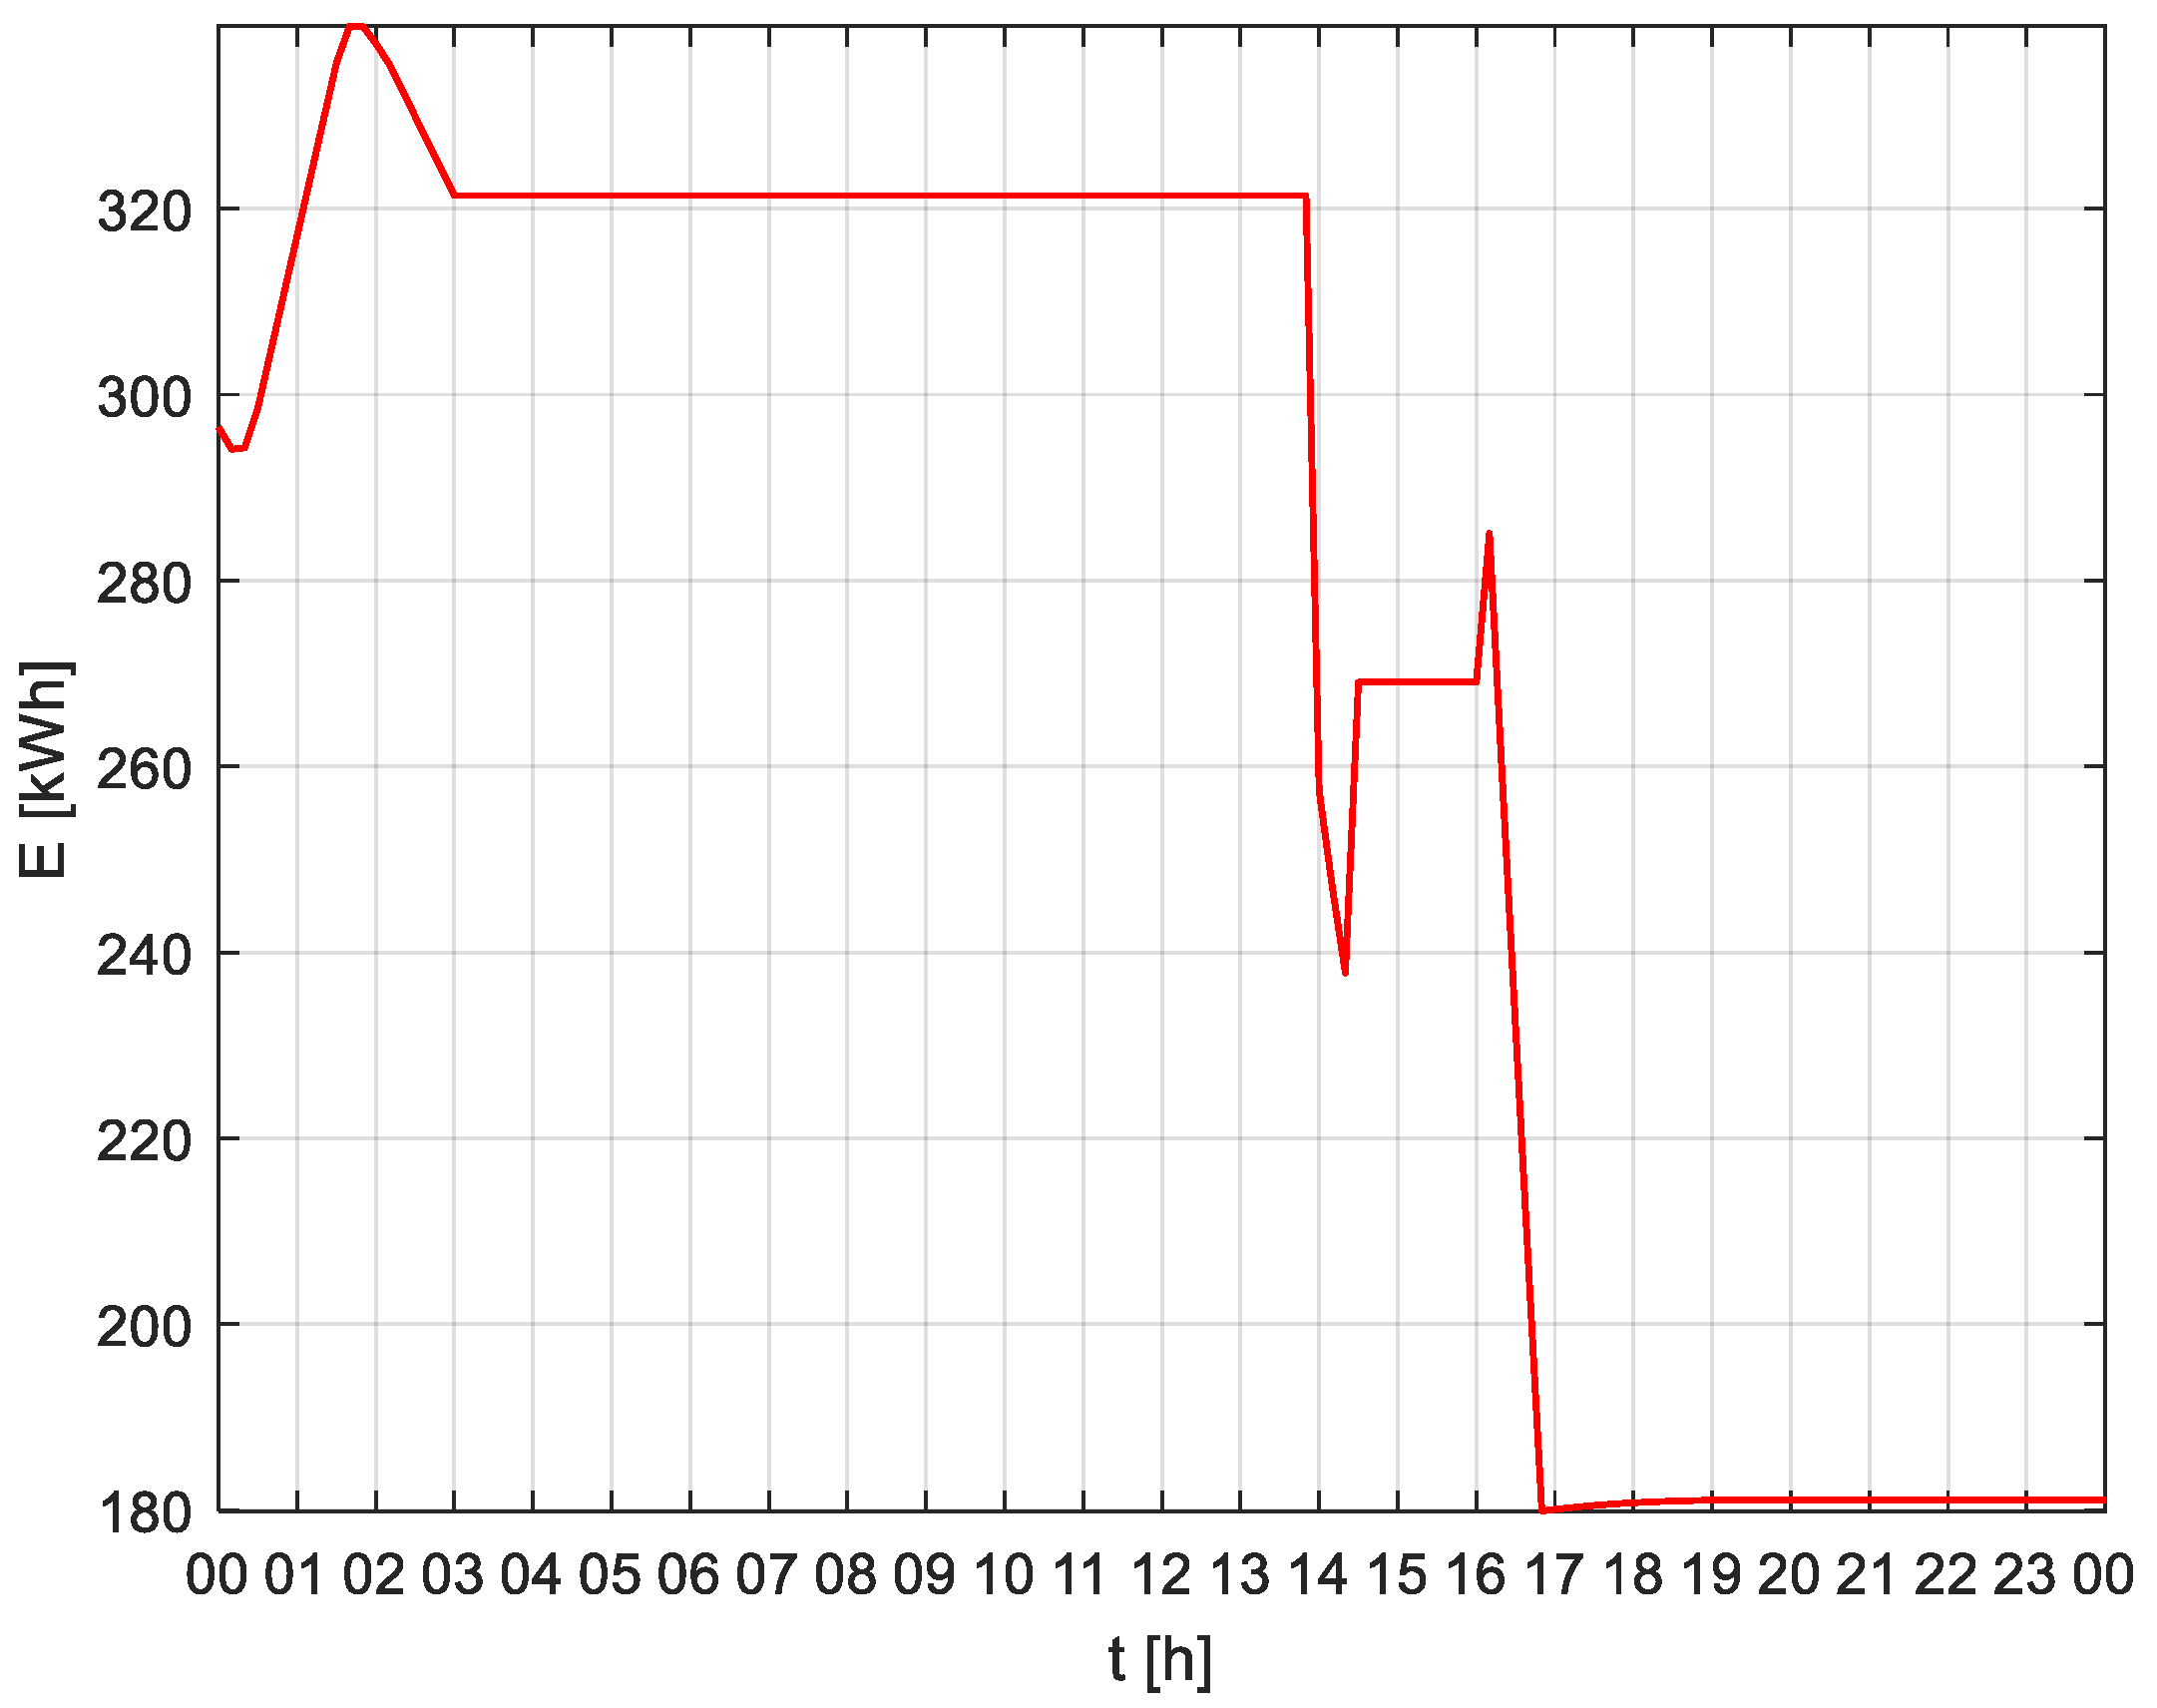
Figure 21). Between 13:00 and 20:00, the power taken from the distribution network is reduced due to the operation of the HPP. From 20:00 to 0:00, the demand is again covered by the distribution system. In the diagram of the change of energy accumulated in the BESS over time (
Figure 22), it is possible to see the charging and discharging of the BESS between hours 00:00 and 03:00—the operation of the network at the set level and the discharging and charging of the BESS between 14:00 and 17:00—the influence of the operation of the HPP.
Table 1 shows a summary of the operation of the private network, for different scenarios with a BESS with real characteristics (
Figure 15,
Figure 16,
Figure 17,
Figure 18,
Figure 19,
Figure 20,
Figure 21 and
Figure 22). The table shows the time for which the private network works exactly on a given margin. The data ARE shown in percentage of when the power exchange with the grid maintains the set margin to the total simulation time.
For the longest percentage of the time, the private network operates on a preset margin, when it is set to a straight line with a constant value of 400 kW (28.97% of simulation time). The shortest one, when it is set with the function between 300–600 kW (13.79% of the simulation time). For the same margin, 400 kW, the difference between a scenario where the HPP operated from 14:00 to 19:00 and a scenario where the HPP did not operate is about 5% of simulation time. For the margin set by the step curve, it was maintained for 18.62% of the simulation time.
The advantage of the applied scenario may be the value of energy transmitted to the distribution system, which in this case is much smaller. Taking into account the significant length of the line connecting the storage and the HPP with the distribution system, lower power transferred to the distribution system guarantees lower power losses.
4. Discussion
In the fast-growing field of electricity storage, tests are necessary to ensure their efficient operation and minimize the risk of failure. The development of new standards and guidelines for the energy storage devices to be delivered to the customer is a continuous process, and documents are constantly growing. As standard, energy storage facilities are tested according to [
48]:
IEC 61427, IEC 62133, IEC 62619;
UL 1642, UL 1973, UL 9540A;
IEEE 1547, IEEE P2030.3.
In particular, IEC 61427 [
49] describes the exact procedure of the test, introducing the “standard cyclic test” and defines on this basis the performance characteristics of the storage. The IEC 61427 standard [
49] defines a special method for identifying the parameters of a battery that works with a RES. The standard test protocol assumes an elevated temperature (40 °C) and a series of cycles that mimic the photovoltaic system. The energy storage test procedure consists of shallow cycles at low SoC and shallow cycles at high SoC. The test carries out 50 cycles with 30% depth of discharge (between 5% and 35% SoC), followed by 100 cycles between 75% and 100% SoC. After 150 cycles, the parameters are measured. The test lasts about 50 days and the total BESS test period requires 3 to 10 tests, which take 5 to 16 months to complete, despite increasing the operating temperature of the batteries to 40 °C, in order to speed up degradation and thus reduce the test time. The article proposes an alternative way to identify the BESS characteristics by using synchronous recording of power, BESS charge level, and temperature of the batteries during normal use of the storage. This is of particular importance at a time when there are limitations in performing tests on industrial facilities.
The article presents an algorithm of control in the active network using active power balances to determine the value of the power of the energy storage at a given value of power exchanged with the distribution network. The algorithm assumes that the exchange power should be constant and its value should depend on the average power of local consumers and generation equipment. Such an assumption, for technical reasons, has a number of advantages related to generation efficiency, power supply reliability, and energy quality. In the case of weather-dependent uncontrollable sources (photovoltaic sources and wind turbines) or with limited controllability (water turbines), it may be difficult to maintain exchange capacity between the active and the distribution grid. Therefore, it is possible to set the exchange capacity value at a level determined by a function. Such a function may depend on the seasons or weather forecasts. Another objective function of the VPP control scenario may be economic aspects. Then, the level of exchange power will be variable and will depend, for example, on exchange prices or balancing market prices resulting from the economic forecasting model.
Charging and discharging characteristics were introduced into the BESS control algorithm. The characteristics introduce limits to the power of the BESS depending on the SoC. The shape of the characteristics results from the technology of storage of energy in the device and system limitations introduced by the manufacturer. Typical charging characteristics of a chemical storage facility based on lithium-ion technology are presented in
Figure 1.
The course of charging (discharging) characteristics is conditioned by physical and chemical changes inside the battery cells. Such charging characteristics are designed to ensure the safety of the battery and maintain maximum capacity of the cell even after many cycles of operation.
Storage facilities that use other energy storage technology, e.g., supercapacitors, fuel cells, kinetic storage units, pumped-storage power plants are characterized by different power dependence on the degree of charge.
In this work, the simulation of power flow control in the active network for the selected scenario was carried out using the direct-current distribution method. Such an approach is often used in the first step for design analyses. The obtained results allow to generally determine the way of operation of the separate system for the proposed control algorithm. Target analyses should also include reactive power distribution. Therefore, it is justified to test the AC model. The possibility of generating reactive power in HPP systems and the BESS allows to regulate voltage levels in network nodes. Additionally, the reactive power of local consumers should be compensated in order to obtain the required power factor at the point of connection of the active network to the parent network.
In the private (local) network, the power flow control scenarios should provide for increased generation and discharge of the energy storage in the morning peaks, while in relation to global demand, generation and discharge of the storage should be increased in the evening peaks.
The task of the VPP operator is therefore to select and optimize the method. In the VPP control scenarios, the best economic result is always preferred; however, this is not always related only to energy market activities. Conducted experiments in the actual network may answer the questions to what extent one should engage in the energy market and ancillary services.
5. Conclusions
In the article, the method of experimental determination of charging and discharging characteristics of the BESS located in a real VPP in Poland is presented. However, the presented methodology can also be applied to other BESS, including ESS based on other technologies. Based on the determined charging and discharging characteristics, the BESS model was established. Such a methodology for determining the BESS model can also be applied to the BESS located in the microgrids or in the distribution system in general.
The article checks how, for the given scenario of power flow control, the private network will be preserved when a storage device with real characteristics is installed in it. The analysis was performed for the day when the maximum demand occurred (19th January).
The usefulness of the scenario on the technical market can be twofold. The first concerns the adoption of an appropriate control strategy and selection of devices already at the stage of designing the private network (microgrid) and the VPP, the second is related to the application of the VPP concept to the existing infrastructure. In the first case, greater savings are possible at the investment stage, in the second case, based on intelligent control algorithms, power flow (current) can be controlled and reduced, which in consequence may have a positive impact on network equipment, such as electrical equipment operating in the distribution network which when subject to current exposure, results in aging, wear and tear and damage. The overloading of current circuits and equipment contacts leads to excessive heating, which accelerates corrosion processes, reduces their mechanical strength, and weakens the electrical strength of insulation. The processes of equipment insulation degradation due to the flow of large currents are associated with changes in the physical properties of the insulation material and chemical changes in the long term.
The considered private network consists of VPP, BESS and a generator. Using the correct power flow scenario, it is possible to ensure optimal operation of a private network connected to the distribution grid.
Author Contributions
Conceptualization, D.K. and J.R.; methodology, D.K. and J.R.; software, D.K. and J.R.; validation, M.J., T.S. and V.S.; formal analysis, D.K., J.R., M.J. and T.S.; investigation, D.K. and J.R.; resources, P.K. and P.J.; data curation, J.S. and V.S.; writing—original draft preparation, D.K. and J.R.; writing—review and editing, M.J. and T.S.; visualization, M.J. and T.S.; supervision, Z.L., T.S. and J.R.; project administration, T.S. and P.J.; funding acquisition, T.S. and P.J. All authors have read and agreed to the published version of the manuscript.
Funding
This research was funded by the National Center of Research and Development in Poland, the project “Developing a platform for aggregating generation and regulatory potential of dispersed renewable energy sources, power retention devices and selected categories of controllable load” supported by European Union Operational Programme Smart Growth 2014–2020, Priority Axis I: Supporting R&D carried out by enterprises, Measure 1.2: Sectoral R&D Programmes, POIR.01.02.00-00-0221/16, performed by TAURON Ekoenergia Ltd.
Conflicts of Interest
The authors declare no conflict of interest.
References
- Liu, C.; Yang, R.J.; Yu, X.; Sun, C.; Wong, P.S.P.; Zhao, H. Virtual power plants for a sustainable urban future. Sustain. Cities Soc. 2020, 102640. [Google Scholar] [CrossRef]
- Yu, S.; Fang, F.; Liu, Y.; Liu, J. Uncertainties of virtual power plant: Problems and countermeasures. Appl. Energy 2019, 239, 454–470. [Google Scholar] [CrossRef]
- Luo, Z.; Hong, S.; Ding, Y. A data mining-driven incentive-based demand response scheme for a virtual power plant. Appl. Energy 2019, 239, 549–559. [Google Scholar] [CrossRef]
- Agamah, S.U.; Ekonomou, L. Energy storage system scheduling for peak demand reduction using evolutionary combinatorial optimisation. Sustain. Energy Technol. Assess. 2017, 23, 73–82. [Google Scholar] [CrossRef]
- Yang, H.; Yi, D.; Zhao, J.; Dong, Z. Distributed Optimal Dispatch of Virtual Power Plant via Limited Communication. IEEE Trans. Power Syst. 2013, 28, 3511–3512. [Google Scholar] [CrossRef]
- Gubanski, A.; Kaczorowska, D. Power flow optimization between microgrid and distribution system. In Proceedings of the 2018 Innovative Materials and Technologies in Electrical Engineering (i-MITEL), Sulecin, Poland, 6−8 May 2018; pp. 1–4. [Google Scholar]
- Naval, N.; Sánchez, R.; Yusta, J.M. A virtual power plant optimal dispatch model with large and small-scale distributed renewable generation. Renew. Energy 2020, 151, 57–69. [Google Scholar] [CrossRef]
- Alhelou, H.H.; Siano, P.; Tipaldi, M.; Iervolino, R.; Mahfoud, F. Primary Frequency Response Improvement in Interconnected Power Systems Using Electric Vehicle Virtual Power Plants. World Electr. Veh. J. 2020, 11, 40. [Google Scholar] [CrossRef]
- Dey, P.P.; Das, D.C.; Latif, A.; Hussain, S.M.S.; Ustun, T.S. Active Power Management of Virtual Power Plant under Penetration of Central Receiver Solar Thermal-Wind Using Butterfly Optimization Technique. Sustainability 2020, 12, 6979. [Google Scholar] [CrossRef]
- Jeon, W.; Cho, S.; Lee, S. Estimating the Impact of Electric Vehicle Demand Response Programs in a Grid with Varying Levels of Renewable Energy Sources: Time-of-Use Tariff versus Smart Charging. Energies 2020, 13, 4365. [Google Scholar] [CrossRef]
- Naval, N.; Yusta, J.M. Water-Energy Management for Demand Charges and Energy Cost Optimization of a Pumping Stations System under a Renewable Virtual Power Plant Model. Energies 2020, 13, 2900. [Google Scholar] [CrossRef]
- Behi, B.; Baniasadi, A.; Arefi, A.; Gorjy, A.; Jennings, P.; Pivrikas, A. Cost–Benefit Analysis of a Virtual Power Plant Including Solar PV, Flow Battery, Heat Pump, and Demand Management: A Western Australian Case Study. Energies 2020, 13, 2614. [Google Scholar] [CrossRef]
- Suresh, V.; Janik, P.; Jasinski, M. Metaheuristic approach to optimal power flow using mixed integer distributed ant colony optimization. Arch. Electr. Eng. 2020, 69, 335–348. [Google Scholar] [CrossRef]
- Nikolaou, T.; Stavrakakis, G.S.; Tsamoudalis, K. Modeling and Optimal Dimensioning of a Pumped Hydro Energy Storage System for the Exploitation of the Rejected Wind Energy in the Non-Interconnected Electrical Power System of the Crete Island, Greece. Energies 2020, 13, 2705. [Google Scholar] [CrossRef]
- Energy storage in high renewable penetration power systems: Technologies, applications, supporting policies and suggestions. CSEE J. Power Energy Syst. 2020. [CrossRef]
- Al Shaqsi, A.Z.; Sopian, K.; Al-Hinai, A. Review of energy storage services, applications, limitations, and benefits. Energy Rep. 2020. [Google Scholar] [CrossRef]
- Tiba, S.; van Rijnsoever, F.J.; Hekkert, M.P. Firms with benefits: A systematic review of responsible entrepreneurship and corporate social responsibility literature. Corp. Soc. Responsib. Environ. Manag. 2019, 26, 265–284. [Google Scholar] [CrossRef]
- Liu, C.; Xu, D.; Weng, J.; Zhou, S.; Li, W.; Wan, Y.; Jiang, S.; Zhou, D.; Wang, J.; Huang, Q. Phase Change Materials Application in Battery Thermal Management System: A Review. Materials 2020, 13, 4622. [Google Scholar] [CrossRef]
- Yuan, Z.; Wang, W.; Wang, H.; Yildizbasi, A. A new methodology for optimal location and sizing of battery energy storage system in distribution networks for loss reduction. J. Energy Storage 2020, 29, 101368. [Google Scholar] [CrossRef]
- Yuan, Z.; Wang, W.; Wang, H.; Yıldızbaşı, A. Allocation and sizing of battery energy storage system for primary frequency control based on bio-inspired methods: A case study. Int. J. Hydrogen Energy 2020, 45, 19455–19464. [Google Scholar] [CrossRef]
- Mansor, M.A.; Hasan, K.; Othman, M.M.; Noor, S.Z.B.M.; Musirin, I. Construction and Performance Investigation of Three-Phase Solar PV and Battery Energy Storage System Integrated UPQC. IEEE Access 2020, 8, 103511–103538. [Google Scholar] [CrossRef]
- Joshua, A.M.; Vittal, K.P. Transient behavioural modelling of Battery Energy Storage System supporting Microgrid. In Proceedings of the 2020 IEEE International Conference on Power Electronics, Smart Grid and Renewable Energy (PESGRE2020), Cochin, India, 2–4 January 2020; pp. 1–6. [Google Scholar]
- Rallo, H.; Canals Casals, L.; De La Torre, D.; Reinhardt, R.; Marchante, C.; Amante, B. Lithium-ion battery 2nd life used as a stationary energy storage system: Ageing and economic analysis in two real cases. J. Clean. Prod. 2020, 272, 122584. [Google Scholar] [CrossRef]
- Banguero, E.; Correcher, A.; Pérez-Navarro, Á.; García, E.; Aristizabal, A. Diagnosis of a battery energy storage system based on principal component analysis. Renew. Energy 2020, 146, 2438–2449. [Google Scholar] [CrossRef]
- Leow, Y.Y.; Ooi, C.A.; Hamidi, M.N. Performance evaluation of grid-connected power conversion systems integrated with real-time battery monitoring in a battery energy storage system. Electr. Eng. 2020, 102, 245–258. [Google Scholar] [CrossRef]
- Pham, T.T.; Kuo, T.C.; Bui, D.M.; Cao, M.T.; Nguyen, T.P.; Nguyen, T.D. Reliability Evaluation of an Aggregate Battery Energy Storage System Under Dynamic Operation. In Proceedings of the 2020 IEEE International Conference on Power Electronics, Smart Grid and Renewable Energy (PESGRE2020), Cochin, India, 2–4 January 2020; pp. 1–8. [Google Scholar]
- Bai, B. Estimate the Parameter and Modelling of a Battery Energy Storage System. In Proceedings of the 2020 Chinese Control And Decision Conference (CCDC), Hefei, China, 22–24 August 2020; pp. 5444–5448. [Google Scholar]
- Shi, T.; Yang, H.; Zhang, N.; Hua, G. Research on Verification Method of Electromechanical Transient Simulation Model of Battery Energy Storage System. In Proceedings of the 2020 Asia Energy and Electrical Engineering Symposium (AEEES), Chengdu, China, 29–30 May 2020; pp. 767–770. [Google Scholar]
- Kumar, J.; Parthasarathy, C.; Västi, M.; Laaksonen, H.; Shafie-Khah, M.; Kauhaniemi, K. Sizing and Allocation of Battery Energy Storage Systems in Åland Islands for Large-Scale Integration of Renewables and Electric Ferry Charging Stations. Energies 2020, 13, 317. [Google Scholar] [CrossRef]
- Kwon, S.-J.; Lee, S.-E.; Lim, J.-H.; Choi, J.; Kim, J. Performance and Life Degradation Characteristics Analysis of NCM LIB for BESS. Electronics 2018, 7, 406. [Google Scholar] [CrossRef]
- Collin, R.; Miao, Y.; Yokochi, A.; Enjeti, P.; von Jouanne, A. Advanced Electric Vehicle Fast-Charging Technologies. Energies 2019, 12, 1839. [Google Scholar] [CrossRef]
- Khodadoost Arani, A.A.; Gharehpetian, G.B.; Abedi, M. Review on Energy Storage Systems Control Methods in Microgrids. Int. J. Electr. Power Energy Syst. 2019, 107, 745–757. [Google Scholar] [CrossRef]
- Ghiji, M.; Novozhilov, V.; Moinuddin, K.; Joseph, P.; Burch, I.; Suendermann, B.; Gamble, G. A Review of Lithium-Ion Battery Fire Suppression. Energies 2020, 13, 5117. [Google Scholar] [CrossRef]
- Sikorski, T.; Jasiński, M.; Ropuszyńska-Surma, E.; Węglarz, M.; Kaczorowska, D.; Kostyla, P.; Leonowicz, Z.; Lis, R.; Rezmer, J.; Rojewski, W.; et al. A Case Study on Distributed Energy Resources and Energy-Storage Systems in a Virtual Power Plant Concept: Technical Aspects. Energies 2020, 13, 3086. [Google Scholar] [CrossRef]
- Silva, V.A.; Aoki, A.R.; Lambert-Torres, G. Optimal Day-Ahead Scheduling of Microgrids with Battery Energy Storage System. Energies 2020, 13, 5188. [Google Scholar] [CrossRef]
- Waclawek, Z.; Rezmer, J.; Janik, P.; Nanewortor, X. Sizing of Photovoltaic Power and Storage System for Optimized Hosting Capacity. In Proceedings of the 2016 IEEE 16th International Conference on Environment and Electrical Engineering (EEEIC), Florence, Italy, 7–10 June 2016; pp. 1–5. [Google Scholar]
- Kaczorowska, D.; Rezmer, J.; Jasinski, M.; Kostyla, P.; Leonowicz, Z.; Sikorski, T.; Janik, P.; Bejmert, D. Identification of Technological Limitations of a Battery Energy Storage System. In Proceedings of the 2020 12th International Conference and Exhibition on Electrical Power Quality and Utilisation- (EPQU), Cracow, Poland, 14–15 September 2020; pp. 1–6. [Google Scholar]
- Chen, S.; Zhao, Z.; Gu, X. The Research on Characteristics of Li-NiMnCo Lithium-Ion Batteries in Electric Vehicles. J. Energy 2020, 2020, 3721047. [Google Scholar] [CrossRef]
- Zhang, S.S.; Xu, K.; Jow, T.R. Charge and discharge characteristics of a commercial LiCoO2-based 18650 Li-ion battery. J. Power Sources 2006, 160, 1403–1409. [Google Scholar] [CrossRef]
- Dulau, L.I.; Abrudean, M.; Bica, D. Distributed generation and virtual power plants. In Proceedings of the 2014 49th International Universities Power Engineering Conference (UPEC), Cluj-Napoca, Romania, 2–5 September 2014; pp. 1–5. [Google Scholar]
- Alahyari, A.; Ehsan, M.; Mousavizadeh, M.S. A hybrid storage-wind virtual power plant (VPP) participation in the electricity markets: A self-scheduling optimization considering price, renewable generation, and electric vehicles uncertainties. J. Energy Storage 2019, 25, 100812. [Google Scholar] [CrossRef]
- Yang, Y.; Wei, B.; Qin, Z. Sequence-based differential evolution for solving economic dispatch considering virtual power plant. IET Gener. Transm. Distrib. 2019, 13, 3202–3215. [Google Scholar] [CrossRef]
- Sikorski, T.; Jasiński, M.; Ropuszyńska-Surma, E.; Węglarz, M.; Kaczorowska, D.; Kostyła, P.; Leonowicz, Z.; Lis, R.; Rezmer, J.; Rojewski, W.; et al. A Case Study on Distributed Energy Resources and Energy-Storage Systems in a Virtual Power Plant Concept: Economic Aspects. Energies 2019, 12, 4447. [Google Scholar] [CrossRef]
- Ringkjøb, H.-K.; Haugan, P.M.; Solbrekke, I.M. A review of modelling tools for energy and electricity systems with large shares of variable renewables. Renew. Sustain. Energy Rev. 2018, 96, 440–459. [Google Scholar] [CrossRef]
- Zhang, C.; Chen, H.; Liang, Z.; Hua, D. An interval DC power flow analysis through the optimizing-scenarios method. In Proceedings of the 2017 IEEE Innovative Smart Grid Technologies Asia (ISGT-Asia), Auckland, New Zealand, 4–7 December 2017; pp. 1–5. [Google Scholar]
- De Oliveira Gomes, A.; Meirelles Gouvea, M. DC power flow optimization with a parallel evolutionary algorithm. In Proceedings of the 2012 Sixth IEEE/PES Transmission and Distribution: Latin America Conference and Exposition (T&D-LA), Montevideo, Uruguay, 3–5 September 2012; pp. 1–6. [Google Scholar]
- Simpson-Porco, J.W. Lossy DC Power Flow. IEEE Trans. Power Syst. 2018, 33, 2477–2485. [Google Scholar] [CrossRef]
- Plass, M. Energy Storage System Standards and Test Types. Available online: https://www.dnvgl.com/services/energy-storage-system-standards-and-test-types-111331 (accessed on 16 December 2020).
- International Electrotechnical Commission. IEC 61427-1:2013 Secondary Cells and Batteries for Renewable Energy Storage—General Requirements and Methods of test—Part 1: Photovoltaic Off-Grid Application; IEC: Geneva, Switzerland, 2013; pp. 1–37. [Google Scholar]
Figure 1.
Dependence of the storage unit power on the state of charge (SoC).
Figure 1.
Dependence of the storage unit power on the state of charge (SoC).
Figure 2.
Diagram of the analyzed active grid. PG—power generation, PL—load, PSY—power distribution system, PST—BESS.
Figure 2.
Diagram of the analyzed active grid. PG—power generation, PL—load, PSY—power distribution system, PST—BESS.
Figure 3.
The scheme of determining points of BESS characteristics on the basis of current monitoring of storage operation. P—the power of charging and discharging the storage, SoC—state of charge.
Figure 3.
The scheme of determining points of BESS characteristics on the basis of current monitoring of storage operation. P—the power of charging and discharging the storage, SoC—state of charge.
Figure 4.
A set of points that forms the charging and discharging characteristics of the BESS for 1 min samples.
Figure 4.
A set of points that forms the charging and discharging characteristics of the BESS for 1 min samples.
Figure 5.
The result of the approximation of the results with the 1 min data polynomial function.
Figure 5.
The result of the approximation of the results with the 1 min data polynomial function.
Figure 6.
Determined charging and discharging characteristics of the BESS based on 1 min data.
Figure 6.
Determined charging and discharging characteristics of the BESS based on 1 min data.
Figure 7.
Map of “attendance” of the storage unit operation states during charging (A) and discharging (B) for 1 min data; the color scale represents a value proportional to the operation time in the P and SoC range.
Figure 7.
Map of “attendance” of the storage unit operation states during charging (A) and discharging (B) for 1 min data; the color scale represents a value proportional to the operation time in the P and SoC range.
Figure 8.
Dependence of storage power on the operation plan.
Figure 8.
Dependence of storage power on the operation plan.
Figure 9.
Set operation plan of the BESS.
Figure 9.
Set operation plan of the BESS.
Figure 10.
Operation resulting from the charging and discharging characteristics of the BESS with the real characteristics; change of energy accumulated in the BESS over time (A); change of BESS charging and discharging power over time (B).
Figure 10.
Operation resulting from the charging and discharging characteristics of the BESS with the real characteristics; change of energy accumulated in the BESS over time (A); change of BESS charging and discharging power over time (B).
Figure 11.
Set operation plan of the BESS.
Figure 11.
Set operation plan of the BESS.
Figure 12.
Operation resulting from the charging and discharging characteristics of the BESS with the real characteristics; change of energy accumulated in the BESS over time (A); change of BESS charging and discharging power over time (B).
Figure 12.
Operation resulting from the charging and discharging characteristics of the BESS with the real characteristics; change of energy accumulated in the BESS over time (A); change of BESS charging and discharging power over time (B).
Figure 13.
Storage control algorithm, PG—power generation (positive), PL—load (negative), PSS—storage charging power (negative), PDS—storage discharging power (positive), EST—storage energy, PM—set level of power exchange between the private network and the distribution system.
Figure 13.
Storage control algorithm, PG—power generation (positive), PL—load (negative), PSS—storage charging power (negative), PDS—storage discharging power (positive), EST—storage energy, PM—set level of power exchange between the private network and the distribution system.
Figure 14.
Power generation—PG and load PL in the private network for 19 January 2017.
Figure 14.
Power generation—PG and load PL in the private network for 19 January 2017.
Figure 15.
Results of the simulation of the operation of the private network with the BESS with real characteristics for the set exchange power PM 400 kW; PSY—exchange power with the distribution grid and PL—load.
Figure 15.
Results of the simulation of the operation of the private network with the BESS with real characteristics for the set exchange power PM 400 kW; PSY—exchange power with the distribution grid and PL—load.
Figure 16.
Results of the simulation of the operation of the private network with the BESS with real characteristics for a set exchange power of PM 400 kW; change of energy accumulated in the BESS over time.
Figure 16.
Results of the simulation of the operation of the private network with the BESS with real characteristics for a set exchange power of PM 400 kW; change of energy accumulated in the BESS over time.
Figure 17.
Results of the simulation of the operation of the private network with the BESS with real characteristics for the set PM 400 kW exchange power in the absence of generation; PSY—exchange power with the distribution grid and PL—load.
Figure 17.
Results of the simulation of the operation of the private network with the BESS with real characteristics for the set PM 400 kW exchange power in the absence of generation; PSY—exchange power with the distribution grid and PL—load.
Figure 18.
Results of the simulation of the operation of the private network with the BESS with real characteristics for the set PM 400 kW exchange power in the absence of generation; change of energy accumulated in the BESS over time.
Figure 18.
Results of the simulation of the operation of the private network with the BESS with real characteristics for the set PM 400 kW exchange power in the absence of generation; change of energy accumulated in the BESS over time.
Figure 19.
Results of the simulation of the operation of the private network with the BESS with real characteristics for the set exchange power according to the curve, variable in the range PM 300–600 kW; PSY—exchange power with the distribution grid and PL—load.
Figure 19.
Results of the simulation of the operation of the private network with the BESS with real characteristics for the set exchange power according to the curve, variable in the range PM 300–600 kW; PSY—exchange power with the distribution grid and PL—load.
Figure 20.
Results of the simulation of the operation of the private network with the BESS with real characteristics for the set exchange power according to the curve, variable in the range PM 300–600 kW; change of energy accumulated in the BESS over time.
Figure 20.
Results of the simulation of the operation of the private network with the BESS with real characteristics for the set exchange power according to the curve, variable in the range PM 300–600 kW; change of energy accumulated in the BESS over time.
Figure 21.
Results of the simulation of the operation of the private network with the BESS with real characteristics for the power margin PM set as a step function between −400 and 400 kW; PSY—exchange power with the distribution grid and PL—load.
Figure 21.
Results of the simulation of the operation of the private network with the BESS with real characteristics for the power margin PM set as a step function between −400 and 400 kW; PSY—exchange power with the distribution grid and PL—load.
Figure 22.
Results of the simulation of the operation of the private network with the BESS with real characteristics for the power margin PM set as a step function between −400 and 400 kW; change of energy accumulated in the BESS over time.
Figure 22.
Results of the simulation of the operation of the private network with the BESS with real characteristics for the power margin PM set as a step function between −400 and 400 kW; change of energy accumulated in the BESS over time.
Table 1.
The time for which the private network works on a given margin.
Table 1.
The time for which the private network works on a given margin.
| | PM = Const.
PM = 400 kW | PM = Const.
PM = 400 kW
PG = 0 kW | PM ≠ Const.
PM ∈ [300, 600] kW | PM ≠ Const.
PM ∈ [−400, 400] kW |
|---|
| operating time at a given level | 28.97% | 24.14% | 13.79% | 18.62% |
| Publisher’s Note: MDPI stays neutral with regard to jurisdictional claims in published maps and institutional affiliations. |
© 2020 by the authors. Licensee MDPI, Basel, Switzerland. This article is an open access article distributed under the terms and conditions of the Creative Commons Attribution (CC BY) license (http://creativecommons.org/licenses/by/4.0/).

 ,
, 


