1. Introduction
In recent electrical power networks, the number of renewable energy sources (RES) and energy storage systems (EES) have continuously increased. Thus, different approaches to controlling them have appeared, such as microgrids and virtual power plants (VPP) [
1,
2]. Generally, VPPs are autonomous units equipped with effective power flow control systems. VPPs consist of different elements that are connected to the distribution network. The indicated elements are generators, loads, and energy storage systems [
2]. Coordinating the work of the entire VPP is a difficult and demanding task.
The operation of VPPs may be analyzed in different areas. This article is related to power quality (PQ) issues in VPP. Thus,
Table 1 presents the current research directions concerning VPPs and PQ. The literature investigation is based only on articles published in the last 5 years.
The possibility of a simple assessment of a virtual power plant’s impact regarding power quality was the main focus of this paper. The articles that concern PQ issues in VPPs are indicated in this paragraph. The first example is an article [
112] which introduces VPP as vehicles to facilitate the cost-efficient integration of distributed energy sources (DER) into the existing power system. The article also presents case studies that demonstrate the application of the concepts on a test system. The result of the system performance includes energy efficiency, power quality, and security. The authors of [
113] propose extensions of the IEC 61850 standard to enhance the interaction between the VPP controller and the DER. The article presents the implementation of VPP communication and control architecture in a real case. The investigated case concerns the PQ recorders’ issues and demands in accordance with IEC 61850. The authors of [
114] attempt to provide a suitable framework for harmonizing the operations of different units of VPP. The authors indicated that decisions and the generation of profit, although complying with the required power quality levels and physical network constraints, are an important element of VPP strategies. The authors of [
115] present simulations of a situation with a VPP during an islanded grid with a thermal power plant for baseload. The indicated VPP consists of 200 MW wind power, 100 MW photovoltaic power, and +/− 250 MW pumped storage. The article presents different control strategies of the storage plant to highlight the impact of VPP on power quality. The authors of [
116] consider the coordinative operation problem of multi-energy VPP. The bi-objective dispatch model was established for the optimization of the performance of multi-energy VPP in terms of economic cost and PQ. A real case study was performed on Hongfeng Eco-town in Southwestern China. The authors of [
117] consider VPP management with priority requirements optimized by the compromised method. The operation optimization model of the virtual power plant was formulated as the fuzzy multiple objective optimization problems. This optimization problem considers the satisfaction of both customers and suppliers, system stability, PQ, and costs with operation limitations. The proposed method was applied in a test system. However, in the literature, there is a lack of research that presents the assessment of PQ in different units of VPP. Thus, this article investigates PQ measurements in long-term performance.
This article presents a case study of analyzing a real VPP that operates in Poland. The investigated VPP consists of a fragment of both low-voltage (LV) and medium-voltage (MV) distribution networks. The VPP consists of a hydropower plant (HPP), a photovoltaic system (PV), and energy storage systems (ESS). In this article, only the part of this VPP is analyzed which is concerned with the 1.25 MW HPP and associated 0.5 MW ESS. The investigation is based on power quality measurements that were obtained synchronically in five measurement points, which are HPP, ESS, associated MV line, and two LV loads. The duration of the measurements was from 1 May 2020 to 28 October 2020. Therefore, the observable period of time was 26 weeks—182 days. For the indicated time period and measurement points, the assessment of PQ was realized using the global value. The single parameter of a single measurement point for such a long period of time demands analysis of a huge dataset. Thus, this global index approach was used. Moreover, since the measurement points are connected in one network, the proposition of common analysis was proposed. The analysis of how to use the flagging concept was indicated for multipoint measurement. Another element of the analysis was to indicate the different working conditions of the VPP. Fifty of them were indicated concerning HPP and EES working schedule. Then, the comparison of the indicated working conditions was realized using the global index.
To summarize the contributions of this article:
It contains the analysis of multipoint, synchronic, and long-term power quality data;
PQ assessment is realized for both single-point and area-related approaches;
Flagging concept is discussed for both single-point and area-related approaches;
PQ assessment is realized using the global index approach;
Different working conditions of the VPP are defined, investigated, and compared in terms of power quality.
To obtain indicated contributions, the article is organized into five sections. In
Section 2, the investigated virtual power plant is presented.
Section 3 presents results concerning the use of the global index for PQ assessment of each measurement point; different working conditions of the investigated VPP; analyzing the application of the flagging concept for the area-related approach; using the global index for the assessment of different working conditions of the VPP in both single-point and area-related approaches.
Section 4 presents a discussion of the obtained results.
Section 5 indicates the conclusions.
2. Methodology and Research Object Description
The investigation presented in this article concerns PQ issues in VPP. The proposed approach concerns the application of the global index. Thus, the selection and customization of the global index for VPP issues are presented in
Section 2.1. Then, the description of the investigated VPP localized in Poland is presented in
Section 2.2. Finally, the specific working conditions of single VPP elements are indicated in
Section 2.3.
2.1. Global Power Quality Index
As a current trend in PQ issues, the global index was indicated. Thus, in this article, there is a proposition to use one such index. Aggregated data index (ADI) [
86,
87] was selected. The used index consists of five classic 10-min PQ parameters, such as:
frequency—f,
voltage—U,
short term flicker severity—Pst,
asymmetry factor—ku2,
total harmonic distortion in voltage—THDu,
And additional parameters that are responsible for the enhancement of the sensitivity of the index:
Indicated parameters refer to the demands of the standard IEC 61000-4-30 [
118]. Three-phase values are reduced to one using the mean value of them. All factors that are included in the ADI are based on the differences between the measured 10-min aggregated power quality data and the recommended limits of the selected standard. Therefore, the differences are expressed as a percentage in relation to standard limits. However, to customize the proposed index to VPP issues, the authors decided to exclude frequency. It is known that local changes do not impact frequency. Therefore, to conduct an assessment of VPP, impact on local area frequency was omitted. The calculations of ADI were performed on raw PQ measurement data using Excel software.
2.2. Investigated VPP
The indicated virtual power plant in this article is based on a fragment of the distribution network in Poland [
119,
120]. It is supplied by two stations of 110/20 kV. The indicated stations are connected to a 110 kV electrical power system. However, in this article, only a certain area of one substation is investigated. The 20 kV network fed from the station is an overhead cable network. The 20 kV network fed from the second station is mainly an urban cable network. The 20 kV network has earth fault current compensation. Connected to the VPP are a 1.25 MW HPP and a 0.5 MW battery ESS, both of which are connected to a medium voltage level.
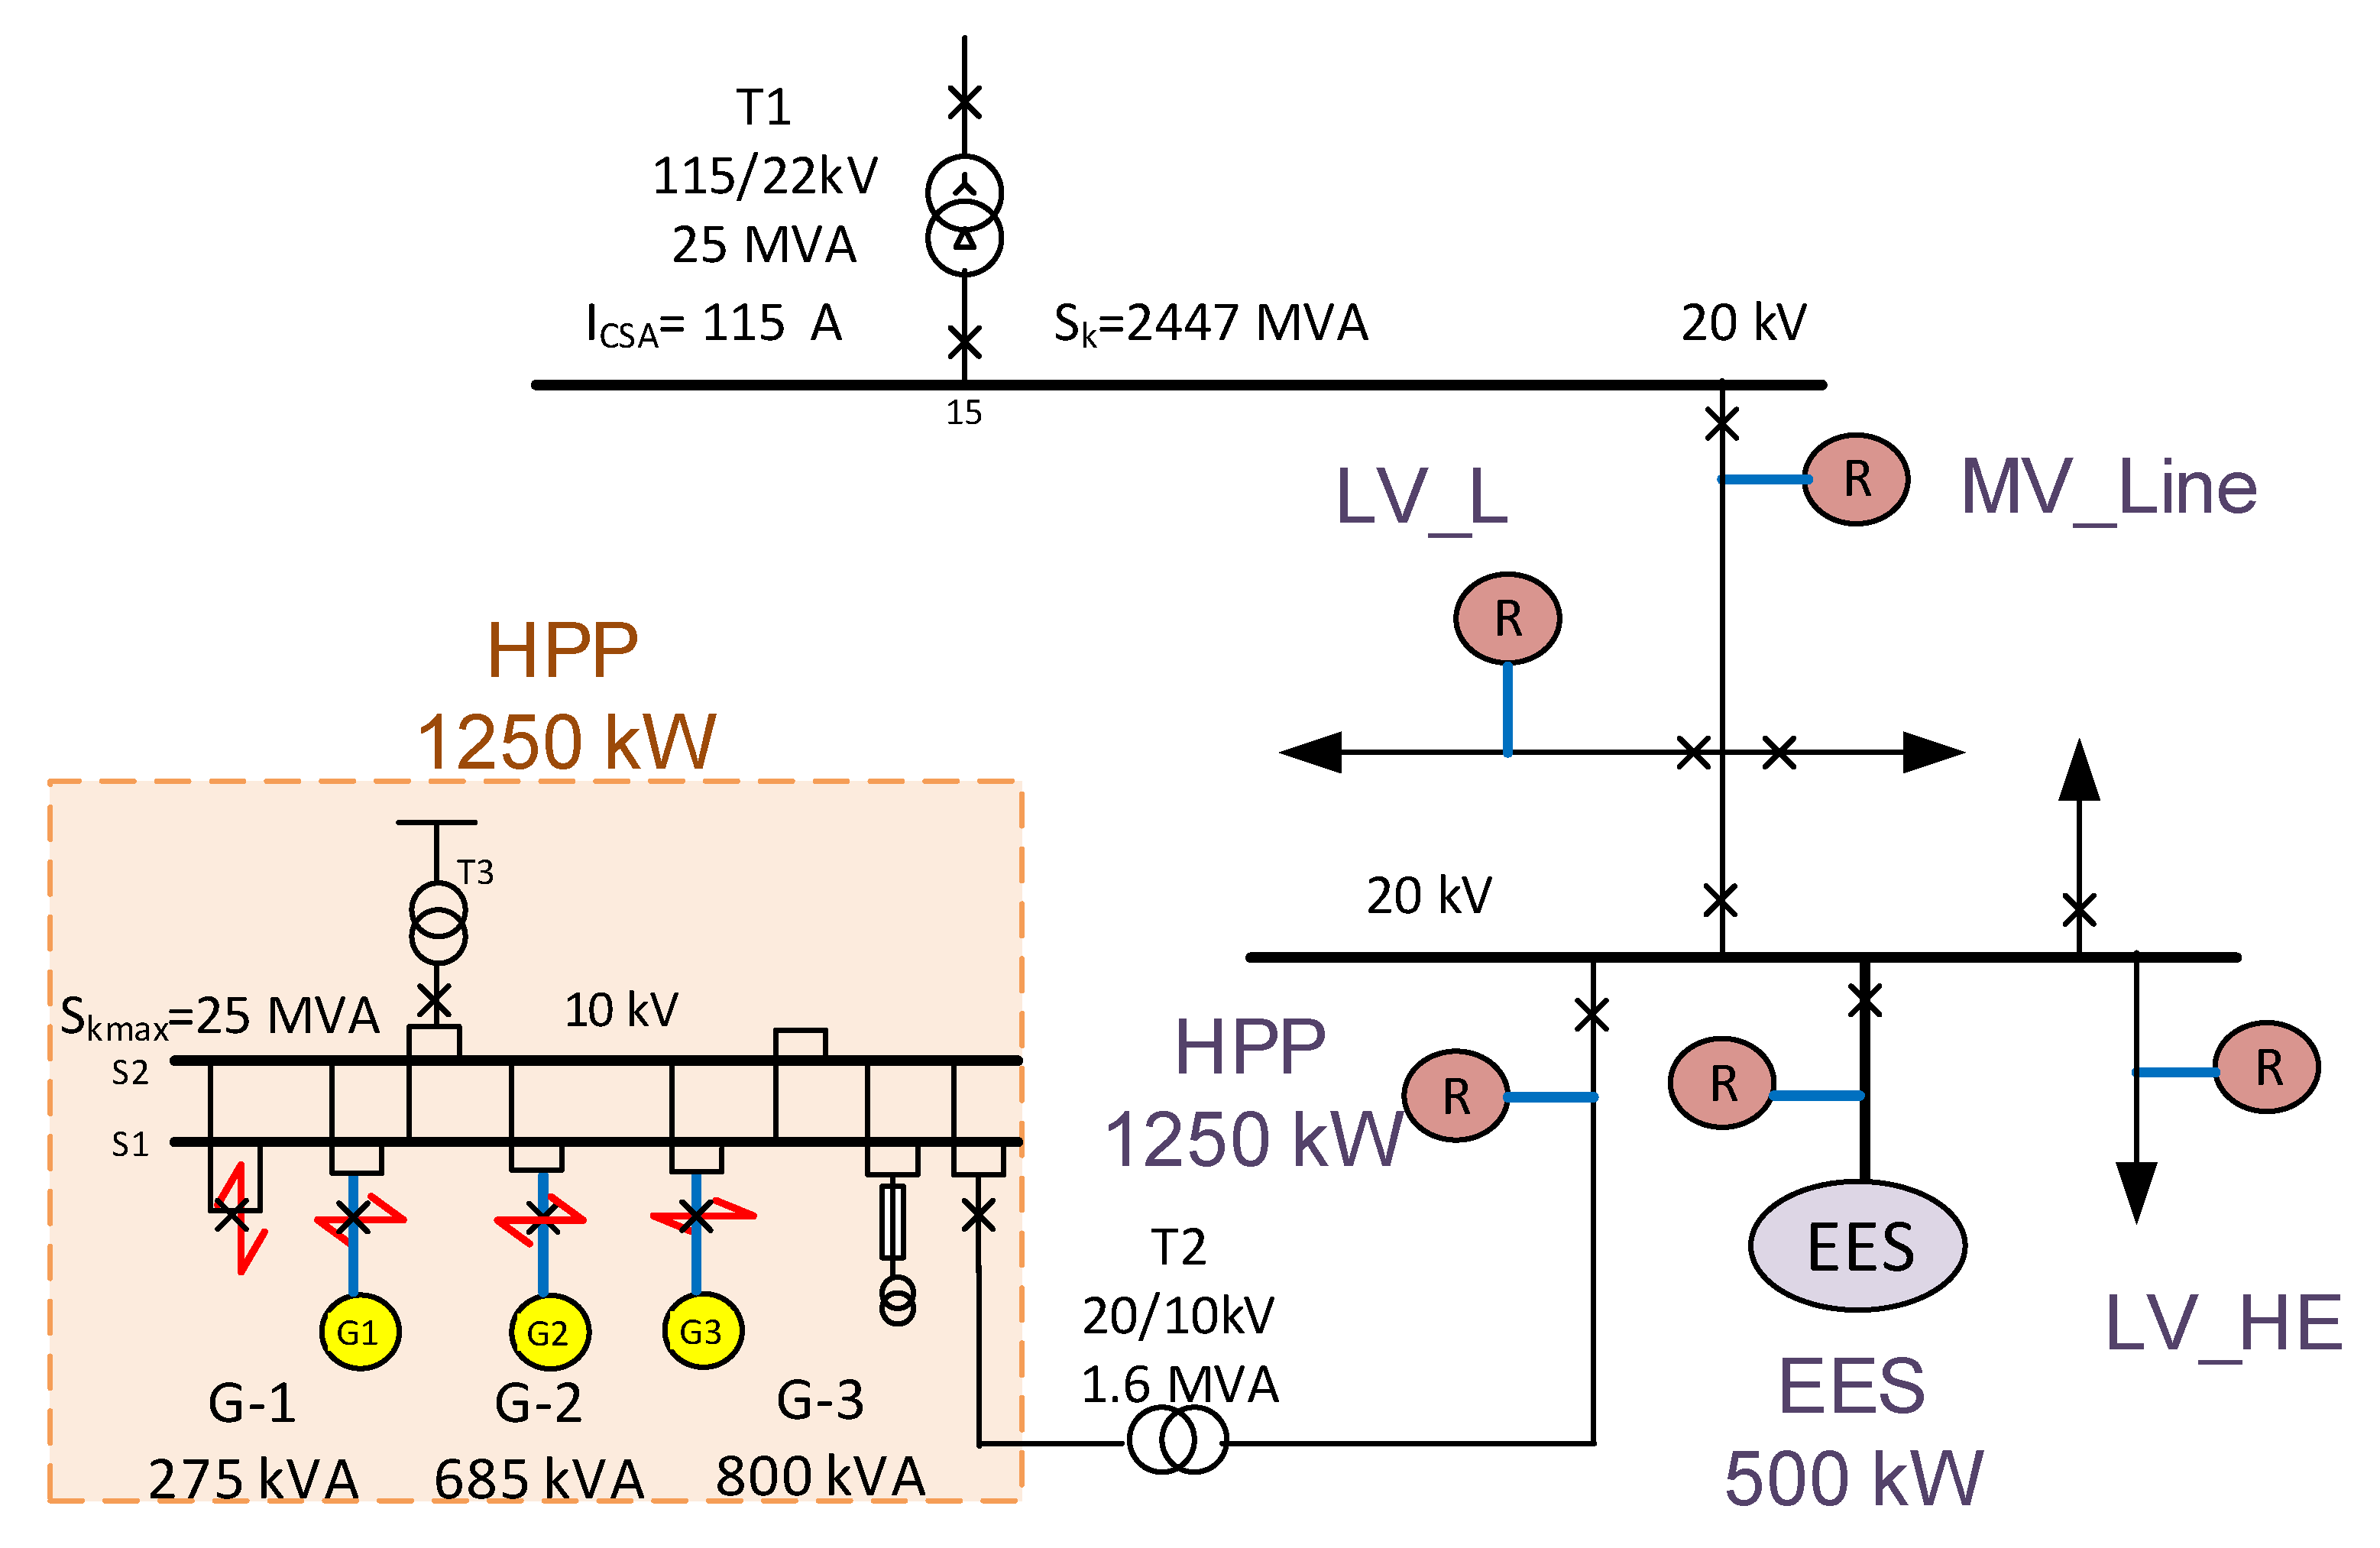
The simplified scheme of the selected fragment of the VPP area is presented in
Figure 1. It consists of a 20 kV distribution network with a hydropower plant (HPP) and an energy storage system (EES) connected with the HV/MV substation by MV line (MV_L). HPP and ESS are connected to the same node of the network. Furthermore, two additional low voltage loads are indicated: LV_L and LV_HE. LV_L is connected with the indicated MV associated line. LV_HE is connected with the node of the HPP and EES. The localization of power quality recorders (denoted as “R”) is also indicated in
Figure 1. Due to this, the HPP and EES are connected to one node and their PQ recorders use the same voltage transformer. In further research, they are treated as one point, indicated as MV_HPP&EES.
2.3. Different Working Conditions of Virtual Power Plant (VPP)
To investigate the working conditions of the VPP, different working conditions of the HPP and EES were considered. Regarding the HPP, three different working conditions were considered:
not working—active power level equal to 0 or equal to own consumption;
working at a part power—active power higher than own consumption but lower than 1 MW;
working at a maximal power—active power higher than 1 MW.
Regarding EES, five different working conditions were indicated:
not working—active power level equal to 0 or equal to own consumption;
a low power charging—charging power higher than 40 kW and lower than 200 kW;
a high power charging—charging power higher than 200 kW;
a low power discharging—discharging power higher than 6 kW and lower than 200 kW;
a high power discharging—discharging power higher than 200 kW.
The values are based on working circumstances that were discussed with the power distribution company during the VPP settlement.
3. Results
This section presents the results of the investigation of PQ issues in VPP. In
Section 3.1, the global index application is presented. The case is realized for EN 50160 [
121] demands and realized for each measurement point separately.
Section 3.2 analyzes the occurrence of different working conditions of the investigated VPP. Then, in
Section 3.3, the flagging concept is applied in accordance with standard IEC 61000-4-30 [
114]. Additionally, the cross-analysis between event occurrence in different measurement points is conducted. Finally,
Section 3.4 presents the assessment of the indicated working conditions of the VPP using the global index for both single-point and area-related approaches.
3.1. Application of Global Power Quality Index for Single Measurement Points
This section presents the application of ADI to a long-term comparison of power quality level. As indicated in
Section 2.1, VPP frequency is omitted so the frequency importance rate was set as 0. Standard EN 50160 [
121] was selected to obtain global values. The applied limits based on EN 50160 [
121] are presented in
Table 2.
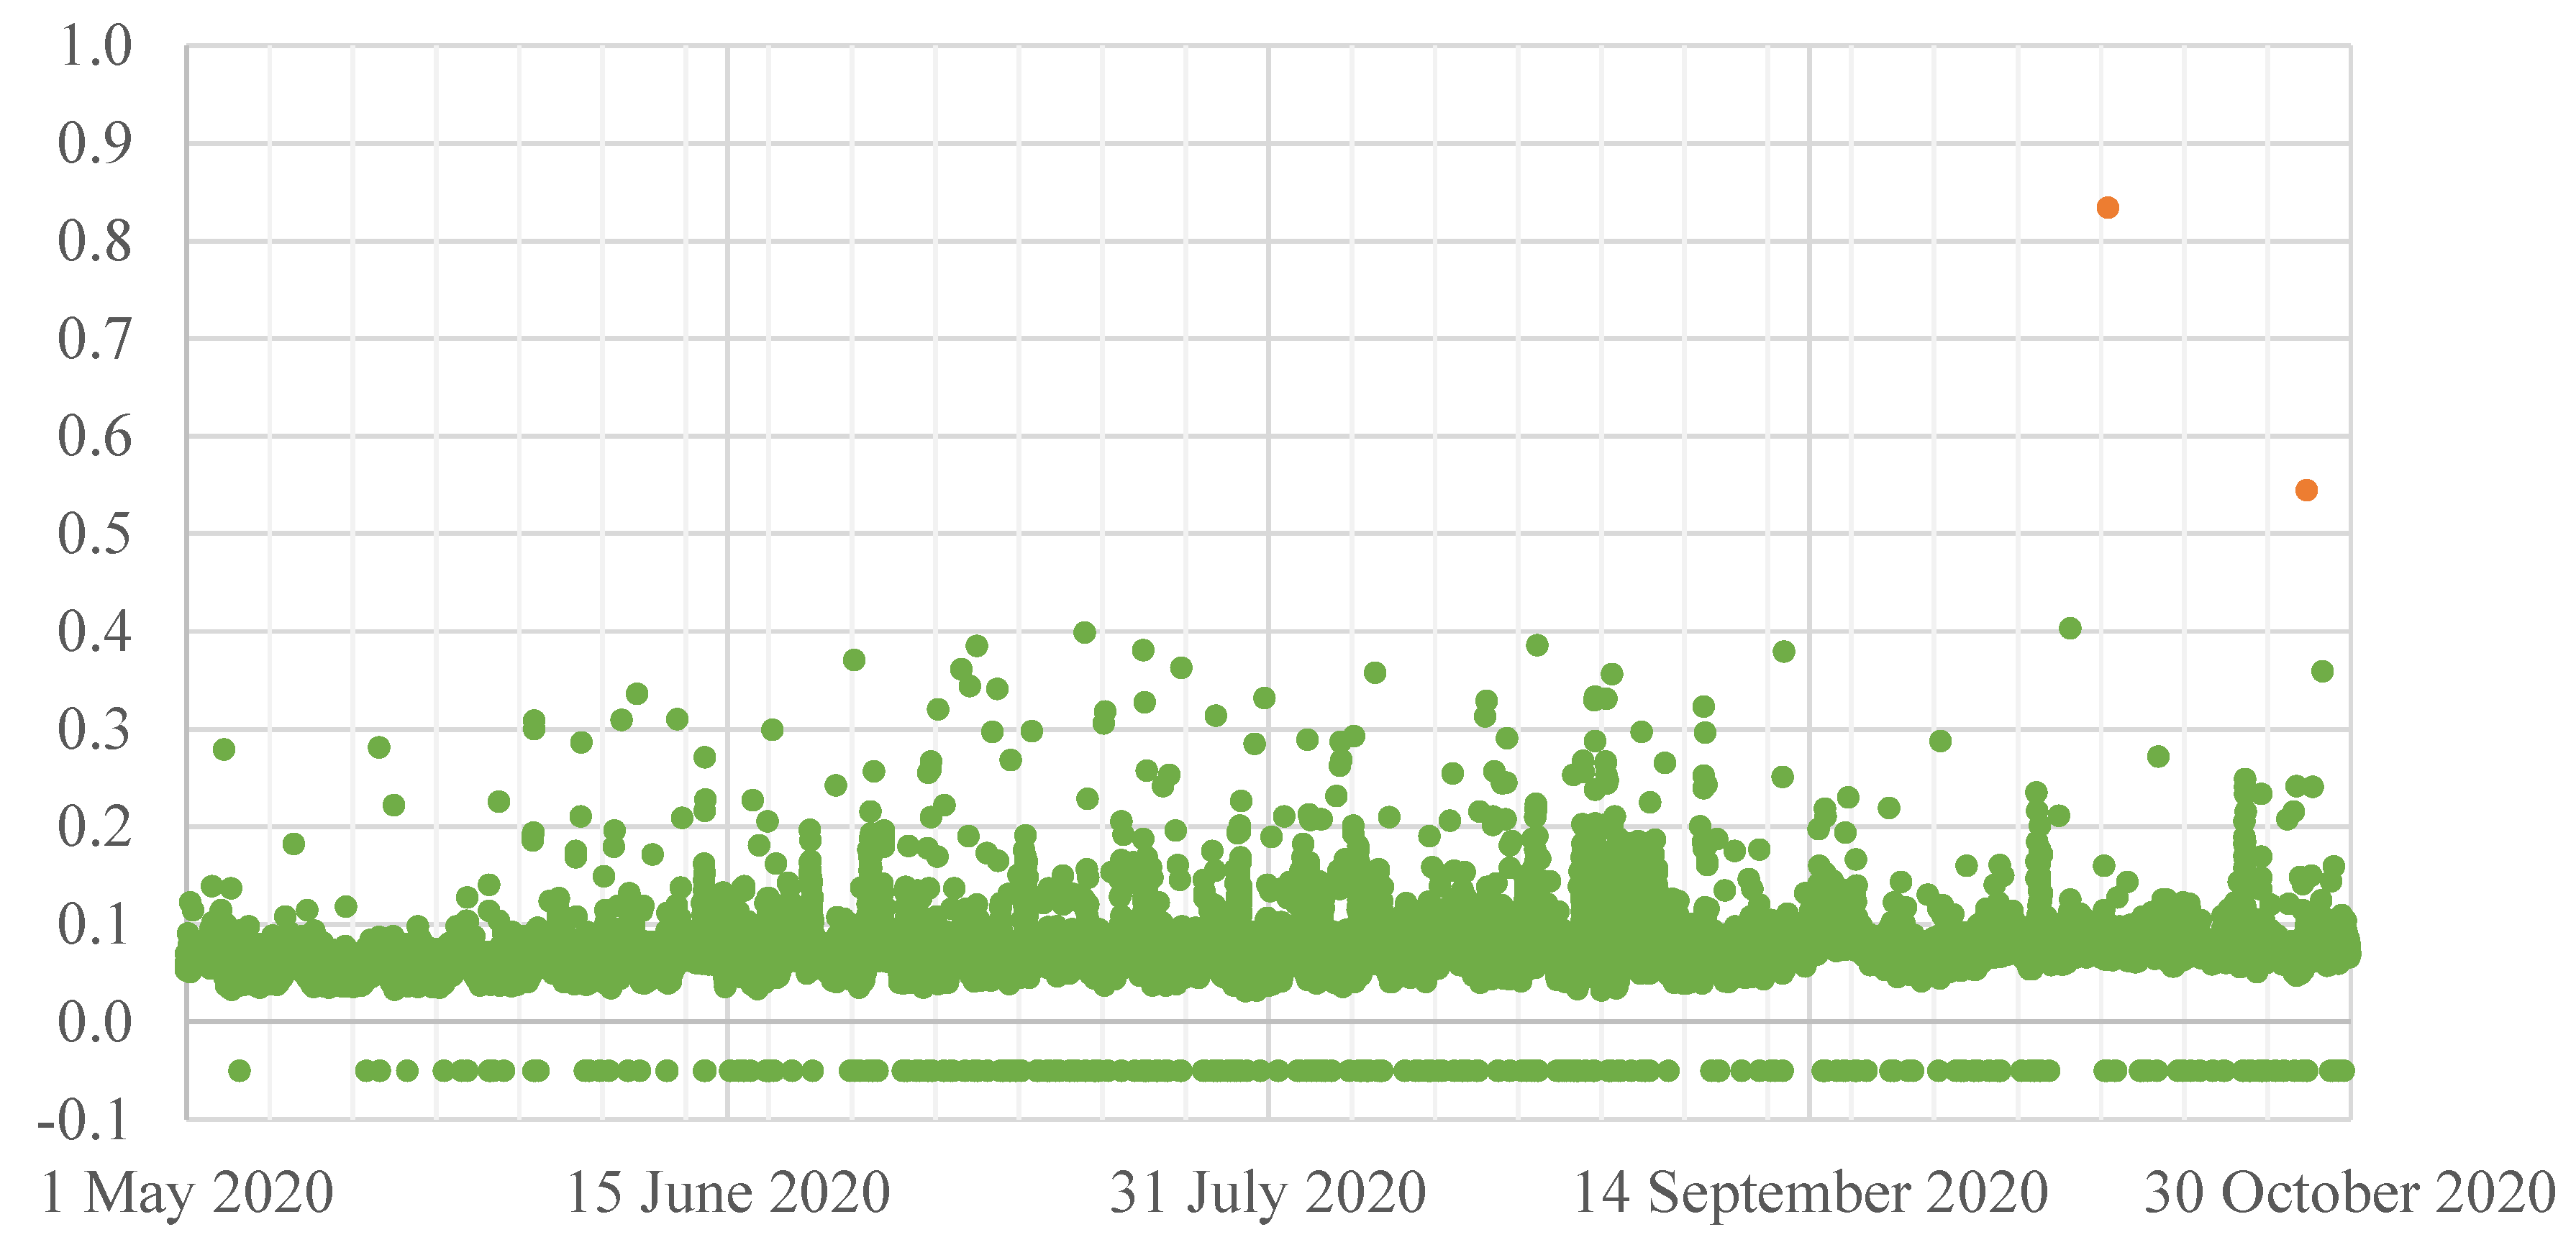
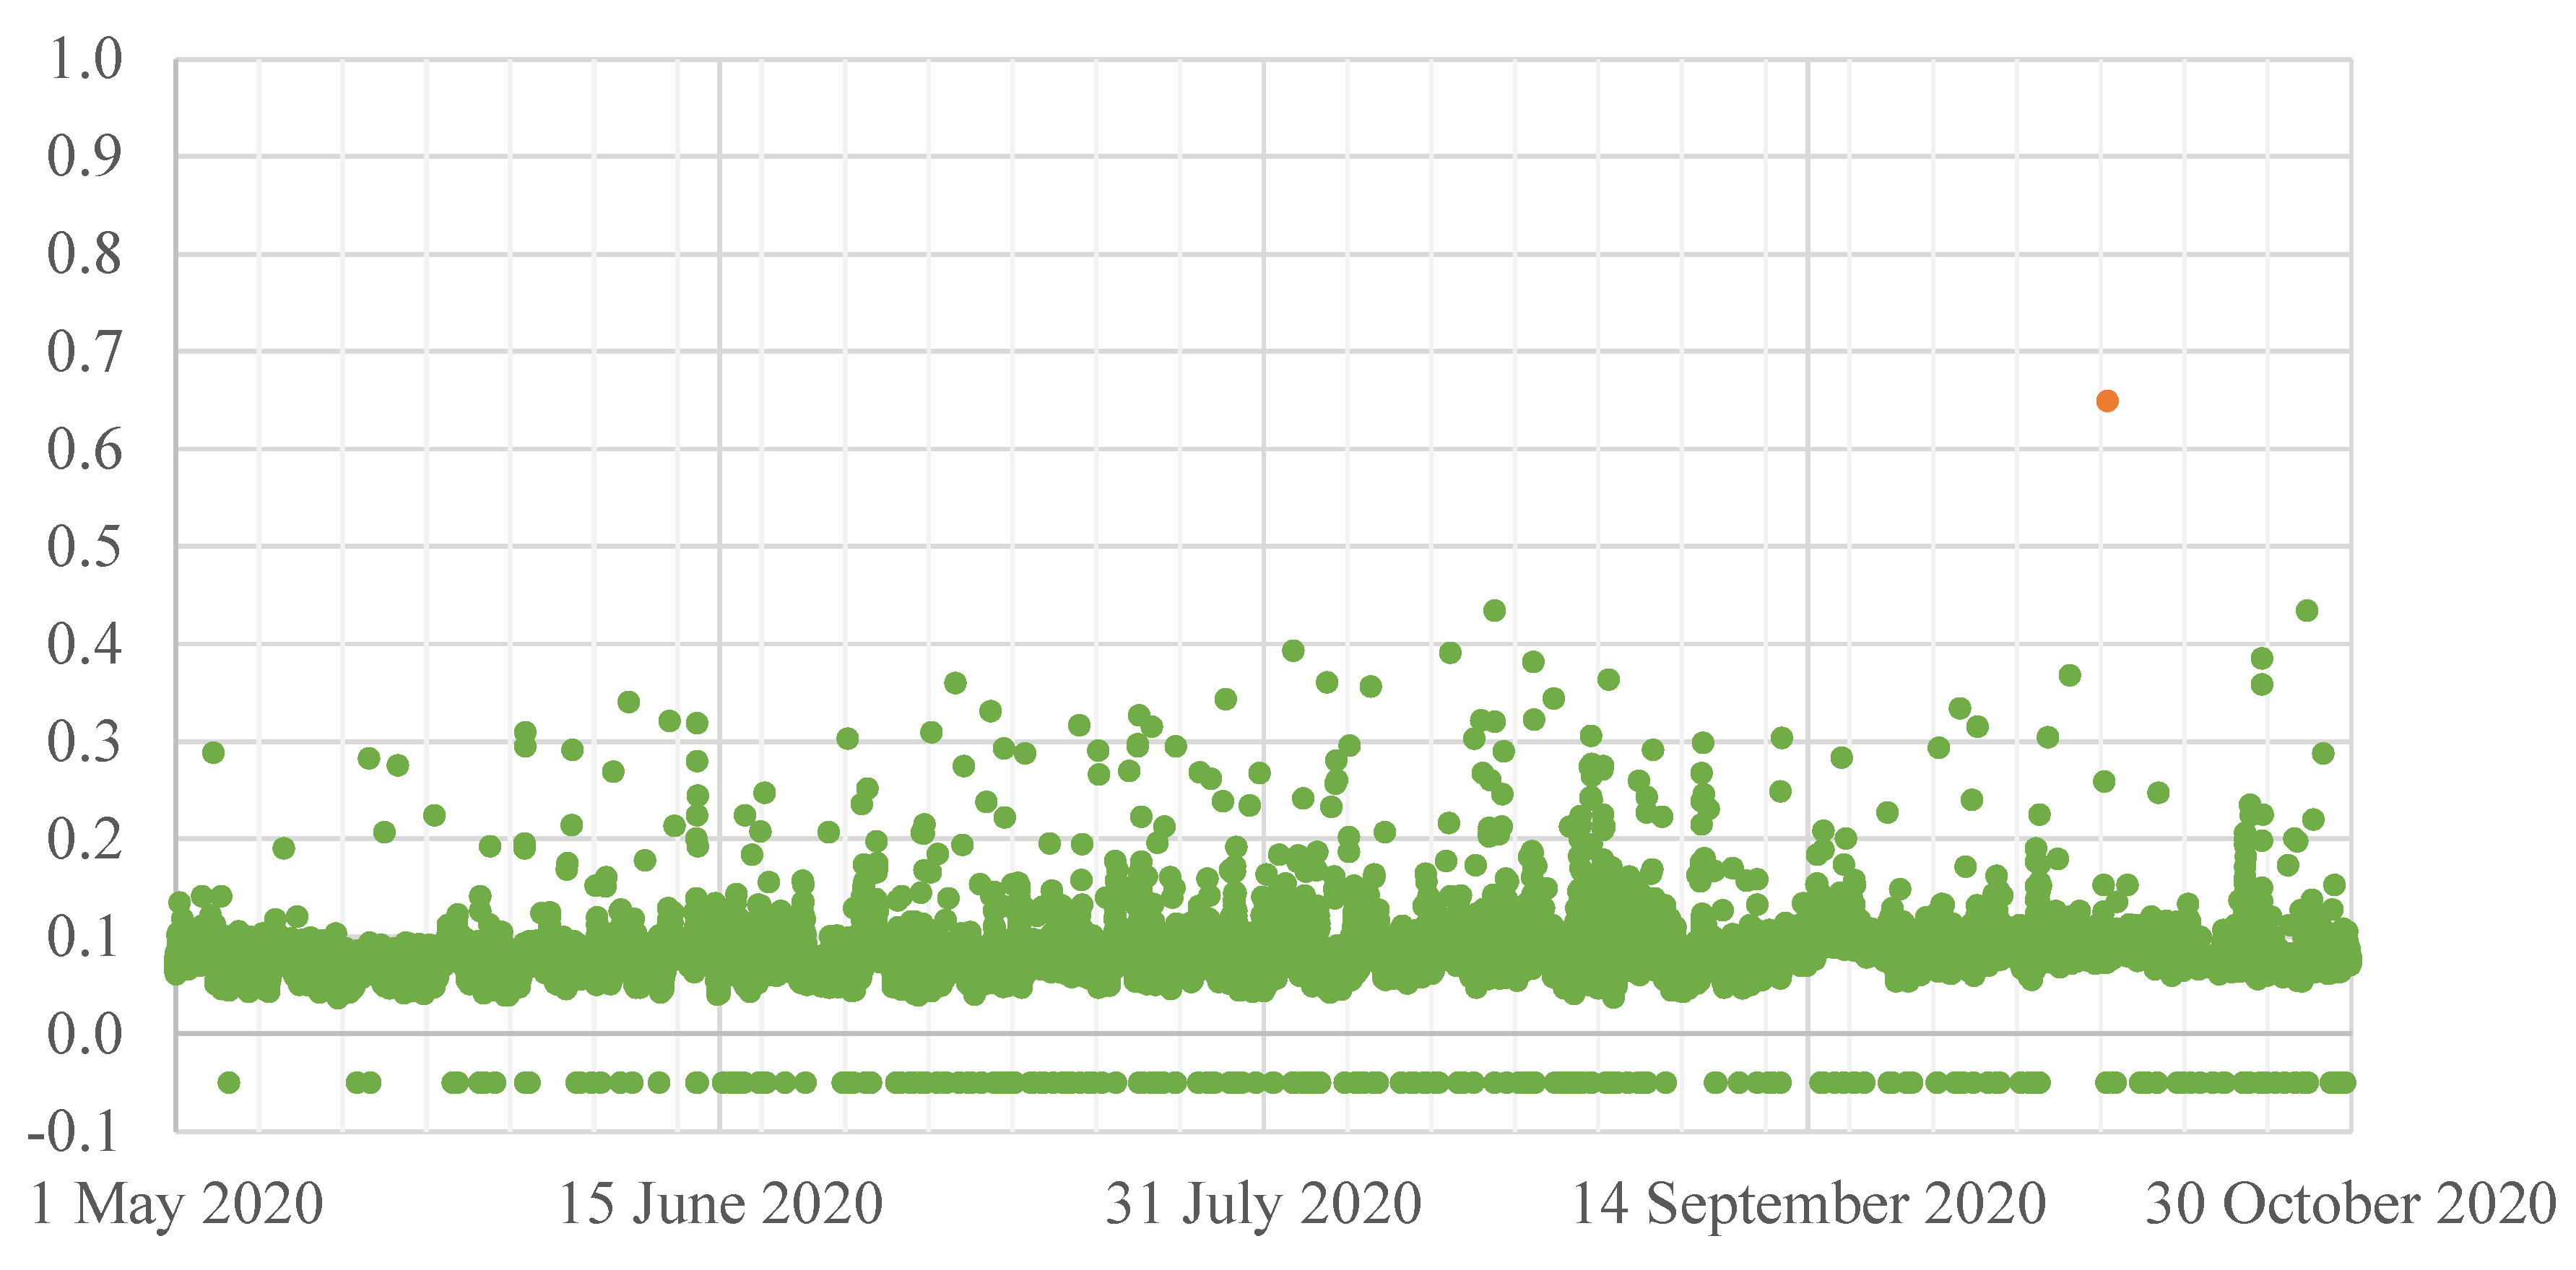
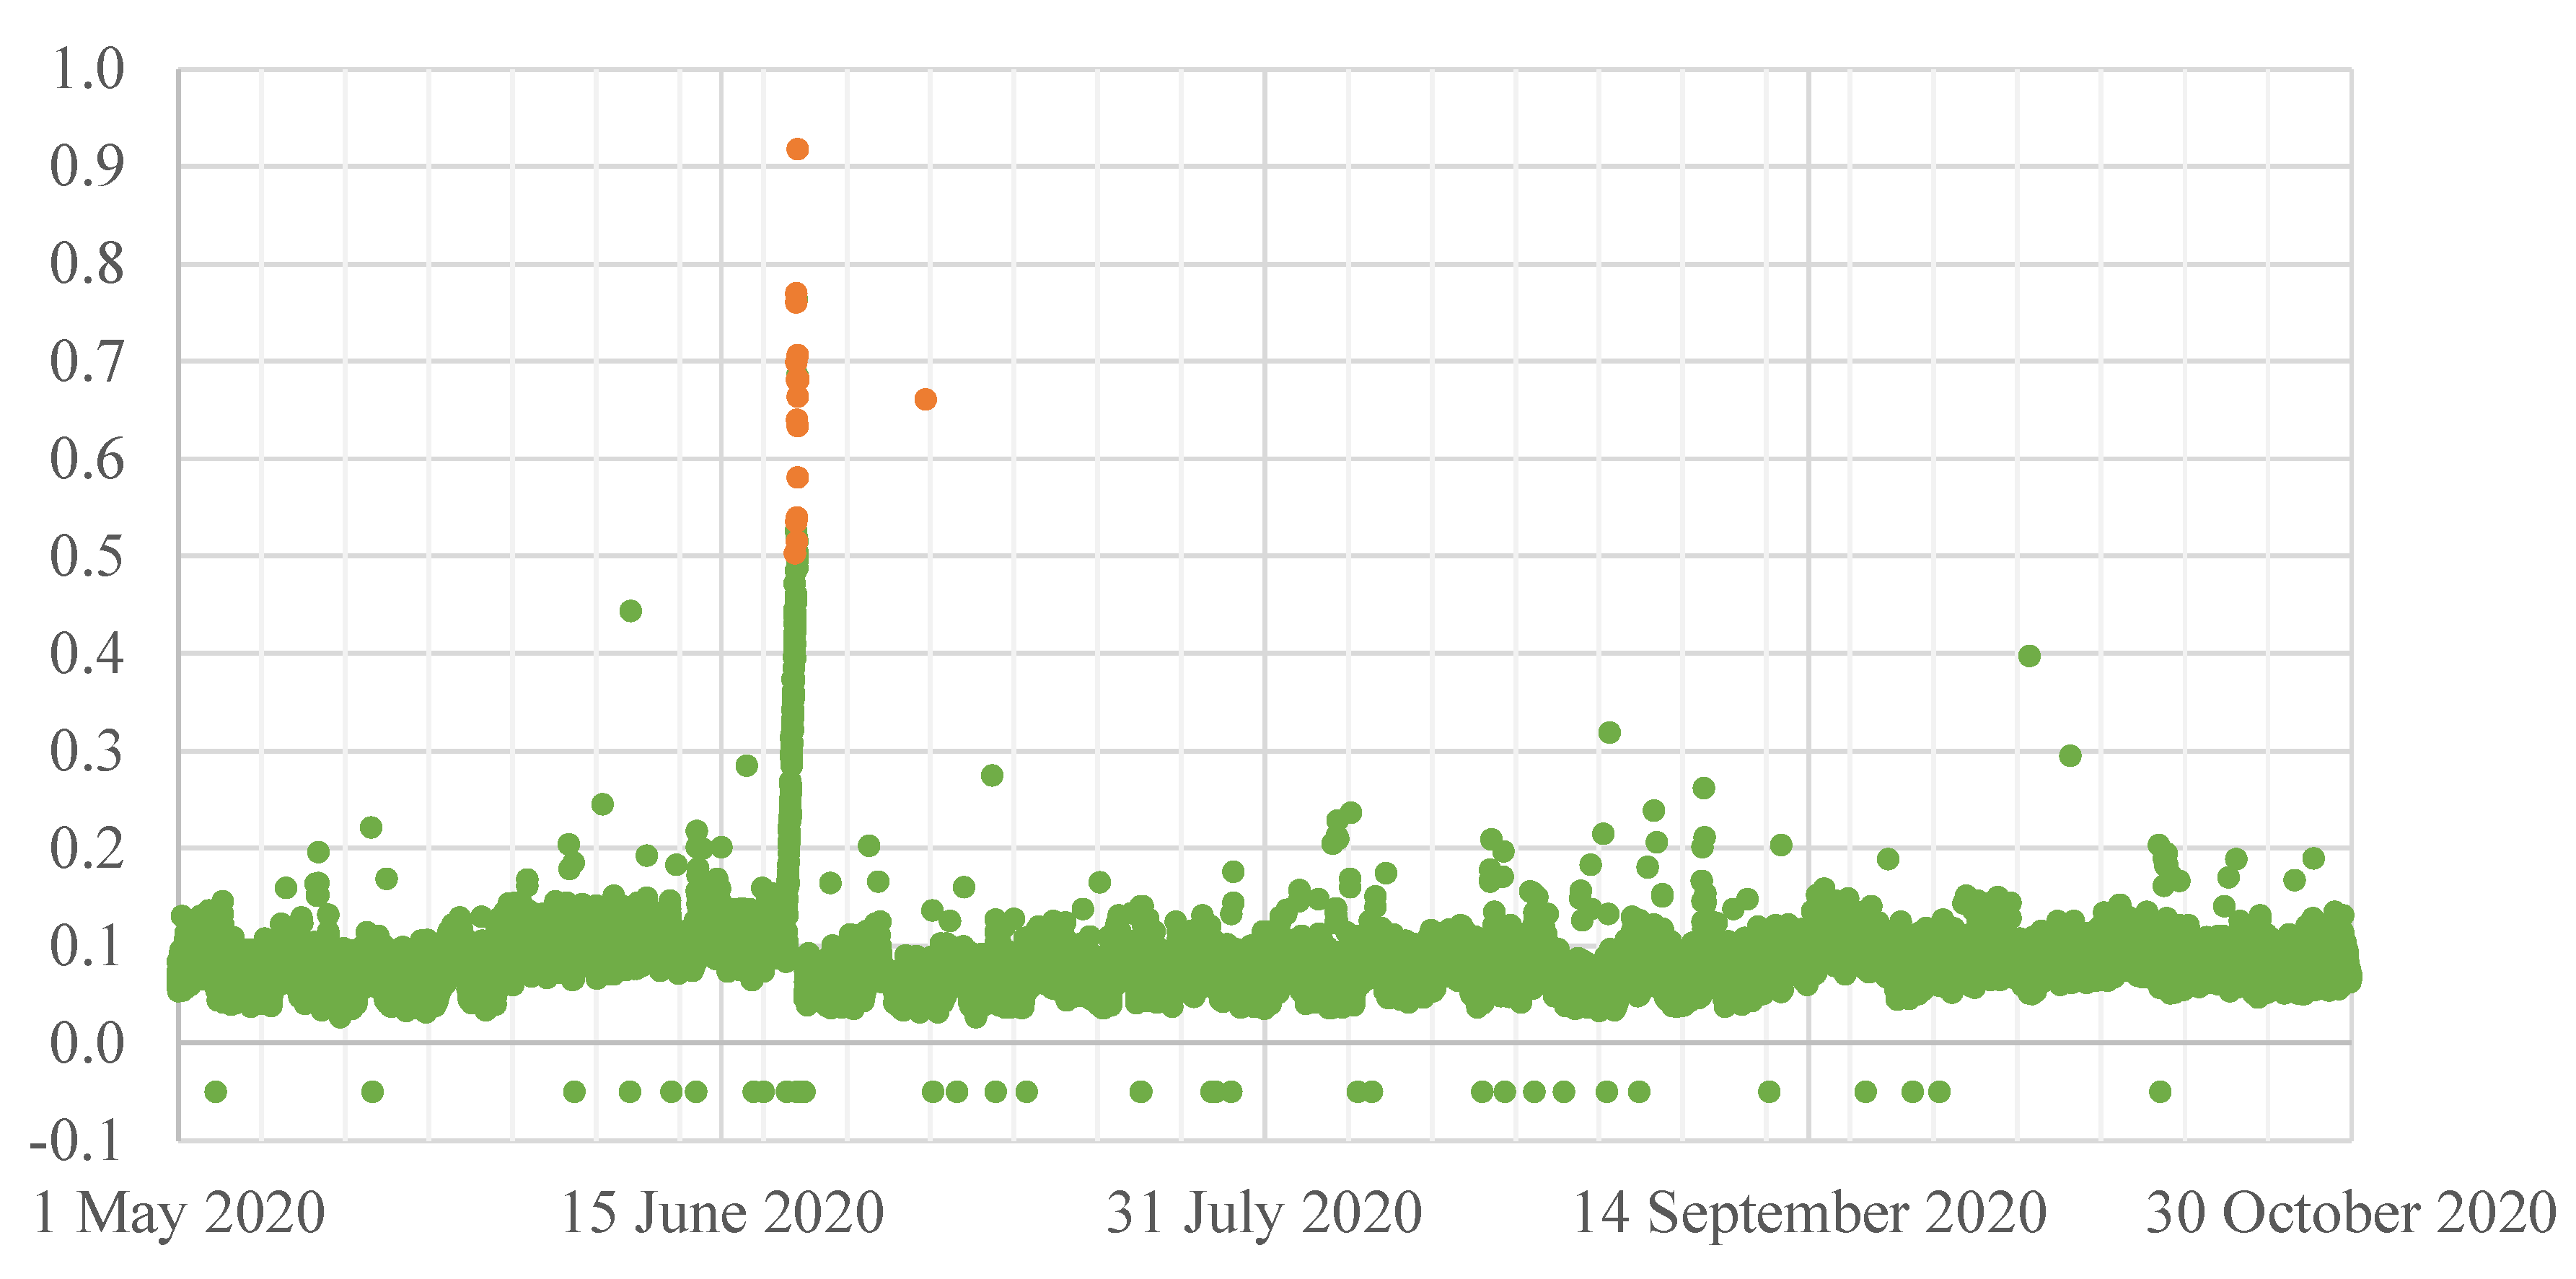
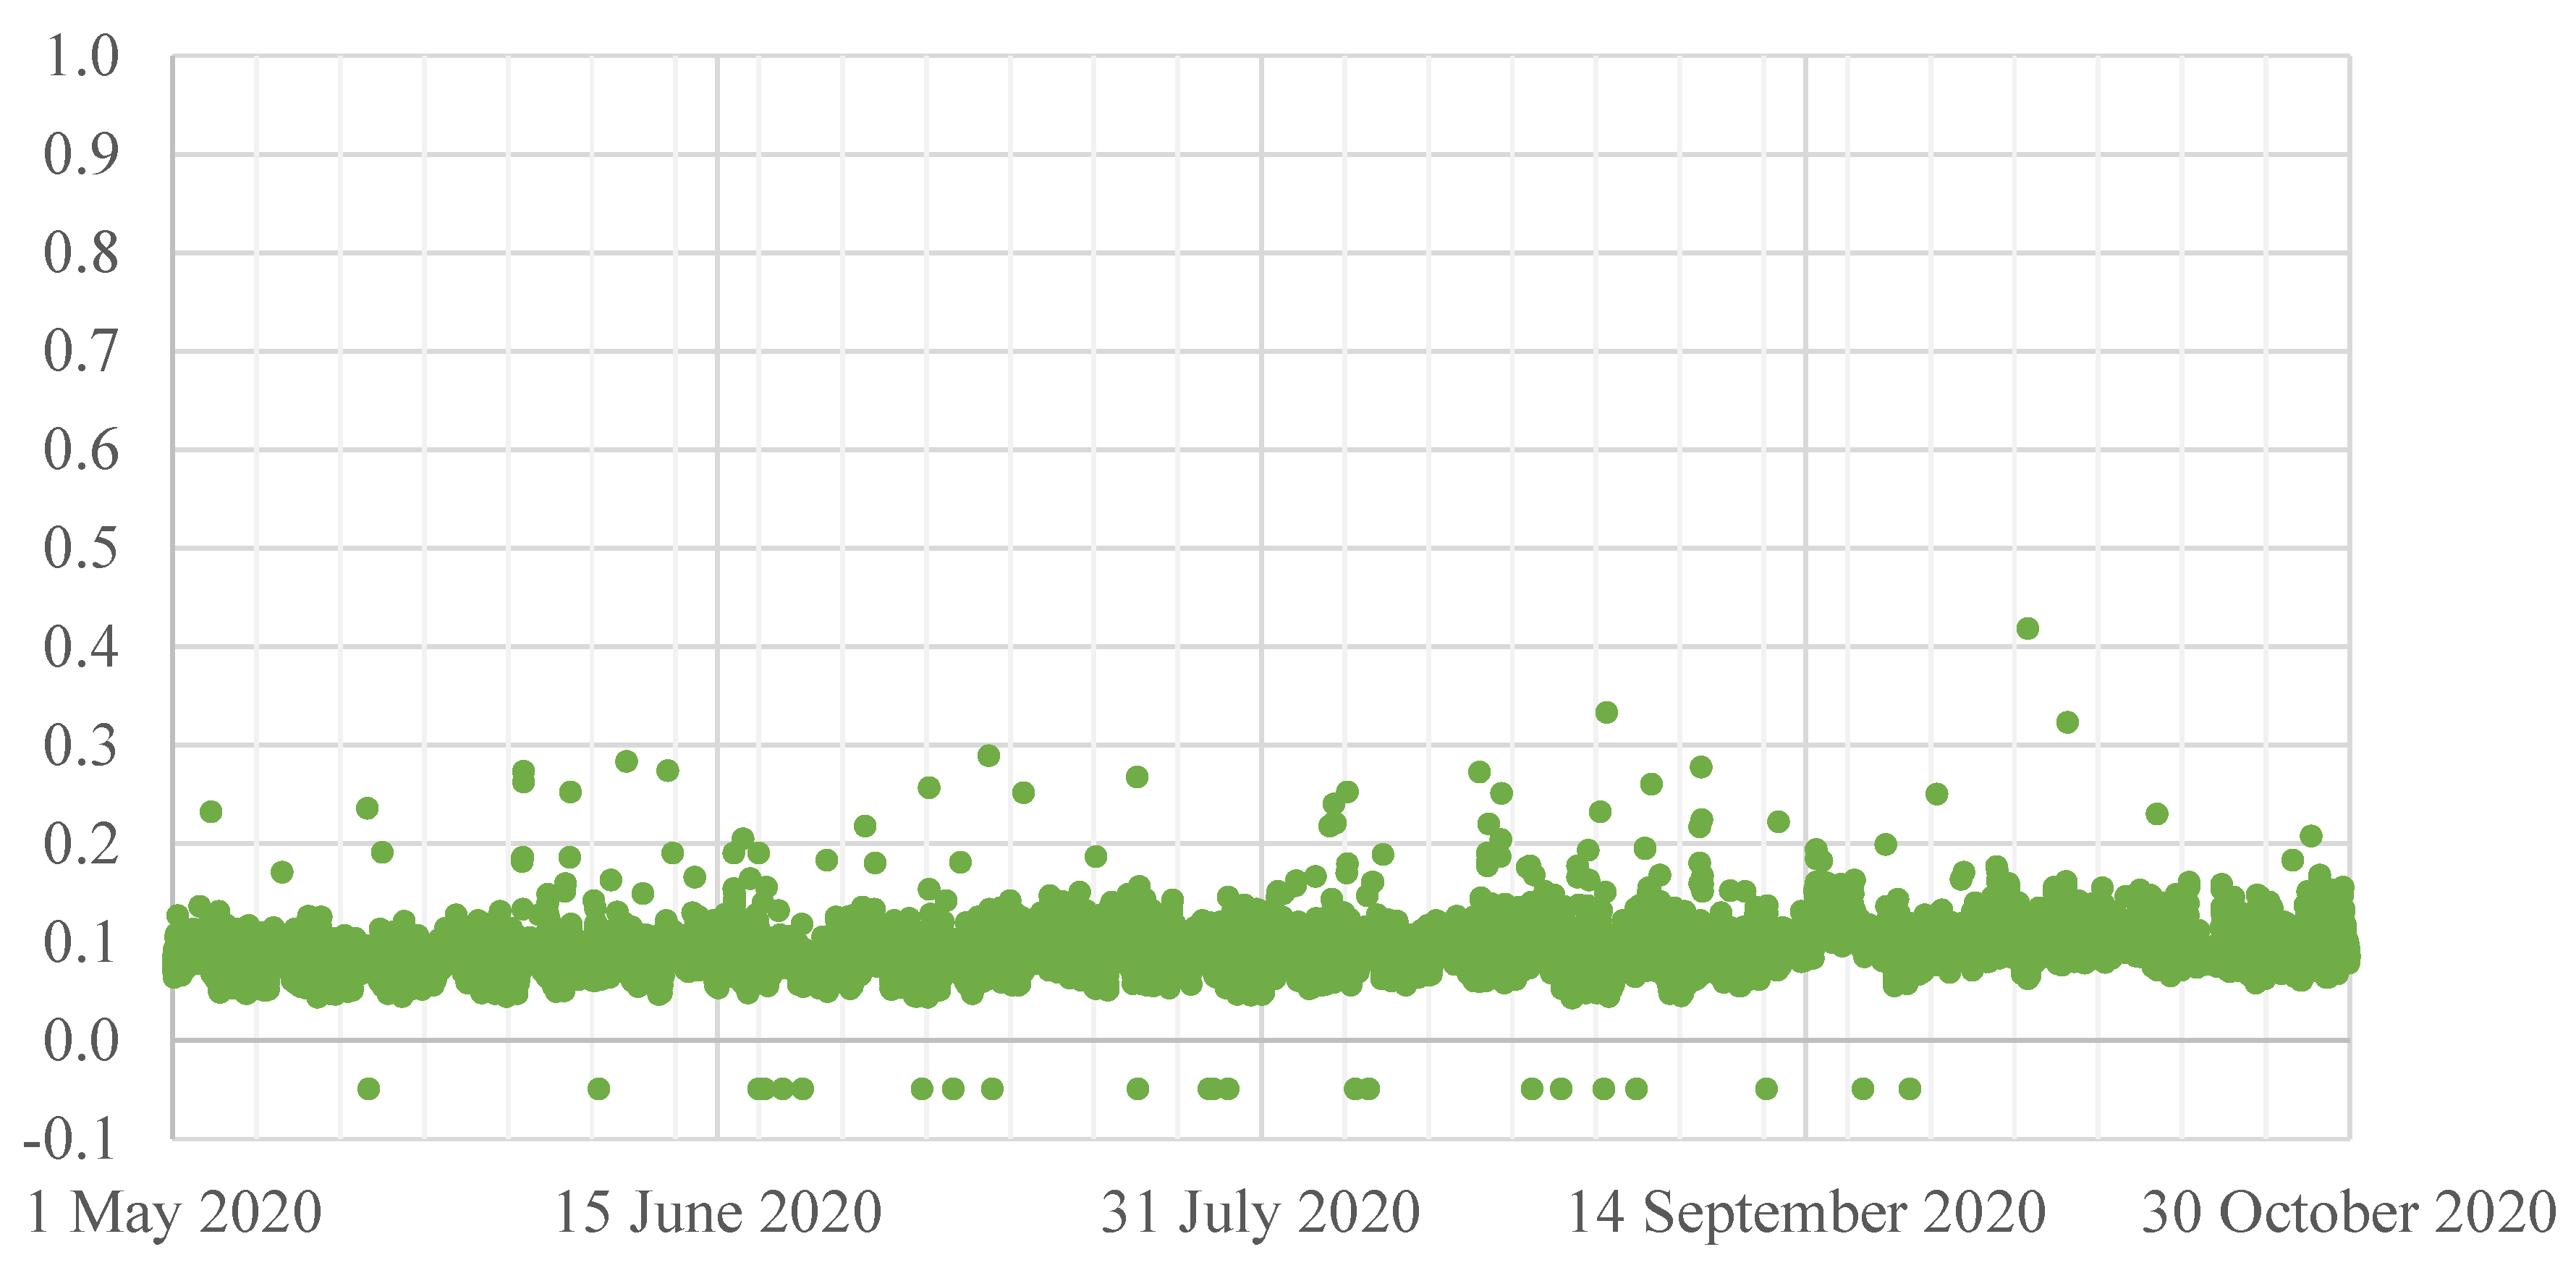
For such defined ADI, the assessment of PQ level was conducted for all four measurement points (
Figure 2,
Figure 3,
Figure 4 and
Figure 5). Moreover, to enable easier analysis, green-yellow-red colors were included in the figures:
In the analysis, the time when voltage events occurred was excluded. The event data exclusion was based on the flagging concept of standard IEC 61000-4-30 [
118]. Flagged data are represented as “virtual” value of ADI equal to −0.05. A deeper consideration of these voltage events is presented in
Section 3.3. To summarize ADI levels for selected points in the selected 26 weeks of measurements,
Table 3 was prepared. The results indicated that the highest level of power quality level (the lowest ADI) was in the MV_Line and the lowest level of power quality (the highest ADI) in LV_L.
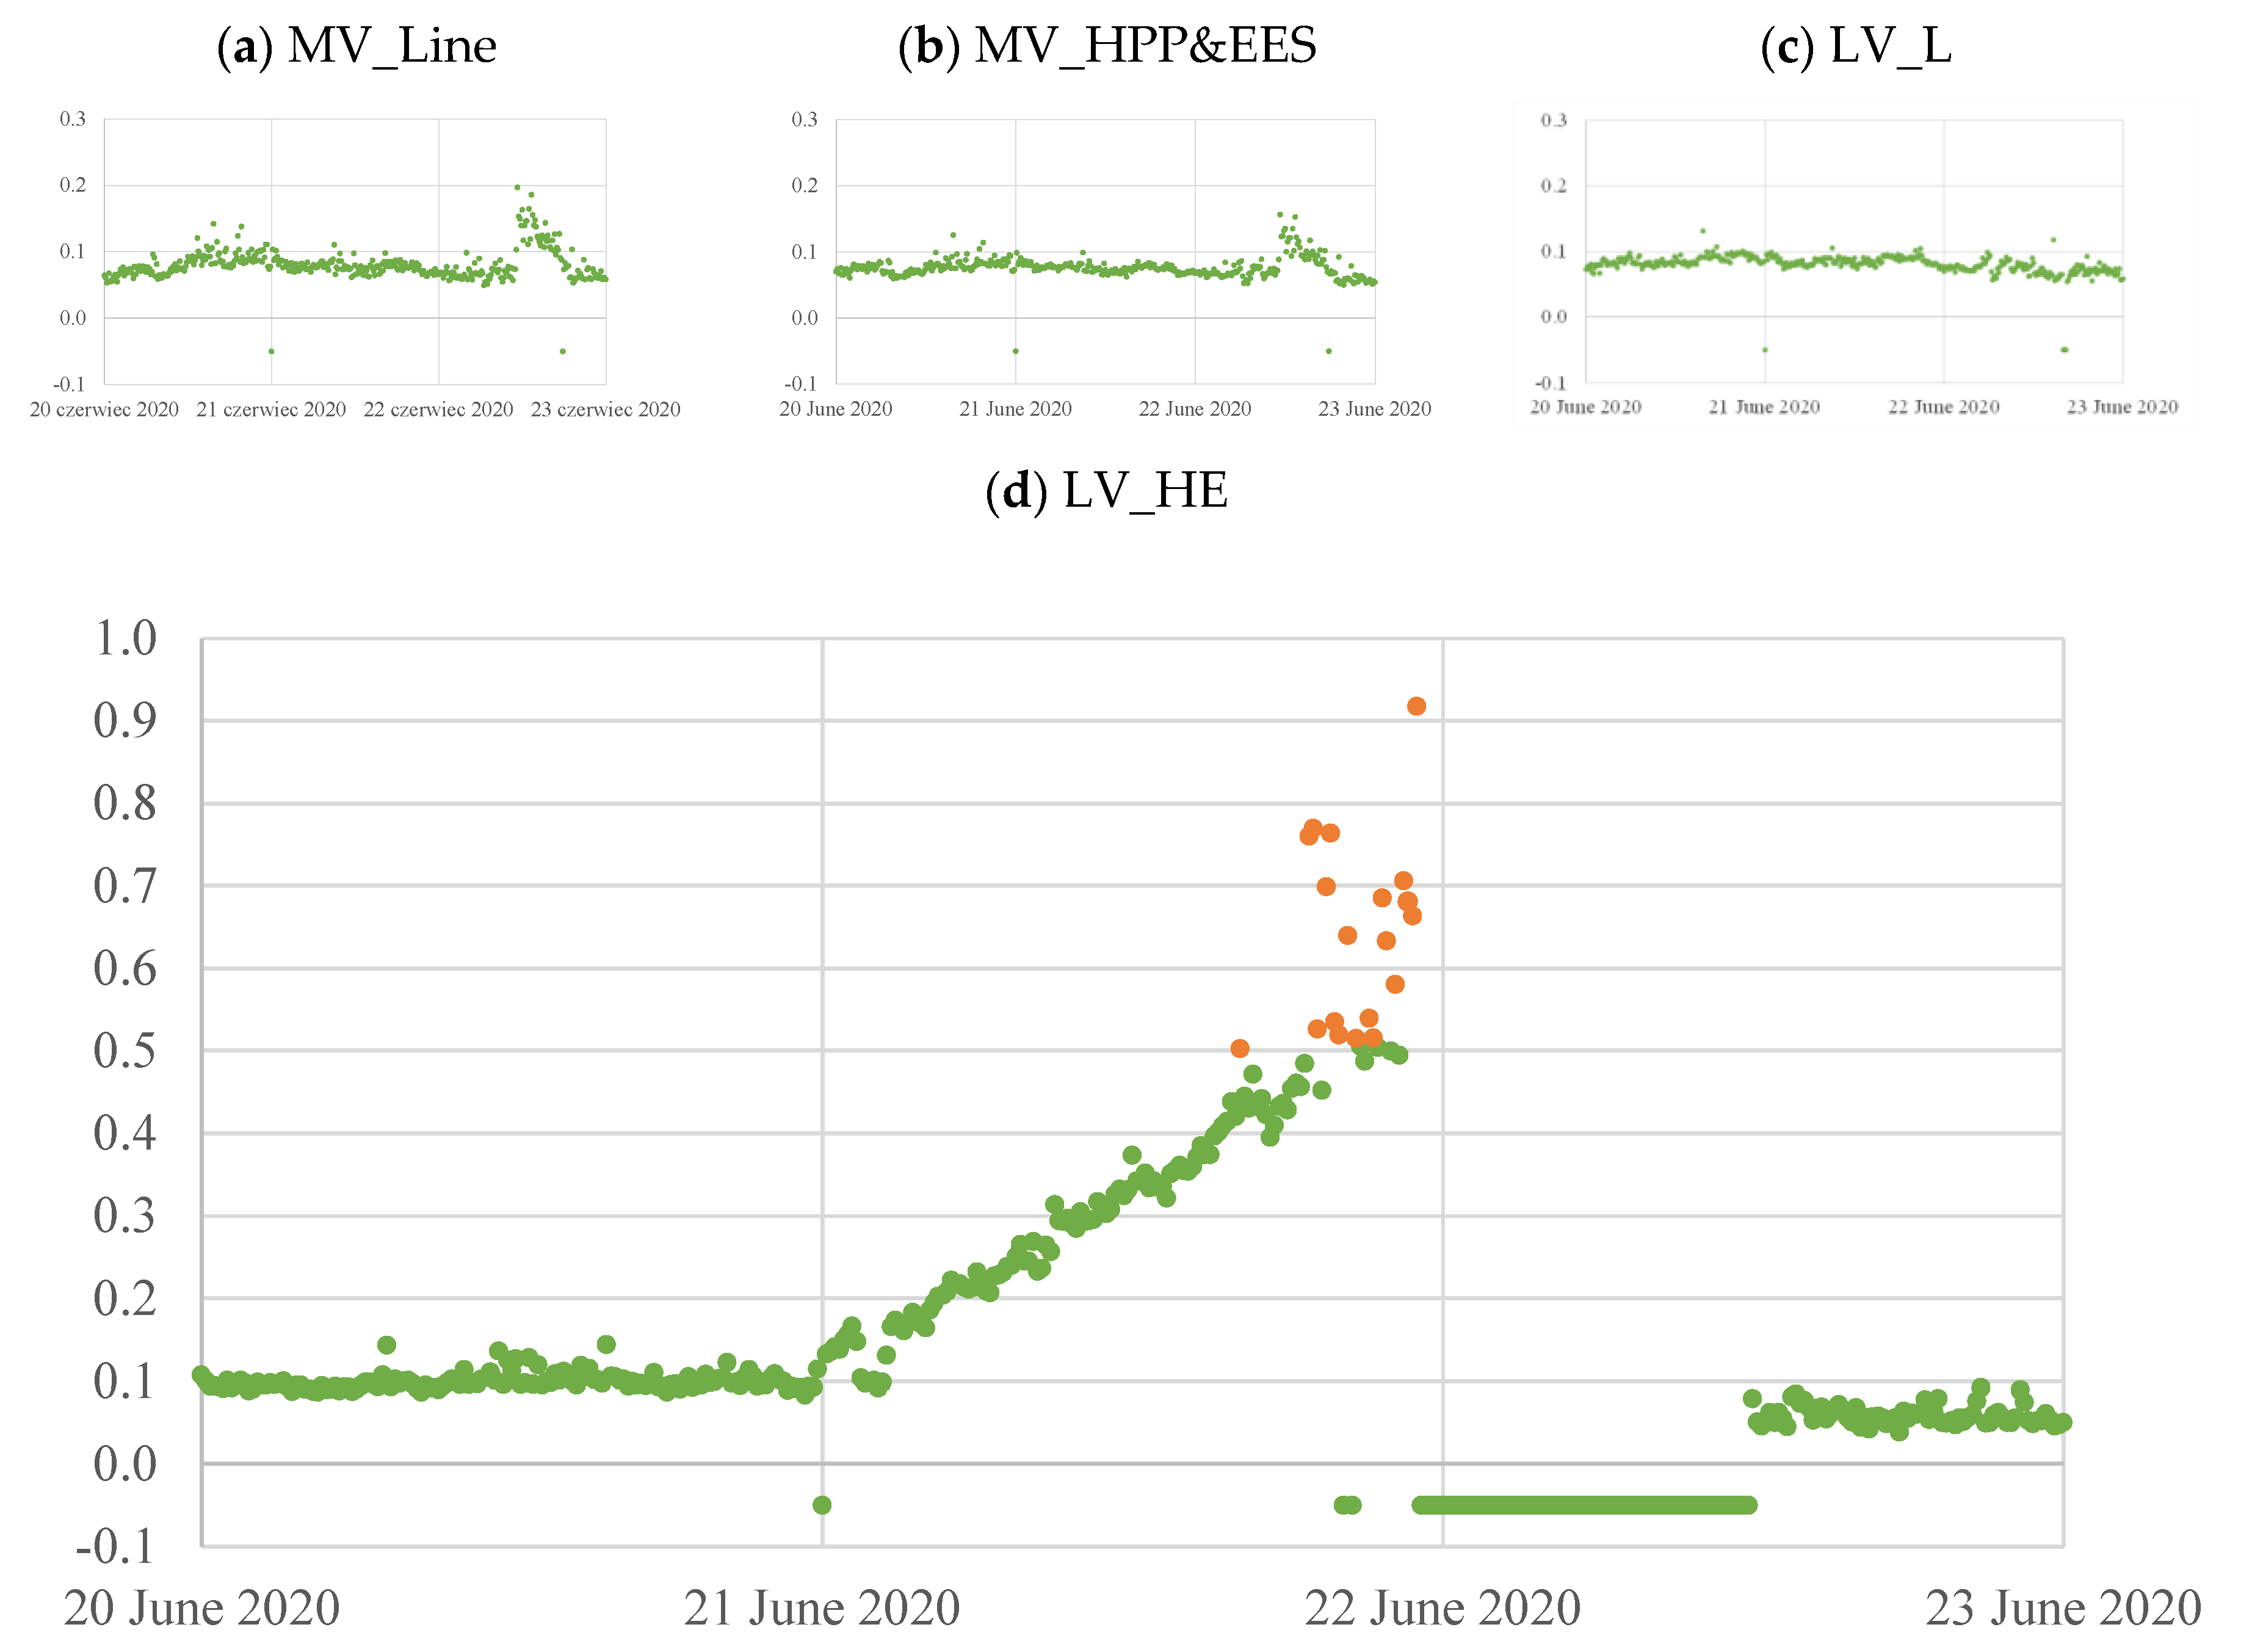
During the time domain change in ADI level in LV_HE, a specific period was selected. In long-term assessment, it is challenging to verify the phenomena of this working condition. Therefore, the time shortage to 4 days that were connected with this working condition is presented in
Figure 6. It can be observed that the PQ problem is noticed only in LV_HE, so this working condition is not connected with the impact of VPP. However, it is worth noticing that after a continuous (even linear) increase in ADI, a long event time in the LV_HE measurement point was indicated. In this article, in depth analysis of the reason for this working condition is omitted but this is a very interesting topic for future research.
3.2. Indication of the VPP Different Working Conditions
Based on information about HPP and EES possible operation indicated in
Section 2.3, the investigated VPP working conditions are as follows:
“0”—HPP is not working and ESS is not working;
“1”—HPP is working partially and ESS is not working;
“2”—HPP is working at maximal power and ESS is not working;
“3”—HPP is not working and ESS is discharging at low power;
“4”—HPP is working partially and ESS is discharging at low power;
“5”—HPP is working at maximal power and ESS is discharging at low power;
“6”—HPP is not working and ESS is discharging at high power;
“7”—HPP is working partially and ESS is discharging at high power;
“8”—HPP is working at maximal power and ESS is discharging at high power;
“9”—HPP is not working and ESS is charging at low power;
“10”—HPP is working partially and ESS is charging at low power;
“11”—HPP is working at maximal power and ESS is charging at low power;
“12”—HPP is not working and ESS is charging at high power;
“13”—HPP is working partially and ESS is charging at high power;
“14”—HPP is working at maximal power and ESS is charging at high power.
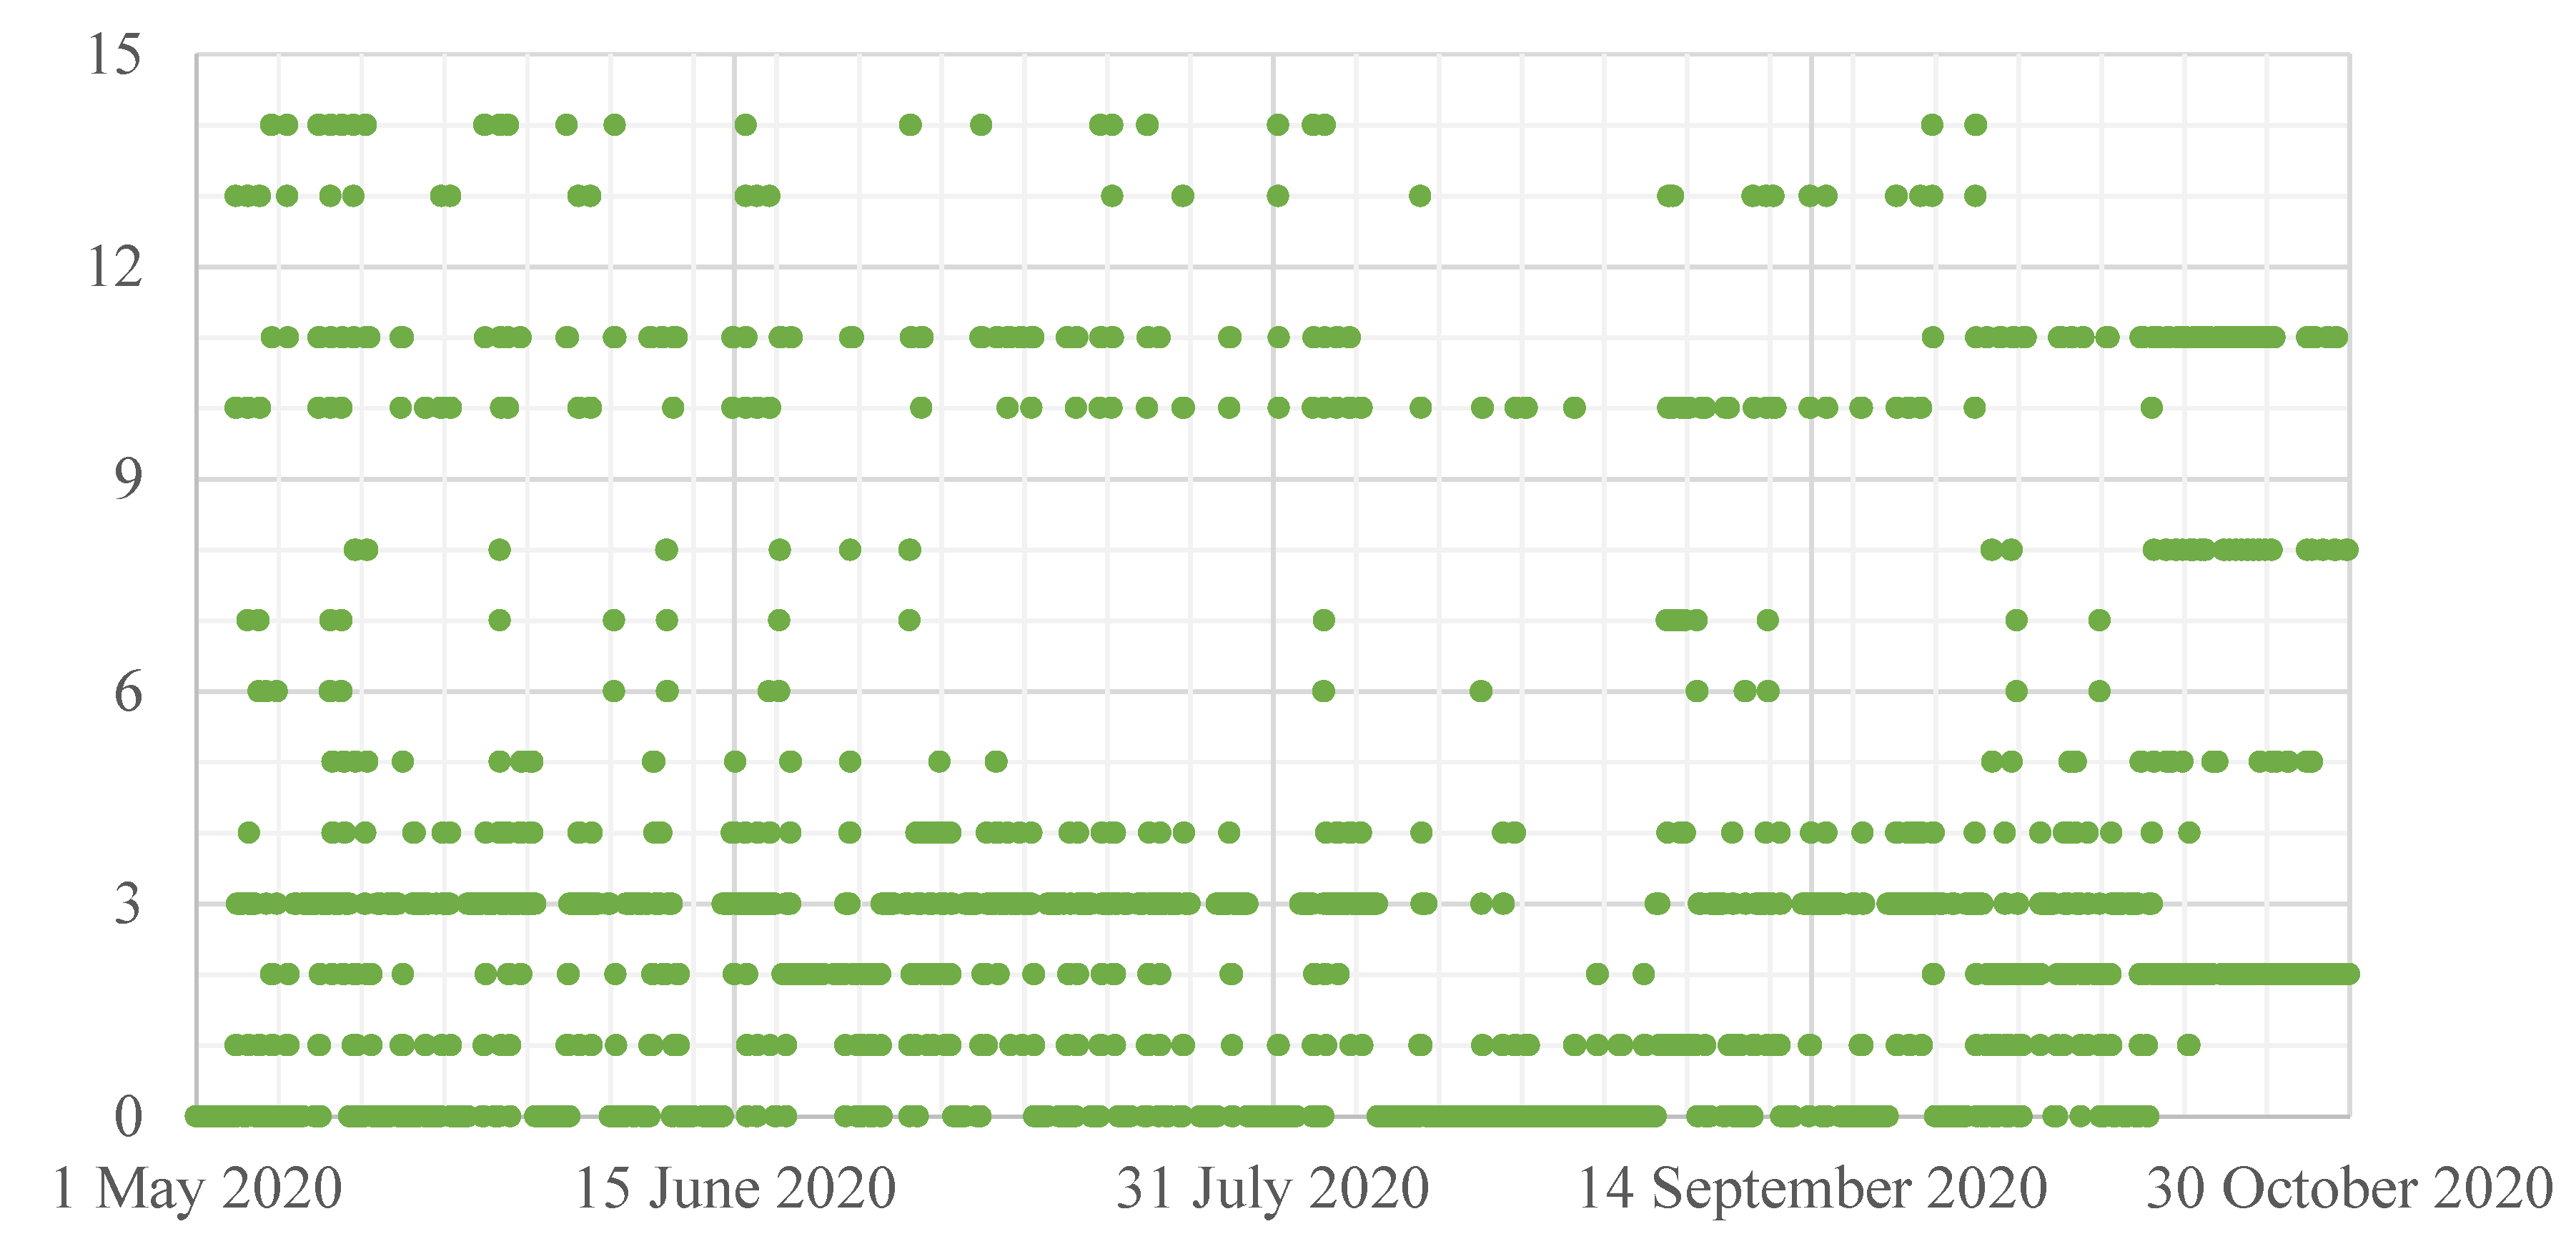
Initially, it was determined how long a given state of work occurred. The analyzed period of time was 182 days (26 weeks). Time aggregation of power quality data is 10 min, so the selected period is represented by 26,208 10-min data. However, due to the data coverage based on real measurements, synchronized 10-min data obtained from all points obtained were 25,069. Therefore, data coverage is 97.7%.
Detailed information on the number of 10-min data assigned to the working conditions is included in
Table 4.
Figure 7 also presents the occurrence of working conditions in the analyzed time period. It is worth noting that the state of operation 9 (HPP is not working and EES is charging at low power) and 12 (HPP is not working and EES is charging at low power) does not occur during measurements. This is because these working conditions were not permitted during the planning of the VPP. It also can be observed that the most common working conditions were “0” (HPP is not working and ESS is not working), “3” (HPP is not working and ESS is discharging at low power), and “2” (HPP is working at maximal power and ESS is not working).
3.3. Events Analysis as an Introduction to Area-Related Approach
In this section, the analysis of events occurring is performed. Generally, this is not a strict event analysis such as defining the type of event. The main aim of this subsection is to analyze how events impact the number of flagged data for both single- and multiple-point approaches. The flagging concept is introduced in standard IEC 61000-4-30 [
118]. It indicates that if an aggregated value contains the time when an event occurred, these aggregated data must be flagged. This ensures that this problem is not counted twice as an event and as an extension of other parameter values.
For analysis of the number of flagged data, the flagged data matrix is proposed in
Table 5. It presents the number of 10-min data that were flagged for single points and together on two measurement points. It can be observed that the highest number of flagged data was for the MV_Line and the lowest for the LV_L. It is also worth noticing that the majority of flagged data were common for MV_Line and MV_HPP&EES measurement points.
The next step was to check how many of these common flagged data were indicated in more than two points. The results of this investigation are presented in
Table 6. The results indicated that the general number of flagged data that are common for all measurement points is equal to 9.
The additional investigation included the concept of flagging for all measurement points treated together (area-related approach). This approach is based on set theory. Each measurement point is a single set of flagged data and the area-related value is a union of them all. Generally, the flagging for the whole period for all measurement points together was connected with the flagging of 457 10-min data. Then, the distribution of different working conditions (defined in
Section 3.2) was realized. Presented in
Section 3.4 is a comparative assessment of VPP working conditions. It is worth noticing that, due to the flagging concept, around 1.7% of data were excluded from the comparative assessment. Detailed results are presented in
Table 7.
3.4. Assessment of Different Working Conditions of VPP in Area-Related Approach
The next element of this research was the application of ADI to describe the working conditions of VPP indicated in
Section 3.2. The analysis of ADI was realized separately for each of the four measurement points. The results are presented in
Table 8. The assessment of the impact of individual working conditions of VPP (0–14) was related to the situation when both HPP and the associated EES are not working (working condition 0). Green was used to indicate conditions that are more positive in terms of quality in all measurement points, i.e., lower level of VPP. Additionally, a light green and light red color were introduced to compare the assessment of the ADI of individual measurement points. Light green was used for more favorable conditions and light red was used for worse conditions. The results indicated that working conditions 1, 3, 5, 6, 7, 10, 11, 13, 14 are more positive in terms of power quality than when working condition 0 occurs.
However, analysis of the number of data that represent each working condition indicated that some of them occur for a short period of time. Therefore, the next element of the research was to make a connection between them to obtain more numerous working conditions. Thus, the first connection was made for both conditions of HPP working (HPP is working partially and HPP is working at maximal power). Both were connected as a working condition, “HPP working”. Moreover, working conditions that do not occur (9 and 12) are omitted. Therefore, the newly proposed working conditions are as follows:
“20”—HPP is not working and ESS is not working;
“21”—HPP is working and ESS is not working;
“22”—HPP is not working and ESS is discharging at low power;
“23”—HPP is working and ESS is discharging at low power;
“24”—HPP is not working and ESS is discharging at high power;
“25”—HPP is working and ESS is discharging at high power;
“26”—HPP is working and ESS is charging at low power;
“27”—HPP is working and ESS is charging at high power.
Then, the ADI level for these working conditions is presented in
Table 9. Moreover, green/light green/light red colors are used. The results indicated that working conditions 24 and 27 are more positive in terms of power quality than when working condition 0 occurs.
Then, the next connections were made to obtain more numerous working conditions. This time, connection was made for the ESS at low power and a high-power charging/discharging, which is a new working condition that refers only to EES charging/discharging. Thus, the newly proposed working conditions are as follows:
“30”—HPP is not working and ESS is not working;
“31”—HPP is working and ESS is not working;
“32”—HPP is not working and ESS is discharging;
“33”—HPP is working and ESS is discharging;
“34”—HPP is not working and ESS is discharging.
Then, the ADI level for these working conditions is presented in
Table 10. Moreover, green/light green/light red colors are used. Finally, as a step in the area-related analysis of the investigated part of VPP, one value for all measurement points together was calculated. The value of the global index ADI for the common approach was calculated as a mean value of each measurement point. The results for single points indicated that working condition 30 is more positive in terms of power quality than when working condition 0 occurs. The results of this area-related approach indicate that, generally, there is no negative impact of the different working conditions of HPP and EES in long-term assessment (equal or lower value of ADI).
Finally, the investigated working conditions were reduced only to two cases:
The results are presented in
Table 11. Therefore, the final statement is that VPP in long-term assessment has a positive impact on power quality assessment.
4. Discussion
This article presents a case study analyzing a real VPP that operates in Poland. The investigated VPP consists of a fragment of both low-voltage (LV) and medium-voltage (MV) distribution network. Under investigation are the PQ measurements from five (four after reduction) different PQ recorders. The investigation is concerned with both MV and LV points. The duration of the measurements was 26 weeks (from 1 May 2020 to 28 October 2020).
The first element was an application of the global index ADI [
86,
87]. This index was successfully applied for the assessment of the multipoint measurement of the mining industry. Therefore, the authors also decided to apply this concept to the VPP. However, during the investigation, the frequency as a part of the global index was omitted because the VPP, even in maximum operational limits, has a negligible impact on frequency. The standard used to apply limits to the global value was EN 50160 [
121]. The results indicated that the highest level of power quality (the lowest ADI) was in the associated MV line (MV_Line) and the lowest level of power quality (the highest ADI) in the LV measurement point that is associated with the MV line (LV_L).
During analysis of the changeability of the ADI, specific time periods of LV_HP were denoted. However, an analysis of only the global value enables us to conclude that the reason for such a situation is impossible. Thus, using one global index as a first stage to denote specific working conditions seems interesting. However, after indicating them, a deeper multiparameter assessment is still needed.
As the results concern long-term data, different working conditions occurred. In the first section of the article, the diverse technique was realized in the point of HPP and EES working. Therefore, fifteen different working conditions were indicated. Then, the assessment of PQ for each measurement point using ADI was realized. For the majority of cases, the positive impact of PQ was observed when VPP operated (working conditions 1, 3, 5, 6, 7, 10, 11, 13, 14 in comparison to 0). However, the majority of these working conditions were represented by a short period of time. Therefore, additional agglomeration of working conditions in terms of HPP and EES was realized. The final stage of agglomeration was when only two states occurred, which were when VPP is working and VPP is not working. Additionally, to compare this, the area-related value was calculated. This value was obtained as a mean value of ADI from all measurement points. The conclusion in the long-term approach indicated that the operation of VPP has a generally positive impact on power quality.
The authors are aware that analyzing a single-point assessment for single PQ parameters appears to be more valuable. However, for long-term assessment, this work is time-consuming. Moreover, the main purpose of the VPP is to obtain economic profits, and technical issues are often omitted. Therefore, the proposition of using the PQ global index seems interesting to extend the assessment of VPP in a long-term approach.
5. Conclusions
This article proposes the application of a global index to power quality issues in a virtual power plant. The proposed solution enables simplification of the assessment from many classical power quality parameters to one global value for each measurement point. However, on the other hand, including extremum 200-millisecond values of voltage and harmonics parameters is an extension of the classical approach. Thus, this approach simplifies the assessment and increases the range of used parameters during analysis.
The analysis of the global value changeability for long-term data was indicated as useful to the indication of specific conditions in terms of PQ. However, using this global value enables us to define the reason for this situation. However, it leads to the definition of the period of occurrence. Then, for this period, the classic multiparameter assessment may be realized to analyze the reasons.
This article also indicates the general impact of VPP working conditions on the PQ issue. Both single-point and area-related approaches were realized. The positive and negative results of both approaches were indicated. However, the most important conclusion is that, generally, VPP impact on the long-term performance of PQ issues was positive.
The future research directions are:
research into using the global index for the identification and then assessment of short/specific working conditions of the selected VPP unit;
applying data mining techniques to obtain less obvious relations that concern VPP operation and PQ level.
Author Contributions
Conceptualization, M.J. and T.S.; methodology, M.J. and T.S.; software, M.J. and T.S.; validation, D.K., J.R. and V.S.; formal analysis, M.J., T.S., D.K. and J.R.; investigation, M.J. and T.S.; resources, P.K. and P.J.; data curation, V.S. and J.S.; writing—original draft preparation M.J. and T.S.; writing—review and editing, D.K. and J.R.; visualization, D.K. and J.R.; supervision, T.S., J.R. and Z.L.; project administration, T.S. and P.J.; funding acquisition, T.S. and P.J. All authors have read and agreed to the published version of the manuscript.
Funding
This research was funded by the National Center of Research and Development in Poland, the project “Developing a platform for aggregating generation and regulatory potential of dispersed renewable energy sources, power retention devices and selected categories of controllable load” supported by European Union Operational Programme Smart Growth 2014–2020, Priority Axis I: Supporting R&D carried out by enterprises, Measure 1.2: Sectoral R&D Programmes, POIR.01.02.00-00-0221/16, performed by TAURON Ekoenergia Ltd.
Conflicts of Interest
The authors declare no conflict of interest.
References
- Justo, J.J. Intelligent Energy Management Strategy Considering Power Distribution Networks with Nanogrids, Microgrids, and VPP Concepts. In Handbook of Distributed Generation; Springer International Publishing: Cham, Switzerland, 2017; pp. 791–815. [Google Scholar]
- Yavuz, L.; Önen, A.; Muyeen, S.M.M.; Kamwa, I. Transformation of microgrid to virtual power plant—A comprehensive review. IET Gener. Transm. Distrib. 2019, 13, 1994–2005. [Google Scholar] [CrossRef]
- Jha, B.K.; Singh, A.; Kumar, A.; Misra, R.K.; Singh, D. Phase unbalance and PAR constrained optimal active and reactive power scheduling of Virtual Power Plants (VPPs). Int. J. Electr. Power Energy Syst. 2021, 125, 106443. [Google Scholar] [CrossRef]
- Sun, H.; Meng, J.; Peng, C. Coordinated Optimization Scheduling of Multi-region Virtual Power Plant With Wind-power/Photovoltaic/Hydropower/Carbon-capture Units. Dianwang Jishu/Power Syst. Technol. 2019, 43, 4040–4049. [Google Scholar] [CrossRef]
- Dong, J.; Zhou, B.; Liu, J.; Gao, H.; Shi, Y.; Liu, J.; Lu, L. Heat and power scheduling of a virtual power plant considering comfort level of customers. Dianli Jianshe/Electric Power Constr. 2019, 40, 19–26. [Google Scholar] [CrossRef]
- Cheng, J.; Xie, S.; Zhang, Y.; Wang, J.; Xiong, S. Optimization model of intelligent power consumption considering Compositive comfort within budget limitation. Dianli Jianshe/Electric Power Constr. 2020, 41, 88–96. [Google Scholar] [CrossRef]
- Qiu, J.; Meng, K.; Zheng, Y.; Dong, Z.Y. Optimal scheduling of distributed energy resources as a virtual power plant in a transactive energy framework. IET Gener. Transm. Distrib. 2017, 11, 3417–3427. [Google Scholar] [CrossRef]
- Jiao, F.; Deng, Y.; Li, D.; Wei, B.; Yue, C.; Cheng, M.; Zhang, Y.; Zhang, J. A self-scheduling strategy of virtual power plant with electric vehicles considering margin indexes. Arch. Electr. Eng. 2020, 69, 907–920. [Google Scholar] [CrossRef]
- Zamani, A.G.; Zakariazadeh, A.; Jadid, S.; Kazemi, A. Stochastic operational scheduling of distributed energy resources in a large scale virtual power plant. Int. J. Electr. Power Energy Syst. 2016, 82, 608–620. [Google Scholar] [CrossRef]
- Ju, L.; Tan, Z.; Yuan, J.; Tan, Q.; Li, H.; Dong, F. A bi-level stochastic scheduling optimization model for a virtual power plant connected to a wind–photovoltaic–energy storage system considering the uncertainty and demand response. Appl. Energy 2016, 171, 184–199. [Google Scholar] [CrossRef]
- Nosratabadi, S.M.; Hooshmand, R.-A.; Gholipour, E. Stochastic profit-based scheduling of industrial virtual power plant using the best demand response strategy. Appl. Energy 2016, 164, 590–606. [Google Scholar] [CrossRef]
- Vahedipour-Dahraie, M.; Rashidizade-Kermani, H.; Shafie-khah, M.; Catalao, J.P.S. Risk-Averse Optimal Energy and Reserve Scheduling for Virtual Power Plants Incorporating Demand Response Programs. IEEE Trans. Smart Grid 2020. [Google Scholar] [CrossRef]
- Unger, D.; Spitalny, L.; Myrzik, J.M.A. Voltage control by small hydro power plants integrated into a virtual power plant. In Proceedings of the 2012 IEEE Energytech, Cleveland, OH, USA, 29–31 May 2012; pp. 1–6. [Google Scholar] [CrossRef]
- Pavan Kumar, Y.V.; Bhimasingu, R. Improving power quality in microgrids using virtual motor-generator set based control scheme. In Proceedings of the IECON 2016—42nd Annual Conference of the IEEE Industrial Electronics Society, Florence, Italy, 23–26 October 2016; pp. 7173–7178. [Google Scholar] [CrossRef]
- Moutis, P.; Georgilakis, P.S.; Hatziargyriou, N.D. Voltage Regulation Support Along a Distribution Line by a Virtual Power Plant Based on a Center of Mass Load Modeling. IEEE Trans. Smart Grid 2018, 9, 3029–3038. [Google Scholar] [CrossRef]
- Dall’Anese, E.; Guggilam, S.S.; Simonetto, A.; Chen, Y.C.; Dhople, S.V. Optimal Regulation of Virtual Power Plants. IEEE Trans. Power Syst. 2018, 33, 1868–1881. [Google Scholar] [CrossRef]
- Paternina, J.L.; Contreras, L.; Trujillo, E.R. Study of voltage stability in a distribution network by integrating distributed energy resources into a virtual power plant. Contemp. Eng. Sci. 2017, 10, 1441–1455. [Google Scholar] [CrossRef]
- Ishihara, H.; Nada, K.; Tanaka, M.; Inoue, S.; Kuwata, A.; Takano, T. A Voltage Control Method for Power Distribution Lines Utilizing Dispersed Customer Resources. In Proceedings of the 2020 22nd European Conference on Power Electronics and Applications (EPE’20 ECCE Europe), Lyon, France, 7–11 September 2020; IEEE: New York, NY, USA, 2020; pp. 1–8. [Google Scholar]
- Haque, M.M.; Wolfs, P.; Alahakoon, S. Active Power Flow Control of Three-Port Converter for Virtual Power Plant Applications. In Proceedings of the 2020 IEEE International Conference on Power Electronics, Smart Grid and Renewable Energy (PESGRE2020), Kerala, India, 2–4 January 2020; IEEE: New York, NY, USA, 2020; pp. 1–6. [Google Scholar]
- Pudjianto, D.; Djapic, P.; Strbac, G.; Stojkovska, B.; Ahmadi, A.R.; Martinez, I. Integration of distributed reactive power sources through Virtual Power Plant to provide voltage control to transmission network. In Proceedings of the CIRED 2019 Conference, Madrid, Spain, 3–6 June 2019; AIM: Madrid, Spain, 2019. [Google Scholar]
- Konara, K.M.S.Y.; Kolhe, M.; Sharma, A. Power flow management controller within a grid connected photovoltaic based active generator as a finite state machine using hierarchical approach with droop characteristics. Renew. Energy 2020, 155, 1021–1031. [Google Scholar] [CrossRef]
- Guerra, G.; Martinez Velasco, J.A. A virtual power plant model for time-driven power flow calculations. AIMS Energy 2017, 5, 887–911. [Google Scholar] [CrossRef]
- Sosnina, E.; Chivenkov, A.; Shalukho, A.; Shumskii, N. Power flow control in a Virtual Power Plant LV network. Int. J. Renew. Energy Res. 2018, 8, 328–335. [Google Scholar]
- Kaczorowska, D.; Rezmer, J.; Sikorski, T.; Janik, P. Application of PSO algorithms for VPP operation optimization. Renew. Energy Power Qual. J. 2019, 17, 91–96. [Google Scholar] [CrossRef]
- Bilbao, J.; Bravo, E.; Rebollar, C.; Varela, C.; Garcia, O. Virtual Power Plants and Virtual Inertia. In Power Systems; Springer: Bilbao, Spain, 2020; pp. 87–113. ISBN 16121287. [Google Scholar]
- Yang, J.; Huang, Y.; Wang, H.; Ji, Y.; Li, J.; Gao, C. A regulation strategy for virtual power plant. In Proceedings of the 2017 4th International Conference System Informatics (ICSAI 2017), Hangzhou, China, 11–13 November 2017; pp. 375–379. [Google Scholar] [CrossRef]
- Ali, J.; Silvestro, F. Conventional Power Plants to TSO Frequency Containment Reserves—A Competitive Analysis for Virtual Power Plant’s Role. In Proceedings of the 2019 IEEE 5th International forum on Research and Technology for Society and Industry (RTSI), Firenze, Italy, 9–16 September 2019; IEEE: New York, NY, USA, 2019; pp. 6–11. [Google Scholar]
- Dey, P.P.; Das, D.C.; Latif, A.; Hussain, S.M.S.; Ustun, T.S. Active Power Management of Virtual Power Plant under Penetration of Central Receiver Solar Thermal-Wind Using Butterfly Optimization Technique. Sustainability 2020, 12, 6979. [Google Scholar] [CrossRef]
- Kim, J.; Muljadi, E.; Gevorgian, V.; Mohanpurkar, M.; Luo, Y.; Hovsapian, R.; Koritarov, V. Capability-coordinated frequency control scheme of a virtual power plant with renewable energy sources. IET Gener. Transm. Distrib. 2019, 13, 3642–3648. [Google Scholar] [CrossRef]
- Zhong, W.; Murad, M.A.A.; Liu, M.; Milano, F. Impact of Virtual Power Plants on Power System Short-Term Transient Response. Electr. Power Syst. Res. 2020, 189, 106609. [Google Scholar] [CrossRef]
- Alhelou, H.H.; Siano, P.; Tipaldi, M.; Iervolino, R.; Mahfoud, F. Primary Frequency Response Improvement in Interconnected Power Systems Using Electric Vehicle Virtual Power Plants. World Electr. Veh. J. 2020, 11, 40. [Google Scholar] [CrossRef]
- Han, N.; Wang, X.; Chen, S.; Cheng, L.; Liu, H.; Liu, Z.; Mao, Y. Optimal Configuration of Energy Storage Systems in Virtual Power. IOP Conf. Ser. Earth Environ. Sci. 2019, 295, 042072. [Google Scholar] [CrossRef]
- Michiorri, A.; Lugaro, J.; Siebert, N.; Girard, R.; Kariniotakis, G. Storage sizing for grid connected hybrid wind and storage power plants taking into account forecast errors autocorrelation. Renew. Energy 2018, 117, 380–392. [Google Scholar] [CrossRef]
- Stuhlenmiller, T.; Koenigsdorff, R. Optimum thermal storage sizing in building services engineering as a contribution to virtual power plants. J. Build. Perform. Simul. 2010, 3, 17–31. [Google Scholar] [CrossRef]
- Sadeghian, O.; Oshnoei, A.; Khezri, R.; Muyeen, S. Risk-constrained stochastic optimal allocation of energy storage system in virtual power plants. J. Energy Storage 2020, 31, 101732. [Google Scholar] [CrossRef]
- Kim, S.; Kwon, W.-H.; Kim, H.-J.; Jung, K.; Kim, G.S.; Shim, T.; Lee, D. Offer Curve Generation for the Energy Storage System as a Member of the Virtual Power Plant in the Day-Ahead Market. J. Electr. Eng. Technol. 2019, 14, 2277–2287. [Google Scholar] [CrossRef]
- Sun, J.; Li, X.; Ma, H. Study on Optimal Capacity of Multi-type Energy Storage System for Optimized Operation of Virtual Power Plants. In Proceedings of the 2018 China International Conference on Electricity Distribution (CICED), Tianjin, China, 17–19 September 2018; IEEE: New York, NY, USA, 2018; pp. 2989–2993. [Google Scholar]
- Heimgaertner, F.; Ziegler, U.; Thomas, B.; Menth, M. A Distributed Control Architecture for a Loosely Coupled Virtual Power Plant. In Proceedings of the 2018 IEEE International Conference on Engineering, Technology and Innovation (ICE/ITMC), Stuttgart, Germany, 17–20 June 2018; IEEE: New York, NY, USA, 2018; pp. 1–9. [Google Scholar]
- Candra, D.; Hartmann, K.; Nelles, M. Economic Optimal Implementation of Virtual Power Plants in the German Power Market. Energies 2018, 11, 2365. [Google Scholar] [CrossRef]
- Moreno, B.; Díaz, G. The impact of virtual power plant technology composition on wholesale electricity prices: A comparative study of some European Union electricity markets. Renew. Sustain. Energy Rev. 2019, 99, 100–108. [Google Scholar] [CrossRef]
- Sikorski, T.; Jasiński, M.; Ropuszyńska-Surma, E.; Węglarz, M.; Kaczorowska, D.; Kostyła, P.; Leonowicz, Z.; Lis, R.; Rezmer, J.; Rojewski, W.; et al. A Case Study on Distributed Energy Resources and Energy-Storage Systems in a Virtual Power Plant Concept: Economic Aspects. Energies 2019, 12, 4447. [Google Scholar] [CrossRef]
- Loßner, M.; Böttger, D.; Bruckner, T. Economic assessment of virtual power plants in the German energy market—A scenario-based and model-supported analysis. Energy Econ. 2017, 62, 125–138. [Google Scholar] [CrossRef]
- Khorasany, M.; Raoofat, M. Bidding strategy for participation of virtual power plant in energy market considering uncertainty of generation and market price. In Proceedings of the 2017 Smart Grid Conference (SGC), Tehran, Iran, 20–21 December 2017; IEEE: New York, NY, USA, 2017; pp. 1–6. [Google Scholar]
- Mohy-ud-din, G.; Muttaqi, K.M.; Sutanto, D. Transactive energy-based planning framework for VPPs in a co-optimised day-ahead and real-time energy market with ancillary services. IET Gener. Transm. Distrib. 2019, 13, 2024–2035. [Google Scholar] [CrossRef]
- Shafiekhani, M.; Badri, A.; Shafie-khah, M.; Catalão, J.P.S. Strategic bidding of virtual power plant in energy markets: A bi-level multi-objective approach. Int. J. Electr. Power Energy Syst. 2019, 113, 208–219. [Google Scholar] [CrossRef]
- Foroughi, M.; Pasban, A.; Moeini-Aghtaie, M.; Fayaz-Heidari, A. A bi-level model for optimal bidding of a multi-carrier technical virtual power plant in energy markets. Int. J. Electr. Power Energy Syst. 2021, 125, 106397. [Google Scholar] [CrossRef]
- Zhou, Y.; Wei, Z.; Sun, G.; Cheung, K.W.; Zang, H.; Chen, S. Four-level robust model for a virtual power plant in energy and reserve markets. IET Gener. Transm. Distrib. 2019, 13, 2036–2043. [Google Scholar] [CrossRef]
- Al-Awami, A.T.; Amleh, N.A.; Muqbel, A.M. Optimal Demand Response Bidding and Pricing Mechanism with Fuzzy Optimization: Application for a Virtual Power Plant. IEEE Trans. Ind. Appl. 2017, 53, 5051–5061. [Google Scholar] [CrossRef]
- Yin, S.; Ai, Q.; Li, Z.; Zhang, Y.; Lu, T. Energy management for aggregate prosumers in a virtual power plant: A robust Stackelberg game approach. Int. J. Electr. Power Energy Syst. 2020, 117, 105605. [Google Scholar] [CrossRef]
- Ciupageanu, D.-A.; Barelli, L.; Ottaviano, A.; Pelosi, D.; Lazaroiu, G. Innovative power management of hybrid energy storage systems coupled to RES plants: The Simultaneous Perturbation Stochastic Approximation approach. In Proceedings of the 2019 IEEE PES Innovative Smart Grid Technologies Europe (ISGT-Europe), Bucharest, Romania, 29 September–2 October 2019; IEEE: New York, NY, USA, 2019; pp. 1–5. [Google Scholar]
- Rahimiyan, M.; Baringo, L. Real-time energy management of a smart virtual power plant. IET Gener. Transm. Distrib. 2019, 13, 2015–2023. [Google Scholar] [CrossRef]
- Othman, M.M.; Hegazy, Y.G.; Abdelaziz, A.Y. Electrical energy management in unbalanced distribution networks using virtual power plant concept. Electr. Power Syst. Res. 2017, 145, 157–165. [Google Scholar] [CrossRef]
- Mears, A.; Martin, J. Fully Flexible Loads in Distributed Energy Management: PV, Batteries, Loads, and Value Stacking in Virtual Power Plants. Engineering 2020, 6, 736–738. [Google Scholar] [CrossRef]
- Liu, T.; Zhang, J.; Li, S.; Yue, L.; Zhou, X. Home energy management method for realizing demand response based on virtual power plant platform. IOP Conf. Ser. Mater. Sci. Eng. 2020, 768, 052114. [Google Scholar] [CrossRef]
- Sheidaei, F.; Ahmarinejad, A. Multi-stage stochastic framework for energy management of virtual power plants considering electric vehicles and demand response programs. Int. J. Electr. Power Energy Syst. 2020, 120, 106047. [Google Scholar] [CrossRef]
- Maanavi, M.; Najafi, A.; Godina, R.; Mahmoudian, M.; Rodrigues, E.M.G. Energy Management of Virtual Power Plant Considering Distributed Generation Sizing and Pricing. Appl. Sci. 2019, 9, 2817. [Google Scholar] [CrossRef]
- Nosratabadi, S.M.; Hooshmand, R.-A. Stochastic electrical energy management of industrial Virtual Power Plant considering time-based and incentive-based Demand Response programs option in contingency condition. Int. J. Emerg. Electr. Power Syst. 2020, 21. [Google Scholar] [CrossRef]
- Shayegan Rad, A.; Badri, A.; Zangeneh, A.; Kaltschmitt, M. Risk-based optimal energy management of virtual power plant with uncertainties considering responsive loads. Int. J. Energy Res. 2019, 43, 2135–2150. [Google Scholar] [CrossRef]
- Gabderakhmanova, T.; Engelhardt, J.; Zepter, J.M.; Meier Sorensen, T.; Boesgaard, K.; Ipsen, H.H.; Marinelli, M. Demonstrations of DC Microgrid and Virtual Power Plant Technologies on the Danish Island of Bornholm. In Proceedings of the 2020 55th International Universities Power Engineering Conference (UPEC), Torino, Italy, 1–4 September 2020; IEEE: New York, NY, USA, 2020; pp. 1–6. [Google Scholar]
- Heimgaertner, F.; Schur, E.; Truckenmueller, F.; Menth, M. A Virtual Power Plant Demonstration Platform for Multiple Optimization and Control Systems. In Proceedings of the International ETG Congress 2017, Bonn, Germany, 28–29 November 2017; pp. 1–6. [Google Scholar]
- Van Summeren, L.F.M.; Wieczorek, A.J.; Bombaerts, G.J.T.; Verbong, G.P.J. Community energy meets smart grids: Reviewing goals, structure, and roles in Virtual Power Plants in Ireland, Belgium and the Netherlands. Energy Res. Soc. Sci. 2020, 63, 101415. [Google Scholar] [CrossRef]
- Nikolaou, T.; Stavrakakis, G.S.; Tsamoudalis, K. Modeling and Optimal Dimensioning of a Pumped Hydro Energy Storage System for the Exploitation of the Rejected Wind Energy in the Non-Interconnected Electrical Power System of the Crete Island, Greece. Energies 2020, 13, 2705. [Google Scholar] [CrossRef]
- Jenkins, A.M.; Patsios, C.; Taylor, P.; Khayrullina, A.; Chirkin, V. Optimising Virtual Power Plant Response to Grid Service Requests at Newcastle Science Central by Coordinating Multiple Flexible Assets. In Proceedings of the CIRED Workshop 2016, Helsinki, Finland, 14–15 June 2016; Institution of Engineering and Technology: London, UK, 2016; p. 212. [Google Scholar]
- Zhao, H.; Wang, B.; Pan, Z.; Sun, H.; Guo, Q.; Xue, Y. Aggregating Additional Flexibility from Quick-Start Devices for Multi-Energy Virtual Power Plants. IEEE Trans. Sustain. Energy 2020. [Google Scholar] [CrossRef]
- Jeon, W.; Cho, S.; Lee, S. Estimating the Impact of Electric Vehicle Demand Response Programs in a Grid with Varying Levels of Renewable Energy Sources: Time-of-Use Tariff versus Smart Charging. Energies 2020, 13, 4365. [Google Scholar] [CrossRef]
- Sharma, H.; Mishra, S. Techno-economic analysis of solar grid-based virtual power plant in Indian power sector: A case study. Int. Trans. Electr. Energy Syst. 2020, 30. [Google Scholar] [CrossRef]
- Behi, B.; Baniasadi, A.; Arefi, A.; Gorjy, A.; Jennings, P.; Pivrikas, A. Cost–Benefit Analysis of a Virtual Power Plant Including Solar PV, Flow Battery, Heat Pump, and Demand Management: A Western Australian Case Study. Energies 2020, 13, 2614. [Google Scholar] [CrossRef]
- Bolshev, V.; Vinogradov, A.; Jasinski, M.; Sikorski, T.; Leonowicz, Z.; Gono, R. Monitoring the Number and Duration of Power Outages and Voltage Deviations at Both Sides of Switching Devices. IEEE Access 2020, 8, 137174–137184. [Google Scholar] [CrossRef]
- Matthee, A.; Moonen, N.; Leferink, F. Versatile High-Sample Frequency Power Quality Measurement Device. In Proceedings of the 2020 IEEE International Symposium on Electromagnetic Compatibility & Signal/Power Integrity (EMCSI), Reno, NV, USA, 27–31 June 2020; IEEE: New York, NY, USA, 2020; pp. 213–215. [Google Scholar]
- Saravanakumar, T.; Sainarayanan, G.; Porkumaran, K. Design of a Cost Effective Optimized Power Factor Measurement Device for Nonlinear Single Phase Home Appliances. Res. J. Appl. Sci. Eng. Technol. 2015, 10, 454–463. [Google Scholar] [CrossRef]
- Vinogradov, A.; Bolshev, V.; Vinogradova, A.; Kudinova, T.; Borodin, M.; Selesneva, A.; Sorokin, N. A System for Monitoring the Number and Duration of Power Outages and Power Quality in 0.38 kV Electrical Networks BT—Intelligent Computing & Optimization. In Proceedings of the Intelligent Computing & Optimization, Pattaya, Thailand, 4–5 October 2018; Vasant, P., Zelinka, I., Weber, G.-W., Eds.; Springer International Publishing: Cham, Switzerland, 2019; pp. 1–10. [Google Scholar]
- Chintakindi, R.; Mitra, A. Execution of Real-time Wide Area Monitoring System with Big Data Functions and Practices. In Proceedings of the 2020 IEEE 9th Power India International Conference (PIICON), Sonepat, India, 28 February–1 March 2020; IEEE: New York, NY, USA, 2020; pp. 1–6. [Google Scholar]
- Kitzig, J.-P.; Bumiller, G. Evaluation of Power Quality Measurement System Concept using an experimental setup. In Proceedings of the 2019 IEEE International Instrumentation and Measurement Technology Conference (I2MTC), Auckland, New Zealand, 20–23 May 2019; IEEE: New York, NY, USA, 2019; pp. 1–6. [Google Scholar]
- Xie, Z.; Chen, Y.; Wu, W.; Luo, A.; Zhou, L.; Zhou, X.; Yang, L.; Tan, W.; Wang, Y. UPQC-Based High Precision Impedance Measurement Device and its Switching Control Method. In Proceedings of the IECON 2018-44th Annual Conference of the IEEE Industrial Electronics Society, Washington DC, USA, 21–23 October 2018; IEEE: New York, NY, USA, 2018; pp. 1556–1561. [Google Scholar]
- Deng, P.; Xu, X.; Wang, F.Y.; Chen, Z. Data mining and data driving of harmonic in AC arc furnaces based on functional analysis. IOP Conf. Ser. Earth Environ. Sci. 2019, 354, 012122. [Google Scholar] [CrossRef]
- Jasiński, M.; Sikorski, T.; Borkowski, K. Clustering as a tool to support the assessment of power quality in electrical power networks with distributed generation in the mining industry. Electr. Power Syst. Res. 2019, 166, 52–60. [Google Scholar] [CrossRef]
- Jasiński, M.; Sikorski, T.; Leonowicz, Z.; Borkowski, K.; Jasińska, E. The Application of Hierarchical Clustering to Power Quality Measurements in an Electrical Power Network with Distributed Generation. Energies 2020, 13, 2407. [Google Scholar] [CrossRef]
- Zhang, Y. Method for Extracting Typical Characteristics of Regional Grid with Scale Distributed PV Based on Time Series. In Proceedings of the 2018 2nd IEEE Conference on Energy Internet and Energy System Integration (EI2), Beijing, China, 20–22 October 2018; IEEE: New York, NY, USA, 2018; pp. 1–4. [Google Scholar]
- Jasiński, M.; Borkowski, K.; Sikorski, T.; Kostyla, P. Cluster Analysis for Long-Term Power Quality Data in Mining Electrical Power Network. In Proceedings of the 2018 Progress in Applied Electrical Engineering (PAEE), Kościelisko, Poland, 18–22 June 2018; IEEE: New York, NY, USA, 2018; pp. 1–5. [Google Scholar] [CrossRef]
- Gorjani, O.M.; Bilik, P.; Vanus, J. Application of Optimized Deterministic Methods in Long-term Power Quality. In Proceedings of the 2019 20th International Scientific Conference on Electric Power Engineering (EPE), Jeseniky Mountains, Czech Republic, 15–17 May 2019; IEEE: New York, NY, USA, 2019; pp. 1–5. [Google Scholar]
- Zhong, Q.; Yao, W.; Lin, L.; Wang, G.; Xu, Z. Data Analysis and Applications of the Power Quality Monitoring. In Proceedings of the 2018 International Conference on Power System Technology (POWERCON), Guangzhou, China, 24–26 October 2018; IEEE: New York, NY, USA, 2018; pp. 4035–4039. [Google Scholar]
- Jasinski, M.; Sikorski, T.; Leonowicz, Z.; Kaczorowska, D.; Suresh, V.; Szymanda, J.; Jasinska, E. Different working conditions identification of a PV power plant using hierarchical clustering. In Proceedings of the 2020 12th International Conference on Electronics, Computers and Artificial Intelligence (ECAI), Bucharest, Romania, 25–27 June 2020; IEEE: New York, NY, USA, 2020; pp. 1–8. [Google Scholar]
- Borges, F.A.S.; Fernandes, R.A.S.; Silva, I.N.; Silva, C.B.S. Feature Extraction and Power Quality Disturbances Classification Using Smart Meters Signals. IEEE Trans. Ind. Inform. 2016. [Google Scholar] [CrossRef]
- Asha Kiranmai, S.; Jaya Laxmi, A. Data mining for classification of power quality problems using WEKA and the effect of attributes on classification accuracy. Prot. Control Mod. Power Syst. 2018, 3, 29. [Google Scholar] [CrossRef]
- Ignatova, V.; Villard, D.; Hypolite, J.M. Simple indicators for an effective Power Quality monitoring and analysis. In Proceedings of the 2015 IEEE 15th International Conference on Environment and Electrical Engineering, EEEIC 2015-Conference Proceedings, Rome, Italy, 10–13 June 2015; pp. 1104–1108. [Google Scholar]
- Jasiński, M.; Sikorski, T.; Kostyła, P.; Leonowicz, Z.; Borkowski, K. Combined Cluster Analysis and Global Power Quality Indices for the Qualitative Assessment of the Time-Varying Condition of Power Quality in an Electrical Power Network with Distributed Generation. Energies 2020, 13, 2050. [Google Scholar] [CrossRef]
- Jasinski, M.; Sikorski, T.; Kostyla, P.; Borkowski, K. Global power quality indices for assessment of multipoint Power quality measurements. In Proceedings of the 2018 10th International Conference on Electronics, Computers and Artificial Intelligence (ECAI), Iasi, Romania, 28–30 June 2018; IEEE: New York, NY, USA, 2018; pp. 1–6. [Google Scholar]
- Raptis, T.E.; Vokas, G.A.; Langouranis, P.A.; Kaminaris, S.D. Total Power Quality Index for Electrical Networks Using Neural Networks. Energy Procedia 2015, 74, 1499–1507. [Google Scholar] [CrossRef]
- Ge, B.; Pan, T.; Li, Z. Synthetic assessment of power quality using relative entropy theory. J. Comput. Inf. Syst. 2015, 11, 1323–1331. [Google Scholar] [CrossRef]
- Khramshin, V.R.; Khramshin, R.R.; Karandaev, A.S.; Medvedev, V.N. Methodic of calculation of the non-sinusoidal voltage index within electrical networks with high-voltage frequency convertors. In Proceedings of the 2015 International Siberian Conference on Control and Communications (SIBCON), Omsk, Russia, 21–23 May 2015; IEEE: New York, NY, USA, 2015; pp. 1–6. [Google Scholar]
- Lee, B.; Sohn, D.; Kim, K.M. Development of Power Quality Index Using Ideal Analytic Hierarchy Process; Springer: Singapore, 2016; pp. 783–793. [Google Scholar]
- Langouranis, P.A.; Kaminaris, S.D.; Vokas, G.A.; Raptis, T.E.; Ioannidis, G.C.; General, A. Fuzzy Total Power Quality Index for Electric Networks; Institution of Engineering and Technology: London, UK, 2014; pp. 1–6. [Google Scholar]
- Kaushal, J.; Basak, P. A Novel Approach for Determination of Power Quality Monitoring Index of an AC Microgrid Using Fuzzy Inference System. Iran. J. Sci. Technol. Trans. Electr. Eng. 2018, 42, 429–450. [Google Scholar] [CrossRef]
- Strack, J.L.; Carugati, I.; Orallo, C.M.; Maestri, S.O.; Donato, P.G.; Funes, M.A. Three-phase voltage events classification algorithm based on an adaptive threshold. Electr. Power Syst. Res. 2019, 172, 167–176. [Google Scholar] [CrossRef]
- Kapoor, R.; Gupta, R.; Son, L.H.; Jha, S.; Kumar, R. Detection of Power Quality Event using Histogram of Oriented Gradients and Support Vector Machine. Meas. J. Int. Meas. Confed. 2018, 120, 52–75. [Google Scholar] [CrossRef]
- Yildirim, Ö.; Erişti, B.; Erişti, H.; Ünal, S.; Erol, Y.; Demir, Y. An online electric power quality disturbance detection system. In Proceedings of the 2016 51st International University Power Engineering Conference UPEC, Coimbra, Portugal, 6–9 September 2017. [Google Scholar] [CrossRef]
- Ucar, F.; Alcin, O.F.; Dandil, B.; Ata, F. Machine learning based power quality event classification using wavelet-Entropy and basic statistical features. In Proceedings of the International Conference on Methods and Models in Automation and Robotics, MMAR 2016, Dzyzdroje, Poland, 29 August–1 September 2016. [Google Scholar] [CrossRef]
- Rajeshbabu, S.; Manikandan, B.V. Detection and classification of power quality events by expert system using analytic hierarchy method. Cogn. Syst. Res. 2018. [Google Scholar] [CrossRef]
- Katic, V.A.; Stanisavljevic, A.M. Smart Detection of Voltage Dips Using Voltage Harmonics Footprint. IEEE Trans. Ind. Appl. 2018. [Google Scholar] [CrossRef]
- Balouji, E.; Salor, O. Classification of power quality events using deep learning on event images. In Proceedings of the 3rd International Conference on Pattern Recognition and Image Analysis, Shahrekord, Iran, 19–20 April 2017. [Google Scholar] [CrossRef]
- Ucar, F.; Alcin, O.F.; Dandil, B.; Ata, F. Power quality event detection using a fast extreme learning machine. Energies 2018, 11, 145. [Google Scholar] [CrossRef]
- Biswal, B.; Biswal, M.; Mishra, S.; Jalaja, R. Automatic classification of power quality events using balanced neural tree. IEEE Trans. Ind. Electron. 2014, 61. [Google Scholar] [CrossRef]
- Casaleiro, Â.; Amaro e Silva, R.; Teixeira, B.; Serra, J.M. Experimental assessment and model validation of power quality parameters for vehicle-to-grid systems. Electr. Power Syst. Res. 2021, 191, 106891. [Google Scholar] [CrossRef]
- Krishna, B.; Anusha, D.; Karthikeyan, V. Ultra-Fast DC Charger with Improved Power Quality and Optimal Algorithmic Approach to Enable V2G and G2V. J. Circuits Syst. Comput. 2020, 29, 2050197. [Google Scholar] [CrossRef]
- Luo, H.; Nduka, O.S. Power Quality Ancillary Services Support from Customer-owned Electric Vehicles in Low Voltage Distribution Networks. In Proceedings of the 2020 12th IEEE PES Asia-Pacific Power and Energy Engineering Conference (APPEEC), Xi’an, China, 17–19 April 2020; IEEE: New York, NY, USA, 2020; pp. 1–5. [Google Scholar]
- Baraniak, J.; Starzyński, J. Modeling the Impact of Electric Vehicle Charging Systems on Electric Power Quality. Energies 2020, 13, 3951. [Google Scholar] [CrossRef]
- Watson, N.; Watson, R.; Paterson, T.; Russell, G.; Ellerington, M.; Langella, R. Power Quality of a bidirectional Electric Vehicle charger. In Proceedings of the 2020 19th International Conference on Harmonics and Quality of Power (ICHQP), Dubai, UAE, 22–25 March 2020; IEEE: New York, NY, USA, 2020; pp. 1–5. [Google Scholar]
- Gupta, J.; Kushwaha, R.; Singh, B. Improved Power Quality Charger Based on Bridgeless Canonical Switching Cell Converter for a Light Electric Vehicle. In Proceedings of the 2020 IEEE 9th Power India International Conference (PIICON), Sonepat, India, 28 February–2 March 2020; IEEE: New York, NY, USA, 2020; pp. 1–6. [Google Scholar]
- Iqbal, S.; Xin, A.; Jan, M.U.; ur Rehman, H.; Masood, A.; Salman, S.; Abbas Rizvi, S.A.; Aurangzeb, M. Role of Power Electronics in Primary Frequency Control and Power Quality in an Industrial Micro-grid Considering V2G Technology. In Proceedings of the 2019 IEEE 3rd Conference on Energy Internet and Energy System Integration (EI2), Changsha, China, 8–10 November 2019; IEEE: Kraków, Poland, 2019; pp. 1188–1193. [Google Scholar]
- Cardoso, K.R.; Lima, R.S.; Borba, B.S.M.C.; Larrea, J.A.S.; Fortes, M.Z. Electric Vehicles Insertion in Power Grids and Impacts on Power Quality: A Conventional and Inductive Charging Comparative Study. In Proceedings of the 2019 IEEE PES Innovative Smart Grid Technologies Conference-Latin America (ISGT Latin America), Gramado City, Brazil, 15–18 September 2019; IEEE: New York, NY, USA, 2019; pp. 1–6. [Google Scholar]
- Zhang, L.; Zhang, X.; Li, D.; Tan, H. Research on Power Quality Control Method of V2G System of Electric Vehicle Based on APF. In Proceedings of the 2019 International Conference on Advanced Mechatronic Systems (ICAMechS), Shiga, Japan, 26–29 August 2019; IEEE: New York, NY, USA, 2019; pp. 186–189. [Google Scholar]
- Pudjianto, D.; Ramsay, C.; Strbac, G. Microgrids and virtual power plants: Concepts to support the integration of distributed energy resources. Proc. Inst. Mech. Eng. Part A J. Power Energy 2008, 222, 731–741. [Google Scholar] [CrossRef]
- Etherden, N.; Vyatkin, V.; Bollen, M.H.J.J. Virtual Power Plant for Grid Services Using IEC 61850. IEEE Trans. Ind. Inform. 2016, 12, 437–447. [Google Scholar] [CrossRef]
- Caldon, R.; Patria, A.; Turri, R. Optimal Control of a Distribution System with a Virtual Power Plant. In Proceedings of the Bulk Power System Dynamics and Control-VI, Cortina d’Ampezzo, Italy, 22–27August 2004; pp. 278–284. [Google Scholar]
- Beguin, A.; Nicolet, C.; Kawkabani, B.; Avellan, F. Virtual power plant with pumped storage power plant for renewable energy integration. In Proceedings of the 2014 International Conference Electricity Machines ICEM, Berlin, Germany, 2–5 September 2014; pp. 1736–1742. [Google Scholar] [CrossRef]
- Zhang, J.; Xu, Z.; Xu, W.; Zhu, F.; Lyu, X.; Fu, M. Bi-Objective Dispatch of Multi-Energy Virtual Power Plant: Deep-Learning-Based Prediction and Particle Swarm Optimization. Appl. Sci. 2019, 9, 292. [Google Scholar] [CrossRef]
- Gong, J.; Xie, D.; Jiang, C.; Zhang, Y. Multiple Objective Compromised Method for Power Management in Virtual Power Plants. Energies 2011, 4, 700–716. [Google Scholar] [CrossRef]
- IEC 61000 4-30 Electromagnetic Compatibility (EMC)—Part 4-30: Testing and Measurement Techniques—Power Quality Measurement Methods; International Electrotechnical Commission: Geneva, Switzerland, 2015.
- Jasinski, M.; Sikorski, T.; Kaczorowska, D.; Kostyla, P.; Leonowicz, Z.; Rezmer, J.; Janik, P.; Bejmert, D. Global Power Quality Index application in Virtual Power Plant. In Proceedings of the 2020 12th International Conference and Exhibition on Electrical Power Quality and Utilisation-(EPQU), Krakow, Poland, 14–15 September 2020; IEEE: New York, NY, USA, 2020; pp. 1–6. [Google Scholar]
- Sikorski, T.; Jasiński, M.; Ropuszyńska-Surma, E.; Węglarz, M.; Kaczorowska, D.; Kostyla, P.; Leonowicz, Z.; Lis, R.; Rezmer, J.; Rojewski, W.; et al. A Case Study on Distributed Energy Resources and Energy-Storage Systems in a Virtual Power Plant Concept: Technical Aspects. Energies 2020, 13, 3086. [Google Scholar] [CrossRef]
- EN 50160: Voltage Characteristics of Electricity Supplied by Public Distribution Network; British Standards: London, UK, 2010.
| Publisher’s Note: MDPI stays neutral with regard to jurisdictional claims in published maps and institutional affiliations. |
© 2020 by the authors. Licensee MDPI, Basel, Switzerland. This article is an open access article distributed under the terms and conditions of the Creative Commons Attribution (CC BY) license (http://creativecommons.org/licenses/by/4.0/).

 ,
, 


