Article

Molecular-Scale Considerations of Enhanced Oil Recovery in Shale

Los Alamos National Lab, Computational Earth Science Group, Earth and Environmental Science Division, Los Alamos, NM 87545, USA
*
Author to whom correspondence should be addressed.
Energies 2020, 13(24), 6619; https://doi.org/10.3390/en13246619
Submission received: 1 November 2020 / Revised: 7 December 2020 / Accepted: 11 December 2020 / Published: 15 December 2020
(This article belongs to the Special Issue Development of Unconventional Reservoirs 2020)

Abstract

:
With only less than 10% recovery, the primary production of hydrocarbon from shale reservoirs has redefined the energy equation in the world. Similar to conventional reservoirs, Enhanced Oil Recovery (EOR) techniques could be devised to enhance the current recovery factors. However, shale reservoirs possess unique characteristics that significantly affect the fluid properties. Therefore, we are adopting a molecular simulation approach that is well-suited to account for these effects to evaluate the performance of three different gases, methane, carbon dioxide and nitrogen, to recover the hydrocarbons from rough pore surfaces. Our hydrocarbon systems consists of either a single component (decane) or more than one component (decane and pentane). We simulated cases where concurrent and countercurrent displacement is studied. For concurrent displacement (injected fluids displace hydrocarbons towards the production region), we found that nitrogen and methane yielded similar recovery; however nitrogen exhibited a faster breakthrough. On the other hand, carbon dioxide was more effective in extracting the hydrocarbons when sufficient pressure was maintained. For countercurrent displacement (gases are injected and hydrocarbons are produced from the same direction), methane was found to be more effective, followed by carbon dioxide and nitrogen. In all cases, confinement reduced the recovery factor of all gases. This work provides insights to devise strategies to improve the current recovery factors observed in shale reservoirs.

Graphical Abstract

1. Introduction

While abundant, shale formations are unique and serve as unconventional hosts for hydrocarbons [1]. In recent times, a shale revolution has redefined the energy equation in the world [2]. Although the hydrocarbon content of these reservoirs was known for long, the economic developments of these reservoirs became possible only by the coupling of multi-stage hydraulic fracturing with horizontal drilling [3,4,5]. This coupling overcomes the ultra-low permeability nature of the shale by providing highly conductive pathways connecting the natural fractures. However, the current recovery factors are less than 10%, even with the most efficient completion schemes [6,7].
Enhanced oil recovery techniques have been widely-used in conventional reservoirs [8,9]. Some provide pressure maintenance and others improve the hydrocarbon mobility by tuning the interfacial and physical properties of the reservoir fluids [10]. In contrary to conventional reservoirs, the interconnectivity between shale wells does not always warrant a field-wide design of EOR operations [11,12]. Alternatively, single-well approaches have been proposed [13,14]. Zhang et al. [15] numerically evaluated the efficiency of cyclic methane injection considering both the molecular diffusion and nano-confinement effects. Their results suggest implementing a cyclic injection strategy during the early stages of production. On the other hand, Meng et al. [16] evaluated the efficiency of carbon dioxide cyclic injection, and they experimentally observed more than 30% increase in the recovery. Assef and Pereira Almao [17] further economically optimized the cyclic gas injection operations. Currently, the Huff and Puff technique is a commonly-used technique that involves injecting the EOR fluid into the well, shutting down the well for a soaking time and resuming the production from the well [18,19]. While the EOR fluid could be gas, water or surfactant, Sheng and Chen showed that gas flooding yields better performance compared to water flooding [20].
The optimization of the gas injection has been the focus of several studies [21,22,23]. For instance, Hoffman [24] studied the feasibility of various gases for injection in Bakken and reported better performance for the miscible cases. In addition, they encouraged the implementation of EOR since significant oil could be recovered regardless of the gas type. Sheng [25] favored lean gases to enhance the liquid hydrocarbon from shale condensate reservoirs. In addition, Fragoso et al. [26] proposed a holistic approach to develop fields with multiple fluid-type windows, like Eagle Ford and Duvernay, where the gas production is used to enhance the liquid production from the liquid and condensate windows.
Experiments and lab studies have been providing numerous insights about the potential of shale EOR [27,28]. Tovar et al. [29] showed promising results for CO2-EOR (18–55% recovery factors). In addition, Gamadi et al. [30] observed up to 85% improvement in the oil recovery from Eagle Ford samples using cyclic CO2 injection. On the other hand, Yu and Sheng [31] studied the N2 performance in Eagle Ford core and found better results for a longer flooding time and a higher injection pressure. Nguyen et al. [32] used microfluidic experiments to probe the CO2 and N2 performance and attributed the superior CO2 performance to its miscibility characteristics. Alharthy et al. [23] found that both CO2 and Natural gas liquids, C1-C4+, have a similar efficiency when extracting oil through countercurrent flow from the matrix instead of displacing oil. Hawthorne et al. [33] identified the molecular diffusion of CO2 as the main mechanism for oil recovery in Bakken samples.
Following the promising lab results, field pilots of CO2-EOR have been conducted in Bakken and Eagle Ford [34]. Liu et al. [35] designed a case study to evaluate the potential of CO2-EOR in the Bakken formation where promising results were observed. Pankaj et al. [36] devised an Eagle Ford case study to investigate the CO2-EOR potential where they refuted the need for infill wells and reported an extra 9% increase in the recovery factor. Kerr et al. [37] developed an Eagle Ford case study to engineer single- and multi-well CO2-EOR techniques and reasonable agreement with the field results was reported. Although promising results were observed for Eagle Ford, fruitless results were reported for Bakken [28]. Rassenfoss [38] attributed these contradictory results to the reservoir containment of each field. For CO2-EOR to work, sufficient and sustainable contact between CO2 and the matrix should be achievable. While Eagle Ford pilots provided the containment required for CO2 to work, the fractured nature of the Bakken formation obstructed the containment. However, the fractured nature of the Bakken formation allowed multi-well EOR techniques to be implemented. Todd and Evans analyzed Huff and Puff and continuous injection pilots in Bakken, and found that continuous injection was favored for CO2-EOR operations [34].
Molecular simulations have been widely used to probe the gas injection in shale at the molecular scale [39,40,41]. For instance, Wu et al., studied the displacement mechanisms of CO2, N2 and CH4 [42]. They attributed the slow breakthrough of CO2 to the superior adsorption characteristics. By contrast, N2 exhibits a fast breakthrough and a wide front. Wang et al., confirmed the adsorption selectivity of kerogen pores to CO2 and CH4 to range from 2.53 up to 7.25 [43]. Sun et al. studied the diffusion of methane and CO2 in kerogen and observed that the diffusion of dissolved molecules was smaller than that of those adsorbed, which were smaller than the bulk [44]. Liu et al. studied the oil flow displacement by CO2 in silica nano channels and recommended a small injection rate to assure that the miscible front is developed [45].
Zhou et al. found that the pressure drawdown is efficient in extracting the lighter hydrocarbons and the CO2 is more efficient is stripping the heavier hydrocarbons from the middle of the pore [46]. Zhang et al. reported the CO2 behavior in organic and inorganic pores [47]. They observed that C2 and C3 remain adsorbed during the primary production regardless of the pore type compared to C1. On the other hand, CO2 injection disrobes the hydrocarbon from the pore surface, which enhances the extraction of heavier components.
Fluid behavior and phase properties deviate from the bulk behavior under confinement [48,49,50]. Consequently, confinement affects the efficiency of the gases to extract liquid hydrocarbons and requires revisiting both the design and the operation to account for the confinement effects. We used molecular dynamics to evaluate the performance of various gases for enhancing the hydrocarbon recovery from shale formations. We organized the rest of this article as follows: the methodology section briefly presents the modeling approach and the simulation details, and the results section discusses the impact of confinement and operational parameters on the performance of different gases. The main findings are summarized in the conclusions section.

2. Methods

In this section, we briefly present the modeling approach and the simulation details.

2.1. Modeling Approach

Molecular dynamics rely on decoupling between the nucleus and electron motions. While the nucleus motion is classically treated through Newton’s mechanics, the effects of the electron motions are considered through partial charges placed on the molecular structure. The force field is a set of equations that describe the molecular interactions and includes intermolecular and intramolecular interactions. Intermolecular interactions describe the interactions among atoms from different molecular entities and include both the Van der Waals (VDW) and electrostatics interactions. While the Lenard Jones potential (Equation (1)) is one of the widely-used models to model the VDW interactions, electrostatic interactions are modeled by Coulomb’s law (Equation (2)). On the other hand, the intramolecular interactions maintain the molecular entity and include the bond, angle, dihedral and improper interactions. Given the initial configuration of the system and the molecular interactions,
u r L J = 4 ε σ r 12   σ r 6
u r c o u l o m b =   Q 1 Q 2 4 π ϵ 0 r
where ε is the depth of the potential well (dimensions: ML2T−2), σ is the distance at which the potential energy is zero (dimension: L), Q is the atomic charge (dimension: AT) and ϵ 0 is the permittivity of free space (dimensions: M−1L−3T4A2).

2.2. Simulation Details

We used graphite to represent the pore material, decane and pentane to represent the hydrocarbons and carbon dioxide, respectively, and nitrogen and methane to represent the EOR’s gases. We elected to simulate rough solid surfaces, which realistically capture the complexity of the porous media. As shown in Figure 1, our system consists of a silt pore connected to a reservoir containing the EOR’s gas. This reservoir is constrained by a wall that acts as a fixed boundary or constant-rate boundary. In addition, a production region is defined on the other side of the pore. The whole simulation matrix is shown in Table 1. The dimensions of the simulation cell are lx = 504 Å, ly = 42.6 Å and lz = 90/70 Å. The solid substrate comprise three sheets of graphite. We used equal molar gas density for all gases. Note that equal gas densities do not correspond to equal fluid pressures, as shown in Figure 2.
We used the OPLS_UA force field [52] to model the hydrocarbon interactions and united-atom force fields for the EOR’s gases as detailed in Table 2. We used Moltemplate software to set up the initial system [53] and LAMMPS to run all the simulations [54]. We started by annealing the hydrocarbons inside the pore for 0.1 ns using canonical ensemble and then equilibrating the EOR’s gas for 0.1 ns. After that, the simulation was extended to include a production region (an extra 250 Å in the x-direction). In this scenario, we simulated concurrent displacement, where both the injected fluid and hydrocarbons are moving in the same directions. For constant-rate boundary cases, we applied a constant velocity of 0.0002 Kcal/mole-Angstrom on the wall. We ran the simulation for 1 ns and recorded the hydrocarbon production. We created rough surfaces by carving out grooves inside the solid substrate. We used the Lorentz–Berthelot mixing rules to model the cross interactions. We used the Nosé–Hoover thermostat with a damping parameter of 100 time steps.
We also simulated the Huff and Puff process, where the EOR’s gas is kept in contact with the hydrocarbon system for 10 ns. After that, the region of the EOR’s gas is evacuated to allow the hydrocarbon recovery. This scenario depicts countercurrent displacement. We recorded the production for another 5 ns.

3. Results

In the section, we discuss the results of our single, binary and confined systems.

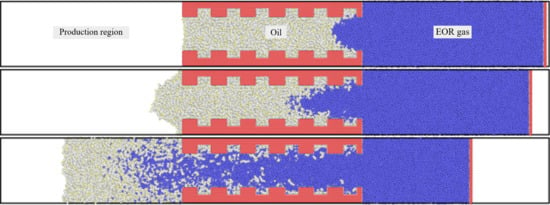
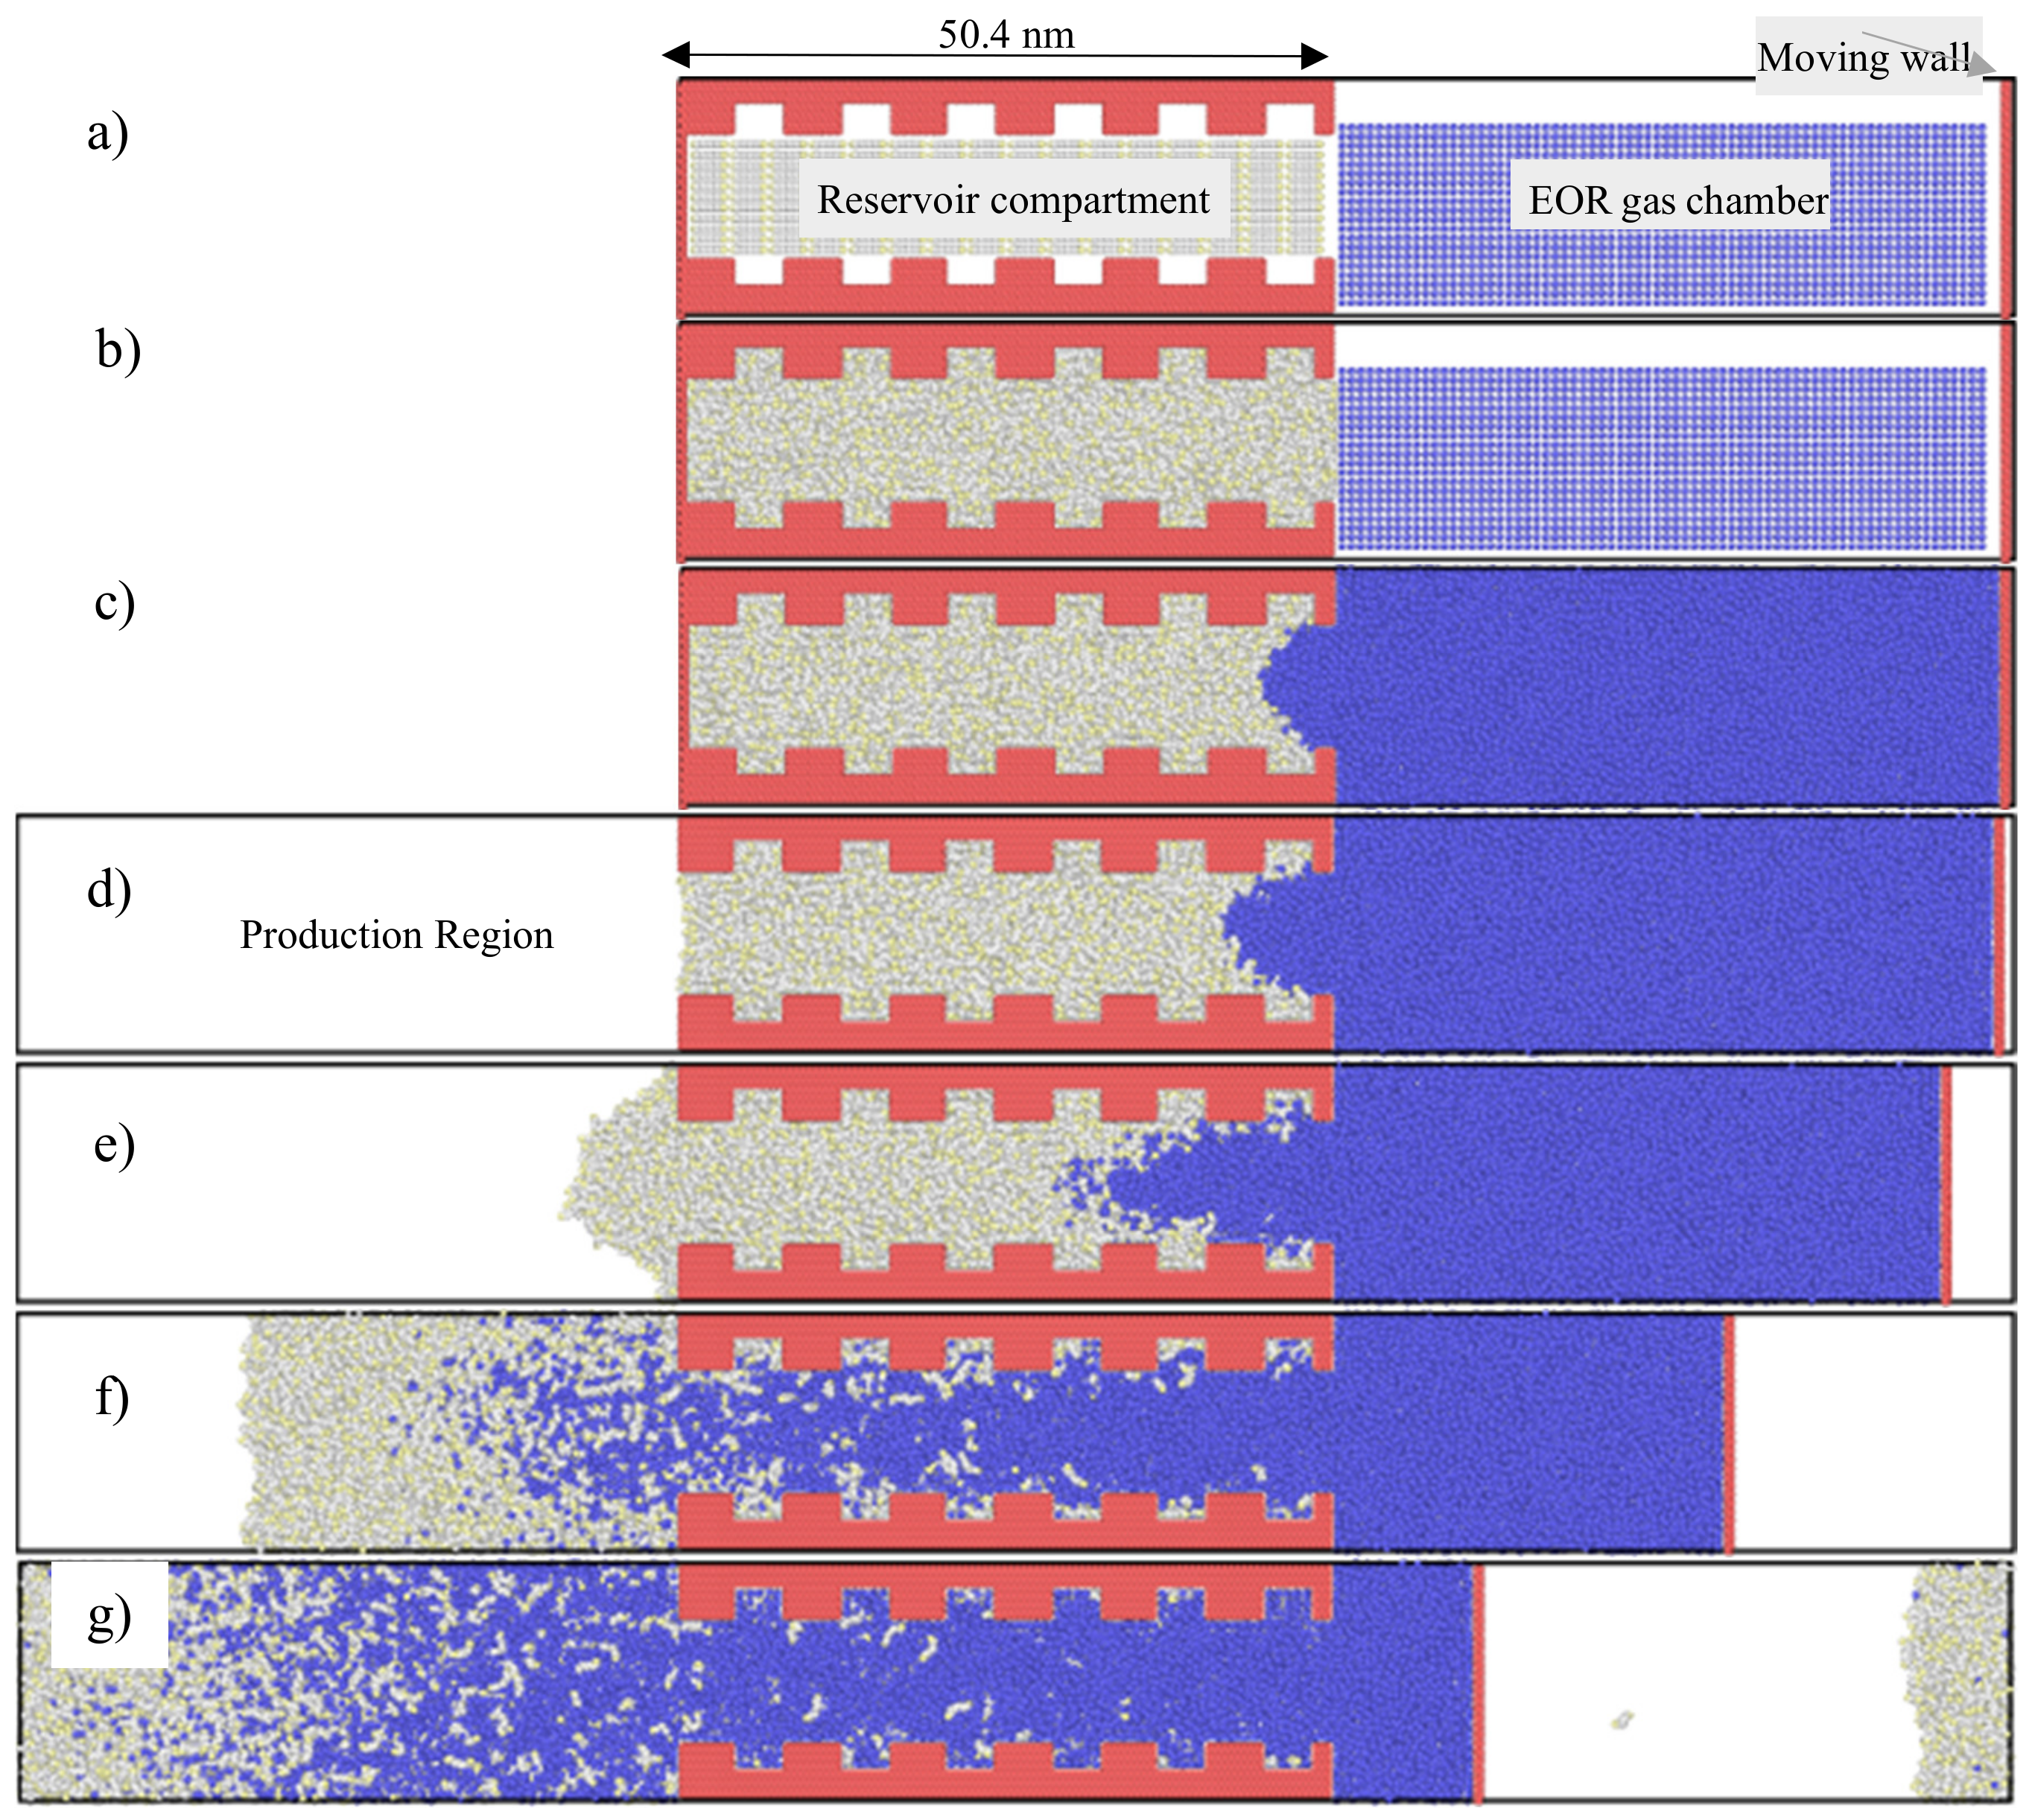
3.1. Concurrent Displacement

We used the recovery factor as a quantitative measure of the gas efficiency to extract the hydrocarbons from the pore. We estimated the recovery factor by normalizing the number of hydrocarbon molecules leaving the systems by the total number of hydrocarbon molecules in the system. Figure 3 and Figure 4 present the performance of different gases to extract single-component hydrocarbon systems with and without constant-rate injection. We observed that both nitrogen and methane yielded similar recovery factors with and without injection. However, nitrogen exhibited faster breakthrough and displacement compared to carbon dioxide and methane, respectively. We could attribute this behavior to the miscibility of each gas in the hydrocarbons [55]. Given that the solubility of nitrogen in decane is only 15% of that of carbon dioxide at 5 MPa and 50 °C with more than six times minimum miscibility pressure at a temperature of 343.2 K, nitrogen had a stable displacement front and in turn a faster breakthrough [56,57,58,59,60]. In addition, we observed lower recovery rates for all gases without injection. However, the reduction in the case of CO2 was the most significant, where the breakthrough was not achieved.
On the other hand, carbon dioxide had better results than the rest with continuous injection and worse than the rest without injection. This could be attributed to the superior adsorption and diffusion characteristics of supercritical CO2, which allow the extraction of the trapped hydrocarbons in the pore grooves [61,62]. While carbon dioxide could not achieve the breakthrough without the injection, it did not induce a phase separation. Li et al. [63] experimentally and numerically compared the performance of miscible and immiscible CO2 displacement using the recovery factor. In our case, we believe that the miscibility was initially achieved; however there was no pressure to maintain the miscible front.
Herein, our hydrocarbon system is a multi-component system with a 50:50 mixture of pentane and decane. Figure 5 presents the results of the multi-component systems. Regardless of the boundary conditions, more pentane was extracted compared to decane. Similar to the single-component systems, both nitrogen and methane had similar recovery factors. However, methane and nitrogen had the same displacement speed. In addition, CO2 still yielded a relatively slower and better performance with constant-rate injection. However, it failed to reach the breakthrough without the injection. It is worth noting that the methane performance was quite different than in the single-component system, especially regarding the displacement speed. This behavior could be attributed to a stable displacement front caused by diluting the decane with pentane. Therefore, there is limited room for methane solubility before phase separation. On the other hand, the pentane presence did not affect the carbon dioxide performance.
As the pore width decreased, we observed that the displacement of hydrocarbons became slower. Figure 6 presents the gas performance to extract single-component systems from confined pores (2 nm). For constant-rate injection scenarios, nitrogen started to displace the hydrocarbons faster than the rest. However, both methane and carbon dioxide eventually yielded better recovery rates. We observed a no-production period for all gases at the start, which was shorter for nitrogen. This period might be attributed to the stronger adsorption hydrocarbons experienced as the pore size decreases. Theoretically, higher capillary pressure is required for gases to enter smaller pores. However, our results suggest that both cases, with and without injection, start to displace hydrocarbons around the same time. This behavior could be attributed to the compressibility of the injected fluid. Even though we did not observe significant impacts on the boundary conditions in the early stages, significant effects were observed later on.
It is worth noting that the curve shape of the recovery factor of confined pores differs from the one observed from large pores. In confined pores, we observed more of a convex shape compared to the linear response observed in large pores. In addition, the breakthrough is more transitional instead of the abrupt change observed in large pores. Both observations suggest a stronger adsorption of hydrocarbons on the pore surface under confinement. On the other hand, less recovery is observed without injection. Both methane and carbon dioxide did not reach the breakthrough. However, methane had a slightly better recovery than carbon dioxide.

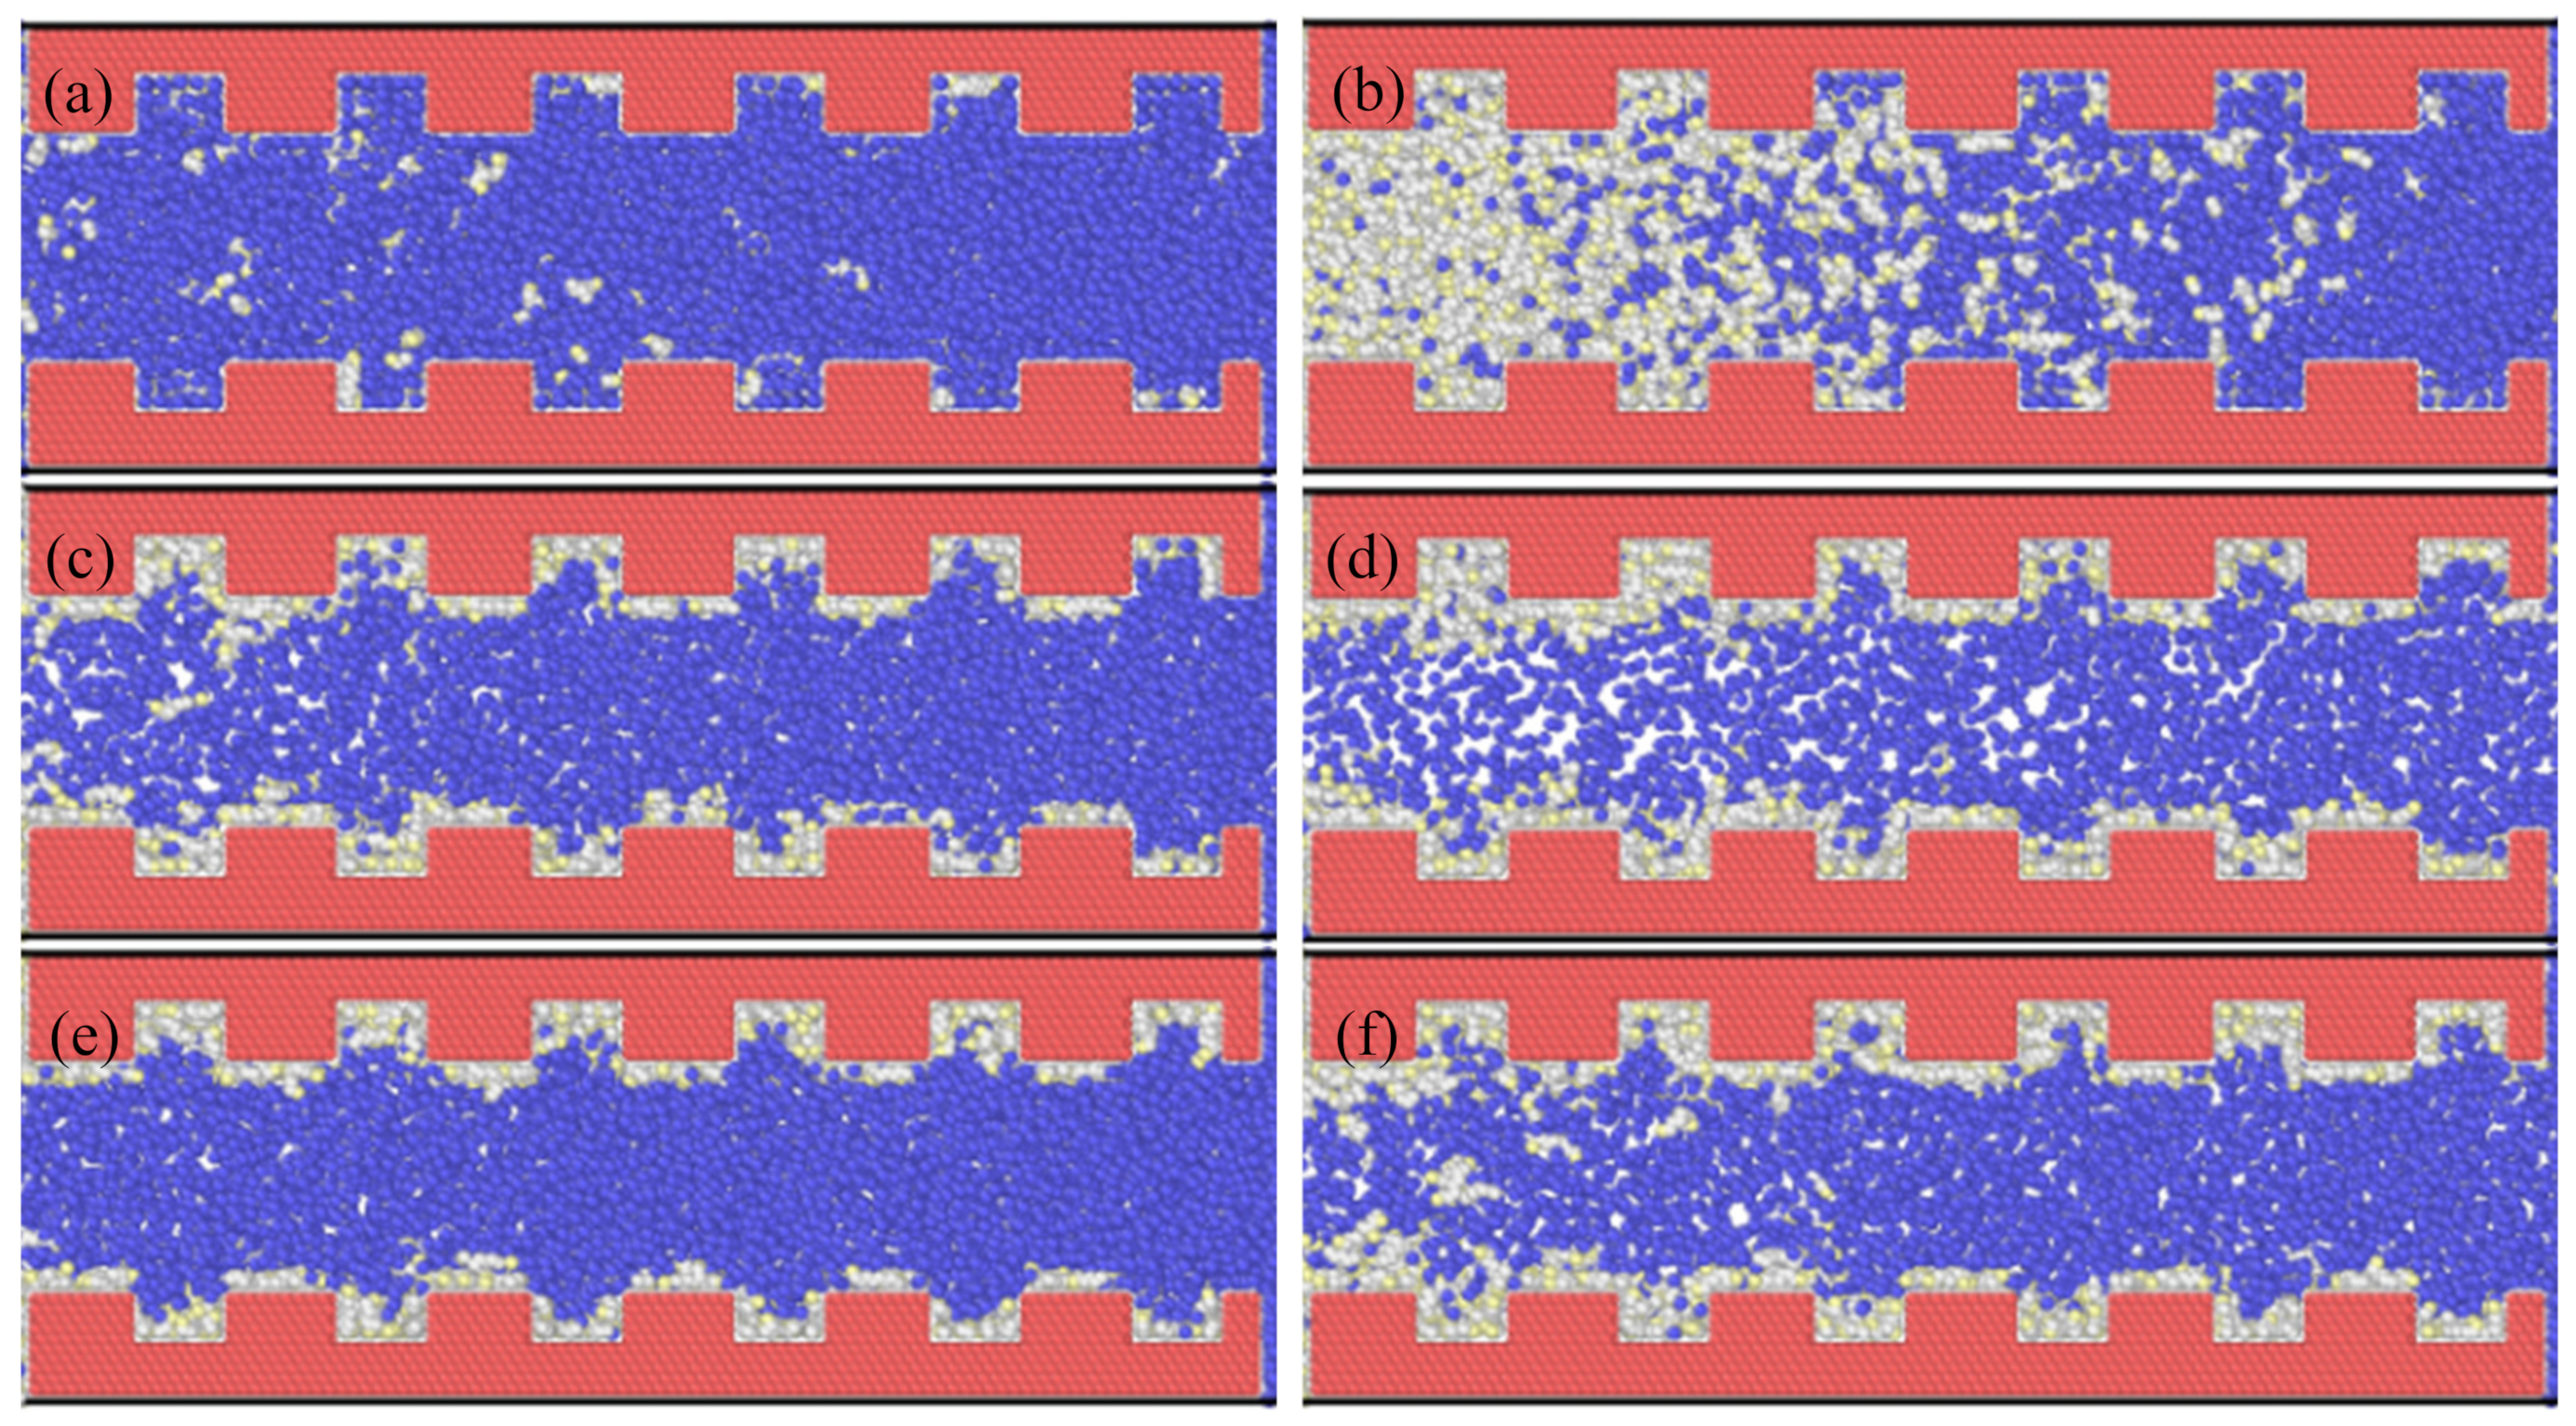
3.2. Countercurrent Displacement

In this section, we simulate the performance of the gases to extract single-component hydrocarbon systems. The gases were soaked in contact with the hydrocarbon system for 10 ns, while the hydrocarbons were extracted from the pore to the EOR’s gas region. Figure 7 presents the results of the Huff and Puff simulations. During the soaking time, CH4 was the most effective in extracting the hydrocarbon, followed by CO2 and then N2. As the puff process started, a large influx of hydrocarbons left the pore. We observed that some of the hydrocarbons returned back to the pore for 5 nm cases, especially with nitrogen or methane. While similar behavior was observed for 2 nm pores, less recovery was observed for all gases. In addition, the CO2′s performance was relatively improved compared to the methane. While reduced compared to the concurrent displacement, the countercurrent displacement’s recovery factors were in line with field observations and recent molecular simulation studies [64,65]. The superiority of CO2 over N2 has been previously experimentally and numerically reported. However, we found that CH4 outperformed all of them in this scenario. This behavior could be attributed to the better vaporization characteristics of methane [66,67].
Field recommendations include using CO2 for multi-well EOR operations and CH4 for single-well EOR operations. In addition, the injection pressure significantly affects the CO2 performance. Consequently, pressure support should be maintained throughout the operations. While valid, these recommendations were derived based on single-pore simulations with single or binary component hydrocarbons. However, the heterogeneity of the porous media and the complexity of the crude oil mixture might dramatically affect the EOR operations. Therefore, further research is required to quantify the impact of these factors along with more integrated lab and field pilots.

4. Conclusions

In this study, we have conducted a comprehensive molecular simulation study to examine the efficiency of carbon dioxide, nitrogen and methane to extract hydrocarbons from organic rough pores. We found that:
  • Confinement enhances the adsorption of hydrocarbons to the pore surface, which hinders both concurrent and counter-current displacements.
  • All gases are more efficient in displacing hydrocarbons in concurrent displacement relative to counter-current displacement. While the recovery factors observed in counter-current displacements are usually less than 20%, the concurrent displacement could reach up to 90%.
  • Nitrogen usually exhibited faster breakthrough regardless of the hydrocarbons’ type, pore size and the boundary conditions for the concurrent displacement. Interestingly, the limited diffusion and miscibility of nitrogen in hydrocarbons led to faster recovery in the case of concurrent displacement, while the opposite was observed for counter-current displacement. On the other hand, methane yielded better recovery for counter-current displacement.
  • Carbon dioxide proved more efficient in extracting the hydrocarbons from rough pores (from the grooves) if enough pressure was maintained. Having favorable adsorption characteristics and capability to improve the hydrocarbon mobility, carbon dioxide provides the best candidate. However, constant pressure support is needed to overcome the unstable displacement front.

Author Contributions

Conceptualization, methodology and analysis, M.M. and Q.K.; resources, Q.K. and H.V.; writing—original draft preparation, M.M.; writing—review and editing, Q.K. and H.V.; supervision, Q.K. and H.V.; funding acquisition, Q.K. All authors have read and agreed to the published version of the manuscript.

Funding

This work was supported by the Laboratory Directed Research and Development (LDRD) program of Los Alamos National Laboratory (LANL).

Conflicts of Interest

The authors declare no conflict of interest.

References

  1. Mehana, M.; El-monier, I. Shale characteristics impact on Nuclear Magnetic Resonance (NMR) fluid typing methods and correlations. Petroleum 2016, 2, 138–147. [Google Scholar] [CrossRef] [Green Version]
  2. Hughes, J.D. Energy: A reality check on the shale revolution. Nature 2013, 494, 307. [Google Scholar] [CrossRef]
  3. Middleton, R.; Carey, B.; Currier, R.P.; Hyman, J.D.; Kang, Q.; Karra, S.; Jiménez-Martínez, J.; Porter, M.L.; Viswanathan, H.S. Shale gas and non-aqueous fracturing fluids: Opportunities and challenges for supercritical CO2. Appl. Energy 2015, 147, 500–509. [Google Scholar] [CrossRef] [Green Version]
  4. King, G.E. Thirty years of gas shale fracturing: What have we learned? In Proceedings of the SPE Annual Technical Conference and Exhibition, Florence, Italy, 19–22 September 2010; Society of Petroleum Engineers: Richardson, TX, USA, 2010.
  5. King, G.E. Hydraulic fracturing 101: What every representative, environmentalist, regulator, reporter, investor, university researcher, neighbor and engineer should know about estimating frac risk and improving frac performance in unconventional gas and oil wells. In Proceedings of the SPE Hydraulic Fracturing Technology Conference, The Woodlands, TX, USA, 6–8 February 2012; Society of Petroleum Engineers: Richardson, TX, USA, 2012. [Google Scholar]
  6. Clark, A.J. Determination of recovery factor in the Bakken formation, Mountrail County, ND. In Proceedings of the SPE Annual Technical Conference and Exhibition, New Orleans, LA, USA, 4–7 October 2009; Society of Petroleum Engineers: Richardson, TX, USA, 2009. [Google Scholar]
  7. LeFever, J.A.; Helms, L.D. Bakken Formation Reserve Estimates; North Dakota Geological Survey: Bismarck, ND, USA, 2006. [Google Scholar]
  8. Green, D.W.; Willhite, G.P. Enhanced oil recovery. In Doherty Memorial Fund of AIME; Henry, L., Ed.; Society of Petroleum Engineers: Richardson, TX, USA, 1998; Volume 6. [Google Scholar]
  9. Lake, L.W. Enhanced Oil Recovery. 1989. Available online: https://store.spe.org/Enhanced-Oil-Recovery--P436.aspx (accessed on 22 September 2020).
  10. Lake, L.W.; Johns, R.; Rossen, W.R.; Pope, G.A. Fundamentals of Enhanced Oil Recovery. 2014. Available online: https://store.spe.org/Fundamentals-ofEnhanced-Oil-Recovery-P921.aspx (accessed on 22 September 2020).
  11. Chalmers, G.R.; Ross, D.J.; Bustin, R.M. Geological controls on matrix permeability of Devonian Gas Shales in the Horn River and Liard basins, northeastern British Columbia, Canada. Int. J. Coal Geol. 2012, 103, 120–131. [Google Scholar] [CrossRef]
  12. Yu, W.; Wu, K.; Zuo, L.; Tan, X.; Weijermars, R. Physical models for inter-well interference in shale reservoirs: Relative impacts of fracture hits and matrix permeability. In Proceedings of the Unconventional Resources Technology Conference, San Antonio, TX, USA, 1–3 August 2016. [Google Scholar]
  13. Alfarge, D.; Wei, M.; Bai, B. IOR methods in unconventional reservoirs of North America: Comprehensive review. In Proceedings of the SPE Western Regional Meeting, Bakersfield, CA, USA, 23–27 April 2017; Society of Petroleum Engineers: Richardson, TX, USA, 2017. [Google Scholar]
  14. Du, F.; Nojabaei, B. A review of gas injection in shale reservoirs: Enhanced oil/gas recovery approaches and greenhouse gas control. Energies 2019, 12, 2355. [Google Scholar] [CrossRef] [Green Version]
  15. Zhang, Y.; Di, Y.; Shi, Y.; Hu, J. Cyclic CH4 injection for enhanced oil recovery in the Eagle Ford shale reservoirs. Energies 2018, 11, 3094. [Google Scholar] [CrossRef] [Green Version]
  16. Meng, X.; Meng, Z.; Ma, J.; Wang, T. Performance Evaluation of CO2 Huff-n-Puff Gas Injection in Shale Gas Condensate Reservoirs. Energies 2018, 12, 42. [Google Scholar] [CrossRef] [Green Version]
  17. Assef, Y.; Almao, P.P. Evaluation of Cyclic Gas Injection in Enhanced Recovery from Unconventional Light Oil Reservoirs: Effect of Gas Type and Fracture Spacing. Energies 2019, 12, 1370. [Google Scholar] [CrossRef] [Green Version]
  18. Yu, W.; Lashgari, H.; Sepehrnoori, K. Simulation study of CO2 huff-n-puff process in Bakken tight oil reservoirs. In Proceedings of the SPE Western North American and Rocky Mountain Joint Meeting, Denver, CO, USA, 17–18 April 2014; Society of Petroleum Engineers: Richardson, TX, USA, 2014. [Google Scholar]
  19. Yu, W.; Lashgari, H.R.; Wu, K.; Sepehrnoori, K. CO2 injection for enhanced oil recovery in Bakken tight oil reservoirs. Fuel 2015, 159, 354–363. [Google Scholar] [CrossRef]
  20. Sheng, J.J.; Chen, K. Evaluation of the EOR potential of gas and water injection in shale oil reservoirs. J. Unconv. Oil Gas. Resour. 2014, 5, 1–9. [Google Scholar] [CrossRef]
  21. Sheng, J.J. Enhanced oil recovery in shale reservoirs by gas injection. J. Nat. Gas. Sci. Eng. 2015, 22, 252–259. [Google Scholar] [CrossRef] [Green Version]
  22. Wang, L.; Tian, Y.; Yu, X.; Wang, C.; Yao, B.; Wang, S.; Winterfeld, P.H.; Wang, X.; Yang, Z.; Wang, Y. Advances in improved/enhanced oil recovery technologies for tight and shale reservoirs. Fuel 2017, 210, 425–445. [Google Scholar] [CrossRef]
  23. Alharthy, N.; Teklu, T.W.; Kazemi, H.; Graves, R.M.; Hawthorne, S.B.; Braunberger, J.; Kurtoglu, B. Enhanced oil recovery in liquid-rich shale reservoirs: Laboratory to field. SPE Reserv. Eval. Eng. 2018, 21, 137–159. [Google Scholar] [CrossRef]
  24. Hoffman, B.T. Comparison of various gases for enhanced recovery from shale oil reservoirs. In Proceedings of the SPE Improved Oil Recovery Symposium, Tulsa, OK, USA, 14–18 April 2012; Society of Petroleum Engineers: Richardson, TX, USA, 2012. [Google Scholar]
  25. Sheng, J.J. Increase liquid oil production by huff-n-puff of produced gas in shale gas condensate reservoirs. J. Unconv. Oil Gas. Resour. 2015, 11, 19–26. [Google Scholar] [CrossRef] [Green Version]
  26. Fragoso, A.; Wang, Y.; Jing, G.; Aguilera, R. Improving recovery of liquids from shales through gas recycling and dry gas injection. In Proceedings of the SPE Latin American and Caribbean Petroleum Engineering Conference, Quito, Ecuador, 18–20 November 2015; Society of Petroleum Engineers: Richardson, TX, USA, 2015. [Google Scholar]
  27. Jin, L.; Hawthorne, S.; Sorensen, J.; Pekot, L.; Kurz, B.; Smith, S.; Heebink, L.; Herdegen, V.; Bosshart, N.; Torres, J. Advancing CO2 enhanced oil recovery and storage in unconventional oil play—Experimental studies on Bakken shales. Appl. Energy 2017, 208, 171–183. [Google Scholar] [CrossRef]
  28. Jia, B.; Tsau, J.S.; Barati, R. A review of the current progress of CO2 injection EOR and carbon storage in shale oil reservoirs. Fuel 2019, 236, 404–427. [Google Scholar] [CrossRef]
  29. Tovar, F.D.; Eide, O.; Graue, A.; Schechter, D.S. Experimental investigation of enhanced recovery in unconventional liquid reservoirs using CO2: A look ahead to the future of unconventional EOR. In Proceedings of the SPE Unconventional Resources Conference, The Woodlands, TX, USA, 1–3 April 2014; Society of Petroleum Engineers: Richardson, TX, USA, 2014. [Google Scholar]
  30. Gamadi, T.; Sheng, J.; Soliman, M.; Menouar, H.; Watson, M.; Emadibaladehi, H. An experimental study of cyclic CO2 injection to improve shale oil recovery. In Proceedings of the SPE Improved Oil Recovery Symposium, New Orleans, LA, USA, 30 September–2 October 2014; Society of Petroleum Engineers: Richardson, TX, USA, 2014. [Google Scholar]
  31. Yu, Y.; Sheng, J.J. Experimental evaluation of shale oil recovery from Eagle Ford core samples by nitrogen gas flooding. In Proceedings of the SPE Improved Oil Recovery Conference, Tulsa, OK, USA, 11–13 April 2016; Society of Petroleum Engineers: Richardson, TX, USA, 2016. [Google Scholar]
  32. Nguyen, P.; Carey, J.W.; Viswanathan, H.S.; Porter, M. Effectiveness of supercritical-CO2 and N2 huff-and-puff methods of enhanced oil recovery in shale fracture networks using microfluidic experiments. Appl. Energy 2018, 230, 160–174. [Google Scholar] [CrossRef]
  33. Hawthorne, S.B.; Jin, L.; Kurz, B.A.; Miller, D.J.; Grabanski, C.B.; Sorensen, J.A.; Pekot, L.J.; Bosshart, N.W.; Smith, S.A.; Burton-Kelly, M.E. Integrating petrographic and petrophysical analyses with CO2 permeation and oil extraction and recovery in the Bakken Tight oil formation. In Proceedings of the SPE Unconventional Resources Conference, Calgary, AB, Canada, 15–16 February 2017; Society of Petroleum Engineers: Richardson, TX, USA, 2017. [Google Scholar]
  34. Todd, H.B.; Evans, J.G. Improved oil recovery IOR pilot projects in the Bakken formation. In Proceedings of the SPE Low Perm Symposium, Denver, CO, USA, 5–6 May 2016; Society of Petroleum Engineers: Richardson, TX, USA, 2016. [Google Scholar]
  35. Liu, G.; Sorensen, J.; Braunberger, J.; Klenner, R.; Ge, J.; Gorecki, C.; Steadman, E.; Harju, J. CO2-based enhanced oil recovery from unconventional reservoirs: A case study of the Bakken formation. In Proceedings of the SPE Unconventional Resources Conference, The Woodlands, TX, USA, 1–3 April 2014; Society of Petroleum Engineers: Richardson, TX, USA, 2014. [Google Scholar]
  36. Pankaj, P.; Mukisa, H.; Solovyeva, I.; Xue, H. Enhanced oil recovery in eagle ford: Opportunities using huff-n-puff technique in unconventional reservoirs. In Proceedings of the SPE Liquids-Rich Basins Conference-North America, Midland, TX, USA, 5–6 September 2018; Society of Petroleum Engineers: Richardson, TX, USA, 2018. [Google Scholar]
  37. Kerr, E.; Venepalli, K.K.; Patel, K.; Ambrose, R.; Erdle, J. Use of Reservoir Simulation to Forecast Field EOR Response-An Eagle Ford Gas Injection Huff-N-Puff Application. In Proceedings of the SPE Hydraulic Fracturing Technology Conference and Exhibition, The Woodlands, TX, USA, 4–6 February 2020; Society of Petroleum Engineers: Richardson, TX, USA, 2020. [Google Scholar]
  38. Rassenfoss, S. Shale EOR Works, But Will It Make a Difference? J. Pet. Technol. 2017, 69, 34–40. [Google Scholar] [CrossRef]
  39. Lan, Y.; Yang, Z.; Wang, P.; Yan, Y.; Zhang, L.; Ran, J. A review of microscopic seepage mechanism for shale gas extracted by supercritical CO2 flooding. Fuel 2019, 238, 412–424. [Google Scholar] [CrossRef]
  40. Mehana, M.; Fahes, M.; Huang, L. The Density of Oil/Gas Mixtures: Insights from Molecular Simulations. SPE J. 2018, 23, 1798–1808. [Google Scholar] [CrossRef]
  41. Mehana, M.; Fahes, M.; Huang, L. Asphaltene Aggregation in Oil and Gas Mixtures: Insights from Molecular Simulation. Energy Fuels 2019, 33, 4721–4730. [Google Scholar] [CrossRef]
  42. Wu, H.; Chen, J.; Liu, H. Molecular dynamics simulations about adsorption and displacement of methane in carbon nanochannels. J. Phys. Chem. C 2015, 119, 13652–13657. [Google Scholar] [CrossRef]
  43. Wang, T.; Tian, S.; Li, G.; Sheng, M.; Ren, W.; Liu, Q.; Zhang, S. Molecular simulation of CO2/CH4 competitive adsorption on shale kerogen for CO2 sequestration and enhanced gas recovery. J. Phys. Chem. C 2018, 122, 17009–17018. [Google Scholar] [CrossRef]
  44. Sun, H.; Zhao, H.; Qi, N.; Li, Y. Molecular insights into the enhanced shale gas recovery by carbon dioxide in kerogen slit nanopores. J. Phys. Chem. C 2017, 121, 10233–10241. [Google Scholar] [CrossRef]
  45. Liu, B.; Wang, C.; Zhang, J.; Xiao, S.; Zhang, Z.; Shen, Y.; Sun, B.; He, J. Displacement mechanism of oil in shale inorganic nanopores by supercritical carbon dioxide from molecular dynamics simulations. Energy Fuels 2016, 31, 738–746. [Google Scholar] [CrossRef]
  46. Zhou, J.; Jin, Z.; Luo, K.H. Insights into recovery of multi-component shale gas by CO2 injection: A molecular perspective. Fuel 2020, 267, 117247. [Google Scholar] [CrossRef]
  47. Zhang, M.; Zhan, S.; Jin, Z. Recovery mechanisms of hydrocarbon mixtures in organic and inorganic nanopores during pressure drawdown and CO2 injection from molecular perspectives. Chem. Eng. J. 2020, 382, 122808. [Google Scholar] [CrossRef]
  48. Neil, C.W.; Mehana, M.; Hjelm, R.P.; Hawley, M.E.; Watkins, E.B.; Mao, Y.; Viswanathan, H.; Kang, Q.; Xu, H. Reduced methane recovery at high pressure due to methane trapping in shale nanopores. Commun. Earth Environ. 2020, 1, 1–10. [Google Scholar] [CrossRef]
  49. Santos, J.E.; Mehana, M.; Wu, H.; Prodanovic, M.; Kang, Q.; Lubbers, N.; Viswanathan, H.; Pyrcz, M.J. Modeling nanoconfinement effects using active learning. J. Phys. Chem. C 2020, 124, 22200–22211. [Google Scholar] [CrossRef]
  50. Lubbers, N.; Agarwal, A.; Chen, Y.; Son, S.; Mehana, M.; Kang, Q.; Karra, S.; Junghans, C.; Germann, T.C.; Viswanathan, H.S. Modeling and scale-bridging using machine learning: Nanoconfinement effects in porous media. Sci. Rep. 2020, 10, 1–13. [Google Scholar] [CrossRef]
  51. NIST. National Institute of Standards and Technology (NIST) Chemistry WebBook. 2009. Available online: https://webbook.nist.gov/chemistry/fluid/ (accessed on 5 October 2020).
  52. Jorgensen, W.L.; Maxwell, D.S.; Tirado-Rives, J. Development and testing of the OPLS all-atom force field on conformational energetics and properties of organic liquids. J. Am. Chem. Soc. 1996, 118, 11225–11236. [Google Scholar] [CrossRef]
  53. Jewett, A.I.; Zhuang, Z.; Shea, J.E. Moltemplate a coarse-grained model assembly tool. Biophys. J. 2013, 104, 169. [Google Scholar] [CrossRef] [Green Version]
  54. Plimpton, S. Fast parallel algorithms for short-range molecular dynamics. J. Comput. Phys. 1995, 117, 1–19. [Google Scholar] [CrossRef] [Green Version]
  55. Fang, T.; Wang, M.; Gao, Y.; Zhang, Y.; Yan, Y.; Zhang, J. Enhanced oil recovery with CO2/N2 slug in low permeability reservoir: Molecular dynamics simulation. Chem. Eng. Sci. 2019, 197, 204–211. [Google Scholar] [CrossRef]
  56. Pereira, L.M.; Chapoy, A.; Burgass, R.; Tohidi, B. Measurement and modelling of high pressure density and interfacial tension of (gas+ n-alkane) binary mixtures. J. Chem. 2016, 97, 55–69. [Google Scholar] [CrossRef]
  57. Tong, J.; Gao, W.; Robinson, R.L.; Gasem, K.A. Solubilities of nitrogen in heavy normal paraffins from 323 to 423 K at pressures to 18.0 MPa. J. Chem. Eng. Data 1999, 44, 784–787. [Google Scholar] [CrossRef]
  58. Georgiadis, A.; Llovell, F.; Bismarck, A.; Blas, F.J.; Galindo, A.; Maitland, G.C.; Trusler, J.M.; Jackson, G. Interfacial tension measurements and modelling of (carbon dioxide+ n-alkane) and (carbon dioxide+ water) binary mixtures at elevated pressures and temperatures. J. Supercrit. Fluids 2010, 55, 743–754. [Google Scholar] [CrossRef]
  59. Zamudio, M.; Schwarz, C.; Knoetze, J. Phase equilibria of branched isomers of C10-alcohols and C10-alkanes in supercritical carbon dioxide. J. Supercrit. Fluids 2011, 59, 14–26. [Google Scholar] [CrossRef]
  60. Nourozieh, H.; Bayestehparvin, B.; Kariznovi, M.; Abedi, J. Equilibrium properties of (carbon dioxide+ n-decane+ n-octadecane) systems: Experiments and thermodynamic modeling. J. Chem. Eng. Data 2013, 58, 1236–1243. [Google Scholar] [CrossRef]
  61. Huang, L.; Ning, Z.; Li, H.; Wang, Q.; Ye, H.; Qin, H. Molecular simulation of CO2 sequestration and enhanced gas recovery in gas rich shale: An insight based on realistic kerogen model. In Proceedings of the Abu Dhabi International Petroleum Exhibition & Conference, Abu Dhabi, United Arab Emirates, 13–16 November 2017; Society of Petroleum Engineers: Richardson, TX, USA, 2017. [Google Scholar]
  62. Fang, T.; Zhang, Y.; Liu, J.; Ding, B.; Yan, Y.; Zhang, J. Molecular insight into the miscible mechanism of CO2/C10 in bulk phase and nanoslits. Int. J. Heat Mass Transf. 2019, 141, 643–650. [Google Scholar] [CrossRef]
  63. Li, L.; Zhang, Y.; Sheng, J.J. Effect of the injection pressure on enhancing oil recovery in shale cores during the CO2 huff-n-puff process when it is above and below the minimum miscibility pressure. Energy Fuels 2017, 31, 3856–3867. [Google Scholar] [CrossRef]
  64. Li, L.; Su, Y.; Hao, Y.; Zhan, S.; Lv, Y.; Zhao, Q.; Wang, H. A comparative study of CO2 and N2 huff-n-puff EOR performance in shale oil production. J. Pet. Sci. Eng. 2019, 181, 106174. [Google Scholar] [CrossRef]
  65. Tovar, F.D.; Barrufet, M.A.; Schechter, D.S. Enhanced Oil Recovery in the Wolfcamp Shale by Carbon Dioxide or Nitrogen Injection: An Experimental Investigation. SPE J. 2020. [Google Scholar] [CrossRef]
  66. Choudhary, N.; Nair, A.K.N.; Ruslan, M.F.A.C.; Sun, S. Bulk and interfacial properties of decane in the presence of carbon dioxide, methane, and their mixture. Sci. Rep. 2019, 9, 1–10. [Google Scholar] [CrossRef] [Green Version]
  67. Potoff, J.J.; Siepmann, J.I. Vapor–liquid equilibria of mixtures containing alkanes, carbon dioxide, and nitrogen. AIChE J. 2001, 47, 1676–1682. [Google Scholar] [CrossRef]
Figure 1. System setup and the simulation evolution: (a) the initial setup of the system where the hydrocarbons are placed inside the pore and the Enhanced Oil Recovery (EOR) gas (in this case CO2) is placed outside; (b) the hydrocarbon equilibration; (c) the EOR gas equilibration; (d) the system extended to include a production region, where the pore was opened for production and a constant-velocity wall is allowed; (e) the system after 0.1 ns; (f) the system after 0.5 ns; (g) the system after 1 ns. Color code: red is graphite, blue is gas and yellow is hydrocarbon.
Energies 13 06619 g001
Figure 2. The impact of pressure on the bulk density of carbon dioxide, nitrogen and methane at temperature = 350 K (National Institute of Standards and Technology (NIST) data [51]).
Energies 13 06619 g002
Figure 3. Final snapshots of single-component systems: (a) CO2 with constant-rate injection; (b) CO2 without constant-rate injection; (c) CH4 with constant-rate injection; (d) CH4 without constant-rate injection; (e) N2 with constant-rate injection; (f) N2 without constant-rate injection. The color code is the same as in Figure 1.
Energies 13 06619 g003
Figure 4. Recovery factors for single-component hydrocarbon systems.
Energies 13 06619 g004
Figure 5. Recovery Factor for multi-component systems with constant-rate injection (Left) and without (Right).
Energies 13 06619 g005
Figure 6. Recovery factors for single-component systems in confined pores.
Energies 13 06619 g006
Figure 7. Recovery factors observed for Huff and Puff simulation: (a) pore width is 5 nm and (b) porewidth is 2 nm.
Energies 13 06619 g007
Table 1. Force field parameters of the system components.
LJƐ (Kcal/Mole)σ (Å)
C0.0684433.407
CO20.7170173.72
CH40.2943.73
N20.189183.75
CH30.1753.905
CH20.1183.905
BondKb (Kcal/mole)b0 (Å)
CH3-CH2
CH2-CH2
2601.526
AngleKa (Kcal/mole)θ (°)
CH3-CH2-CH2
CH2-CH2-CH2
63112.4
Table 2. Simulation matrix of the scenarios studied.
#Pore Width (nm)Hydrocarbon MixtureBoundary ConditionEOR Gas
17DecaneMovingCO2
2CH4
3N2
4FixedCO2
5CH4
6N2
7Decane and PentaneMovingCO2
8CH4
9N2
10FixedCO2
11CH4
12N2
135DecaneFixedCO2
14CH4
15N2
Publisher’s Note: MDPI stays neutral with regard to jurisdictional claims in published maps and institutional affiliations.

