Article

Research on the Influence of Abrupt Climate Changes on the Analysis of Typical Meteorological Year in China

1
School of Civil Engineering, Dalian University of Technology, Dalian 116024, China
2
The School of Computing and Engineering, The University of West London, London W5 5RF, UK
3
Design Institute of Civil Engineering & Architecture, Dalian University of Technology, Dalian 116024, China
*
Author to whom correspondence should be addressed.
Energies 2020, 13(24), 6531; https://doi.org/10.3390/en13246531
Submission received: 12 November 2020 / Revised: 3 December 2020 / Accepted: 8 December 2020 / Published: 10 December 2020
(This article belongs to the Section B: Energy and Environment)

Abstract

:
The conventional typical meteorological year (TMY) based on continuous-year original meteorological records without considering abrupt climate changes (ACC) may not be able to represent a real “typical” climate properly. Consequently, building performance analyses and simulations based on TMY may be not accurate. Current research rarely tackles this issue in TMY development. This paper presents an innovative TMY development with the consideration of ACC in the original meteorological records. It is based on the Chinese standard weather database method (CSWD) with the meteorological records of six Chinese cities in different climate zones. It applies the Moving t-test method to identify and exclude ACC points and to refine the timescales for TMY development. It also depicts the development of individual typical meteorological months again with the ACC impact to improve the accuracy of TMY. The method has been verified in several building energy consumption and thermal comfort analyses. The results demonstrate that the analysis based on the new TMY climate datasets when considering ACC will end up with less energy consumption and better thermal performance compared to the analyses based on the conversion dataset without considering ACC. This experimental research will refine TMY development, and further improve building energy performance analysis and design.

Graphical Abstract

1. Introduction

The concept of a typical meteorological year (TMY) plays an important role in building energy performance simulation, indoor human comfort analysis, and solar heating and cooling system performance optimization [1,2]. The development of TMY is mainly based on the following aspects: (1) the different methods to identify a TMY, which are determined by different meteorological parameters, weighting factors, availability of meteorological records and mathematical methods [3,4], such as Danish methods [5,6], Festa-Ratto method [7,8], Sadia method [5,9], CSWD method (Chinese standard weather database method) [10,11,12], CTYW method (Chinese typical year weather method) [13,14], and so on. Based on these methods, different countries have built up their own TMY database. Because China lacked meteorology observation stations before the 1980s, a previous study [13,14] established a TMY database of 57 Chinese cities based on the International Surface Weather Observations databases. So far, there are 824 meteorology observation stations in China which can constantly take meteorological records, and a database of the TMYs for 270 cities across mainland China. (2) Due to the consensus of the methods to determine a TMY, more research focus on processing and screening the original meteorology databases and improving the accuracy of the data due to the lack of historical and continuous meteorology records [15,16,17,18]. For instance, some research [13,14] worked out the TMY with the meteorological data captured only four times a day, and the predicted solar radiation data with the DFMs (Diffuse fraction models for the hourly solar radiation) [19]. In addition, some researchers also developed some other methods for determining a TMY, such as the Gazela-Mathioulaies method [20], Miquel-Bilbao method [21], TPCY method (typical principal component years method) [22], and so on. (3) It is about the impact of climate changes on TMY. A number of researches focus on whether global warming will affect the generation of TMY, and whether the adoption of early year meteorological data will lead to inaccurate results [23,24]. It takes Tianjin as an example. The building heating load based on the TMY coming up from the 30-year meteorology data between 1981 and 2010 has reduced 5.2% in comparison to the TMY between 1961 and 1990 [25]. Meanwhile the cooling load increases 1.6% [25]. Similar studies with the meteorological data in Toronto, Canada, found that the energy performance analysis with more recent years’ data can achieve more accurate outcomes [26,27]. Additionally, another research also found that, due to the abrupt climate changes (ACC), 30 of 345 cities have been reassigned to the warmer climate zones, and other eight cities cannot be simply categorized in any climate zones [28]. Today, there are many researches about the impact of ACCs on flooding, agriculture, and ecological environments [29,30], but it rarely has a research looking at the impact of ACCs on the formation of TMY. This paper here presents a research on this issue with an in-deep discussion on the reasoning method of a TMY based on the meteorological records. It also reveals a comparison study on the energy consumption and thermal comfort analysis based on the improved TMY developed with this method and a conventional method. Several Chinese cities from different climate zones are adopted as samples in this study.

2. The Methods to Identify Abrupt Climate Changes

Climate change has two different characteristics. One is even changes (gradual changes during the climate change, a likely trend) and another is bumpy changes (abrupt changes during the climate change) [31,32]. Most people focus on even changes. People started to tackle bumpy changes in the middle of the 20th century. The earliest study on the bumpy climate changes was that of Lorenz [33] who developed the theory of dynamic climate changes from a non-linear physical point of view. Based on this, the French mathematician Thom [34] created the principles of abrupt climate changes, and formally defined bumpy climate change as abrupt climate change. The issues of ACC became a hot topic in the meteorology research areas in 1970s and 1980s [35]. Such research in China started a bit later. Only in the 1990s did some Chinese meteorologists start to explore the definitions and the identifying methods of ACCs [36,37]. With the developments of definitions, theories and identifying techniques, today researchers focus more on the impact of ACCs on many fields, such as agriculture [38], heath [39] and built environment [28], and so on.
ACC analysis usually applies a statistical method to identify those significant changes in meteorological records in a defined period (season, year, ten years, one hundred years and more than one hundred years) [36,40]. The types of ACCs include mean change, variance change, seesaw change, and reverse change [41]. The most popular methods of identifying ACCs include the Yamamoto test method [42], the Moving t-test method (MTT) [32], the Cramer test method [32], the Mann-Kendall test method [43] and the Pettitt test method [44]. All these methods work well for mean changes, but do not work well for other types of changes [36]. Some researchers also studied other change types and found that the Mann-Kendall method and the Pettitt method are not suitable for examining multiple ACC points, but the MTT method and the Yamamoto method can examine multiple ACC points with more accurate results [32,45]. This is why this study chooses the MTT method to identify TMY. The details about the identifying procedure can be found in Appendix A. The MTT method to identify ACC analyzes whether two data subsequences before and after a datum point (Appendix A) are significantly different [32,46]. Some research has found the weakness of the MTT method in that the options of subsequence are significantly affected by human preference. In order to avoid a random choice of the length of subsequences that may cause the drift of abrupt change points and to promote the precision of analysis, it has to amend the length of subsequences several times in the analysis of abrupt change points [42]. How long should the length of subsequences be? A study [47] found that some fake abrupt change points may appear when a subsequence length is small; abrupt change points may not be accurate when a subsequence length is too large, and it may create some fake abrupt change points if the intervals of multiple subsequence lengths are too small. Thus, these researches suggest that a subsequence length should be between 2 and 10, and the interval of multiple subsequence lengths should be more than 2. Based on all of these principles regarding subsequence lengths, and in order to ensure the analysis outcomes are consistent and accurate, the subsequence lengths in this study were chosen as 6, 8, 10. This can eliminate the fake abrupt change points caused by the different subsequence lengths. When the subsequence lengths are determined, the test threshold for judging abrupt change points can be obtained according to a significance level α. The significance level (α) represents a critical probability associated with a statistical hypothesis test, which possibly indicates how an ACC happens. Usually, it indicates minor significance if α is more than 0.05; it indicates medium significance if α is more than 0.01 and less than 0.05; it indicates large significance when α is not more than 0.01. This study chose α as 0.01. When the analysis condition is based on the significance level with α = 0.01, and the subsequence lengths are defined as 6, 8, 10, the analysis data threshold tα relatively are 3.70, 3.35, 3.16 based on the t distribution table.
For instance, the abrupt climate change year analysis of Beijing city based on the dry-bulb temperatures between 1960 and 2019 found that only one t value exceeded the test threshold in 1988 with a significant level under the condition that α equaled 0.01, the subsequence length was 8 and the related threshold was 3.35. This means that the abrupt climate change year should be 1988, as shown in Figure 1.
In addition, in comparison to other normal meteorological analyses, the MTT method can only deal with a single dataset to identify an abrupt climate change year. Although some researchers suggest that other meteorological factors, such as temperature and relatively humidity, should be considered in an ACC analysis, the practical mathematic method which can analyze multiple datasets is not available yet [36]. However, the meteorological factors which have impact on TMY are more than one, thus it is necessary to analyze the different datasets of the different meteorological factors one by one (separately).

3. Timescales of Meteorological Records Adopted in a TMY Analysis with the Consideration of ACC

3.1. Timescale Selection Principles

At present, an ideal timescale of original meteorological data in a TMY analysis is at the latest 30 years [3]. The minimum requirement for the original records for a TMY analysis should be more than 10 years [48,49], although few researchers have claimed that 7–8 years of statistical data may also be feasible [50]. At present, many researchers focus on the timescale of the available meteorological records [51], but lack of the attention on the ACC impact so far.
This study has firstly developed the following principles to define the best timescale of meteorological records required for a TMY analysis with the ACC consideration: (1) Remove the years with abrupt change points and only to keep those continuous and stable years; (2) the acceptable timescale should be from the latest 10 to 30 years; (3) if there are only 10 years or less of meteorological records available, the impact of ACCs should not be considered.
A TMY is composed of 12 typical meteorological months (TMMs) from January to December. The conventional TMMs include 12-month datasets of one TMY timescale. The ACC analysis is usually based on an annual average dataset. This study develops 12 TMM datasets from different TMY timescales. In this case, the ACC analysis has to be based on a monthly average dataset. Therefore, a comparison of the TMY outcomes based on these two different datasets has been made in this study.

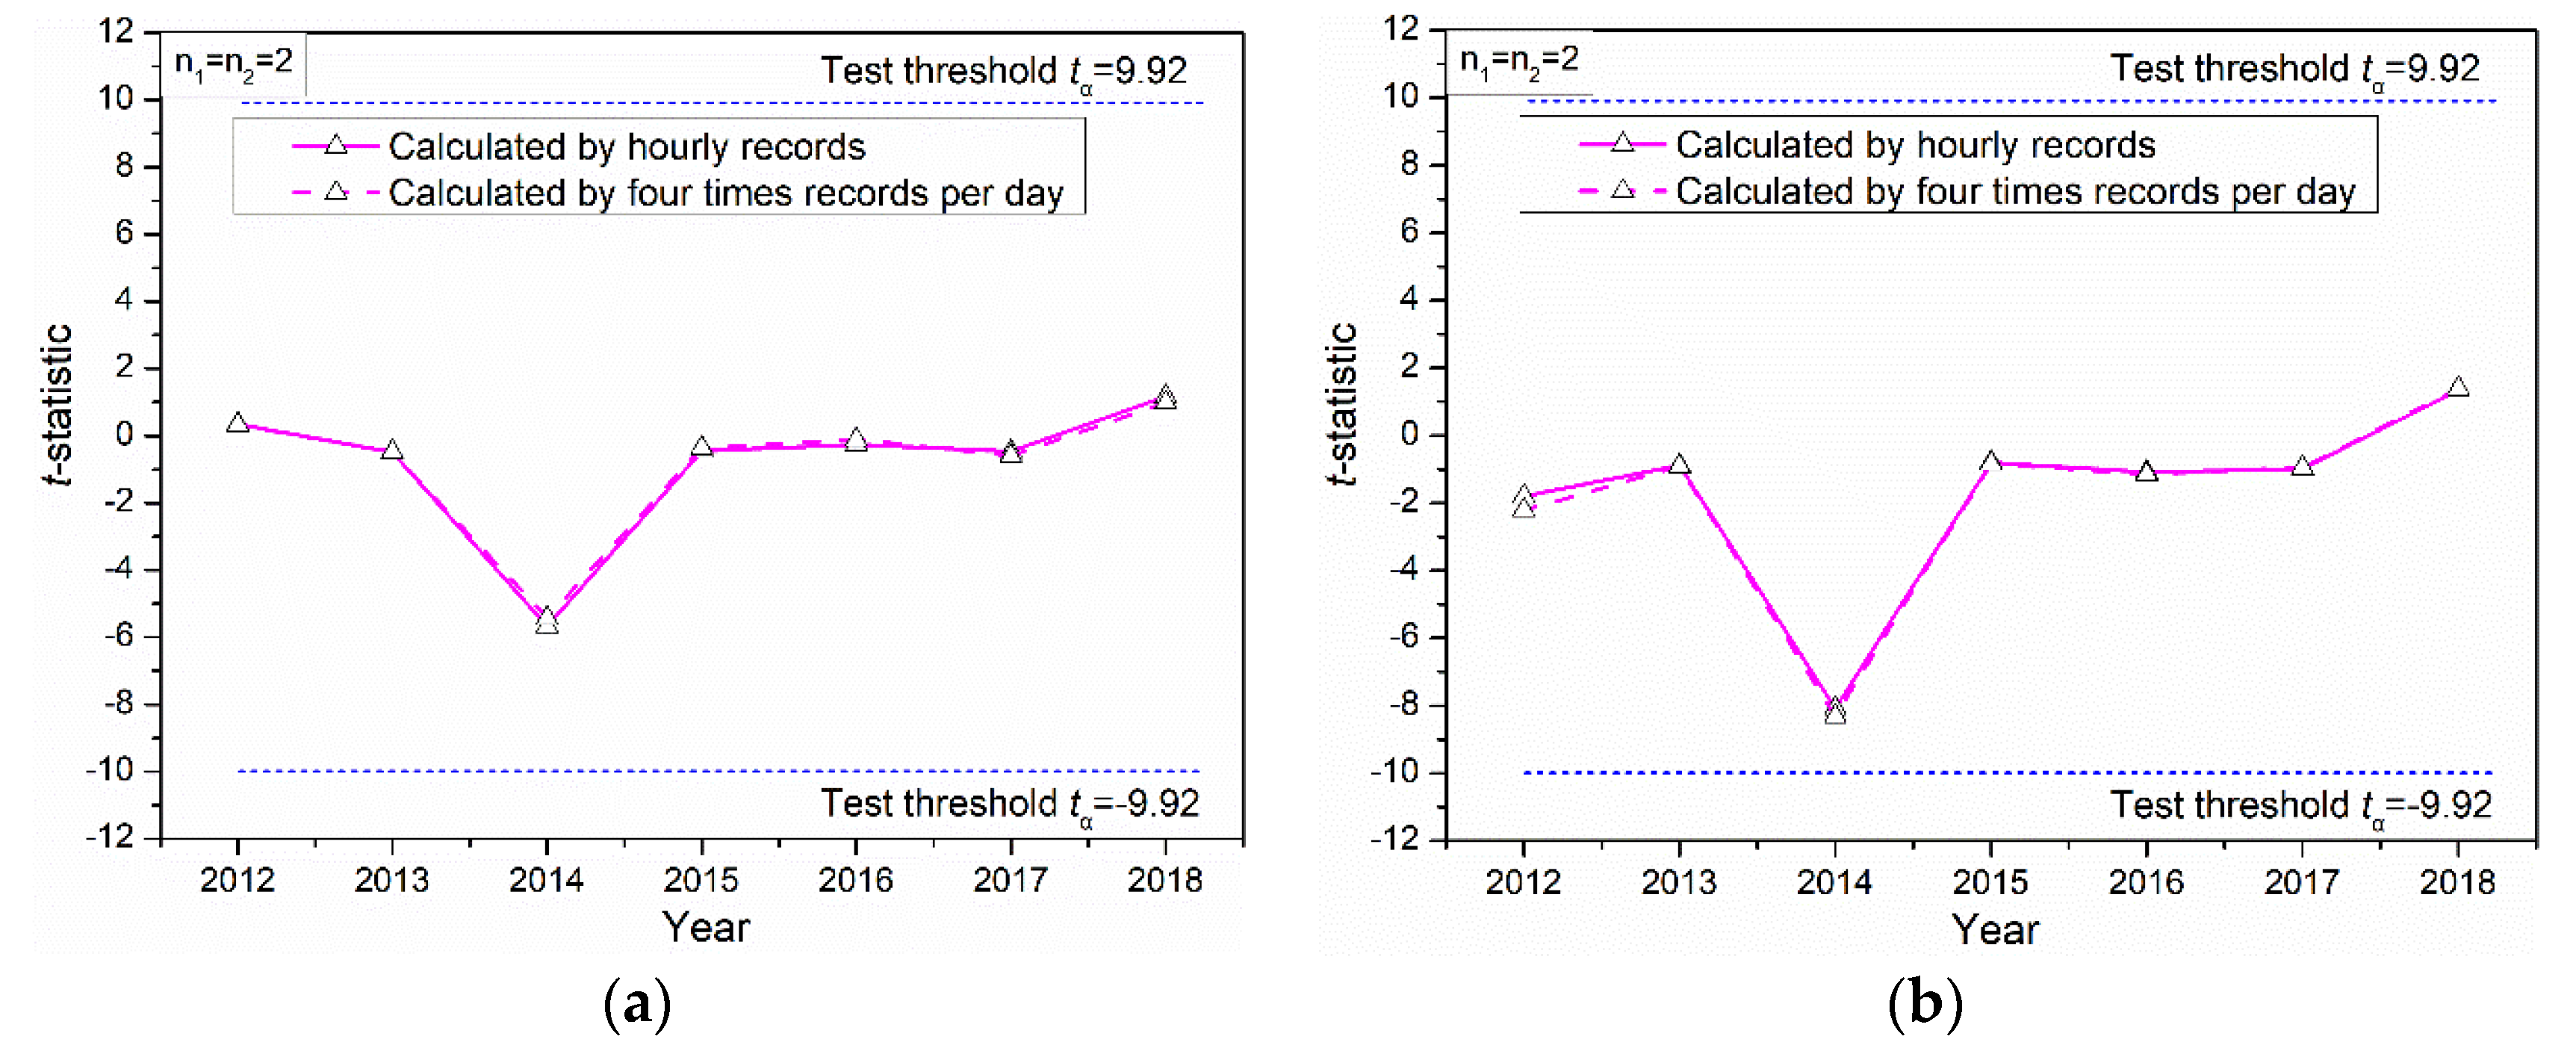
3.2. The Impact of the Quality of Original Meteorological Records on the Tested Results of MTT

The daily meteorological records from 1960 to 2019 used in this study are provided by the National Meteorological Information Center of China (CMDC, http://data.cma.cn/en). All weather stations in China were only collected four times a day (00:00, 06:00, 12:00, 18:00) before 2010, and hourly records have been captured since 2010. Due to the different frequencies of the meteorological records captured in the different periods, the daily meteorological records released in China today are still only four times a day. Regarding the quality of meteorological records, this paper takes the mean dry-bulb temperature records of Beijing from 2010 to 2019 as an example. Figure 2a,b show the different outcomes of the abrupt climate analysis between monthly and annual average values based on two different records (four times a day and hourly). It is demonstrated from Figure 2 that the ACC analysis results calculated with the hourly or four times records are actually the same. Therefore, it can be addressed that the analysis outcomes of abrupt change points with monthly and annual average data based on daily records captured hourly and only four times per day are also very consistent.
In addition, Figure 2a,b also shows the different results of the abrupt climate analysis between annual and monthly average data. The following research respectively discusses ACC test results within these two situations (annual and monthly average data).

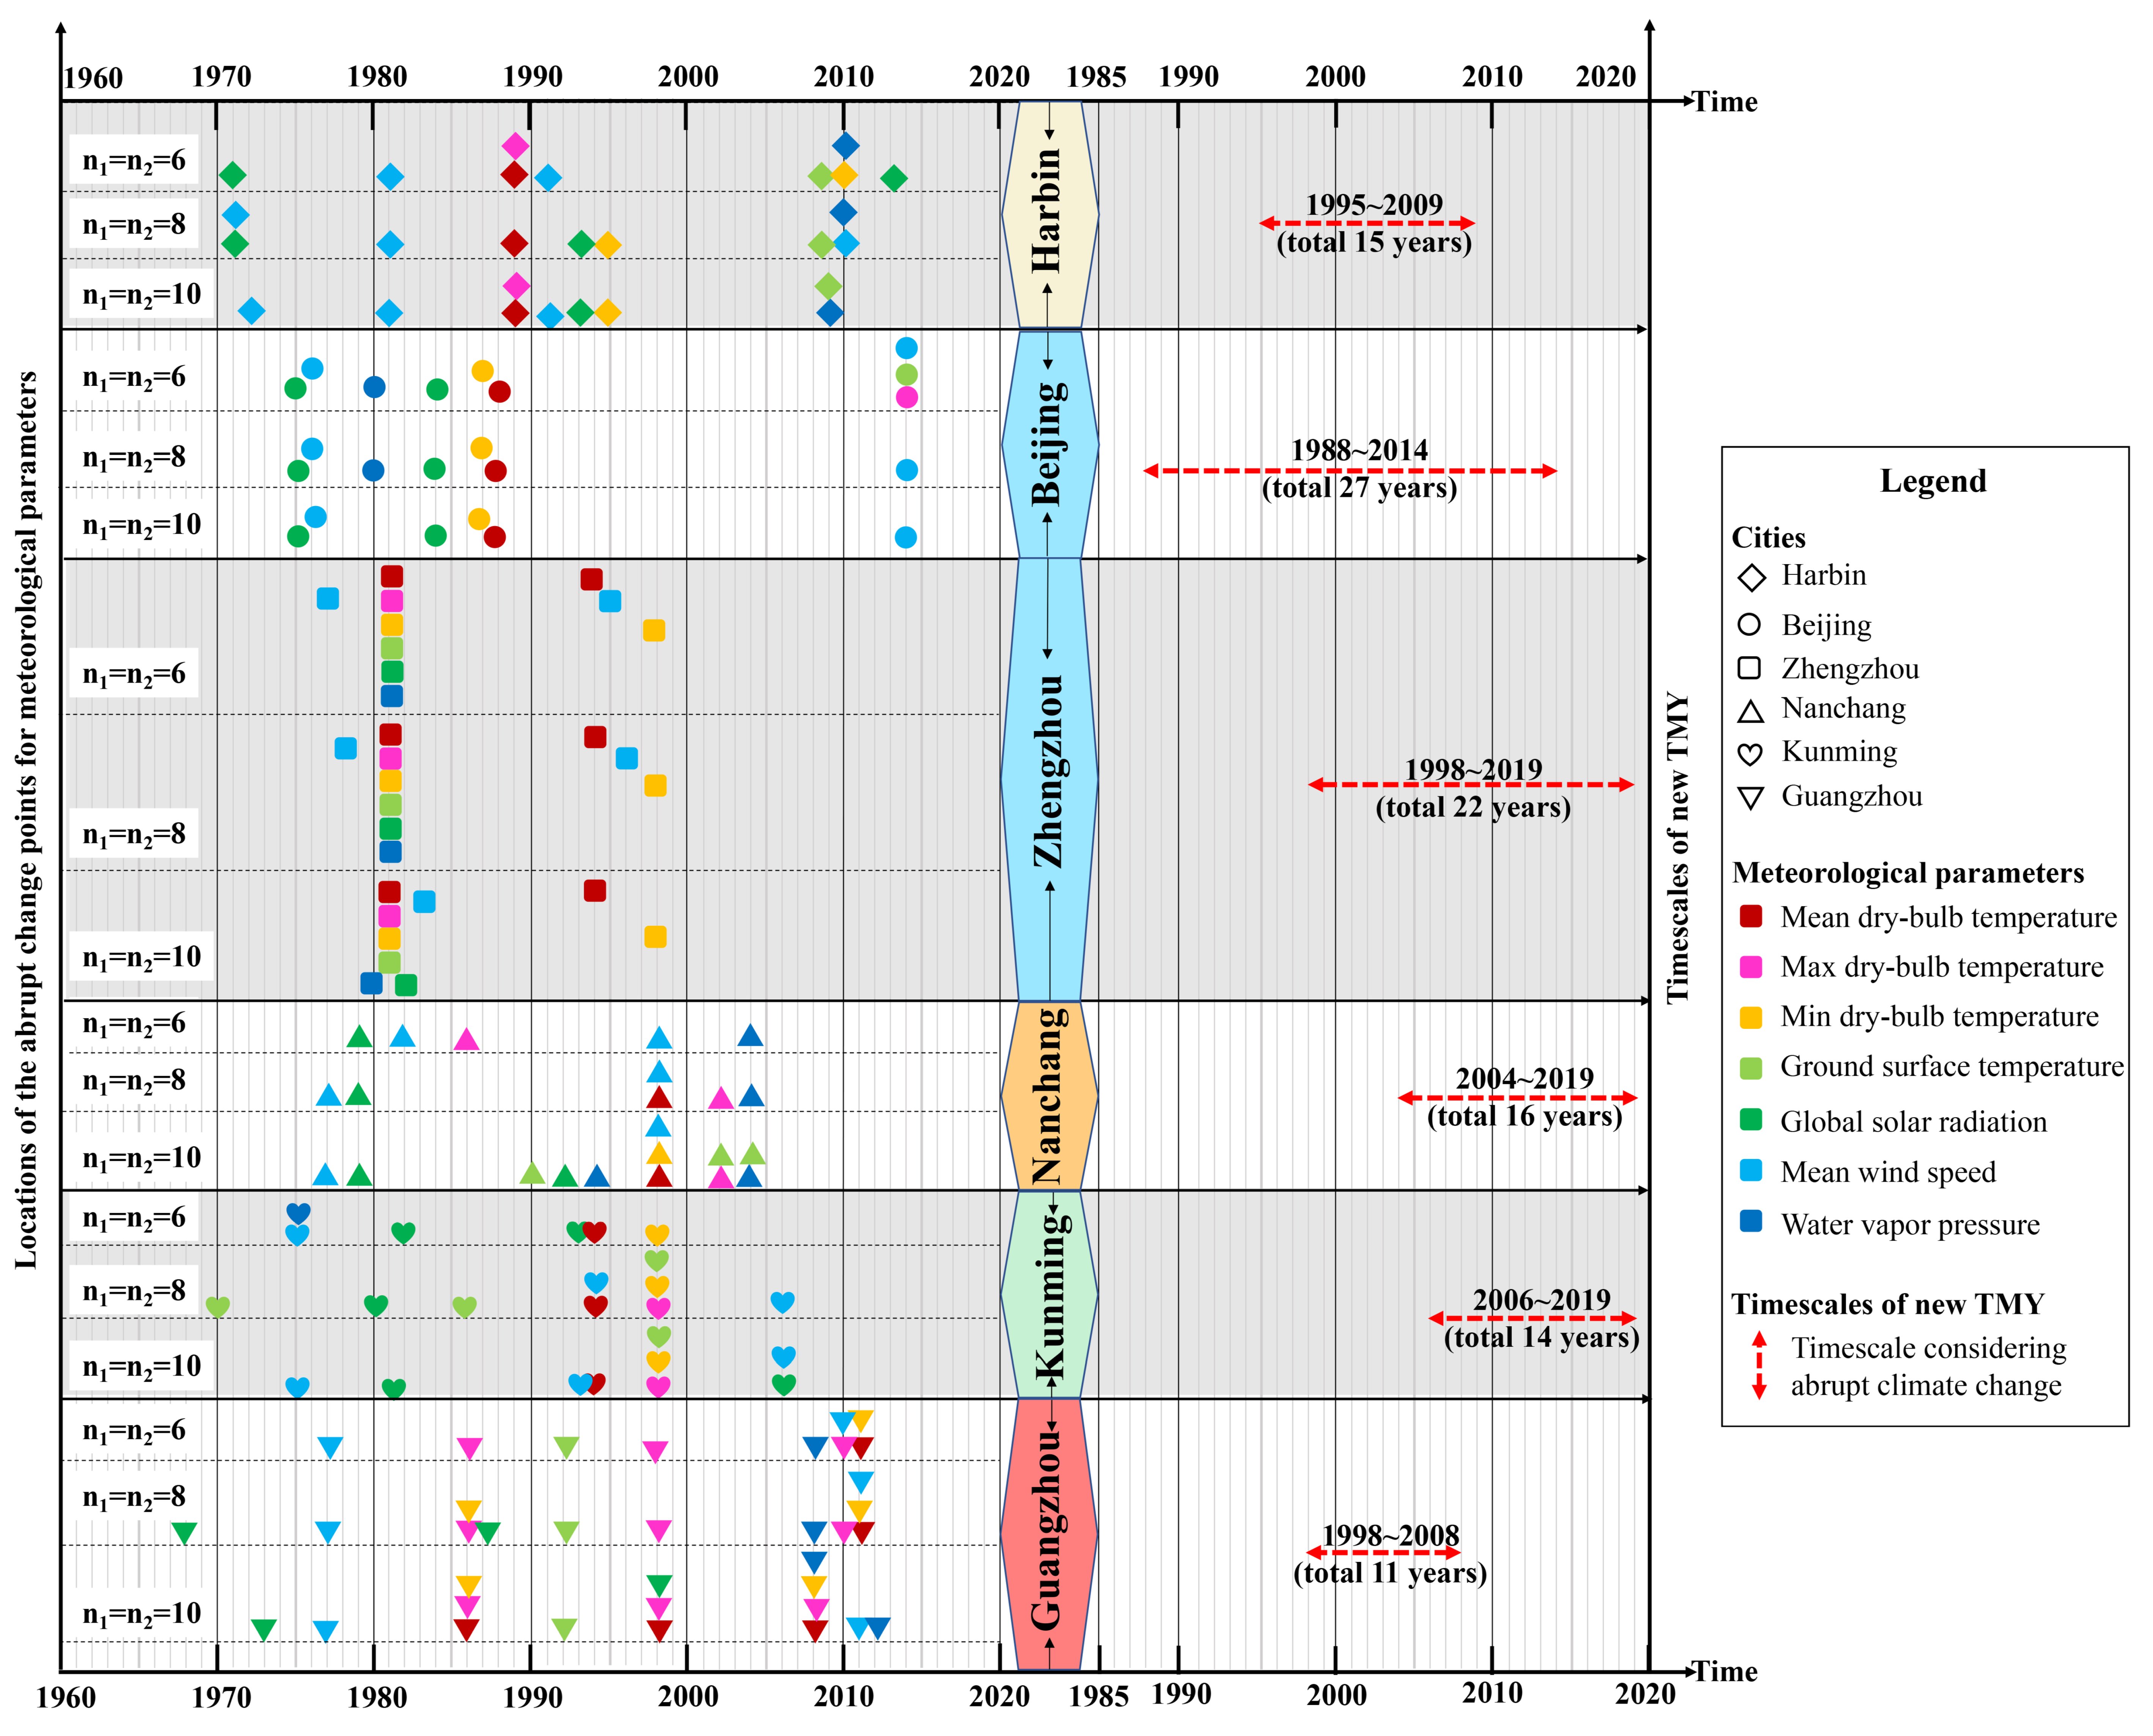
3.3. Timescales Selection for the Sample Cities in China

3.3.1. Using the Annual Average Data

As mentioned earlier, this study selected six cities from different climate zones in China as examples. Five different climate zones in China shown in Figure 3 were defined for building thermal design and indoor environment simulation, namely severe cold, cold, hot summer and cold winter, hot summer and warm winter, and temperate [52]. One city was selected within each of these climate zones in China in this study, namely Harbin (severe cold, 45°45′ N/126°46′ E), Zhengzhou (cold, 34°43′ N/113°39′ E), Nanchang (hot summer and cold winter, 28°40′ N/115°58′ E), Guangzhou (hot summer and warm winter, 23°08′ N/113°19′ E), and Kunming (temperate, 25°01′ N/102°41′ E), as shown in Figure 3. In addition, this study also analyzed the capital of China, Beijing (cold, 39°48′ N/116°28′ E). All meteorological parameters of a TMY were tested/examined with MTT method. The results are shown in Figure 4.
It is identified in Figure 5 that the abrupted climate changes happened concentratively in some years in some selected cities, such as Harbin within 1989–1995 and 2008–2010, Beijing within 1975–1988, Zhengzhou within 1978–1983, Nanchang within 1998–2004, Kunming within 1993–1998, Guangzhou within 1986–1998 and 2008–2012. Additionally, it also shows that the abrupt climate change in Zhengzhou occurred most concentratively in 1981. Therefore, the stable climate states with different periods were shaped before and after each abrupt climate change point, as shown in Figure 4. According to the timescale selection principles described previously, the new timescales for Harbin, Beijing, Zhengzhou, Nanchang, Kunming, and Guangzhou considering the impact of ACC are eventually defined as 1995–2009 (total 15 years), 1988–2014 (total 27 years), 1998–2019 (total 22 years), 2004–2019 (total 16 years), 2006–2019 (total 14 years), 1998–2008 (total 11 years), respectively.

3.3.2. Using the Monthly Average Data

Based the timescale selection principles in Section 3.1, the possible abrupt change points between 1960 and 2019 were analyzed based on the individual monthly average data of the sample cities. The results shown in Figure 5 demonstrate that the new timescales with the consideration of ACC based on the monthly average data were mostly within 2005–2019 for Harbin, Beijing, Zhengzhou, Nanchang, and Kunming, while Guangzhou was within 1990–2010.
This section has discussed the selection principles and practices of the timescales of the original meteorological records for analyzing and defining a TMY with the consideration of ACC. The next section will present an improved TMY development with the new timescales defined in this section to demonstrate the impact of ACC on a TMY development.

4. The Impact of ACC on a TMY Development

4.1. The TMY Development Method in China

With the economic development in China since 1980s, most cities have recorded meteorological data for more than 30 years. According to the characteristics of meteorological records obtained in China, the CSWD method was released in 2005 [10,11,12]. This CSWD method is referred in all relevant building energy efficiency standards and guidance in China today [52]. It is also applied in this study. The CSWD method includes nine steps shown in Figure 6. According to this method, the meteorological parameters include mean, max and min dry-bulb temperatures, water vapor pressures, global solar radiations, ground surface temperatures, and mean wind speeds. If all of the above meteorological parameters meet the logical judgment condition (∣ηi,m,y∣ < 1) in the step 6 in Figure 6, this month can be considered as a TMM. If a parameter does not meet the logic judgment condition, it needs to go to Step 7 to select the month with the smallest Dm as a TMM. When 12 TMMs from January to December are determined, the TMY can be developed.

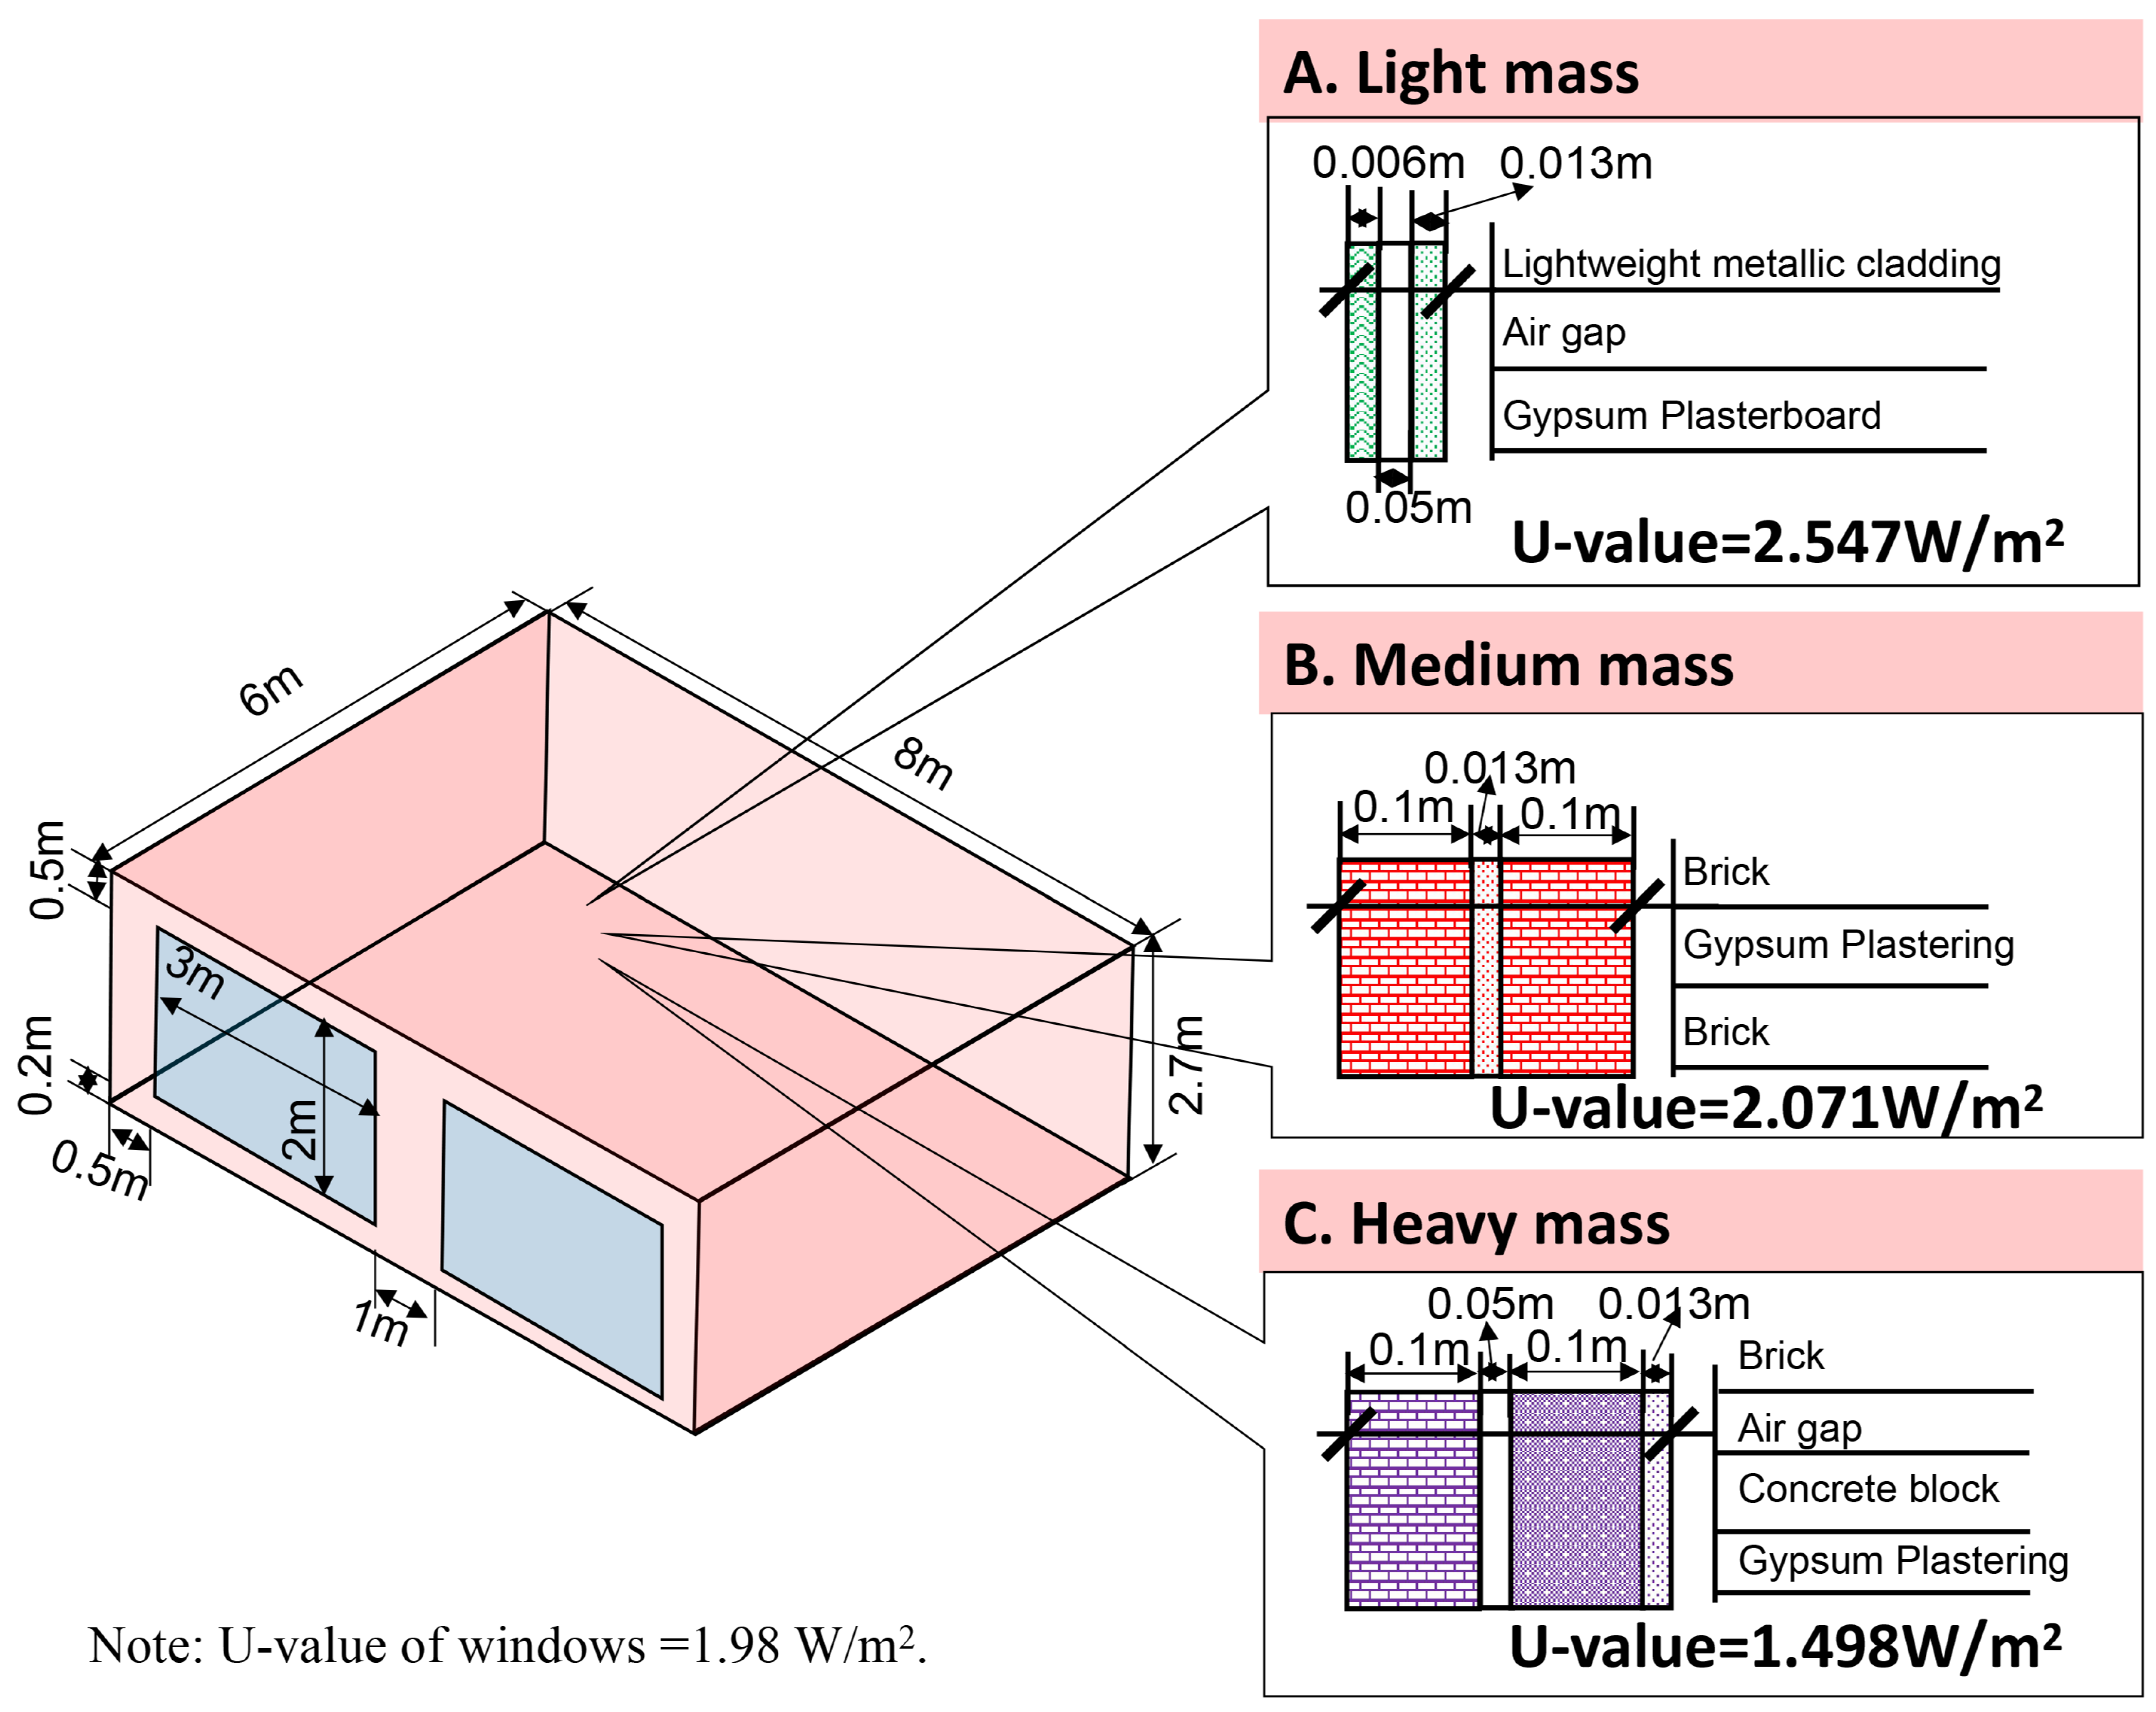
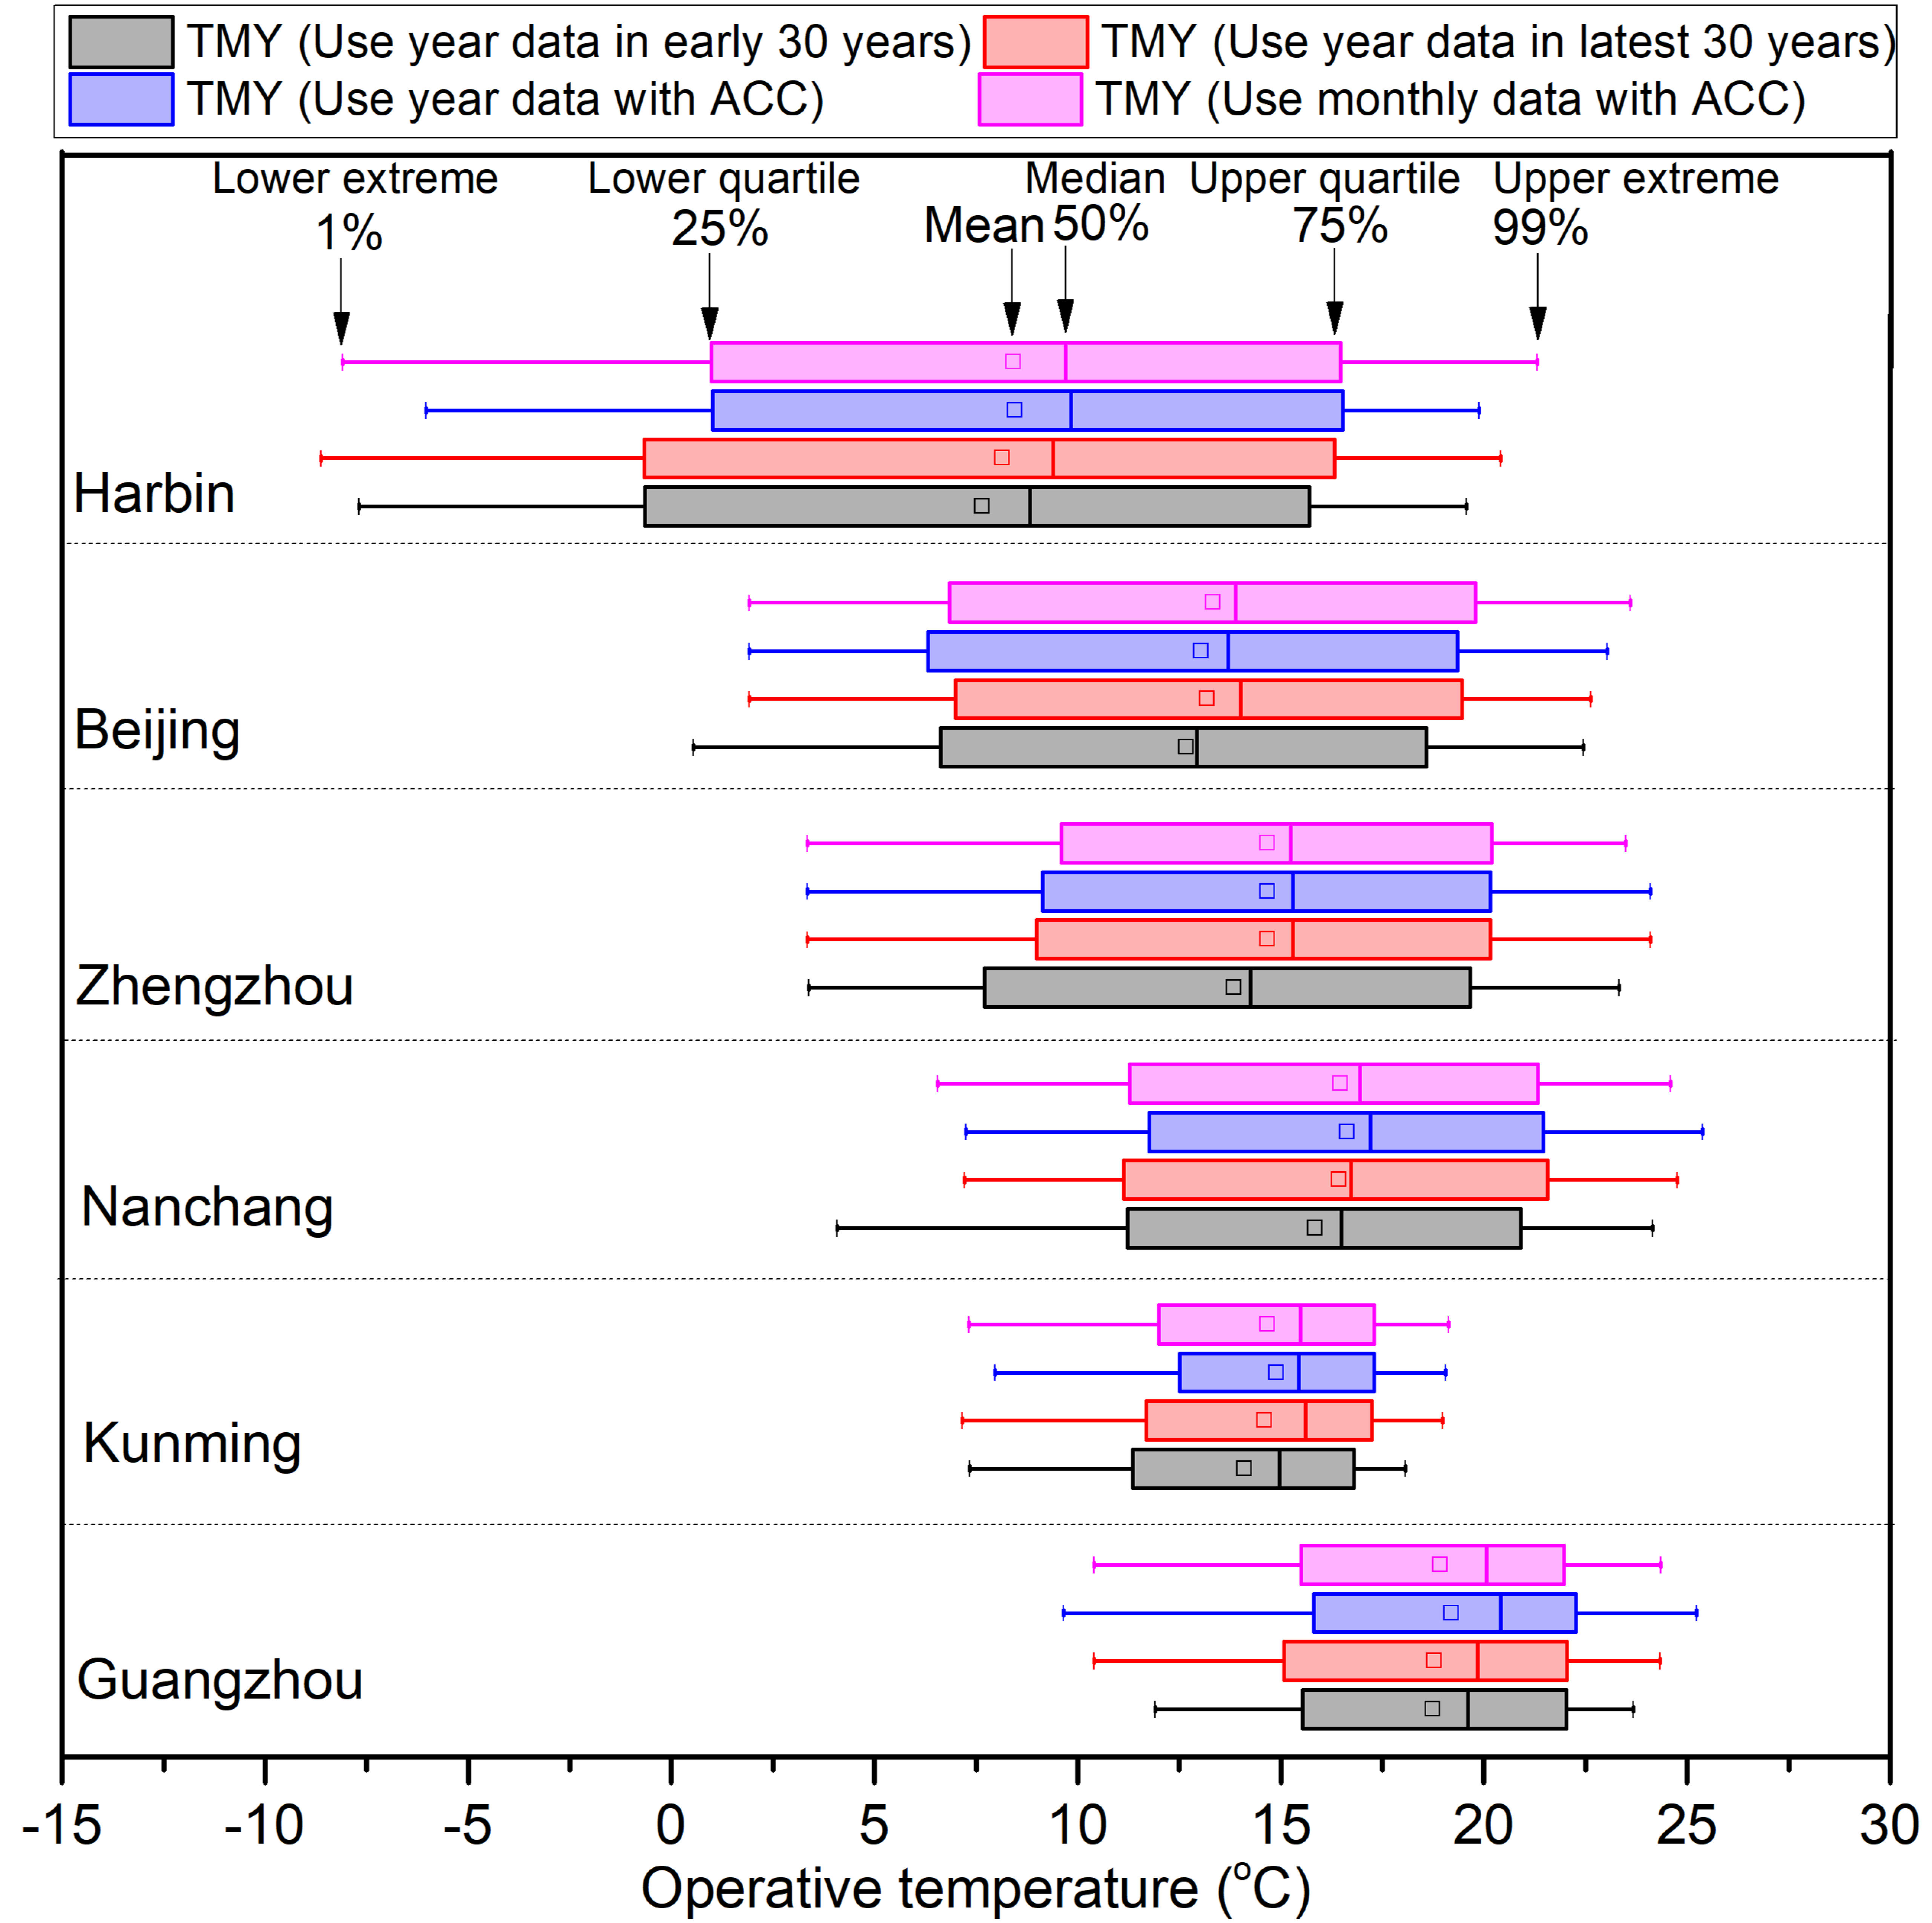
4.2. The Improved TMY Development for Six Selected Cities

Based on the new timescale obtained from the above analysis, the TMY data of six selected cities was updated (Table 1). The results in the Table 1 demonstrate most TMMs of each city with the ACC consideration (in each city, Row 1 is based on the year datasets; Row 3 is based on monthly datasets) and without the ACC consideration (Row 2 is based on latest 30 years datasets; Row 4 is based on early 30 years datasets) are mostly different. Only a small part of both TMMs (in bold font) with the ACC consideration are same as the latest 30 years of TMMs. There is no same TMM at all between the TMMs with ACC consideration and the TMMs between 1971 and 2003, which are still used by the current Chinese standards. This indicates that it is necessary to consider the ACC in the TMY development.
Figure 7 shows the annual average values of various meteorological parameters for a TMY development with the new datasets and the conversional dataset without the consideration of ACC. It reveals that the ACC obviously relates to the global solar radiation and the average wind speed of the TMY. However, the weighting factor of global solar radiation for the TMY development is defined as 8/16 in the standard CSWD procedures (Figure 6). This is an important factor in building energy simulations. Furthermore, the new TMY with the ACC consideration may affect the calculation results of building energy consumption, which will be discussed in the next section.

5. The Influence on Building Energy Consumption Simulations and Adaptive Thermal Comfort Temperatures

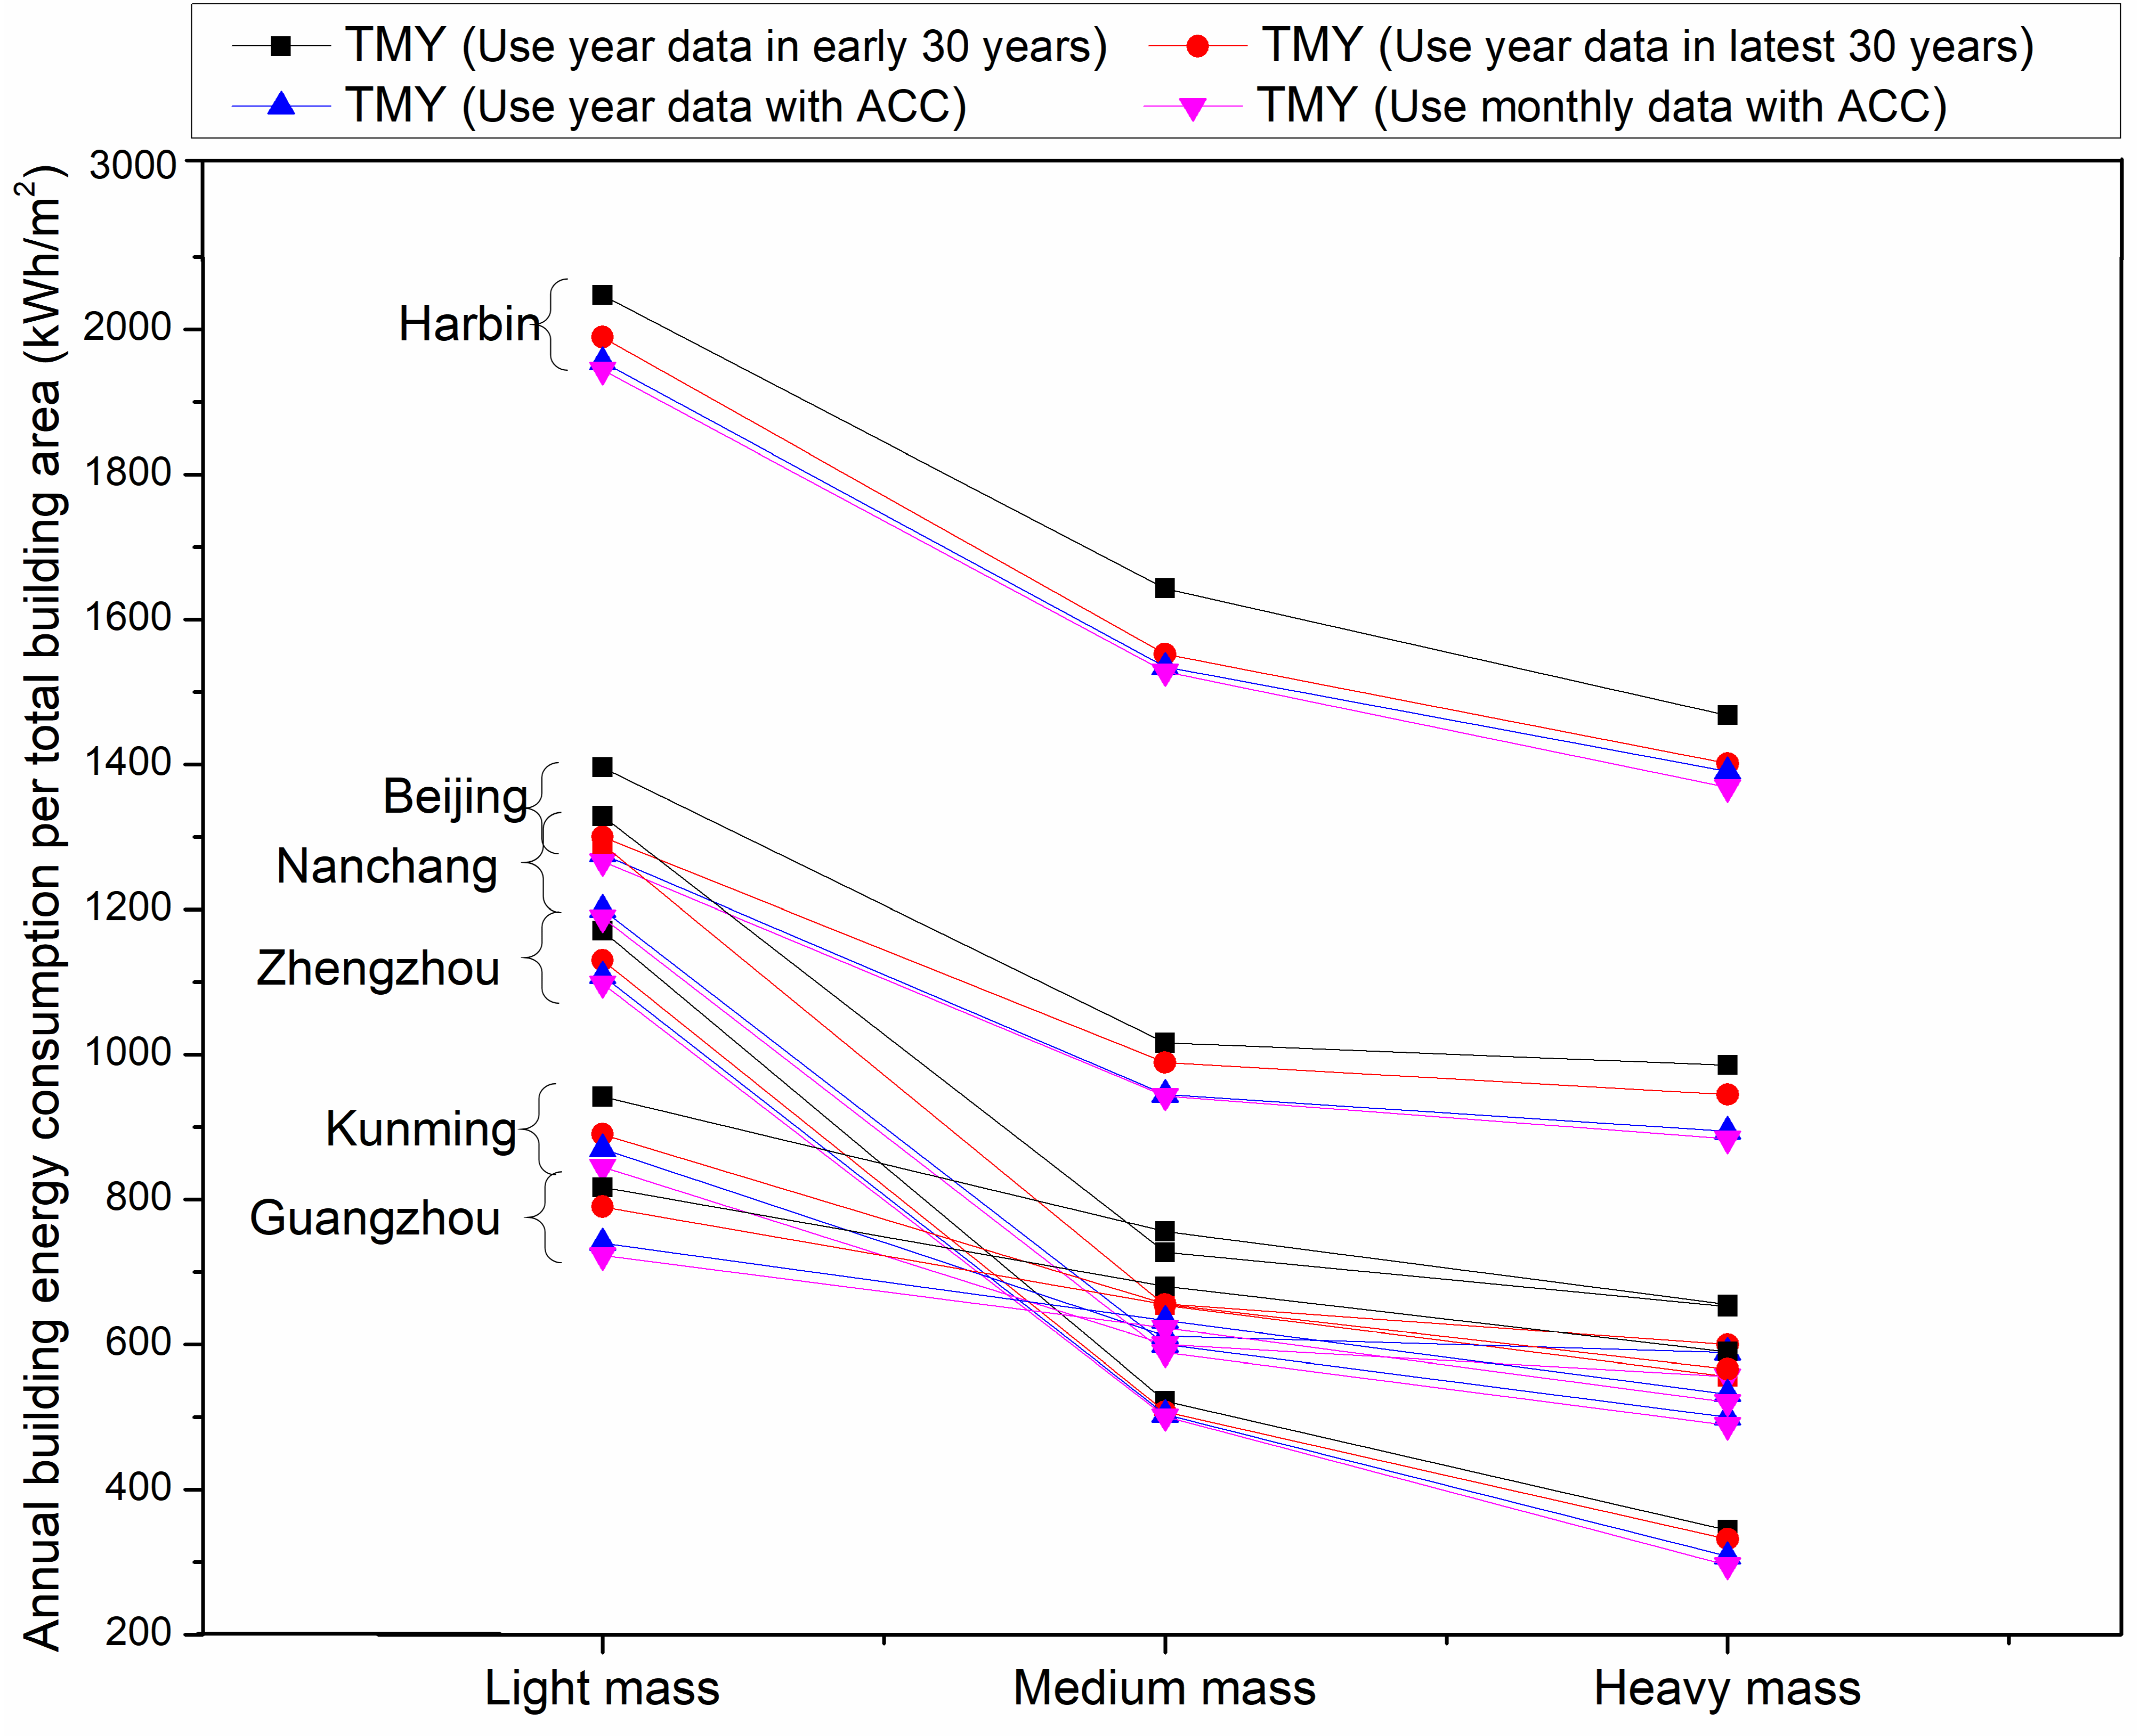
5.1. Impact on Building Energy Consumption Simulations

The changes of building energy consumption caused by ACC were analyzed by EnergyPlus software. The building model used in this study is EnergyPlus’ BESTEST (building energy simulation test) case 600 model [53], as shown in Figure 8, which is often used to compare and analyze energy performance of various climatic conditions [54]. This study uses the above standard building model to analyze the impact of an improved TMY on the energy consumption calculation results of a free-running building (it is a building without using any mechanical heating or cooling equipment) with different envelope thermal performances (light, medium, and heavy mass) in comparison to the conversional dataset without the consideration of ACC, as shown in Figure 9.
The following relative-mean-deviation Formula (1) is used to evaluate the difference of the building energy consumption outcomes between the new TMY and the conventional TMY.
Relative-mean-deviation= (QnewQold) × 100%/Qold
where Qnew is energy consumption based on the new TMY; kWh/m2; Qold is energy consumption based on data from1989 to 2019, kWh/m2.
Figure 9 shows that the relative-mean-deviation outcomes for six selected cities in China respectively were Harbin (0.7~1.7%), Beijing (1.8~5.3%), Zhengzhou (0.7~7.1%), Nanchang (6.9~10.0%), Kunming (1.8~6.7%), Guangzhou (3.3~6.0%). The results show a total 0.7-10% difference in range in these six cities.

5.2. Impact on Adaptive Thermal Comfort Temperatures

The indoor thermal comfort temperatures based on the six sample cities’ TMY are calculated with the Chinese adaptive thermal comfort calculation model (GB/T50785-2012) as Formula (2). It is mainly suitable for the adaptive thermal comfort evaluation of standard free-running buildings, but not for any other special building types such as cave dwellings (a type of cave houses in the Northwest China) and buildings with solar energy facilities. It is also based on conditions, including no indoor energic activity, people with normal clothes, and that the thermal comfort temperatures can be accepted by 75–90% occupiers. The outcomes of the calculations based on Formula (2) are shown in Figure 10.
Tn = 0.82Tout + 4.515 (14 °C < Tn < 31.1 °C)
where Tn is operative temperature, °C; Tout is running mean of outdoor temperature, °C.
It is revealed in Figure 10 that the impact of ACC on the adaptive operative temperatures in the six sample cities in different climate zones in China are various. The impacts are much less in Zhengzhou, but greater in Guangzhou. The results show an overall 0.15–0.42 °C difference in the thermal comfort analysis within different cities.

6. The Influence of ACC on Outdoor Design Parameters

A building design with heating and cooling load calculations usually requires accurate outdoor design meteorological data which can also reflect some extreme local climate conditions. It usually covers the following key parameters:
  • outdoor design temperature during heating periods, which is the fifth coldest daily temperature of each year over a TMY timescale.
  • outdoor design temperature for winter ventilation, which is the average outdoor temperature of the coldest month of each year over a TMY timescale.
  • outdoor calculated dry-bulb temperature during summer cooling period, which is the 50th hottest hourly average dry-bulb temperature of each year over a TMY timescale.
  • outdoor design temperature for summer ventilation, which is the monthly average mean temperature at 14 o’clock in the hottest month of each year over a TMY timescale.
Since the meteorological data obtained in this study are daily data, it is not suitable to the calculation of outdoor design temperatures in summer due to the above conditions. Hence, this is not covered here. The results of the outdoor design temperature calculation for heating and winter ventilation under the influence of ACC in the six cities in China are shown in Figure 11. It reveals that the influences of ACC on outdoor design temperature analysis are different in different cities. Harbin had a more severe impact than others. With the influence of ACC, the outdoor design temperature for heating increased from 0.1 to 1.3 °C, and the outdoor design temperature for ventilation increased from 0.1 to 1 °C. This indicates that the increase of outdoor design temperatures may have an impact on building design heating loads. According to the calculation formulas from the China’s energy-saving design standards (Formulas (3) and (4)), the thermal performance analysis for a standard building based on the new TMY shows that the heating reduces between 0.1 and 1 W/m2, and the energy for ventilation reduces between −0.3 and 1 W/m3. These impacts in Guangzhou and Harbin are more significant than other cities.
Qwinter-heating = U-value × A × (TnTe)
Qwinter-ventilation = Cp × ρ × V × (TnTo)
where Qwinter-heating is winter heating load, W; U-value is heat transfer coefficient, W/(m2·K); Qwinter-ventilation is winter ventilation load, W; A is area, m2; Tn is indoor design temperature, °C; Te is outdoor design temperature for heating, °C; Cp is specific heat capacity, J/(kg·K); V is ventilation volume, m3; To is outdoor design temperature for winter ventilation, °C; ρ is air density, kg/m3.

7. Conclusions

This study depicts an innovative method to develop typical meteorological year (TMY) by identifying and excluding the years with abrupt climate changes (ACC) with the meteorological records of six cities from different climate zones in China. It discusses the principle to select the timescales of the original meteorological records with the consideration of ACC and presents the details of the TMYs and TMMs development methods and processes with various datasets (year or monthly, hourly and four-capture per day). The study demonstrates that the TMMs with and without the consideration of ACCs are very different in each city, so that the TMYs are very different consequently. The paper also describes several building design simulations and calculations with the new TMYs and demonstrates that the new TMYs datasets excluding the ACC years will end up with less energy consumption in buildings.
This study presents a unique experimental research to develop a TMY with the consideration of the ACC impact. It has verified that abrupt climate changes have a significant impact on the TMY development. This is an exploration to pursue a more realistic TMY, which may eventually improve building design simulations and predictions in building design practices.
This study only takes six cities from different climate zones in China as examples, and it finds that the abrupt change points are closely related to the climate characteristics of each city. This research could be expanded and further verified with climate records of more cities in China and worldwide. Today, TMY is an essential data factor used in the building services design guidance in China and other counties, and this study has demonstrated that the improved TMY with the consideration of ACC will contribute to reduce the energy consumption of buildings. As this research only adopts the CSWD method to develop the TMMs and TMYs, the further study could exam if other TMY methods mentioned in Section 1 could end up with different outcomes of TMMs or TMY with the exclusion of ACC. Although it has been clarified earlier that the Moving t-test method has been reorganized as a most appropriate method to identify the ACC points, it may also be worthwhile to try different methods reviewed in Section 2.

Author Contributions

X.F.: writing—original draft preparation, conceptualization, methodology, software, validation, visualization; writing—review and editing; B.C.: writing—original draft preparation, methodology, supervision, project administration, funding acquisition, project administration; writing—review and editing; C.F.: writing—original draft preparation, methodology, supervision; writing—review and editing; L.L.: resources, data curation. All authors have read and agreed to the published version of the manuscript.

Funding

This study was supported by National Science Technology Major Project of China during the 13th Five-year Plan Period, grant number 2018YFD1100701; National Natural Science Foundation of China, grant number 51978121.

Acknowledgments

I acknowledge support by National Meteorological Information Center of China.

Conflicts of Interest

The authors declare no conflict of interest.

Nomenclature

TMYTypical meteorological year
TMMsTypical meteorological months
CSWDChinese standard weather database method
TPCYTypical principal component years method
CTYWChinese typical year weather method
DFMsDiffuse fraction models for the hourly solar radiation
MTTMoving t-test method
ACCAbrupt climate changes
BESTESTBuilding energy simulation test
iMeteorological parameters
mMonth
YYear
KiWeighting factors
ΡAir density, kg/m3
QnewEnergy consumption based on new timescales of raw data; kWh/m2
QoldEnergy consumption based on 1989-2019, kWh/m2
TeOutdoor design temperature for heating, °C
TnOperative temperature, °C
ToutRunning mean of outdoor temperature, °C
TnIndoor design temperature, °C
ToOutdoor design temperature for winter ventilation, °C
AArea, m2
Qwinter-heatingWinter heating load, W
VVentilation volume, m3
U-valueHeat transfer coefficient, W/(m2·K)
Qwinter-ventilationWinter ventilation load, W
CpSpecific heat capacity, J/(kg·K)

Appendix A

The Moving t-test method is to identify the significant difference between two data sequences to define an abrupt climate change [55]. It includes the following steps.
Step 1: For n-sample series of a datum point, two data samples (n1, n2) can be acquired before and after a datum point. The subsequence x1 of the n1 samples is the data sequence before the datum point with a fixed length, and the subsequence x2 of the n2 samples is the one after the datum point with a fixed length as well. Then, calculate the variance (s1, s2) of each subsequence. The statistic t is given in Formula (A1).
t y = x 1 ¯ x 2 ¯ n 1 s 1 2 + n 2 s 2 2 n 1 + n 2 2 ( 1 n 1 + 1 n 2 )
Step 2: Determine the lengths of two subsequences before and after the datum point, usually use a same length, that is n1 = n2.
Step 3: Move the datum point chronologically to get a new data sequence ti, where i=1, 2, … n−(n1+n2)−1.
Step 4: Given the significance level α (1% for this study), the null hypothesis of no difference will be rejected if |t| > tα.

References

  1. Givoni, B. Climate Considerations in Building and Urban Design, 1st ed.; John Wiley & Sons: New York, NY, USA, 1998; pp. 12–30. [Google Scholar]
  2. Herrera, M.; Natarajan, S.; Coley, D.A.; Kershaw, T.; Ramallo-González, A.P.; Eames, M.; Fosas, D.; Wood, M. A review of current and future weather data for building simulation. Build. Serv. Eng. Res. Technol. 2017, 38, 602–627. [Google Scholar] [CrossRef] [Green Version]
  3. Chan, A.L.S. Generation of typical meteorological years using genetic algorithm for different energy systems. Renew. Energy 2016, 90, 1–13. [Google Scholar] [CrossRef]
  4. David, M.; Adelard, L.; Lauret, P.; Garde, F. A method to generate Typical Meteorological Years from raw hourly climatic databases. Build. Environ. 2010, 45, 1722–1732. [Google Scholar] [CrossRef]
  5. Janjai, S.; Deeyai, P. Comparison of methods for generating typical meteorological year using meteorological data from a tropical environment. Appl. Energy 2009, 86, 528–537. [Google Scholar] [CrossRef]
  6. Zang, H.; Xu, Q.; Wang, W.; Chen, K. A step-by-step application of Danish method for generation of typical meteorological years of China. J. Renew. Sustain. Energy 2013, 5, 053145. [Google Scholar] [CrossRef]
  7. Festa, R.; Ratto, C.F. Proposal of a numerical procedure to select Reference Years. Sol. Energy 1993, 50, 9–17. [Google Scholar] [CrossRef]
  8. Zang, H.; Xu, Q.; Bian, H. Generation of typical solar radiation data for different climates of China. Energy 2012, 38, 236–248. [Google Scholar] [CrossRef]
  9. Hall, I.J.; Prairie, R.R.; Anderson, H.E.; Boes, E.C. Generation of a typical meteorological year. In Proceedings of the 1978 Annual Meeting of the American Section of the International Solar Energy Society. Conference: Analysis for Solar Heating and Cooling, Sandia Labs., Albuquerque, NM, USA, 27 June 1978; pp. 669–671, report number: SAND-78-1096C.; CONF-780639-1. [Google Scholar]
  10. Lu, S.; Emura, K.; Igawa, N. Statistical characteristics of five sets of Standard Year Weather Data in China. Archit. Sci. Rev. 2010, 53, 415–428. [Google Scholar] [CrossRef]
  11. Center, N.M.I. Building Thermal Environment Analysis Dedicated Meteorological Data Sets of China; China Architecture & Building Press: Beijing, China, 2005; pp. 1–165. [Google Scholar]
  12. Sun, J.; Li, Z.; Xiao, F. Analysis of Typical Meteorological Year selection for energy simulation of building with daylight utilization. Procedia Eng. 2017, 205, 3080–3087. [Google Scholar] [CrossRef]
  13. Zhang, Q. Development of the typical meteorological database for Chinese locations. Energy Build. 2006, 38, 1320–1326. [Google Scholar] [CrossRef]
  14. Zhang, Q.; Huang, J.; Yang, H. Development of the typical and design weather data for Asian locations. J. Asian Archit. Build. Eng. 2002, 1, 2_49–2_55. [Google Scholar] [CrossRef] [Green Version]
  15. Zang, H.; Wang, M.; Huang, J.; Wei, Z.; Sun, G. A Hybrid Method for Generation of Typical Meteorological Years for Different Climates of China. Energies 2016, 9, 1094. [Google Scholar] [CrossRef] [Green Version]
  16. Kalogirou, S.A. Generation of typical meteorological year (TMY-2) for Nicosia, Cyprus. Renew. Energy 2003, 28, 2317–2334. [Google Scholar] [CrossRef]
  17. Chan, A.L.S.; Chow, T.T.; Fong, S.K.F.; Lin, J.Z. Generation of a typical meteorological year for Hong Kong. Energy Convers. Manag. 2006, 47, 87–96. [Google Scholar] [CrossRef]
  18. Pissimanis, D.; Karras, G.; Notaridou, V.; Gavra, K. The generation of a “typical meteorological year” for the city of Athens. Sol. Energy 1988, 40, 405–411. [Google Scholar] [CrossRef]
  19. Huang, K.-T. Identifying a suitable hourly solar diffuse fraction model to generate the typical meteorological year for building energy simulation application. Renew. Energy 2020, 157, 1102–1115. [Google Scholar] [CrossRef]
  20. Gazela, M.; Mathioulakis, E. A new method for typical weather data selection to evaluate long-term performance of solar energy systems. Sol. Energy 2001, 70, 339–348. [Google Scholar] [CrossRef]
  21. de Miguel, A.; Bilbao, J. Test reference year generation from meteorological and simulated solar radiation data. Sol. Energy 2005, 78, 695–703. [Google Scholar] [CrossRef]
  22. Liu, Y.; Wan, K.K.W.; Li, D.H.W.; Lam, J.C. A new method to develop typical weather years in different climates for building energy use studies. Energy 2011, 36, 6121–6129. [Google Scholar] [CrossRef]
  23. Guo, S.; Yan, D.; Hong, T.; Xiao, C.; Cui, Y. A novel approach for selecting typical hot-year (THY) weather data. Appl. Energy 2019, 242, 1634–1648. [Google Scholar] [CrossRef] [Green Version]
  24. Jentsch, M.F.; Bahaj, A.S.; James, P.A.B. Climate change future proofing of buildings—Generation and assessment of building simulation weather files. Energy Build. 2008, 40, 2148–2168. [Google Scholar] [CrossRef]
  25. Mingming, X.; Mingcai, L.; Ji, L.; Jingfu, C. Climate Change Impacts on Typical Meteorological Year and Energy Consumption for Buildings in Tianjin, A Large City in Northern China. Clim. Chang. Res. 2017, 13, 494–501. [Google Scholar] [CrossRef]
  26. Berardi, U.; Jafarpur, P. Assessing the impact of climate change on building heating and cooling energy demand in Canada. Renew. Sustain. Energy Rev. 2020, 121, 109681. [Google Scholar] [CrossRef]
  27. Siu, C.Y.; Liao, Z. Is building energy simulation based on TMY representative: A comparative simulation study on doe reference buildings in Toronto with typical year and historical year type weather files. Energy Build. 2020, 211, 109760. [Google Scholar] [CrossRef]
  28. Bai, L.; Wang, S. Definition of new thermal climate zones for building energy efficiency response to the climate change during the past decades in China. Energy 2019, 170, 709–719. [Google Scholar] [CrossRef]
  29. Liu, Q.; Wan, S.; Gu, B. A Review of the Detection Methods for Climate Regime Shifts. Discret. Dyn. Nat. Soc. 2016, 2016, 1–10. [Google Scholar] [CrossRef] [Green Version]
  30. Ling, Y.; Tang, W.; Wang, Y.; Tian, F.; Yuan, L.; Ye, M. Evidence of Abrupt Climate Change during the Mid- to Late-Holocene Recorded in a Tropical Lake, Southern China. Acta Geol. Sin. Engl. Ed. 2020, 94, 1187–1193. [Google Scholar] [CrossRef]
  31. Alley, R.B.; Marotzke, J.; Nordhaus, W.D.; Overpeck, J.T.; Peteet, D.M.; Pielke, R.A.; Pierrehumbert, R.T.; Rhines, P.B.; Stocker, T.F.; Talley, L.D. Abrupt climate change. Science 2003, 299, 2005–2010. [Google Scholar] [CrossRef] [Green Version]
  32. Zhao, C.; Cui, Y.; Zhou, X.; Wang, Y. Evaluation of performance of different methods in detecting abrupt climate changes. Discret. Dyn. Nat. Soc. 2016, 2016, 1–14. [Google Scholar] [CrossRef] [Green Version]
  33. Lorenz, E.N. Climatic determinism. In Causes of Climatic Change. Meteorological Monographs; Mitchell, J.M., Ed.; American Meteorological Society: Boston, MA, USA, 1968; Volume 8, pp. 1–3. [Google Scholar] [CrossRef]
  34. Thom, R. Stabilité Structurelle et Morphogénèse–Essai d’une Théorie Générale des Modèles; Benjamin: New York, NY, USA, 1972; p. 384. [Google Scholar] [CrossRef]
  35. Goossens, C.; Berger, A. How to recognize an abrupt climatic change? In Abrupt Climatic Change; Berger, W.H., Labeyrie, L.D., Eds.; NATO ASI Series (Series C: Mathematical and Physical Sciences); Springer: Dordrecht, The Netherlands, 1987; Volume 216, pp. 31–45. [Google Scholar] [CrossRef]
  36. Fu, C.; Wang, Q. The Definition and Detection of the Abrupt Climate Change. Chin. J. Atmos. Sci. 1992, 16, 482–493. [Google Scholar]
  37. Shihuang, Z.; Piyuan, Z. Abrupt change study in climate change. Adv. Earth Sci. 1989, 4, 47–54. [Google Scholar]
  38. McCarl, B.A.; Hertel, T.W. Climate Change as an Agricultural Economics Research Topic. Appl. Econ. Perspect. Policy 2018, 40, 60–78. [Google Scholar] [CrossRef]
  39. Vitkina, T.y.I.; Veremchuk, L.V.; Mineeva, E.E.; Gvozdenko, T.y.A.; Antonyuk, M.V.; Novgorodtseva, T.y.P.; Grigorieva, E.A. The influence of weather and climate on patients with respiratory diseases in Vladivostok as a global health implication. J. Environ. Health Sci. Eng. 2019, 17, 907–916. [Google Scholar] [CrossRef] [PubMed]
  40. Thom, R. Stabilité structurelle et morphogenèse. Poetics 1974, 3, 7–19. [Google Scholar] [CrossRef]
  41. Beaulieu, C.; Chen, J.; Sarmiento, J.L. Change-point analysis as a tool to detect abrupt climate variations. Philosophical Transactions of the Royal Society A: Mathematical. Phys. Eng. Sci. 2012, 370, 1228–1249. [Google Scholar] [CrossRef] [Green Version]
  42. Yamamoto, R.; Iwashima, T.; Hoshiai, M. An analysis of climatic jump. J. Meteorol. Soc. Jpn. Ser. II 1986, 64, 273–281. [Google Scholar] [CrossRef] [Green Version]
  43. Nyikadzino, B.; Chitakira, M.; Muchuru, S. Rainfall and runoff trend analysis in the Limpopo river basin using the Mann Kendall statistic. Phys. Chem. Earth Parts A/B/C 2020, 117, 102870. [Google Scholar] [CrossRef]
  44. Mallakpour, I.; Villarini, G.J.H.S.J. A simulation study to examine the sensitivity of the Pettitt test to detect abrupt changes in mean. Hydrol. Sci. J. 2016, 61, 245–254. [Google Scholar] [CrossRef] [Green Version]
  45. Xie, P.; Gu, H.; Sang, Y.-F.; Wu, Z.; Singh, V.P. Comparison of different methods for detecting change points in hydroclimatic time series. J. Hydrol. 2019, 577, 123973. [Google Scholar] [CrossRef]
  46. Yin, Y.; Liu, H.; Yi, X.; Liu, W.; Lin, G.-F. Spatiotemporal Variation and Abrupt Change Analysis of Temperature from 1960 to 2012 in the Huang-Huai-Hai Plain, China. Adv. Meteorol. 2015, 2015, 643493. [Google Scholar] [CrossRef] [Green Version]
  47. Jiang, D.; Zhang, L. A method to detect abrupt change based on coefficient of variation of traffic flow time series. Shandong Jiaotong Keji 2017, 003, 81–83. [Google Scholar] [CrossRef]
  48. Argiriou, A.; Lykoudis, S.; Kontoyiannidis, S.; Balaras, C.A.; Asimakopoulos, D.; Petrakis, M.; Kassomenos, P. Comparison of methodologies for tmy generation using 20 years data for Athens, Greece. Sol. Energy 1999, 66, 33–45. [Google Scholar] [CrossRef]
  49. Skeiker, K. Comparison of methodologies for TMY generation using 10 years data for Damascus, Syria. Energy Convers. Manag. 2007, 48, 2090–2102. [Google Scholar] [CrossRef]
  50. Liu, J.; Li, H.; Lü, K.; Yang, L.; Liu, J. Effect of different periods of record on the selection results of typical meteorological year. Ind. Constr. 2020, 50, 95–100+203. Available online: https://kns.cnki.net/kcms/detail/11.2068.TU.20200611.1633.002.html (accessed on 12 June 2020).
  51. Wilcox, S.; Marion, W. Users Manual for TMY3 Data Sets; Technical Report: NREL/TP-581-43156; National Renewable Energy Laboratory: Golden, CO, USA, 2008; pp. 1–23. Available online: https://library.um.edu.mo/ebooks/b28020108.pdf (accessed on 1 May 2008).
  52. Ministry of Housing and Urban-Rural Development of the People’s Republic of China. Design Standard for Energy Efficiency of Residential Buildings in Severe Cold and Cold Zones (JGJ26-2018); China Architecture & Building Press: Beijing, China, 2018; pp. 37–38.
  53. Neymark, J.; Judkoff, R.; Knabe, G.; Le, H.T.; Dürig, M.; Glass, A.; Zweifel, G. Applying the building energy simulation test (BESTEST) diagnostic method to verification of space conditioning equipment models used in whole-building energy simulation programs. Energy Build. 2002, 34, 917–931. [Google Scholar] [CrossRef]
  54. Wurtz, E. Comparison of untypical meteorological years (umy) and their influence on building energy performance simulations. In Proceedings of the 13th International Conference of the International-Building-Performance-Simulation-Association (IBPSA), Chambery, France, 26–28 August 2013; pp. 1414–1421. Available online: https://www.aivc.org/sites/default/files/p_1466.pdf (accessed on 12 June 2020).
  55. Weinand, J.M. Reviewing Municipal Energy System Planning in a Bibliometric Analysis: Evolution of the Research Field between 1991 and 2019. Energies 2020, 13, 1367. [Google Scholar] [CrossRef] [Green Version]
Figure 1. Application case of the Moving t-test method (MTT) method. (a) t distribution; (b) Mean dry-bulb temperatures tested by MTT method.
Energies 13 06531 g001
Figure 2. The impact of the quality of meteorological records on the analysis results of abrupt climate changes (ACC) (Beijing). (a) The abrupt change points based on annual average data; (b) the abrupt change points based on monthly average data.
Energies 13 06531 g002
Figure 3. Map showing the climate zones of China and the six selected cities.
Energies 13 06531 g003
Figure 4. ACC analysis results of all meteorological parameters of a typical meteorological year (TMY).
Energies 13 06531 g004
Figure 5. Determining the timescale of six selected cities.
Energies 13 06531 g005
Figure 6. The procedures of the Chinese standard weather database (CSWD) method.
Energies 13 06531 g006
Figure 7. Compare the difference of TMY considering ACC or not.
Energies 13 06531 g007
Figure 8. Geometry of BESTEST case 600 in the EnergyPlus simulation.
Energies 13 06531 g008
Figure 9. The impact of TMY considering ACC on building energy consumption.
Energies 13 06531 g009
Figure 10. Adaptive thermal comfort temperatures of six selected cities in China.
Energies 13 06531 g010
Figure 11. Influence of ACC on outdoor design parameters.
Energies 13 06531 g011
Table 1. Summary of the 12 typical meteorological months (TMMs) using different timescales for six selected cities of China.
TimescaleJan.Feb.Mar.Apr.MayJun.Jul.Aug.Sep.Oct.Nov.Dec.
(a) Harbin city
200419972000200120041996200219972004200620031999
200820121995201120042018201320092009200920152001
200820152011201120011995201220092009200920082008
198219711982198519861971199619991995198719861993
(b) Beijing city
201219912004200019891988200720082010201319891990
201219972004199720102015201120082015201320071990
200720181993199720162012200020002015201320131990
199819871996198319801984199119831981199919771999
(c) Zhengzhou city
201820062009200820162001200220082001201120142003
201619972013200820162008201220082000200820072013
201620152013200819962013199020082008200820072003
197419941982198619991995199519791974198420021990
(d) Nanchang city
200420162015201520042007201020072013201220142006
200420012006200320041993200620072013201520032006
201820172006200320042007200620072016201220082006
198319951979200119781993198619951991200219851976
(e) Kunming city
201820092014200620132009201420122018201420132006
200320162012201119932009200020012004200020051993
200320072014201120162009201420102018201420142014
199019761988199119721984198119951990197420011991
(f) Guangzhou city
200020022003200620002007200820022007199820032004
199620002009199719932011200020072003199420032010
200820002003200620001990199820002003199920031998
197819911982199719831985198619852002198619991996
Note: ① Use year data with ACC; ② Use year data in latest 30 years; ③ Use monthly data with ACC; ④ Use year data in early 30 years.
Publisher’s Note: MDPI stays neutral with regard to jurisdictional claims in published maps and institutional affiliations.

