Article

Technical and Economic Analysis of the External Surface Heating System on the Example of a Car Park

by
Krzysztof Nowak
* and
Sławomir Rabczak
The Faculty of Civil and Environmental Engineering and Architecture, Rzeszow University of Technology, 35-959 Rzeszow, Poland
*
Author to whom correspondence should be addressed.
Energies 2020, 13(24), 6530; https://doi.org/10.3390/en13246530
Submission received: 20 November 2020 / Revised: 5 December 2020 / Accepted: 8 December 2020 / Published: 10 December 2020

Abstract

:
In winter, for our own safety, as well as for the comfort of the user, we are obliged to remove or mitigate the defects related to the accumulation of snow and ice on flat surfaces, such as: pavements, stairs, driveways, parking lots, roofs, squares, or sports fields. Snow and ice from these surfaces can be removed by a variety of methods. Chemical, mechanical, or heating methods are most often used. Mechanical and manual methods cannot always be used. They also often do not allow the complete removal of snow and ice from the surface. In chemical methods, the chemicals used can have a negative impact on the environment and the surface itself. Heating external surfaces using electric heating cables or liquid-filled pipes is one of the safest and most effective ways to remove snow and ice from the available methods. The article presents a technical concept of a car park heating system with the use of various heating systems. The main thesis of the work is the possibility of using heating systems to maintain the quality of external parking spaces in winter. The authors tried to prove that it is possible to use a number of heating systems based on commonly known energy carriers for this purpose. The concept was made for the conditions prevailing in Poland. The systems were compared in financial and ecological terms. The following systems were analyzed: electric heating, heating with the use of a heat pump with a vertical ground heat exchanger, and liquid heating with various heat sources (including heat from the district heating network, hard coal boiler, biomass boiler, fuel oil boiler, natural gas boiler). From a cognitive point of view, it was interesting to examine whether the proposed installation with a heat pump is technically feasible and economically and ecologically justified.

Graphical Abstract

1. Introduction

The accumulation of snow and ice on outdoor surfaces in winter is a messy phenomenon. This may affect the usability of a given surface, the quality of use, but also safety. In some cases, snow and ice can damage the surface, disabling it completely. In the event of using sports facilities in winter, appropriate conditions must be ensured. In the case of football fields, strict requirements in this matter are issued by International Federation of Association Football (FIFA) and Union of European Football Associations (UEFA). It is important to ensure good conditions for the grass to grow, which in the event of an update minimizes the risk of injury. It is also important that the condition of the pitch turf does not adversely affect the course of the sports event [1,2]. In the case of roofs, it is important that the snow does not damage the structure under its weight, which seriously affects safety. The use of parking lots or squares is much easier and safer when the surface is free of snow and ice [3,4].
Snow and ice from these surfaces can be removed by a variety of methods. Chemical, mechanical or heating methods are most often used. Mechanical and manual methods cannot always be used. They also often do not allow the complete removal of snow and ice from the surface. In chemical methods, the chemicals used can have a negative impact on the environment and the surface itself. Heating external surfaces using electric heating cables or liquid-filled pipes is one of the safest and most effective ways to remove snow and ice from the available methods [5,6,7,8,9]. There are many types of outdoor heating systems. The basic division results from the type of energy carrier. There are two basic systems powered by electricity and liquid. In electric heating systems, the heating element is a resistance wire. In the second arrangement, the heating system consists of pipes that are filled with liquid. Both solutions are extremely effective, durable, and environmentally friendly. Each of them fulfills its tasks, which are aimed at accelerating the melting of snow and ice, drying of the surface, and keeping the surface and soil temperature as constant as possible, regardless of the prevailing external conditions. The final choice of the type of heating installation depends on the investor, and it is influenced by economic and ecological factors. In this publication several ways of heating the parking lot for passenger cars are analyzed. Electric heating and liquid heating systems were selected. Seven heat sources were analyzed in liquid systems, including: system heat, a hard coal boiler, a pellet boiler, a fuel oil boiler, a natural gas condensing boiler and a heat pump. For financial reasons, it is good for the designed installation to be economical in the long term. This aspect is important for the entity responsible for financing the installation. However, special attention should be paid to the ecological aspect. The heating installation should meet the applicable gas emissions standards, and thus meet the expectations of the residents. According to the current observations and practices, the selection of economic technologies limiting the emission of gaseous pollutants into the atmosphere requires political support from the government, basic technology protection and community involvement [10,11,12]. Each of the analyzed systems is characterized by different operating costs and environmental impacts. The authors tried to choose the most optimal option in financial and environmental terms [13,14,15].

2. Description of Possible Heating Solutions

The heating system enables the heating under many types of surfaces, such as paving stones, asphalt, concrete, cobblestones, natural stone, ground, pitch turf. The method of installation of the heating system results directly from the type and purpose of the heated surface. Installation can be carried out on the entire heated area or strategically, e.g., in the most frequently used places. Often used, steep driveways to garages should be fully heated for safety reasons. However, in the case of moderate use, usually private, it is enough to heat only a part of the surface, e.g., two lanes on which the vehicle moves. Likewise, consider heating a car park or other vehicle space. If it is a strategically important or very frequently used object, the installation should be made so that the designated places where vehicles move and parking spaces are visible in all weather conditions. In this case, it is a good idea to install a heating system under the entire surface of the yard.
The main task of the heating installation is to protect against icing and snow. For proper operation, each heating system must be equipped with a control module, which should enable the installation to be turned on before the deterioration of weather conditions, precipitation, or icing. In extreme situations, with heavy snowfall and very cold temperatures, the system may not function effectively. The energy consumption or the time needed for the system to function properly may be too high. In such a situation, the heating system can support the work of the relevant services responsible for the object.

2.1. Electric Heating Systems

Resistance wire heating elements are used in electric heating systems. The wires are placed under the heating surface. They should be insulated against moisture and have high resistance to mechanical damage. They are powered with the voltage of 240 or 400 V.
Electric systems use variable-resistance or constant-resistance cables. Variable-resistance cables adjust the heating power to external conditions, but their lifetime is shorter than that of constant-resistance cables. Heating mats can also be used instead of heating cables. The heating mat consists of a system of wires laid on a special glass fiber mesh. Their advantage is the ease and speed of assembly [4,16].
Proper operation of each heating installation is possible thanks to the automation system. Such a system consists, among others, of sensors measuring the temperature of outside air, heated ground, heating cable and humidity of the heated surface. The entire system is connected to a power supply and control station. The electric heating system is relatively convenient and easy to install.
The heating power of the system depends on, among others, climatic conditions, purposes, and location of the heated surface, as well as individual needs. For the climatic conditions prevailing in Poland (temperate zone with a temperate warm transitional climate), it can generally be assumed that the unit heating power of an surface is from 200 to 400 W/m2 [16].

2.2. Liquid Heating Systems

Liquid heating systems use heat pipes filled with antifreeze, e.g., water-glycol mixture. They are installed in loops similar to electrical installations. Heating cables are installed in loose soil layers, e.g., in a layer of sand mixed with concrete. Directly on the surface prepared in this way, the outer layer is made, e.g., paving stones, asphalt or another, depending on the requirements. The thickness of all layers above the conductor should not exceed 25 cm when covering the conductors with soil, or 10 cm when using a sand layer. It is recommended that the layer finished with stone slabs be 6 cm thick if the pipes are laid in concrete mortar. Figure 1 shows a cross-section of the heating system for the surface made of paving blocks [5].
In liquid systems, one of the necessary elements are circulation pumps that force the flow of the heating medium in the installation. The system together with the heat source (e.g., a boiler for the selected fuel) forms a closed system in which the working medium flows. As in the case of the electrical system, the proper operation of the installation is possible thanks to the automation system. Based on the data from the soil and air temperature and humidity sensors, the control system selects the appropriate operating parameters for the circulation pump and the mixing system.
The wealth of technical solutions in the field of heating systems allows to select an appropriate heat source taking into account location conditions, availability of energy carriers, ecological and economic aspects. The most popular energy sources include: electricity, district heating, solid fuel boilers, including coal and biomass, fuel oil boilers, gas boilers, and heat pumps.
External surface heating systems do not require high operating temperatures, so an interesting solution is the use of low-temperature heat sources [16,17,18]. In such systems, it may be economically justified to use heat pumps, where the lower heat source may be ground, water or air. Thanks to the use of a heat pump with a ground heat exchanger, it is possible to increase financial and ecological efficiency compared to solutions with a conventional heat source [19,20].
In the next part of the work, the technical concept and comparative economic analysis of various car park heating systems for passenger cars are presented. The systems powered by system heat, fuel in the form of hard coal, biomass, heating oil, natural gas, and a heat pump with ground exchanger were analyzed.

3. Description of the Car Park Heating System

The conceptual design was made for a parking lot located in Poland, in climate zone III. According to PN-EN 12831 standard, the design outdoor temperature in winter is −20 °C [21]. Heated parking lot area is 2900 m2. Seven variants of heat systems were considered:
  • electric heating, electricity supply,
  • liquid heating powered by system heat from the district heating network,
  • liquid heating powered by a hard coal boiler,
  • liquid heating powered by a biomass boiler,
  • liquid heating powered by a heating oil boiler,
  • liquid heating powered by a natural gas condensing boiler,
  • liquid heating powered by a heat pump with a vertical ground exchanger.
In an electrical system, the heating element will be a resistance wire. In each liquid system, according to the manufacturers’ data, the horizontal heat exchanger will be made of PEX pipe laid in Tichelmann’s system [22,23]. On the basis of literature information, the unit power of the heating system (Qj) was assumed to be 210 W/m2 [3,24]. For the variant with a heat pump, the vertical exchanger will be made in the form of boreholes 150 m deep [25,26]. The boreholes will contain U-shaped bent polyethylene pipes. The pipes constitute a supply and return line. The boreholes will be made in close proximity to the parking lot. The probes will be placed in a cohesive and moist soil, which will allow for heat extraction at the level of 50 W/m. The distance between the wells will be no less than 6 m, so the wells should not interact with each other [27].
The heat flow to the heating loops was calculated according to formula [28]:
Q = Q j · A , kW
where Qj denotes unit installation power, in W/m2, and A is the heated area, m2.
Based on simple calculations of the required heat flux and technical data available in manufacturers’ catalogs, sample devices were selected for each variant. Figure 2 shows block diagrams of analyzed solutions. Table 1 presents preliminary data for the design concept under consideration, and gives average energy prices in Poland. For electricity, the average price for a two-zone tariff is given. The prices were converted from the Polish currency (PLN) to the US dollar ($) at the current rate of 3.80 PLN/$.
The amount of heat that the heat pump takes from the ground is calculated from formula [28]:
Q k = Q PC · SCOP 1 SCOP , kW
where QPC—heat pump heating power, kW and SCOP—seasonal coefficient of performance.
The ground exchangers have been designed as vertical. The lenght of the ground heat exchanger was calculated from formula [28,29]:
L = Q k q e , m 2
where qe—efficiency of heat absorption from the ground, W/m.
The vertical ground exchanger will be made in the form of 150 m deep probes. The number of probes was calculated from the formula:
n = L 150 ,
Table 2 shows the calculation data and parameters of the proposed heat pump. Seasonal heating capacity factor SCOP was determined on the basis of guidelines for the design, construction, and acceptance of heat pump installations [20,30,31].

4. Assessment of the Economic and Ecological Efficiency of the Installation

The economic and ecological effectiveness of the analyzed solution has been assessed [20,32]. Table 3 presents investment outlays for individual heating systems According to the information available in the literature and obtained from contractors, it can be assumed that on the example of a heat pump installation, the cost of purchasing a pump is approximately 45% of all expenses. The implementation of the lower and upper heat source accounts for about 35% of all costs. The remaining elements of the installation account for approximately 20% of the total costs [33]. The costs of the remaining systems were estimated on the basis of offers received from at least two manufacturers of a given heating system. Table 4 presents the unit pollution emissions of individual heating systems [34,35,36]. For electric and district heating, pollutant emissions have been assumed for the conditions prevailing in Poland, where about 75% of the electricity and heat is generated in boilers powered by hard coal or lignite. Calculations of the assessment of economic and ecological efficiency were made for the period of installation operation from 400 h to 1400 h per year, after 20 years of operation. One of the final results of the efficiency and environmental assessment was to calculate and compare the costs of heat production with a heat pump and other heating systems, as well as emissions of harmful gaseous and dust pollutants.
Figure 3 shows the operating costs of the systems as a function of the system operation time from 400 to 1400 h over 20 years of operation. Operating costs include the purchase and assembly costs of the installation, fuel consumption costs, and inspection and service costs. Based on historical data on inflation and the average cost of servicing equipment, it was assumed that the total operating costs will increase by 5% each year. The graph shows that as the operating time increases during the year, a heat pump installation (VII) becomes more and more cost-effective compared to other systems. In the entire operation range, only installation III, i.e., liquid heating powered by a hard coal boiler, is the cheapest in operation compared to other systems. The electrical installation (I), despite the smallest investment outlay, turns out to be the most expensive installation in operation compared to the other systems.
Figure 4 shows a diagram of the CO2 emission of individual heating systems for an operating time of the installation from 400 to 1400 h during 20 years of use. The installation with a heat pump (VII), thanks to the high efficiency of heat production during the entire heating period, is characterized by the lowest CO2 emissions. The least ecological system is liquid heating powered by a fuel oil boiler (V), where CO2 emissions are almost five times higher than those of a heat pump. In the case of biomass installations, zero CO2 emissions can be assumed. This is due to the fact that plants emit as much CO2 in the combustion process as they take in the process of photosynthesis [37,38,39].
Figure 5 shows a graph of NOX emissions of individual heating systems for an operating time of 400 to 1400 h over 20 years of use. Heat pump heating systems (VII) have the lowest NOX emissions among the other heating systems. The highest concentrations can be observed in liquid heating systems supplied with district heating (II), hard coal-fired boiler (III) and electric heating (I). This is due to the high consumption rate of fossil fuels in the heating and power industry in Poland [35].
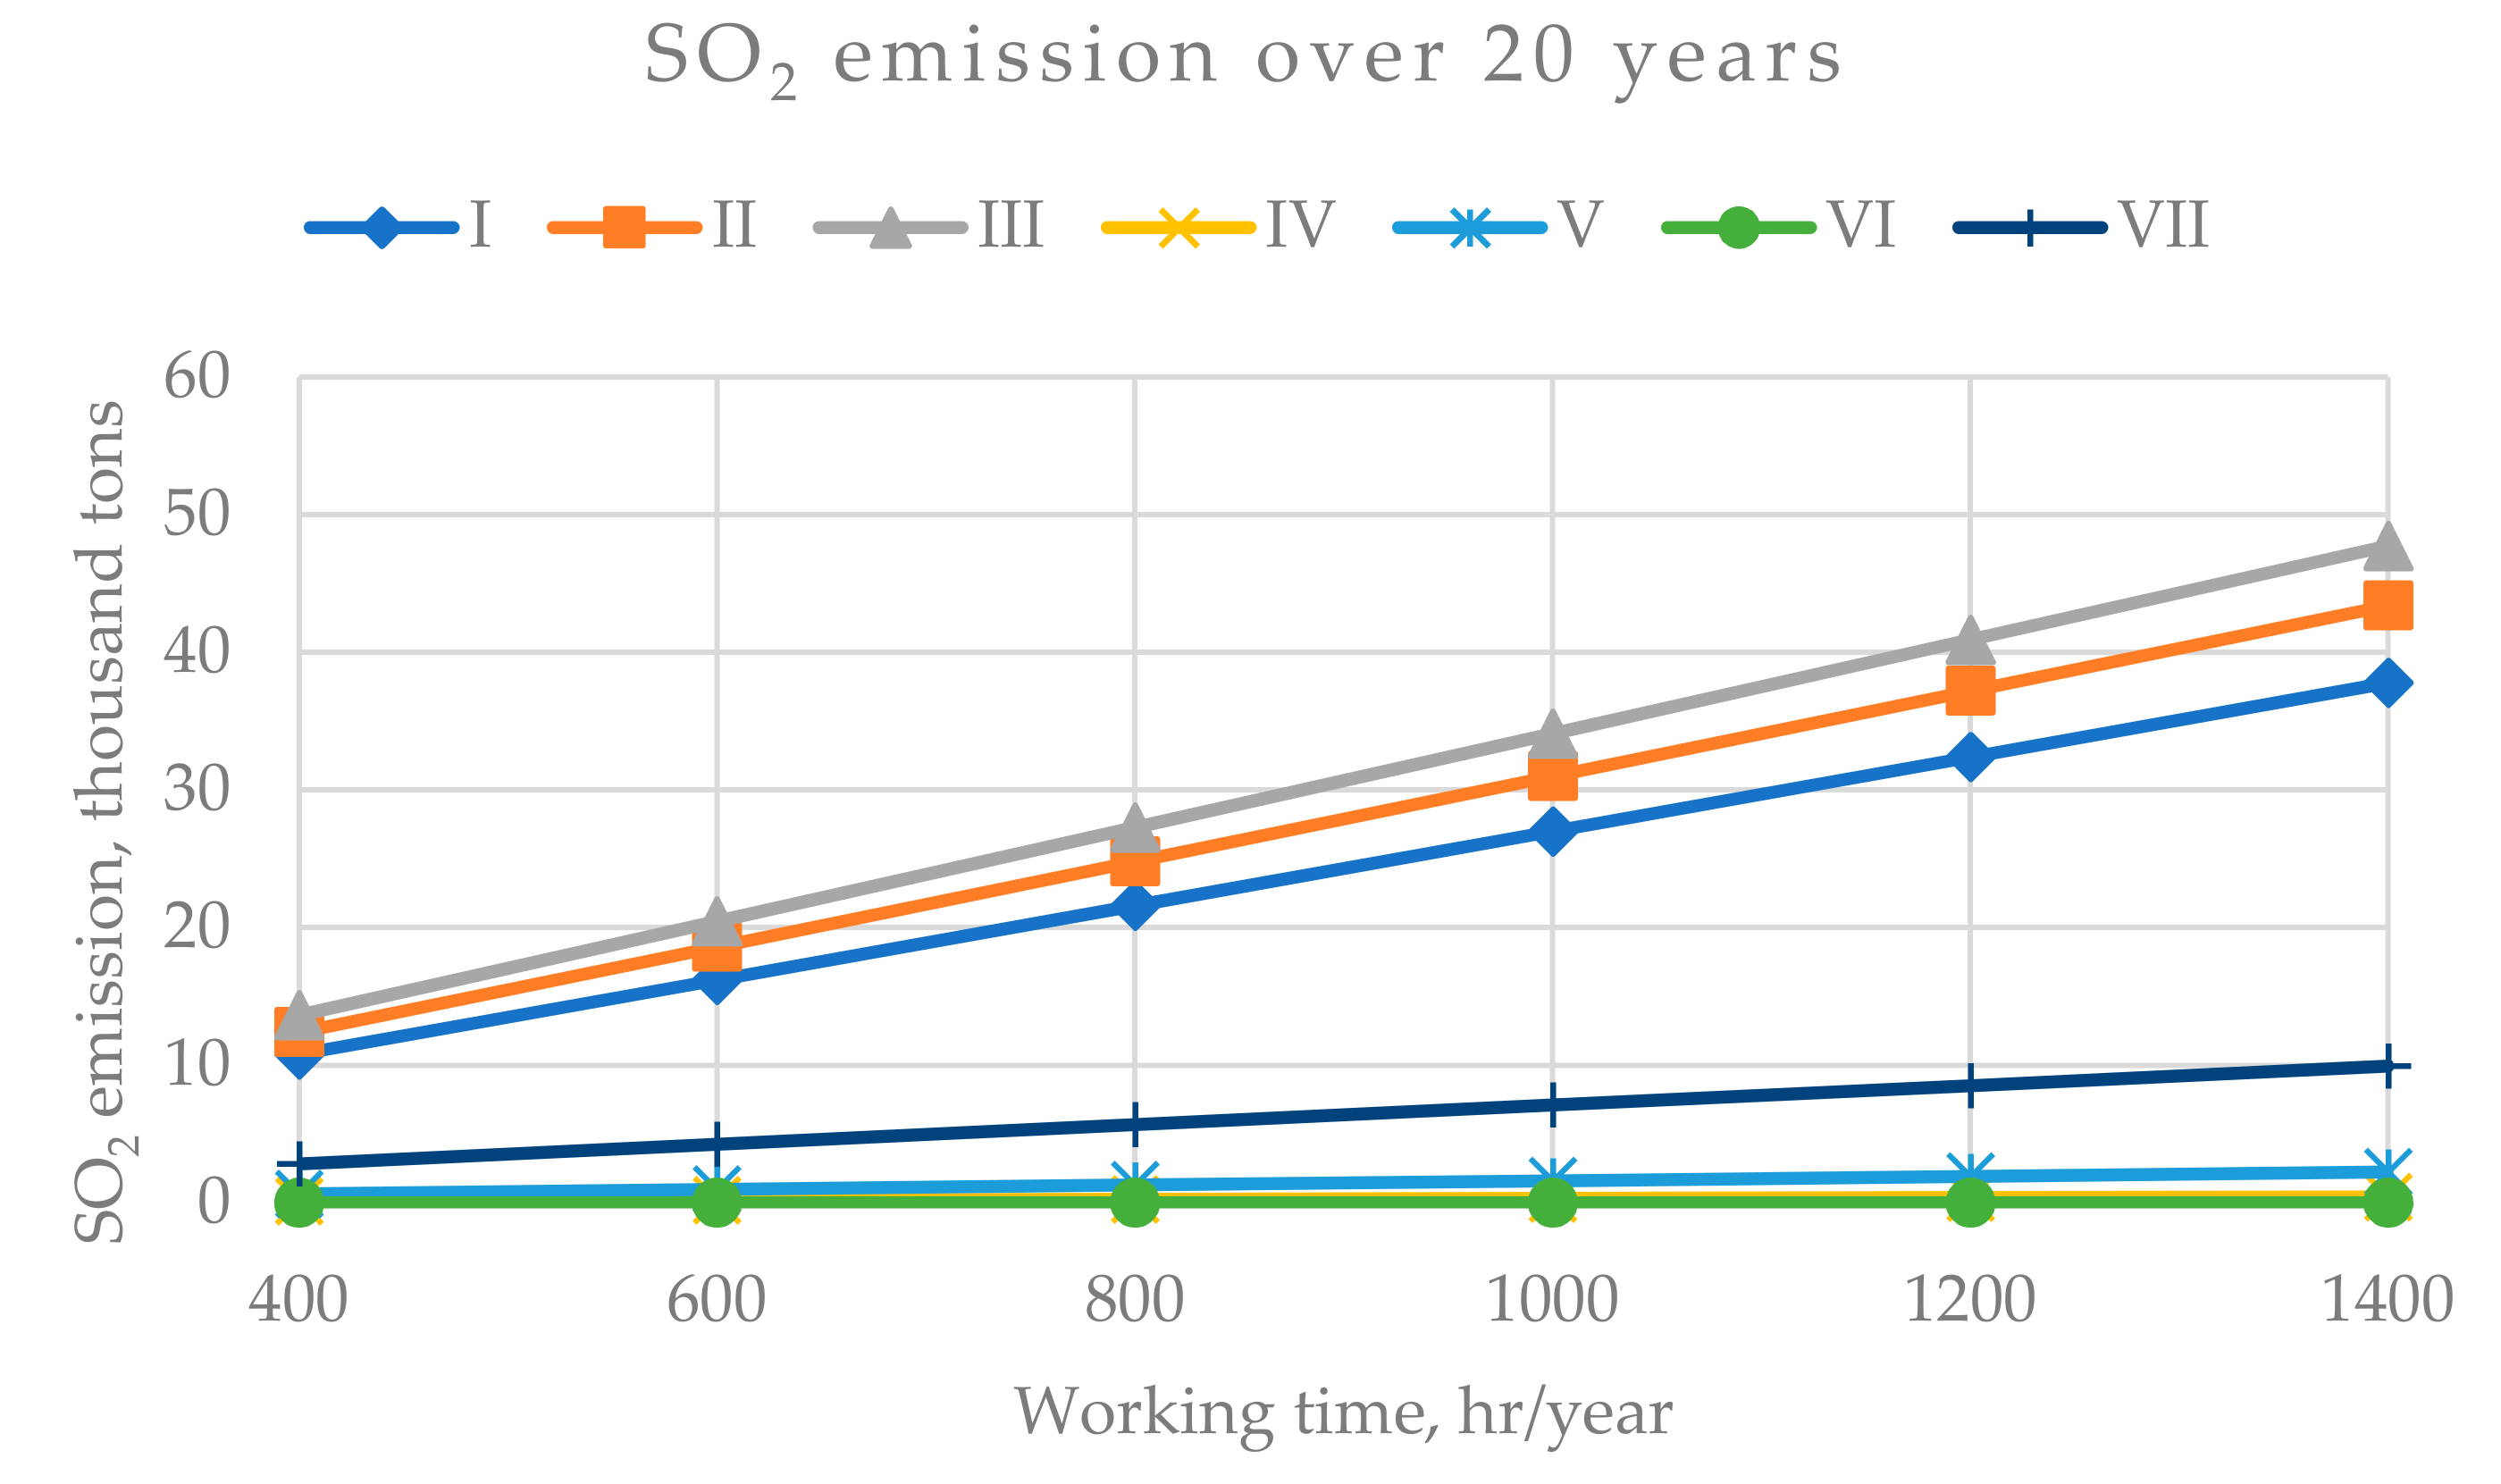
Figure 6 shows the graph of SO2 emission of individual heating systems for the system operation time from 400 to 1400 h during 20 years of use. Sulphur compounds are emitted during the combustion of solid fuels as well as heating oil. The emissions depend, among other things, on the quality of the fuel used. The highest values can be observed in liquid heating systems powered by a hard coal boiler (III), electric heating systems (I) and liquid heating systems powered by system heat from the heating network (II). The liquid heating systems powered by a natural gas boiler (VI), biomass (IV) and fuel oil (V) are characterized by the lowest and almost zero emission of SO2 among other heating systems, which results directly from the fuel used [37,40].
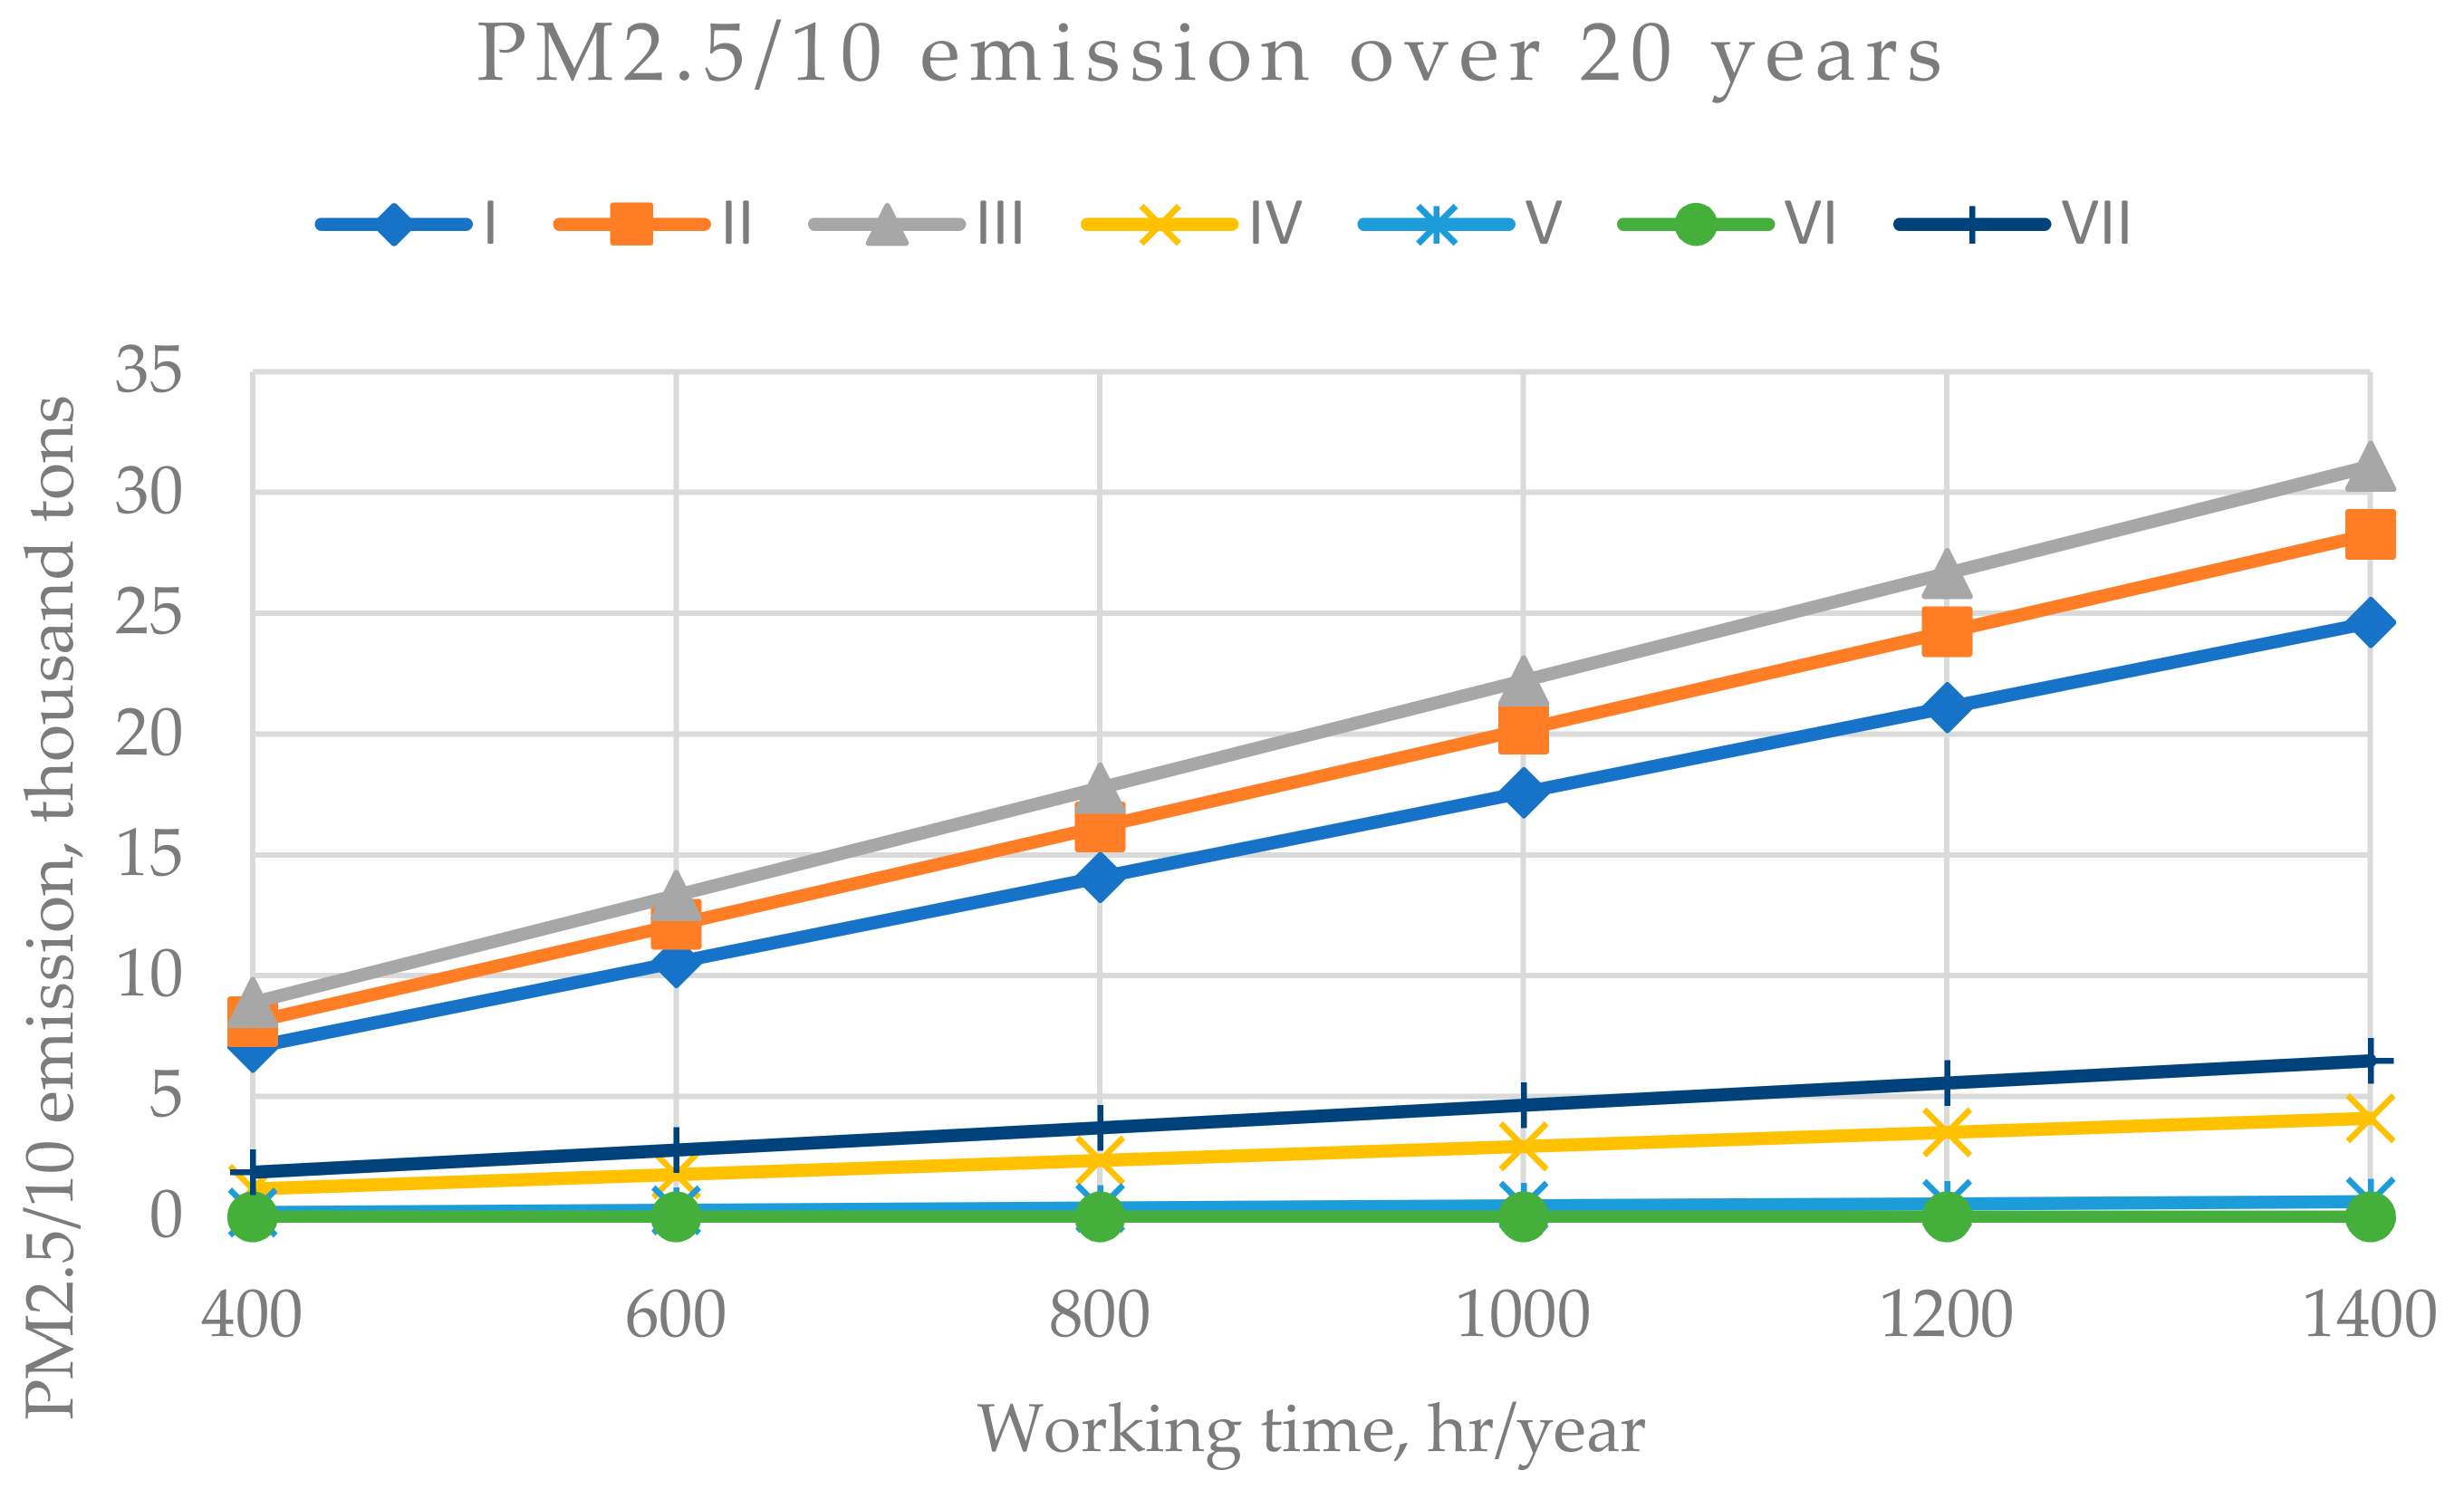
Figure 7 shows a graph of PM2.5 and PM10 dust emissions from individual heating systems with operating times from 400 to 1400 h over 20 years of use. The highest dust emission values can be observed in liquid heating systems powered by a hard coal (III) boiler, which results from the lack of dedusting devices in this type of installations. Dust emission in the electric heating (I) and district heating (II) installations is also high. As in the case of other pollutants, it results from the use of fossil fuels in the energy production process in Poland [35,36]. In other systems, it is several dozen times lower. The lowest dust emission occurs in liquid heating systems powered by a natural gas (VI) and fuel oil (V) boiler, which results directly from the characteristics of fuel.
The above results do not give a clear answer on the nuisance of the installation, as it depends on the specific pollutant to be taken into account. One solution to this issue may be to use the AQI (air quality index) to develop weights for the analyzed pollutants due to their impact on air quality [41,42]. Table 5 lists indicators of individual pollutants according to AQI coefficient.
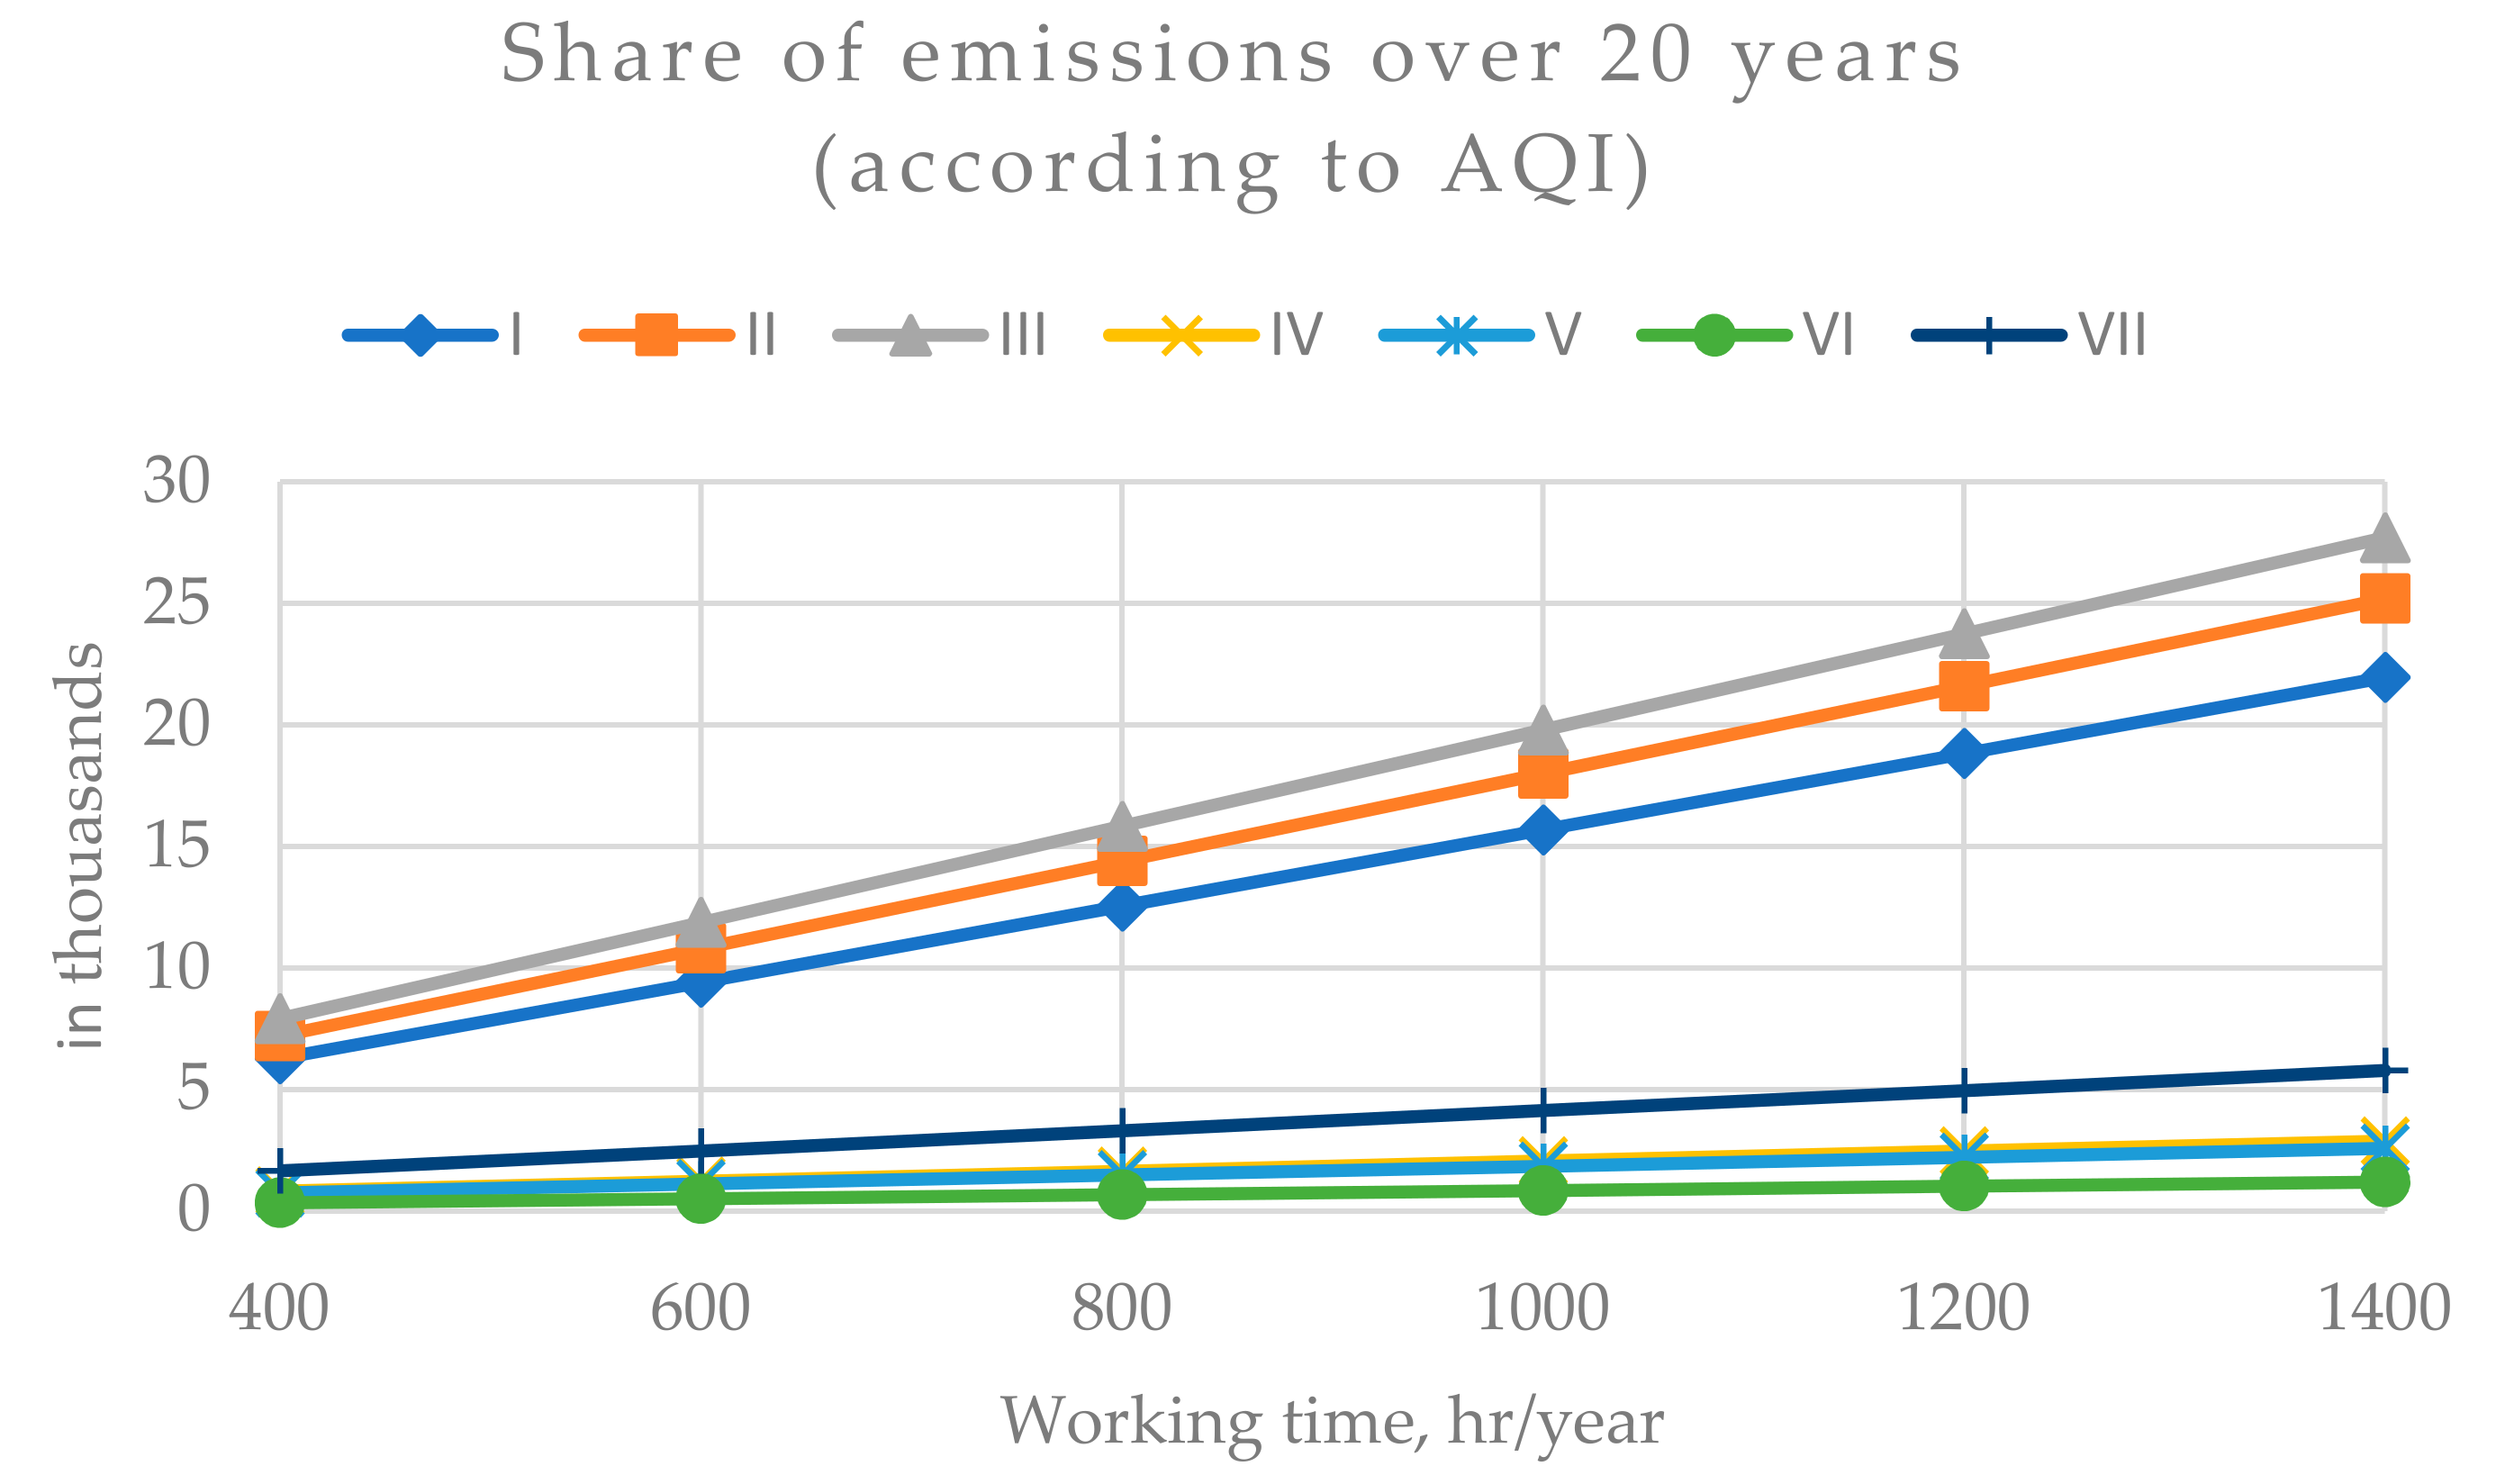
AQI’s shareholding shows that SO2 and dust have the greatest impact on the external environment and human health, while to a lesser extent CO2 and NOx. It is possible to carry out a general statement of the impact of the analyzed pollutants on the human environment based on AQI and to draw general conclusions for particular installation alternatives. Figure 8 shows the global emission of the analyzed pollutants, taking into account the AQI shares for individual heating systems for the installation operation time from 400 to 1400 h during 20 years of use.
The global emission for each heating system has been calculated based on the formula:
AQI n = AQI i · E i
where AQIi is the share of analyzed pollution (based on Table 5), and Ei the emission of the analysed pollution (based on Table 4)
Analyzing the global emission factor in Figure 8, it can be concluded that the liquid heating system powered by a hard coal (III) boiler has by far the least beneficial impact on humans. Behind it there is an electric heating system (I) and a liquid heating system powered by system heat (II). In case of variant II, a reduction of more than 20% in relation to variant III can be observed. The least human impact was achieved by the variant of liquid heating system powered by a natural gas boiler (VI). In this case, a reduction of more than 95% of the human impact can be observed in relation to variant III.
An important factor in choosing the best option is the financial aspect. For this purpose, the share of the costs of individual installations in relation to the total costs of all installations was determined. On this basis, indicators were determined which of the installations requires the highest investment outlays. In the same way indicators for AQI impact were determined. The indicators are in the range from 0.00 to 1.00. Indicators close to 0 mean that the installation is characterized by low costs or emission of pollutants compared to other installations. The higher the indicator the higher the cost or emission of pollutants. The binding emission standards in Poland are established on the basis of restrictive European Union standards. Despite the strict standards, each of the proposed installations is possible and legal. Therefore, it was subjectively assumed that the ecological and economic indicators would be equally important. On this basis the global indicator was determined as the arithmetic mean of the financial indicator and AQI. The calculated indicators are shown in Figure 9. Under the climatic conditions of the parking lot heating system, each year there is an average of 40 days (960 h) with snowfall and 80 days (1920 h) with frosts. It was assumed that the operating time of the installation equal to 1000 h will be the most reliable among all the considered ones
Given the global indicator combining both human impact and installation costs, if such an assumption can be accepted, the most appropriate solution seems to be installation number VI (liquid heating powered by a natural gas boiler), which coincides with the previous conclusion of the analysis of only the adverse human impact factors based on the AQI indicator. Just behind the installation with the natural gas boiler is the installation with the biomass boiler (IV) and heat pump (VII). The least advantageous seems to be installation I (electric heating), where all indicators are at high levels. In financial terms, installation III (heating with hard coal boiler) is the cheapest. However, taking into account the high emission of pollutants, this variant turns out to be one of the worst among the others.

5. Conclusions

Heating systems for parking lots or other outdoor areas can be used in places where there is significant precipitation and temperatures remain well below 0 °C for a longer period of time. The application of the heating system for external surfaces allows to keep the surface free of snow and ice, and thus enables safe and comfortable use. It is particularly important in the case of surfaces with a significant gradient, where unfavorable weather conditions may make it difficult or completely impossible to move around.
This publication presents the results of technical analysis of the concept of a parking lot heating system using seven heating systems. Analysed system of electric heating, liquid heating supplied with heat from the heating network, liquid heating with coal boiler, liquid heating with biomass boiler, liquid heating with oil boiler, liquid heating with natural gas boiler, liquid heating with heat pump with vertical ground exchanger. It was assumed that the installation is located in Poland where is a temperate zone with a temperate warm transitional climate. Installation will operate for 20 years.
The results of the economic and ecological analysis are presented. All variants are compared against each other. From a cognitive point of view, it was interesting to examine whether the proposed installation is technically and economically feasible. Calculations of the economic and ecological efficiency assessment were made for the time of use of the installation during the heating season from 400 h to 1400 h.
According to the observations and practices to date, the occurrence of technology reducing the emission of carbon dioxide and other pollutants into the atmosphere requires political support from the government, basic protection of the technology and a broad participation of residents [10,11,12]. It is necessary to consider policies and regulations to support residents in changing the awareness of low-carbon technology in their neighborhood, which is the main goal of activities aimed at convincing also the political sphere to take action in this area. In order to promote the implementation of green technologies in the low-carbon development strategy at the neighbourhood level, the policy requires that innovations include new solutions and ensure their effective implementation [43]. Moreover, the environmental policy encourages citizens to take parity actions, by engaging in daily life activities for a more sustainable environment [44]. Elaborate administrative mechanisms facilitate scientific decisions in favour of solutions supporting sustainable development. Therefore, the formulation of policies encourages the consolidation of residents’ actions. The lifestyle of the residents contributes to shaping gentle interactions between the economy, society, culture, politics, and ecology. Therefore, their participation provides an effective way to achieve the intended goals. Participation of residents in building low-emission districts means to mobilize residents to improve the quality of life [45,46,47].
On the basis of the analyses carried out, it can be seen that the cheapest to buy is the electrical installation (variant I). However, taking into account energy costs, the installation turns out to be the most expensive to operate. The most expensive to buy is the installation with a heat pump (variant VII). Taking into account the operating costs in the long term and the ecological aspect, this type of installation turns out to be one of the cheapest and most ecological. In terms of purchase and operation, the installation with a hard coal boiler is the cheapest (variant III). However, taking into account the high emission of pollutants, it is the worst installation among the others.
The lowest emission of pollutants is characteristic of an installation with a condensing boiler fired with natural gas. It is also one of the cheapest installations in terms of operation. Considering both these factors, and taking into account the initial assumptions, it is the best installation of all. The above information is applicable in places where the weather conditions in winter are similar to those in Poland. In warmer places, the use of heated external surfaces may not have raison d’etre. It can be assumed that the proposed installations are applicable in many countries with similar or colder climates. However, the authors are aware that the final conclusions may vary depending on the available heating systems on the local market, energy prices, ecological and economic indicators as well as the shape and size of the parking lot. This work can serve as a signpost which will help to choose the optimal solution from the ecological and economic point of view.

Author Contributions

Conceptualization, K.N. and S.R.; methodology, K.N. and S.R.; formal analysis, K.N. and S.R.; resources, K.N. and S.R.; writing—original draft preparation, K.N. and S.R.; writing—review and editing, K.N. and S.R. All authors have read and agreed to the published version of the manuscript.

Funding

This research received no external funding.

Conflicts of Interest

The authors declare no conflict of interest.

References

  1. FIFA Quality Programme for Football Turf. In Handbook of Requirements; 2015. Available online: https://football-technology.fifa.com/media/1239/fqp-handbook-of-requirements-2015-v31-w-cover.pdf (accessed on 9 December 2020).
  2. Introduction to UEFA Turf Manual. Available online: https://www.isss-sportsurfacescience.org/downloads/documents/TKJERP5K15_ Artificial_Turf.pdf (accessed on 9 December 2020).
  3. Czarniecki, D.; Słyś, D. Technical and financial analysis of heating turf on the sports field. Czas. Inżynierii Lądowej Środowiska Archit. 2016, 63, 39–52. [Google Scholar]
  4. Onyszczuk, G.; Siuta-Olcha, A. Outdoor Heating Systems—A Case Design Of Soil Conditioning. Polska Inżynieria Środowiska Pięć Lat Po Wstąpieniu Do Unii Europejskiej 2009, 3, 179–190. [Google Scholar]
  5. Nowak, K. Heating of external surfaces by means of heat pumps. E3S Web Conf. 2018, 44, 00128. [Google Scholar] [CrossRef]
  6. Shen, W.; Ceylan, H.; Gopalakrishnan, K.; Kim, S.; Nahvi, A. Sustainability Assessment of Alternative Snow-Removal Methods for Airport Apron Paved Surfaces. 2017. Available online: https://www.airporttech.tc.faa.gov/DesktopModules/EasyDNNNews/DocumentDownload.ashx?portalid=0&moduleid=3682&articleid=1&documentid=1 (accessed on 9 December 2020).
  7. Board, T.R.; National Academies of Sciences, E. Guidelines for the Selection of Snow and Ice Control Materials to Mitigate Environmental Impacts. Prep. NCHRP Proj. 2007, 194p. [Google Scholar] [CrossRef]
  8. Fay, L.; Nazari, M.H.; Jungwirth, S.; Muthumani, A. Snow and Ice Control Environmental Best Management Practices. Environ. Sustain. Transp. Infrastruct. 2015, 147–161. [Google Scholar] [CrossRef]
  9. Fu, L.; Sooklall, R.; Perchanok, M.S. Effectiveness of Alternative Chemicals for Snow Removal on Highways. Transp. Res. Rec. 2006, 1948, 125–134. [Google Scholar] [CrossRef]
  10. Bye, B.; Fæhn, T.; Rosnes, O. Residental Energy Efficiency and European Carbon Policies A CGE-Analysis with Bottom-up Information on Energy Efficiency Technologies; Discussion Papers; Research Department, Statistics Norway: Oslo, Norway, 2015. [Google Scholar]
  11. Chance, T. Towards sustainable residential communities; the Beddington Zero Energy Development (BedZED) and beyond. Environ. Urban. 2009, 21, 527–544. [Google Scholar] [CrossRef]
  12. Jiang, B.; Sun, Z.; Liu, M. China’s energy development strategy under the low-carbon economy. Energy 2010, 35, 4257–4264. [Google Scholar] [CrossRef]
  13. Adl-Zarrabi, B.; Mirzanamadi, R.; Johnsson, J. Hydronic Pavement Heating for Sustainable Ice-free Roads. Transp. Res. Procedia 2016, 14, 704–713. [Google Scholar] [CrossRef] [Green Version]
  14. ASHRAE. Ashrae 2015 ASHRAE Handbook-HVAC Applications; ASHRAE: Atlanta, GA, USA, 2015; ISBN 978-1-936504-93-0. [Google Scholar]
  15. Fay, L.; Shi, X. Environmental Impacts of Chemicals for Snow and Ice Control: State of the Knowledge. Water Air Soil Pollut. 2012, 223, 2751–2770. [Google Scholar] [CrossRef]
  16. Kauko, H.; Rohde, D.; Hafner, A. Local Heating Networks with Waste Heat Utilization: Low or Medium Temperature Supply? Energies 2020, 13, 954. [Google Scholar] [CrossRef] [Green Version]
  17. Kemmler, T.; Thomas, B. Design of Heat-Pump Systems for Single- and Multi-Family Houses using a Heuristic Scheduling for the Optimization of PV Self-Consumption. Energies 2020, 13, 1118. [Google Scholar] [CrossRef] [Green Version]
  18. Huculak, M.; Jarczewski, W.; Dej, M. Economic aspects of the use of deep geothermal heat in district heating in Poland. Renew. Sustain. Energy Rev. 2015, 49, 29–40. [Google Scholar] [CrossRef]
  19. Thygesen, R. An Analysis of Different Solar-Assisted Heating Systems and Their Effect on the Energy Performance of Multifamily Buildings—A Swedish Case. Energies 2017, 10, 88. [Google Scholar] [CrossRef] [Green Version]
  20. Pisarev, V.; Rabczak, S.; Nowak, K. Ventilation system with ground heat exchanger. J. Ecol. Eng. 2016, 17, 163–172. [Google Scholar] [CrossRef]
  21. Strzeszewski, M. PN-EN 12831-1:2017-08 Standard. Key changes in the methodology of building design heat load calculations. Ciepłownictwo Ogrzew. Went. 2017, 48, 11. [Google Scholar] [CrossRef]
  22. Katsaprakakis, D. Computational Simulation and Dimensioning of Solar-Combi Systems for Large-Size Sports Facilities: A Case Study for the Pancretan Stadium, Crete, Greece. Energies 2020, 13, 2285. [Google Scholar] [CrossRef]
  23. System KAN-therm at Football Stadiums. Available online: http://en.kan-therm.com/kan/upload/KAN-Folder-football-EN-v2 (accessed on 9 December 2020).
  24. Sękowski, K.; Juchnicki, J. KAN-Therm System Open Surface Heating; Warszaw, Poland. 2004. Available online: http://pl.kan-therm.com/download/files/pl/6-guidebooks/poradnik-ogrzewanie-powierzchni-otwartych-pl.pdf (accessed on 9 December 2020).
  25. Lanini, S.; Delaleux, F.; Py, X.; Olivès, R.; Nguyen, D. Improvement of borehole thermal energy storage design based on experimental and modelling results. Energy Build. 2014, 77, 393–400. [Google Scholar] [CrossRef] [Green Version]
  26. Zhai, X.Q.; Yang, Y. Experience on the application of a ground source heat pump system in an archives building. Energy Build. 2011, 43, 3263–3270. [Google Scholar] [CrossRef]
  27. Spitler, J.D.; Bernier, M. 2—Vertical borehole ground heat exchanger design methods. In Advances in Ground-Source Heat Pump Systems; Rees, S.J., Ed.; Woodhead Publishing: Cambridge, UK; Sawston, UK, 2016; ISBN 978-0-08-100311-4. Available online: https://www.sciencedirect.com/science/article/pii/B9780081003114000029 (accessed on 9 December 2020).
  28. Ochsner, K. Geothermal Heat Pumps: A Guide for Planning and Installing; Routledge, London, 2012; ISBN 978-1-84977-144-3.
  29. Kopeć, P. Calculation and selection of ground heat exchanger for a heat pump. J. Civil Eng. Environ. Archit. 2015, 32, 167–176. [Google Scholar] [CrossRef]
  30. Licharz, H.; Rösmann, P.; Krommweh, M.S.; Mostafa, E.; Büscher, W. Energy Efficiency of a Heat Pump System: Case Study in Two Pig Houses. Energies 2020, 13, 662. [Google Scholar] [CrossRef] [Green Version]
  31. Mirowski, A. Design, construction and acceptance guidelines for heat pump installations 2014.
  32. Conrad, J.; Greif, S. Modelling Load Profiles of Heat Pumps. Energies 2019, 12, 766. [Google Scholar] [CrossRef] [Green Version]
  33. Rubik, M. Heat Pumps in Low-Temperature Geothermal Systems (In Polish); Oficyna Wydawnicza Multico: Warszawa, Poland, 2011; ISBN 978-83-7763-180-5. [Google Scholar]
  34. Pollutant Emission Calculator. Available online: https://vaillant-partner.pl/kalkulatory-on-line/kalkulator-emisji-zanieczyszczen/ (accessed on 9 December 2020).
  35. The National Centre for Emissions Management. Poland’s National Inventory Report. 2019. Available online: https://www.kobize.pl/uploads/materialy/materialy_do_pobrania/krajowa_inwentaryzacja_emisji/NIR_POL_2019_23.05.2019.pdf (accessed on 9 December 2020).
  36. Kaczmarczyk, M.; Sowiżdżał, A.; Tomaszewska, B. Energetic and Environmental Aspects of Individual Heat Generation for Sustainable Development at a Local Scale—A Case Study from Poland. Energies 2020, 13, 454. [Google Scholar] [CrossRef] [Green Version]
  37. Moroń, W.; Rybak, W. NOx and SO2 emissions of coals, biomass and their blends under different oxy-fuel atmospheres. Atmos. Environ. 2015, 116, 65–71. [Google Scholar] [CrossRef]
  38. Mori, T.; Iwama, Y.; Hayama, H.; Mushtaha, E. Optimization of a Wood Pellet Boiler System Combined with CO2HPs in a Cold Climate Area in Japan. Energies 2020, 13, 5531. [Google Scholar] [CrossRef]
  39. Jåstad, E.O.; Bolkesjø, T.F.; Trømborg, E.; Rørstad, P.K. The role of woody biomass for reduction of fossil GHG emissions in the future North European energy sector. Appl. Energy 2020, 274, 115360. [Google Scholar] [CrossRef]
  40. Mac Kinnon, M.A.; Brouwer, J.; Samuelsen, S. The role of natural gas and its infrastructure in mitigating greenhouse gas emissions, improving regional air quality, and renewable resource integration. Prog. Energy Combust. Sci. 2018, 64, 62–92. [Google Scholar] [CrossRef]
  41. Li, H.; You, S.; Zhang, H.; Zheng, W.; Zheng, X.; Jia, J.; Ye, T.; Zou, L. Modelling of AQI related to building space heating energy demand based on big data analytics. Appl. Energy 2017, 203, 57–71. [Google Scholar] [CrossRef]
  42. Xue, J.; Xu, Y.; Zhao, L.; Wang, C.; Rasool, Z.; Ni, M.; Wang, Q.; Li, D. Air pollution option pricing model based on AQI. Atmos. Pollut. Res. 2019, 10, 665–674. [Google Scholar] [CrossRef]
  43. Zhang, X.; Shen, G.Q.P.; Feng, J.; Wu, Y. Delivering a low-carbon community in China: Technology vs. strategy? Habitat Int. 2013, 37, 130–137. [Google Scholar] [CrossRef] [Green Version]
  44. Basolo, V.; Strong, D. Understanding the neighborhood: From residents’ perceptions and needs to action. Hous. Policy Debate 2002, 13, 83–105. [Google Scholar] [CrossRef]
  45. Yang, T.; Chen, H.; Zhang, Y.; Zhang, S.; Feng, F. Towards Low-Carbon Urban Forms: A Comparative Study on Energy Efficiencies of Residential Neighborhoods in Chongming Eco-Island. Energy Procedia 2016, 88, 321–324. [Google Scholar] [CrossRef] [Green Version]
  46. Yazawa, K.; Shakouri, A. Cost-Efficiency Trade-off and the Design of Thermoelectric Power Generators. Environ. Sci. Technol. 2011, 45, 7548–7553. [Google Scholar] [CrossRef] [PubMed]
  47. Peng, W.J.; Wang, X.M.; Zhao, G.C.; Wang, X. An investigation into neighborhood residents’ cognition of and participation in low-carbon behavior: A case study in Chengyang district of Qingdao, China. Int. J. Sustain. Dev. Plan. 2018, 13, 818–837. [Google Scholar] [CrossRef]
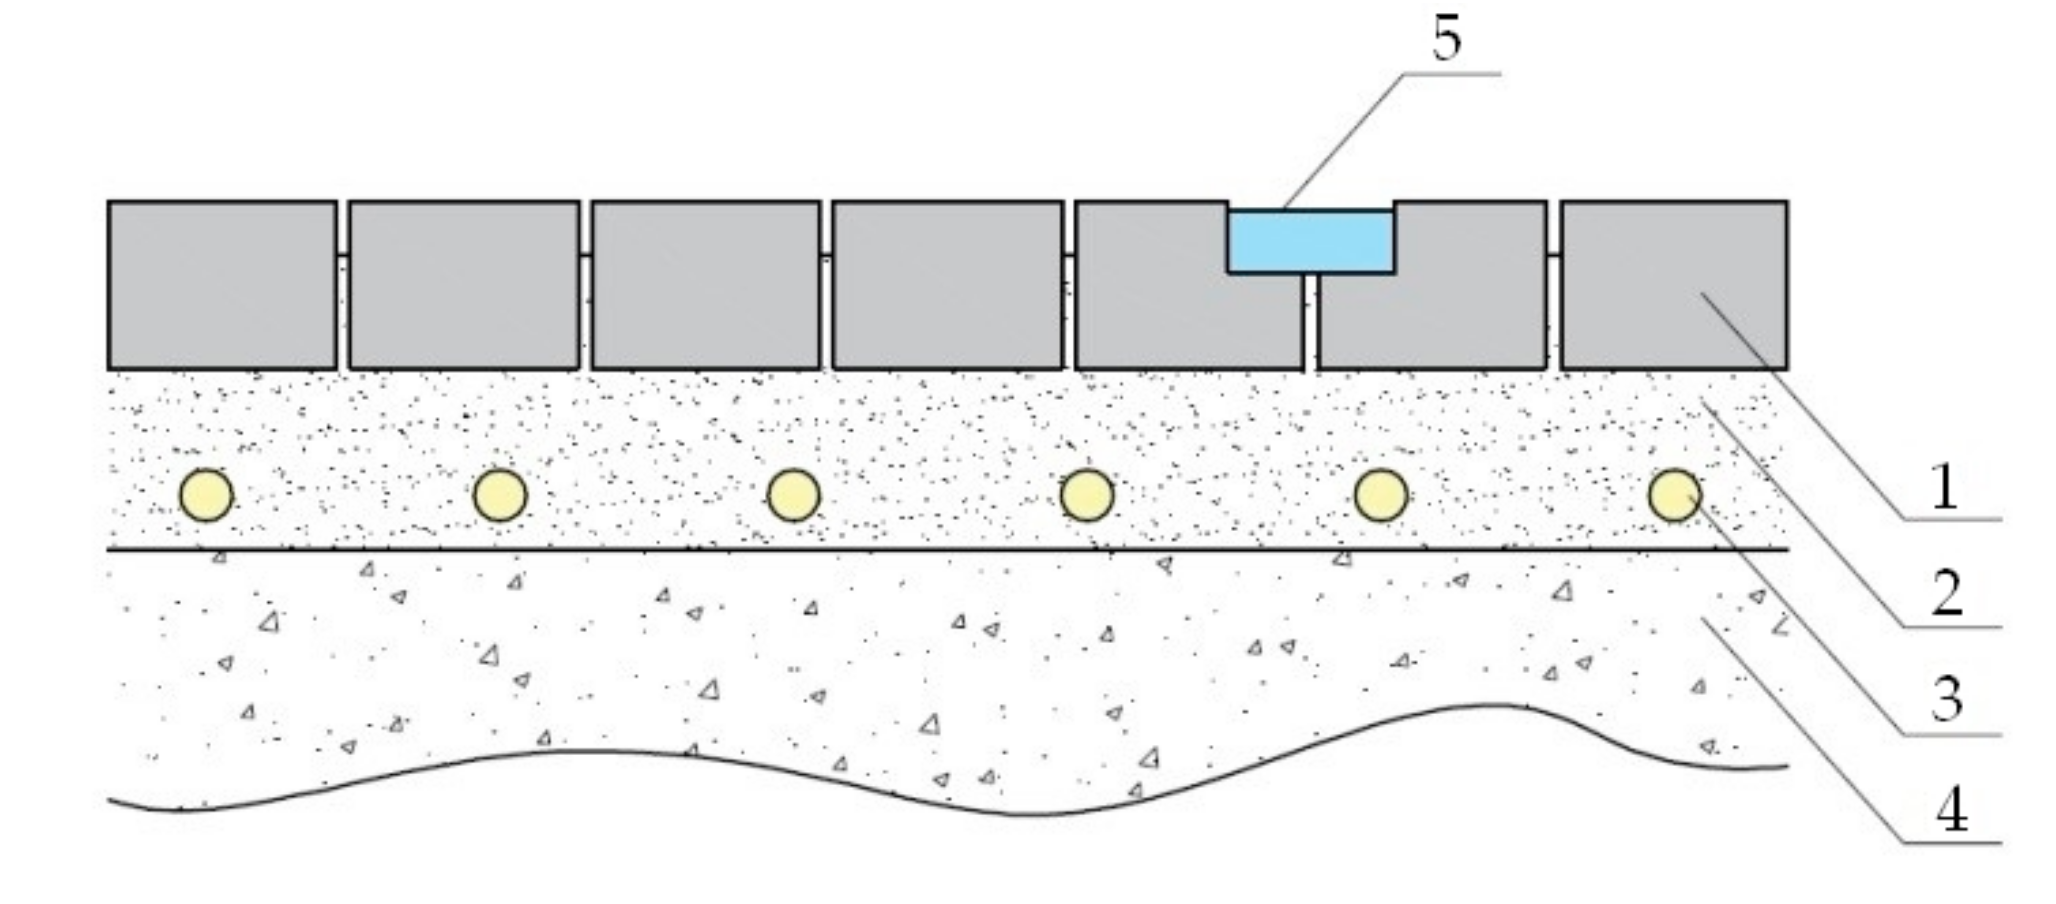
Figure 1. Cross section of the heating system: 1—outside surface, 2—sand and cement, 3—heating pipes, 4—hardened ground, 5—temperature and humidity sensor.
Energies 13 06530 g001
Figure 2. Schematic diagram of parking lot heating with: I—electricity, II—district heating network, III—hard coal boiler, IV—biomass boiler, V—fuel oil boiler, VI—condensing gas boiler, VII—heat pump with ground heat exchanger.
Energies 13 06530 g002
Figure 3. Chart of the operating costs of individual heating systems for an operating time of 400 to 1400 h over 20 years of use, where: I—electric heating power supply, II—liquid heating supplied from the district heating network, III—liquid heating powered by a hard coal boiler, IV—liquid heating powered by a biomass boiler, V—liquid heating with fuel oil boiler, VI—liquid heating powered by a natural gas boiler, VII—liquid heating powered by a ground source heat pump.
Energies 13 06530 g003
Figure 4. CO2 emissions of individual heating systems for an operating time of 400 to 1400 h over a 20-year period, where: I—electric heating power supply, II—liquid heating supplied from the district heating network, III—liquid heating powered by a hard coal boiler, IV—liquid heating powered by a biomass boiler, V—liquid heating with fuel oil boiler, VI—liquid heating powered by a natural gas boiler, VII—liquid heating powered by a ground source heat pump.
Energies 13 06530 g004
Figure 5. NOX emission of individual heating systems for an operating time of 400 to 1400 h over 20 years of use, where: I—electric heating power supply, II—liquid heating supplied from the district heating network, III—liquid heating powered by a hard coal boiler, IV—liquid heating powered by a biomass boiler, V—liquid heating with fuel oil boiler, VI—liquid heating powered by a natural gas boiler, VII—liquid heating powered by a ground source heat pump.
Energies 13 06530 g005
Figure 6. SO2 emission of individual heating systems for the system operation time of 400 to 1400 h during 20 years of use, where: I—electric heating power supply, II—liquid heating supplied from the district heating network, III—liquid heating powered by a hard coal boiler, IV—liquid heating powered by a biomass boiler, V—liquid heating with fuel oil boiler, VI—liquid heating powered by a natural gas boiler, VII—liquid heating powered by a ground source heat pump.
Energies 13 06530 g006
Figure 7. PM2.5 and PM10 dust emissions of individual heating systems for an operating time of 400 to 1400 h over 20 years of use, where: I—electric heating power supply, II—liquid heating supplied from the district heating network, III—liquid heating powered by a hard coal boiler, IV—liquid heating powered by a biomass boiler, V—liquid heating with fuel oil boiler, VI—liquid heating powered by a natural gas boiler, VII—liquid heating powered by a ground source heat pump.
Energies 13 06530 g007
Figure 8. Global emission of the analyzed pollutants, taking into account the AQI shares for individual heating systems, for the installation operation time of 400 to 1400 h over 20 years of use, where: I—electric heating power supply, II—liquid heating supplied from the district heating network, III—liquid heating powered by a hard coal boiler, IV—liquid heating powered by a biomass boiler, V—liquid heating with fuel oil boiler, VI—liquid heating powered by a natural gas boiler, VII—liquid heating powered by a ground source heat pump.
Energies 13 06530 g008
Figure 9. The AQI share, financial share of individual installations and the total impact of both factors as a global share for the installation operating time of 1000 h over 20 years of use, where: I—electric heating power supply, II—liquid heating supplied from the district heating network, III—liquid heating powered by a hard coal boiler, IV—liquid heating powered by a biomass boiler, V—liquid heating with fuel oil boiler, VI—liquid heating powered by a natural gas boiler, VII—liquid heating powered by a ground source heat pump.
Energies 13 06530 g009
Table 1. Preliminary data.
NameDetails
heated surface A, m22900
unit installation power Qj, W/m2210
heat flow to the heating loops Q, kW610
electricityenergy cost, $/kWh0.13
system heatenergy cost, $/kWh0.06
hard coalenergy cost, $/kWh0.03
energy value, kWh/kg7.22
efficiency, %85.0
biomass-pelletenergy cost, $/kWh0.04
energy value, kWh/kg5.28
efficiency, %85.0
fuel oilenergy cost, $/kWh0.09
energy value, kWh/l10.2
efficiency, %95.0
natural gasenergy cost, $/kWh0.05
energy value, kWh/m39.86
efficiency, %98.0
Table 2. Summary of calculation data for the analyzed heat pump solution.
Name.Details
heat flow to the heating loops Q, kW610
selected heat pump2× Viessmann Vitocal 300G PRO 302.C230
workplace B/B, °C/°C5/10
heating power QPC, kW2 × 305
power consumption of the heat pump P, kW2 × 35.9
seasonal coefficient of performance SCOP3.9
amount of heat to be taken from the ground Qk, kW454
length of the vertical heat exchanger L, m9072
amount of drillings n61
Table 3. Investment expenditure on individual heating systems.
Heating systemComponentsTotal Capital Expenditure (Kin), $
electric heating power supply (I)electric heating elements with complete accessories, control system and automatics66,685
liquid heating supplied from the district heating network (II)heating junction, liquid pipe system, other elements of the system: heat exchanger, pipelines, fittings, automation system, labour and system start-up95,265
liquid heating powered by a hard coal boiler (III)coal boiler, liquid pipe system, other elements of the system: heat exchanger, pipelines, fittings, automation system, labour and system start-up107,173
liquid heating powered by a biomass boiler (IV)biomass boiler, liquid pipe system, other elements of the system: heat exchanger, pipelines, fittings, automation system, labour and system start-up119,081
liquid heating with fuel oil boiler (V)fuel oil boiler, liquid pipe system, other elements of the system: heat exchanger, pipelines, fittings, automation system, labour and system start-up100,028
liquid heating powered by a natural gas boiler (VI)natural gas boiler, liquid pipe system, other elements of the system: heat exchanger, pipelines, fittings, automation system, labour and system start-up100,028
liquid heating powered by a ground source heat pump (VII)heat pump, lower and upper heat source, other system components: heat exchanger, pipelines, fittings, automation system, labour and system start-up345,900
Table 4. Specific emissions from individual heating systems.
Heating SystemSpecific Emissions of Pollutants
CO2,
kg/kWh
NOX,
g/kWh
SO2,
g/kWh
dust,
g/kWh
electric heating power supply (I)2280.242.211.44
liquid heating supplied from the district heating network (II)2600.272.541.65
liquid heating powered by a hard coal boiler (III)2800.302.791.82
liquid heating powered by a biomass boiler (IV)2700.230.030.24
liquid heating with fuel oil boiler (V)2990.220.130.04
liquid heating powered by a natural gas boiler (VI)2180.170.0000080.00005
liquid heating powered by a ground source heat pump (VII)600.060.580.38
Table 5. Shares of analyzed pollutants according to AQI coefficient.
Share of Contaminants by AQI
CO2NOXSO2PM2.5/10
0.1980.1570.3540.291
Publisher’s Note: MDPI stays neutral with regard to jurisdictional claims in published maps and institutional affiliations.