Article

Environmental Impacts of Charging Concepts for Battery Electric Vehicles: A Comparison of On-Board and Off-Board Charging Systems Based on a Life Cycle Assessment

1
Chair of Technology and Innovation Management, University of Bayreuth, 95440 Bayreuth, Germany
2
Institute for Future Energy Consumer Needs and Behavior (FCN), RWTH Aachen University, 52074 Aachen, Germany
3
Institute for Power Generation and Storage Systems (PGS), RWTH Aachen University, 52074 Aachen, Germany
4
Forschungszentrum Jülich, Institute of Energy and Climate Research–Systems Analysis and Technology Evaluation (IEK-STE), 52425 Jülich, Germany
5
JARA-ENERGY, 52425 Jülich, Germany
6
JARA-ENERGY, 52074 Aachen, Germany
*
Authors to whom correspondence should be addressed.
Energies 2020, 13(24), 6508; https://doi.org/10.3390/en13246508
Submission received: 31 August 2020 / Revised: 30 November 2020 / Accepted: 2 December 2020 / Published: 9 December 2020

Abstract

:
We investigate the environmental impacts of on-board (based on alternating current, AC) and off-board (based on direct current, DC) charging concepts for electric vehicles using Life Cycle Assessment and considering a maximum charging power of 22 kW (AC) and 50 kW (DC). Our results show that the manufacturing of chargers provokes the highest contribution to environmental impacts of the production phase. Within the chargers, the filters could be identified as main polluters for all power levels. When comparing the results on a system level, the DC system causes less environmental impact than the AC system in all impact categories. In our diffusion scenarios for electric vehicles, annual emission reductions of up to 35 million kg CO2-eq. could be achieved when the DC system is used instead of the AC system. In addition to the environmental assessment, we examine economic effects. Here, we find annual savings of up to 8.5 million euros, when the DC system is used instead of the AC system.

Graphical Abstract

1. Introduction

As the average temperature on earth is increasing [1,2,3], both environmental and economic consequences are to be expected [4,5]. Hence, there are international efforts to reduce this rise to below 2 °C in the long-term and binding targets have been agreed in the Kyoto Protocol and the Paris Agreement, among others [5,6].
Being one of the largest global economies, Germany emitted 858 mn. tons of CO2-equivalent (CO2-eq.) in 2018, 19% of which originated in the transport sector [7]. Within the transport sector, passenger cars are a major source of emissions [8]. Modern, non-fossil fuel-based propulsion systems offer opportunities to reduce the emissions and thereby help to mitigate climate change and to reduce dependence on oil imports. In recent decades, electro mobility has proven to be a competitive alternative to existing mobility concepts [9,10,11]. The continuing decline in battery prices [12] and the falling prices for electric vehicles (EVs) indicate good chances for further market growth [11,13].
An important factor for the diffusion of EVs is the provision of an appropriate charging infrastructure. In the period from 2017 to 2020, 750 mn. euros were being spent for the expansion of the charging infrastructure in Germany [14].
To charge the batteries of EVs, usually, alternating current (AC) from public grids is used. As the battery represents a DC (direct current) power source, a conversion from AC to DC is necessary for proper charging. This conversion is done by power electronics. Using an AC-DC converter, alternating sinusoidal voltage is converted to DC, which is then in turn adapted to the charging requirements of the EV and regulated accordingly (DC-DC converter) [15].
While AC charging requires on-board power electronics, DC also allows for off-board charging. On-board chargers (OBCs) are constrained in their size, and therefore their charging capacity, due to weight, cost, and space restrictions. Off-board Chargers (OfBCs) are less limited in terms of size and weight and thus allow for higher charging capacities. OfBCs are currently the standard for all charging capacities greater than 22 kW.
Life Cycle Assessments (LCAs) have been intensively used in the literature to estimate the environmental impact of electric vehicles compared to fuel-based vehicles (e.g., [10,16,17,18]). However, only a few works deal with the different charging systems of electric vehicles and their environmental impacts [19,20,21,22]. None of the papers compares in detail mutually exclusive AC and DC charging systems in order to generate findings as to whether one of the two systems should be used preferentially based on potential ecological and/or economic advantages. We contribute to this research gap by investigating the potential of DC-based off-board charging technology to reduce the environmental impact and costs of charging technologies for EVs. We conduct a comparative LCA for both charging technologies: AC-based on-board charging and DC-based off-board charging. Further, we assess the systemic impact when upscaling the systems (i.e., larger vehicle stock, more charging infrastructure) as well as the potential cost savings that come with OfBCs within different scenarios.
Our scenarios as well as some assumptions made for modeling are based on the German market; however, most of our results possess a high generalizability. Although the electrical charging infrastructure differs among countries (e.g., different voltage levels) and therefore other components are used, our relative analysis between the systems will remain valid. Accordingly, it can be assumed that the basic results of the paper, namely the result of the system comparison, have a high generalizability.
The remainder of our work is structured as follows: In Section 2, we provide an overview of the materials and methods used and present our systems, our scenarios, and the components modeled for the environmental assessment. In Section 3, we present the results of our environmental assessment on a component and system level. Furthermore, we carry out an economic assessment of the systems on a national level and present the results. Section 4 gives a summary of our paper and states the limitations as well as an outlook for future research.

2. Materials and Methods

In the following paragraphs, we (1) define the technological systems under investigation and (2) the scenarios used for their assessment. Then, we (3) provide the goal definition and scoping as well as the Life Cycle Inventory (LCI) and the Life Cycle Impact Assessment (LCIA) for our LCA.

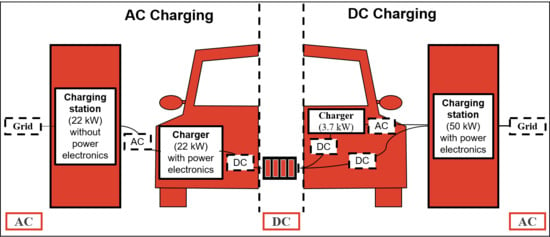
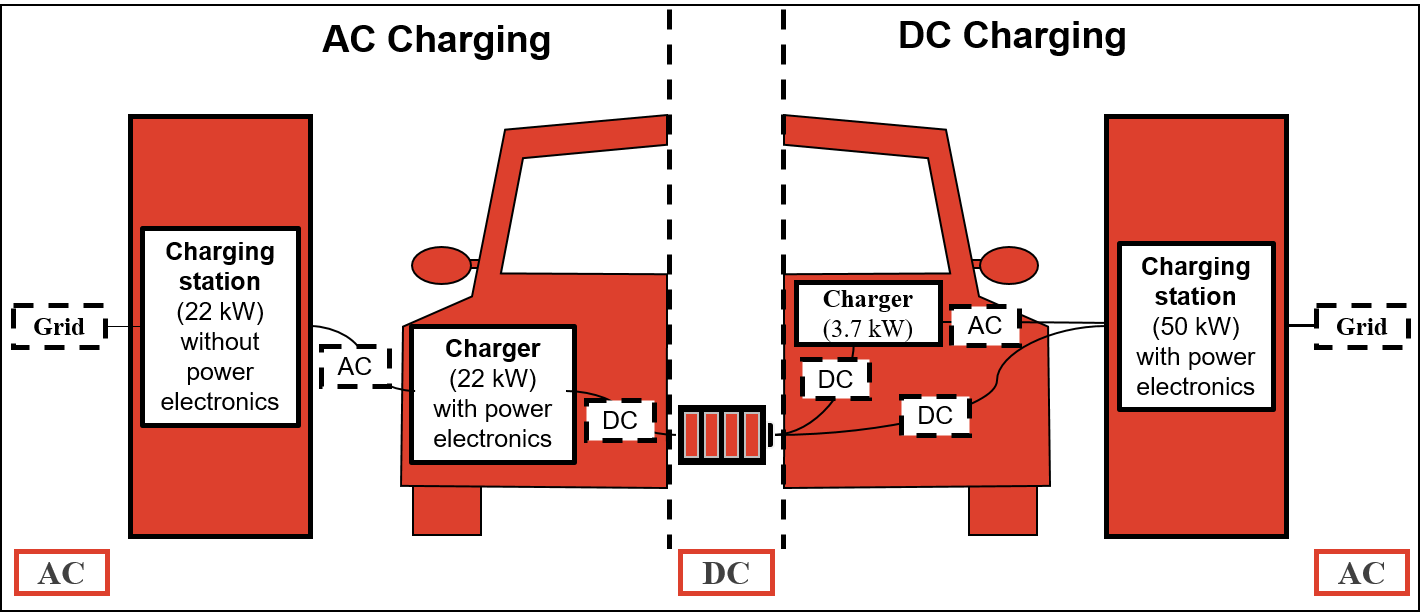
2.1. Technological Systems

To assess the potential environmental and economic benefits of DC-based charging infrastructure for battery electric vehicles (BEVs), we define two technological systems:
  • In our AC system, all electric vehicles have an OBC to charge the battery with a power up to 22 kW. Any publicly accessible charging point provides a charging capacity of 22 kW. For charging at home, a 3.7 kW charging point (AC) is available. Charging with 3.7 kW requires no additional power electronics.
  • In our DC system, each electric vehicle is equipped with an OBC with 3.7 kW charging power that allows for charging at home (AC). Additionally, all electric vehicles can be charged with an OfBC with 50 kW charging power at publicly accessible charging points (DC).
Please note that the introduced names of our systems are determined by the publicly accessible charging infrastructure. In the AC system, charging at public charging infrastructure is only possible with AC; in the DC system, charging at public charging infrastructure is only possible with DC. The AC OBC with 3.7 kW in the DC system is used for a more realistic representation of the systems, but it does not constitute the name of the system.
Furthermore, we differentiate between chargers and charging infrastructure (CIS). When talking about CIS, we consider the connection with the grid, the charging cable, and the housing of the charging station. The chargers in our study consist of the necessary power electronics and a housing for the power electronics. The power electronics essentially include the required converters, a filter, and additional electronic components such as printed circuit boards (PCBs) and busbars. The converters itself are composed of different electronic components such as diodes, MOSFETs, coils, capacitors, and transformers.
As indicated in Table 1, the number of components either scale with the number of charging points, the number of charging stations (which can consist of more than one charging point), or the number of BEVs.

2.2. Scenarios

To assess potential reductions of the environmental impact of charging infrastructure on a large scale, we introduce three scenarios regarding the diffusion of BEVs in Germany. Using the Bass diffusion model [23], we differentiate the following potential diffusion curves:
  • In the first scenario (S), the innovation and imitation coefficients of the Bass model are adopted from [24]. Although [24] data are based on data of global sales of hybrid Toyota vehicles, they are considered to be sufficiently good estimates. The values for the vehicle stock, the number of new registrations, and the number of retired passenger cars are taken from [25]. For a near future distribution, a vehicle stock of 170,000 vehicles is estimated, which seems to be reasonable (136,617 electric vehicles on 1 January 2020 in Germany [26]).
  • The second scenario (M) is based on data by [27,28], who state the objective that road traffic in Germany should be climate-neutral by 2050. One possibility of how this aim might be reached is to regulate the registration of new cars so that solely BEVs can be registered. For our estimation, we assume that as of 2040, only BEVs can be newly registered, which leads to a vehicle stock of about 220,000 BEVs in the near future. Comparable values can be estimated when calculating innovation and imitation coefficients based on the vehicle stock [25] and the new vehicle registrations of electric vehicles [29].
  • The third scenario (L) is based on the aim of one million electric vehicles in 2020 [30]. According to [31] and the actual vehicle stock [26], this target is not realistically achievable for 2020, but experts assume that the million level could be reached in 2022 [31]. With the assumptions made for the market volume, we consider this limit as an intermediate target. We further assume that the vehicle stock is increasing exponentially up to that limit, resulting in a vehicle stock of 310,000 BEVs in the near future. Table 2 shows the vehicle stocks in the three scenarios presented.
We base the demand for publicly accessible CIS on the electricity demand of the vehicle stock in each scenario. We calculate this electricity demand considering the number of vehicles in each scenario derived from the bass diffusion models, the load requirements per BEV, and the share of at-home-charging (i.e., non-public charging).
To calculate the load requirements for BEVs, we consider the mileage as well as the average efficiency. To estimate the efficiency of a diverse vehicle stock, we assign the vehicles to three different classes: small car, compact car, and luxury car (sport cars are also regarded as luxury cars in our study). We calculate a ratio of the segments on the total stock of 0.28, 0.57, and 0.15 respectively (based on [32]) and also calculate the vehicle stock within each class. Furthermore, we derive average efficiencies for each class (13 kWh/(100 km), 14 kWh/(100 km), and 21 kWh/(100 km) respectively) based on current market data [33,34,35,36,37,38,39,40,41]. We assume these ratios to be constant over time. For the annual mileage, we assume a constant value of 13,922 km, regardless of the vehicles’ class [42].
We estimate the share of public charging based on various studies [43,44,45,46,47]. Hence, we consider a share of the total electricity provided by the public charging infrastructure to be 30% of the total electricity demand for charging. The total energy required by BEVs can either be charged at home or at a publicly accessible charging infrastructure. In our study, we assume that for both systems, home charging is possible (with 3.7 kW AC, see Section 2.1). Since a system comparison is intended, the charging infrastructure required for home charging is not considered. The energy requirements of home charging are considered only to the extent that they influence the required number of publicly accessible charging infrastructure. In the following, we focus on the charging infrastructure in the publicly accessible areas if not stated otherwise.
To derive the number of publicly accessible charging points, the rate of utilization for a charging point, the efficiency of the charging point, and the number of charging points within a charging station need to be estimated.
We define the rate of utilization as the ratio of the time a charging point is used to the time a charging point theoretically can be used. For the theoretically usable time, we assume a theoretically possible utilization of 12 h a day and 302 days a year. In addition, we assume that each charging point is directly available to other users as soon as the previous car is fully charged (i.e., no additional time gaps). In our study, the rate of utilization is 10%, which implies that there are about 12 BEVs per charging point for the AC system and 27 BEVs for the DC system. This is within the range of the number of electric vehicles per charging point stated in other studies [48,49,50].
Data available from manufacturers [51,52,53,54] indicate an efficiency for the charging process from 90% to 95% for their charging stations. Using a conservative estimate, we determine an efficiency of 90%.
With the given data, we calculate the energy provided by each charging point and combine it with the already determined energy demand. For the amount of charging stations, an average of two charging points per charging station is assumed [55]. The resulting number of charging points and charging stations for the scenarios can be seen in Table 2. The formula for the underlying calculations can be found in Appendix A.

2.3. Life Cycle Assessment (LCA): Scope and Goal Definition, Life Cycle Inventory (LCI), and Life Cycle Impact Assessment (LCIA)

Having described the technological systems under investigation and having introduced our scenarios, we will now summarize relevant materials and methods of the LCA that we have conducted to assess the environmental impacts of different charging infrastructures. LCA is a commonly used environmental assessment concept [56]. The structure and methodological aspects of LCA are described in the ISO 14040 and ISO 14044 standards [57,58]. Each LCA can be sub-divided into four phases: the goal and scope definition, Life Cycle Inventory analysis (LCI), Life Cycle Impact Assessment (LCIA), and interpretation.
For our assessment, we use Ecoinvent 3.4 [59] as a database and apply the so-called cut-off method. We incorporate the database into the software openLCA 1.7.2 [60].

2.3.1. Goal and Scope

The goal of this LCA is to determine and compare the systemic environmental impact of the previously described AC and DC-based charging systems. We distinguish between production, transport, and use phases. Due to a lack of data on the regarding processes, recycling is not considered. The functional unit is a kilowatt hour (kWh) that is facilitated by the publicly accessible charging infrastructure. The components examined can be seen in Figure 1. The assumed lifetime for all components is 10 years [49,61,62]. Furthermore, we assume that this lifetime applies to all components so that neither the chargers nor the batteries in the BEVs need to be replaced during the lifetime. In accordance with the common LCA method, we conduct the assessment with scaling to a functional unit (i.e., the provision of one kWh charging energy).
We neglect the additional consumption of fuel due to the weight of the chargers (for an estimation of weight-related effects, see e.g., [63]) and estimate the life cycle inventories to the extend necessary due to the non-availability of data. Furthermore, the assembly of the chargers is not considered in the production phase. The geographical scope of our analysis is Germany; however, there are few indications that the findings significantly differ in other countries as discussed in the introduction section. Further, it is assumed that the rate of utilization is constant over time.
Modular approaches for chargers are often chosen to provide high flexibility and worldwide network connectivity [54,64,65,66]. On the one hand, this allows for a better use of economies of scale for power electronic components; on the other hand, it reduces the maintenance cost and the total failure times of the charging stations. In addition, the charging infrastructure can be gradually adapted to changing charging requirements. Moreover, the overall efficiency can be enhanced by modularity. Therefore, all systems are based on an interconnection of 3.7 kW chargers.
The topologies used for the chargers are mainly based on the work of [67,68]. Therefore, the main reasons are the possibility of modular connection and the well-documented use of components used. The chargers are unidirectional.

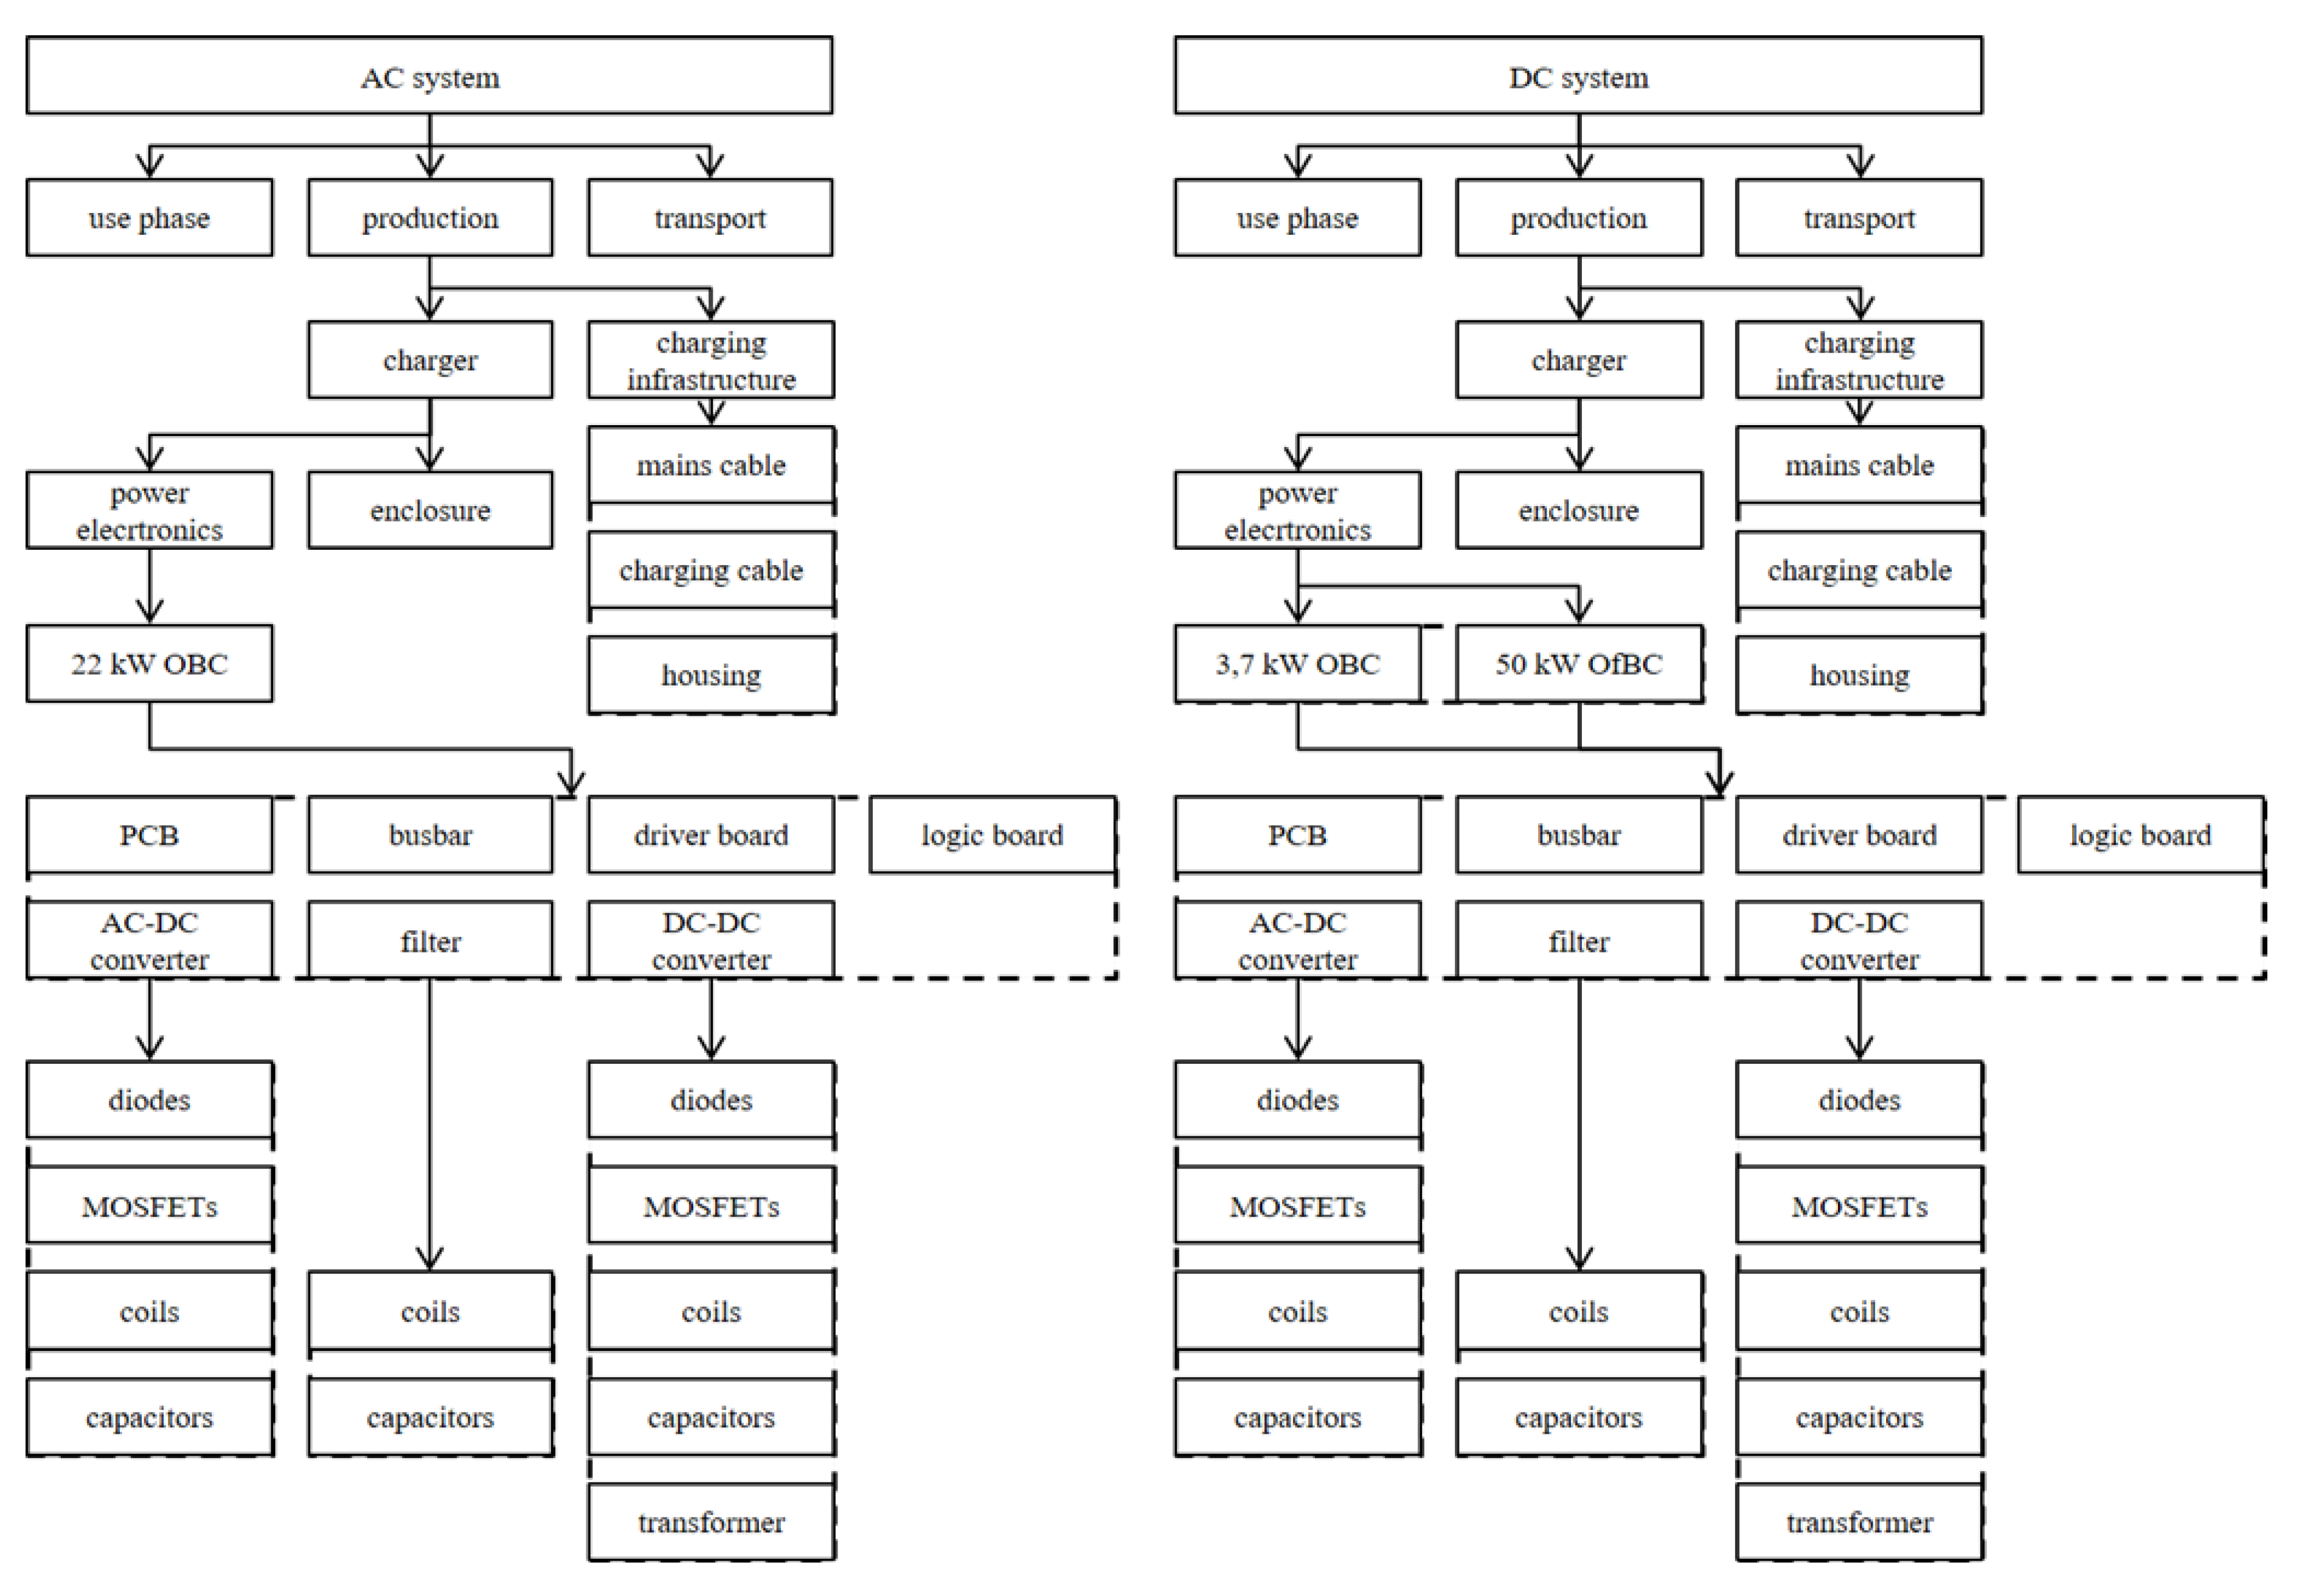
2.3.2. Life Cycle Inventory (LCI)

In the following, we briefly describe the LCI, starting with the production phase of the chargers’ components. Eventually, we summarize our inventory assumptions for the transport and use phase. For reasons of brevity, additional assumptions about the components for the LCI can be found in Appendix B (see Table A1 and Table A2).

Production of Components

The components used for the chargers are based on [68,69]. Components for which no sufficient data are available are replaced by appropriate components for which the corresponding data are accessible. The main distinction between the 3.7 kW OBC, the 22 kW OBC, and the 50 kW OfBC is the number of the required components. A general overview of modeled systems in this study can be found in Figure 1. In the following, we present each component separately.
  • Filter
Low-pass filters are a frequently used option for limiting high-frequency oscillations and noise emissions. Since LCL filters are often used for chargers with a high charging capacity [70,71,72], we use an LCL filter in our study. The dimensioning of the filter and its components depends on the associated rectifier and hence on all downstream components [70,73,74]. In our paper, we base the dimensioning of the LCL filter on [72,75], respectively. The components used in our study can be found in Table 3. The number of components is determined by the performance of the chargers, their electrical connection, and the specifications of the components used. To estimate the environmental impacts of the coils, the Ecoinvent [59] dataset for inductors is used as a fairly good estimate and scaled with the associated mass. The production process of the capacitor is modeled using the Ecoinvent [59] dataset “capacitor, film type, for through-hole mounting”.
  • AC-DC converter
As for AC-DC converters, we use rectifiers with a downstream power factor correction stage (PFC-converters). The rectifier bridge is combined with a step-up converter. The components used for modeling the AC-DC converter can be found in Table 4. MOSFETs and diodes are modeled with the material data given by the manufacturers and the Ecoinvent production processes for transistors and diodes. The ceramic capacitor used in [67] is modeled with the mass of the capacitor and the dataset for the production of capacitors for surface-mounting in the Ecoinvent database.
  • DC-DC converter
As for DC-DC converters, a common topology for chargers is the isolated full bridge with phase shifted operation. By adjusting the voltage of the active side, the voltage can be adapted to the state of charge of the battery [82,83]. The components used for the DC-DC converter can be found in Table 5. The MOSFETs are taken from [67]. The material data are given by the manufacturer. For the production process, we use the Ecoinvent dataset for transistors. For the diodes as well as for the capacitor, the stated components are used instead of the ones from [67] due to the non-availability of data. The material data for the diodes are given by the manufacturer; for the production process, the Ecoinvent dataset for diodes is used. The capacitor is modeled as stated before for the AC-DC converter. The production process is modeled with the Ecoinvent dataset for inductors.
The dimensioning of the transformer for galvanic isolation is based on [85]. Elgström and Nordgren [85] dimensioned the transformer for a load of 5.5 kW, which is a sufficient estimate for our study. The stated transformer can be used for modular connection as well. Based on the information on the core [85,86] and the turns ratio, we can calculate the amount of ferrite and copper. For the production process, the Ecoinvent [59] dataset for wire drawing is used.
  • Printed circuit board (PCB), driver board, logic board and busbars
To mount the electronic components, a PCB is used. We estimate the size based on the outer dimension of the chargers. Details of the calculations can be found in the appendix. For the mounting of the PCB, we use input and output data from [87].
We adopt the driver board from [87]. According to Nordelöf and Alatalo [87], the structure of driver boards for three-phase inverters for the automotive sector vary negligibly with the power in a range from 20 to 200 kW. We use one of the stated driver boards for each 3.7 kW charging unit. The design of the logic board is also based on [87], and it is likewise assumed that one logic board is required for each 3.7 kW charging unit. We base the material flows and the production processes on [87].
We base the dimensioning of the busbar on [87,88]. The production process is modeled based on [87].
  • Enclosure of electronic components and heatsink.
Based on [67,87,89], we assume that all electronic components share the same enclosure. According to [90], the majority of enclosures is made of aluminum. The material flows and processes used for the production phase of the enclosure with an untreated surface are based on [87].
According to Nordelöf and Alatalo [87], the inverter unit considered can be air-cooled for charging capacities up to 50 kW, whereas higher power needs to be liquid-cooled. According to [91], air cooling can also be used for charging stations with significantly higher charging capacity. Therefore, we model an air-cooled heatsink; the material used is aluminum [87]. Process data are taken from [87].
  • Charging infrastructure
The modeled CIS consists of a mains cable for each charging station, a charging cable for each charging point, and a housing for each charging station.
We assume that charging stations with up to 100 kW output can be attached to the low-voltage grid [66]. A five-core cable is used as a mains cable with the diameter depending on the power supply. Details of the modeling can be found in the appendix. The length of the mains cable is set to 15 m.
According to [92,93], for a charging power up to 22 kW, a charging cable of the type 5G6 + 1 × 0.5 can be used. The total weight as well as the weight of copper is given in the dataset of [93]. For DC charging, a charging cable with diameter 3 × 16 mm2 and 3 × 2 × 0.75 mm2 is used [94]. To estimate the amount of copper, a cable from [95] with 3 × 16 + 3G2.5 is selected. The length of the charging cable is set to 4 m [92].
For 22 kW, a stand-alone housing made of stainless steel is modeled [96,97,98,99,100,101,102,103]. For the dimension of the charging stations with two 22 kW charging points, a rounded average of the manufacturers sizes is used [96,97,98,99,100,101,102,103,104,105,106,107,108,109,110].
The dimension of the charging station with two 50 kW charging points is taken from [111]. As material for the 50 kW charging station, stainless steel or a material mix with stainless steel is used [112,113]. For simplification, we model a housing out of stainless steel. Both dimensions are shown in Table 6.

Transport and Use Phase

For transportation, the Ecoinvent dataset for the transportation of electronic products is used [114]. The total mass is composed of the mass of the aforementioned components. Since the sites of the charging stations are not further specified, the transport of the enclosure, the mains cable, the charging cable, and the housing are not considered in our assessment.
The use phase considers the provision of one kWh at the publicly accessible charging point. To estimate the environmental impacts, we consider the low-voltage system from Ecoinvent. The energy mix can be found in Table A1 in Appendix B [115].

2.3.3. Life Cycle Impact Assessment (LCIA)

Various characterization models exist for impact assessment. According to [116], CML, ReCiPe, and TRACI represent examples of selectable models. Deviations between the underlying properties of these models can affect the LCIA results [117]. Consequently, information about the used LCIA methodology should be stated. We describe selected methodological aspects subsequently.
In recent years, the damage-based assessment method ReCiPe 2016 [118] has been increasingly used and is therefore selected for our study. Furthermore, for these LCIA methods, the midpoint and endpoint level of the environmental impacts can be assessed [119]. Endpoint impact indicators describe aggregated impacts on “areas of protection” (e.g., human health and the natural environment) [119,120]. Midpoint impact categories are located at an intermediate position of environmental impact cause–effect chains and consequently before the endpoint categories [119,120]. An advantage of midpoint indicators in comparison to endpoint indicators is their scientific robustness [121]. We use the Hierarchist perspective and carry out all evaluations on the midpoint level. With the choice of method, the impact categories, impact indicators, and characterization models defined in the method are simultaneously chosen. For the impact categories, we use the abbreviations shown in Table 7.

3. Results

Having described relevant materials and methods, we now show our results of the LCA and the economic analysis.

3.1. Results and Interpretation of the Life Cycle Impact Assessment (LCIA)

We show our results of the LCA first on a component level and then aggregate to a system level. Then, we scale our results according to our diffusion scenarios. Subsequently, we conduct sensitivity analyses to account for uncertainties in modeling.

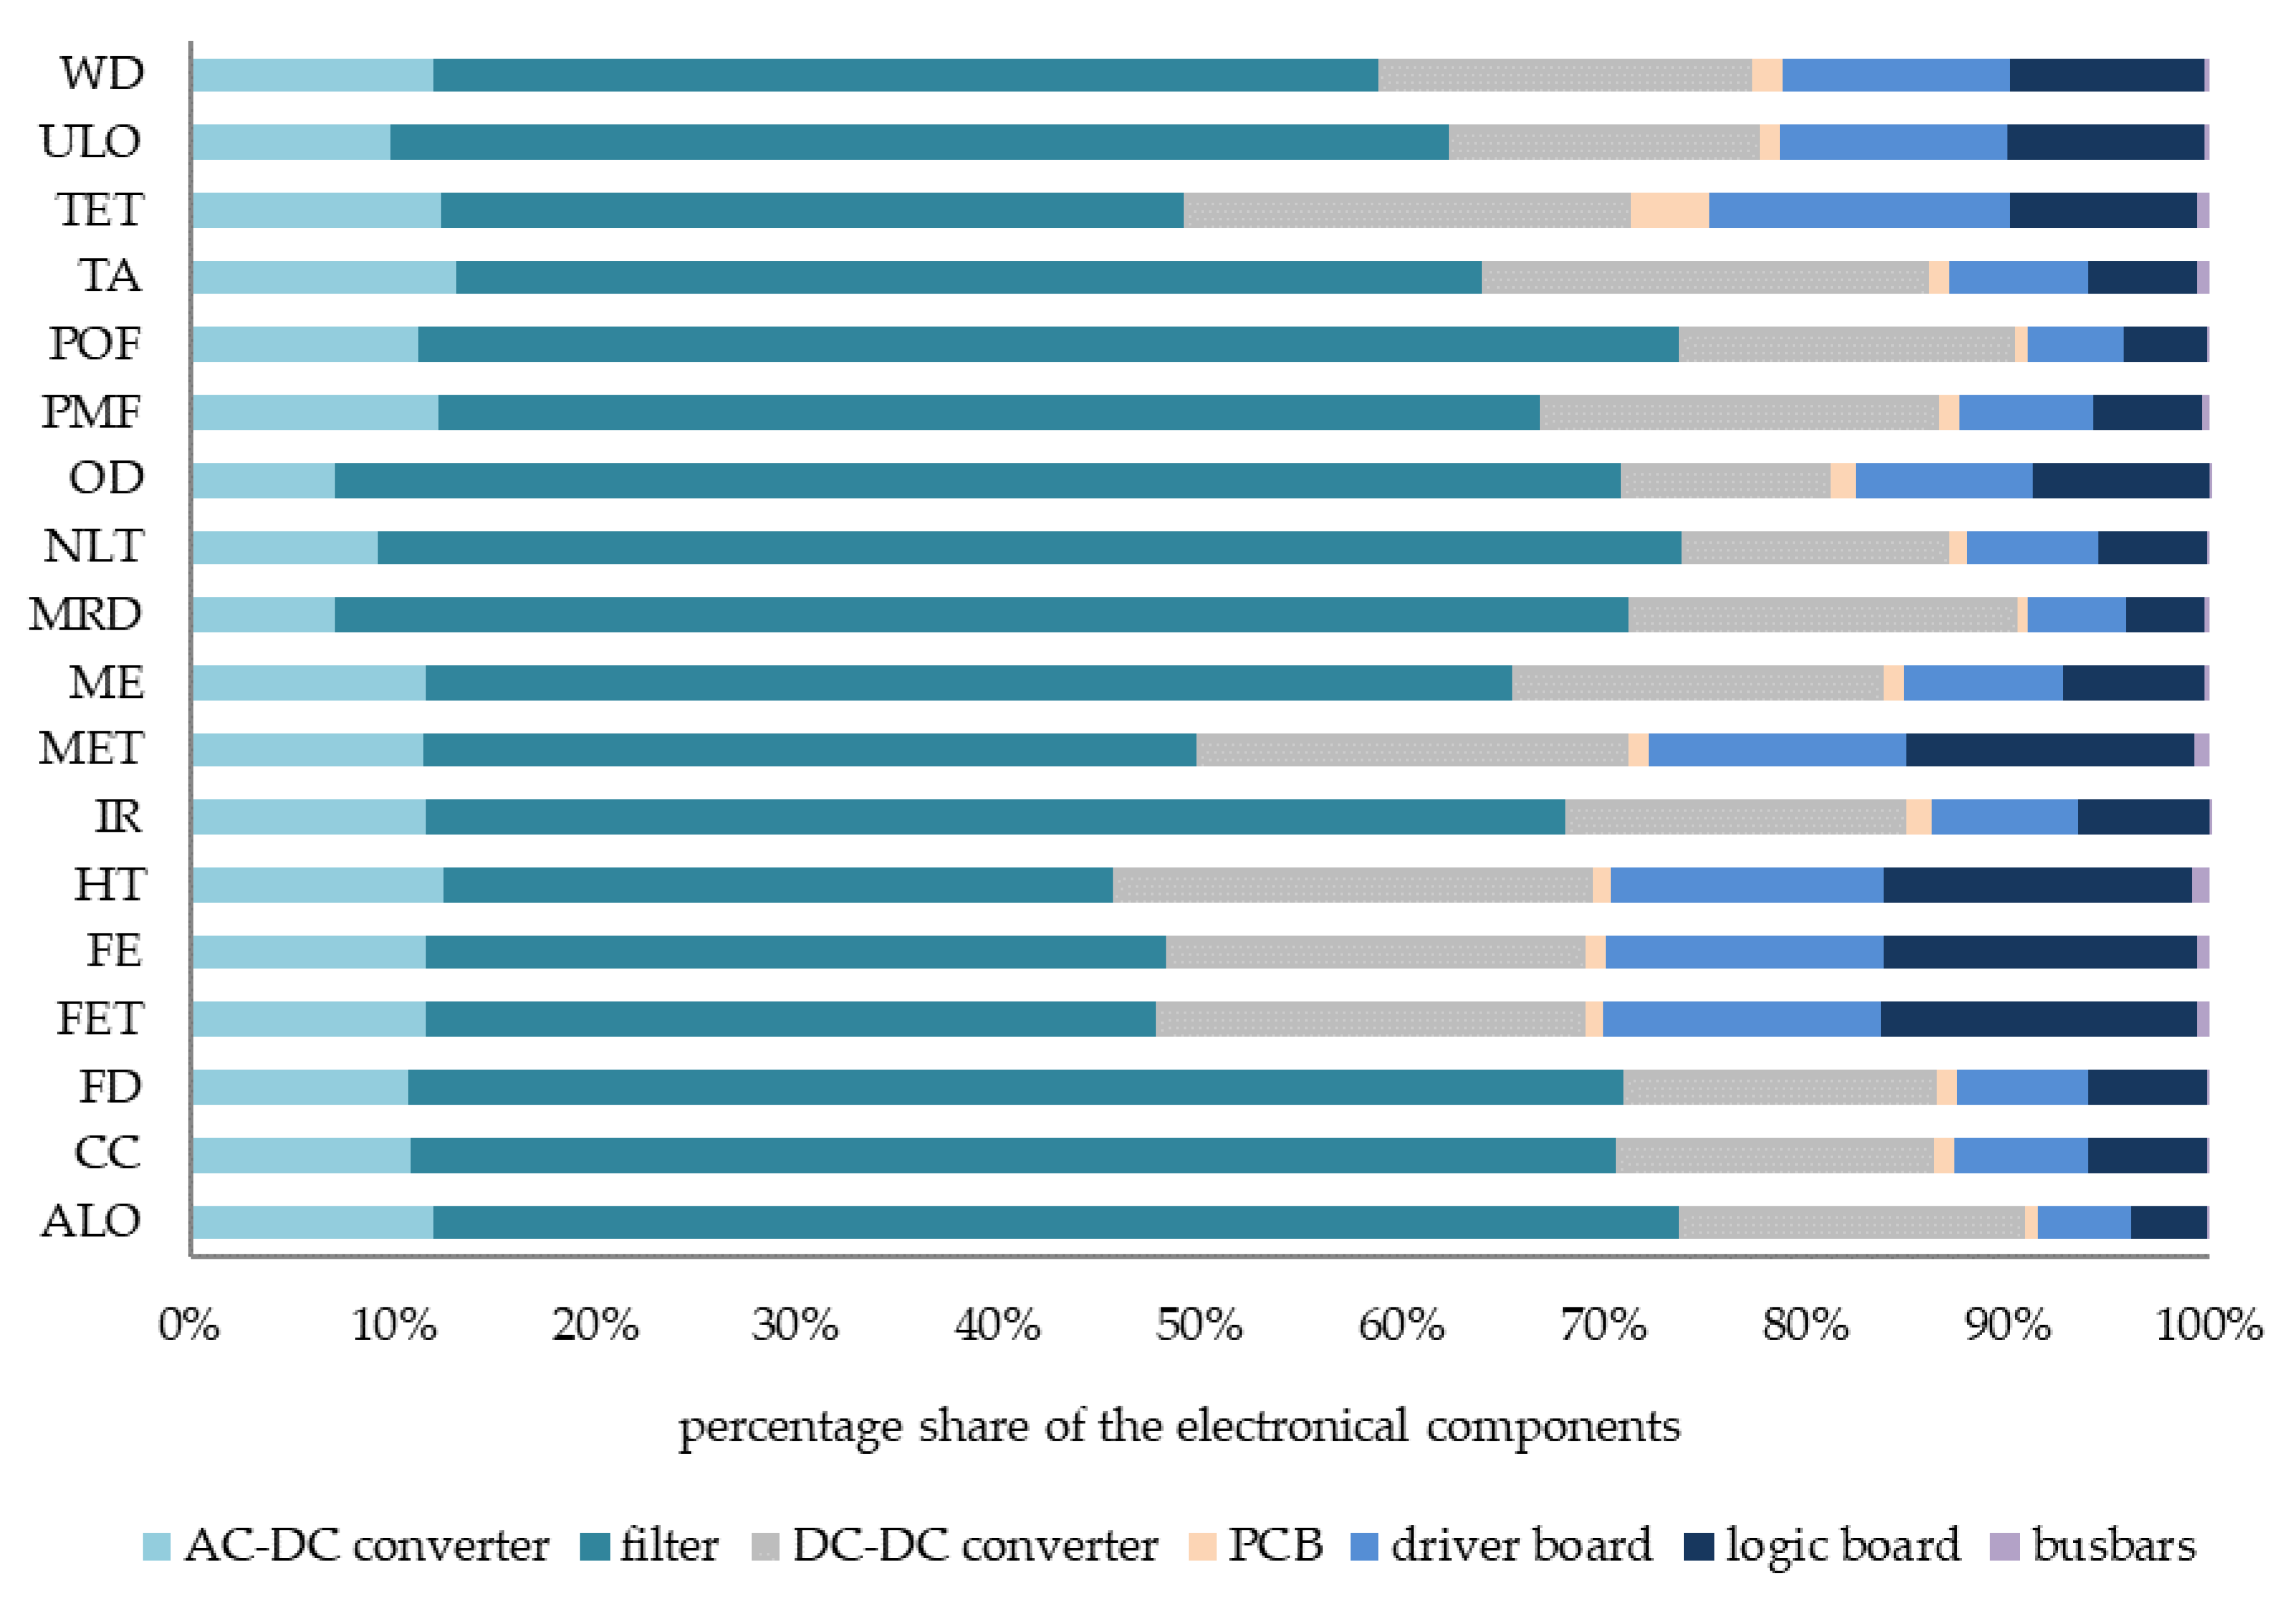
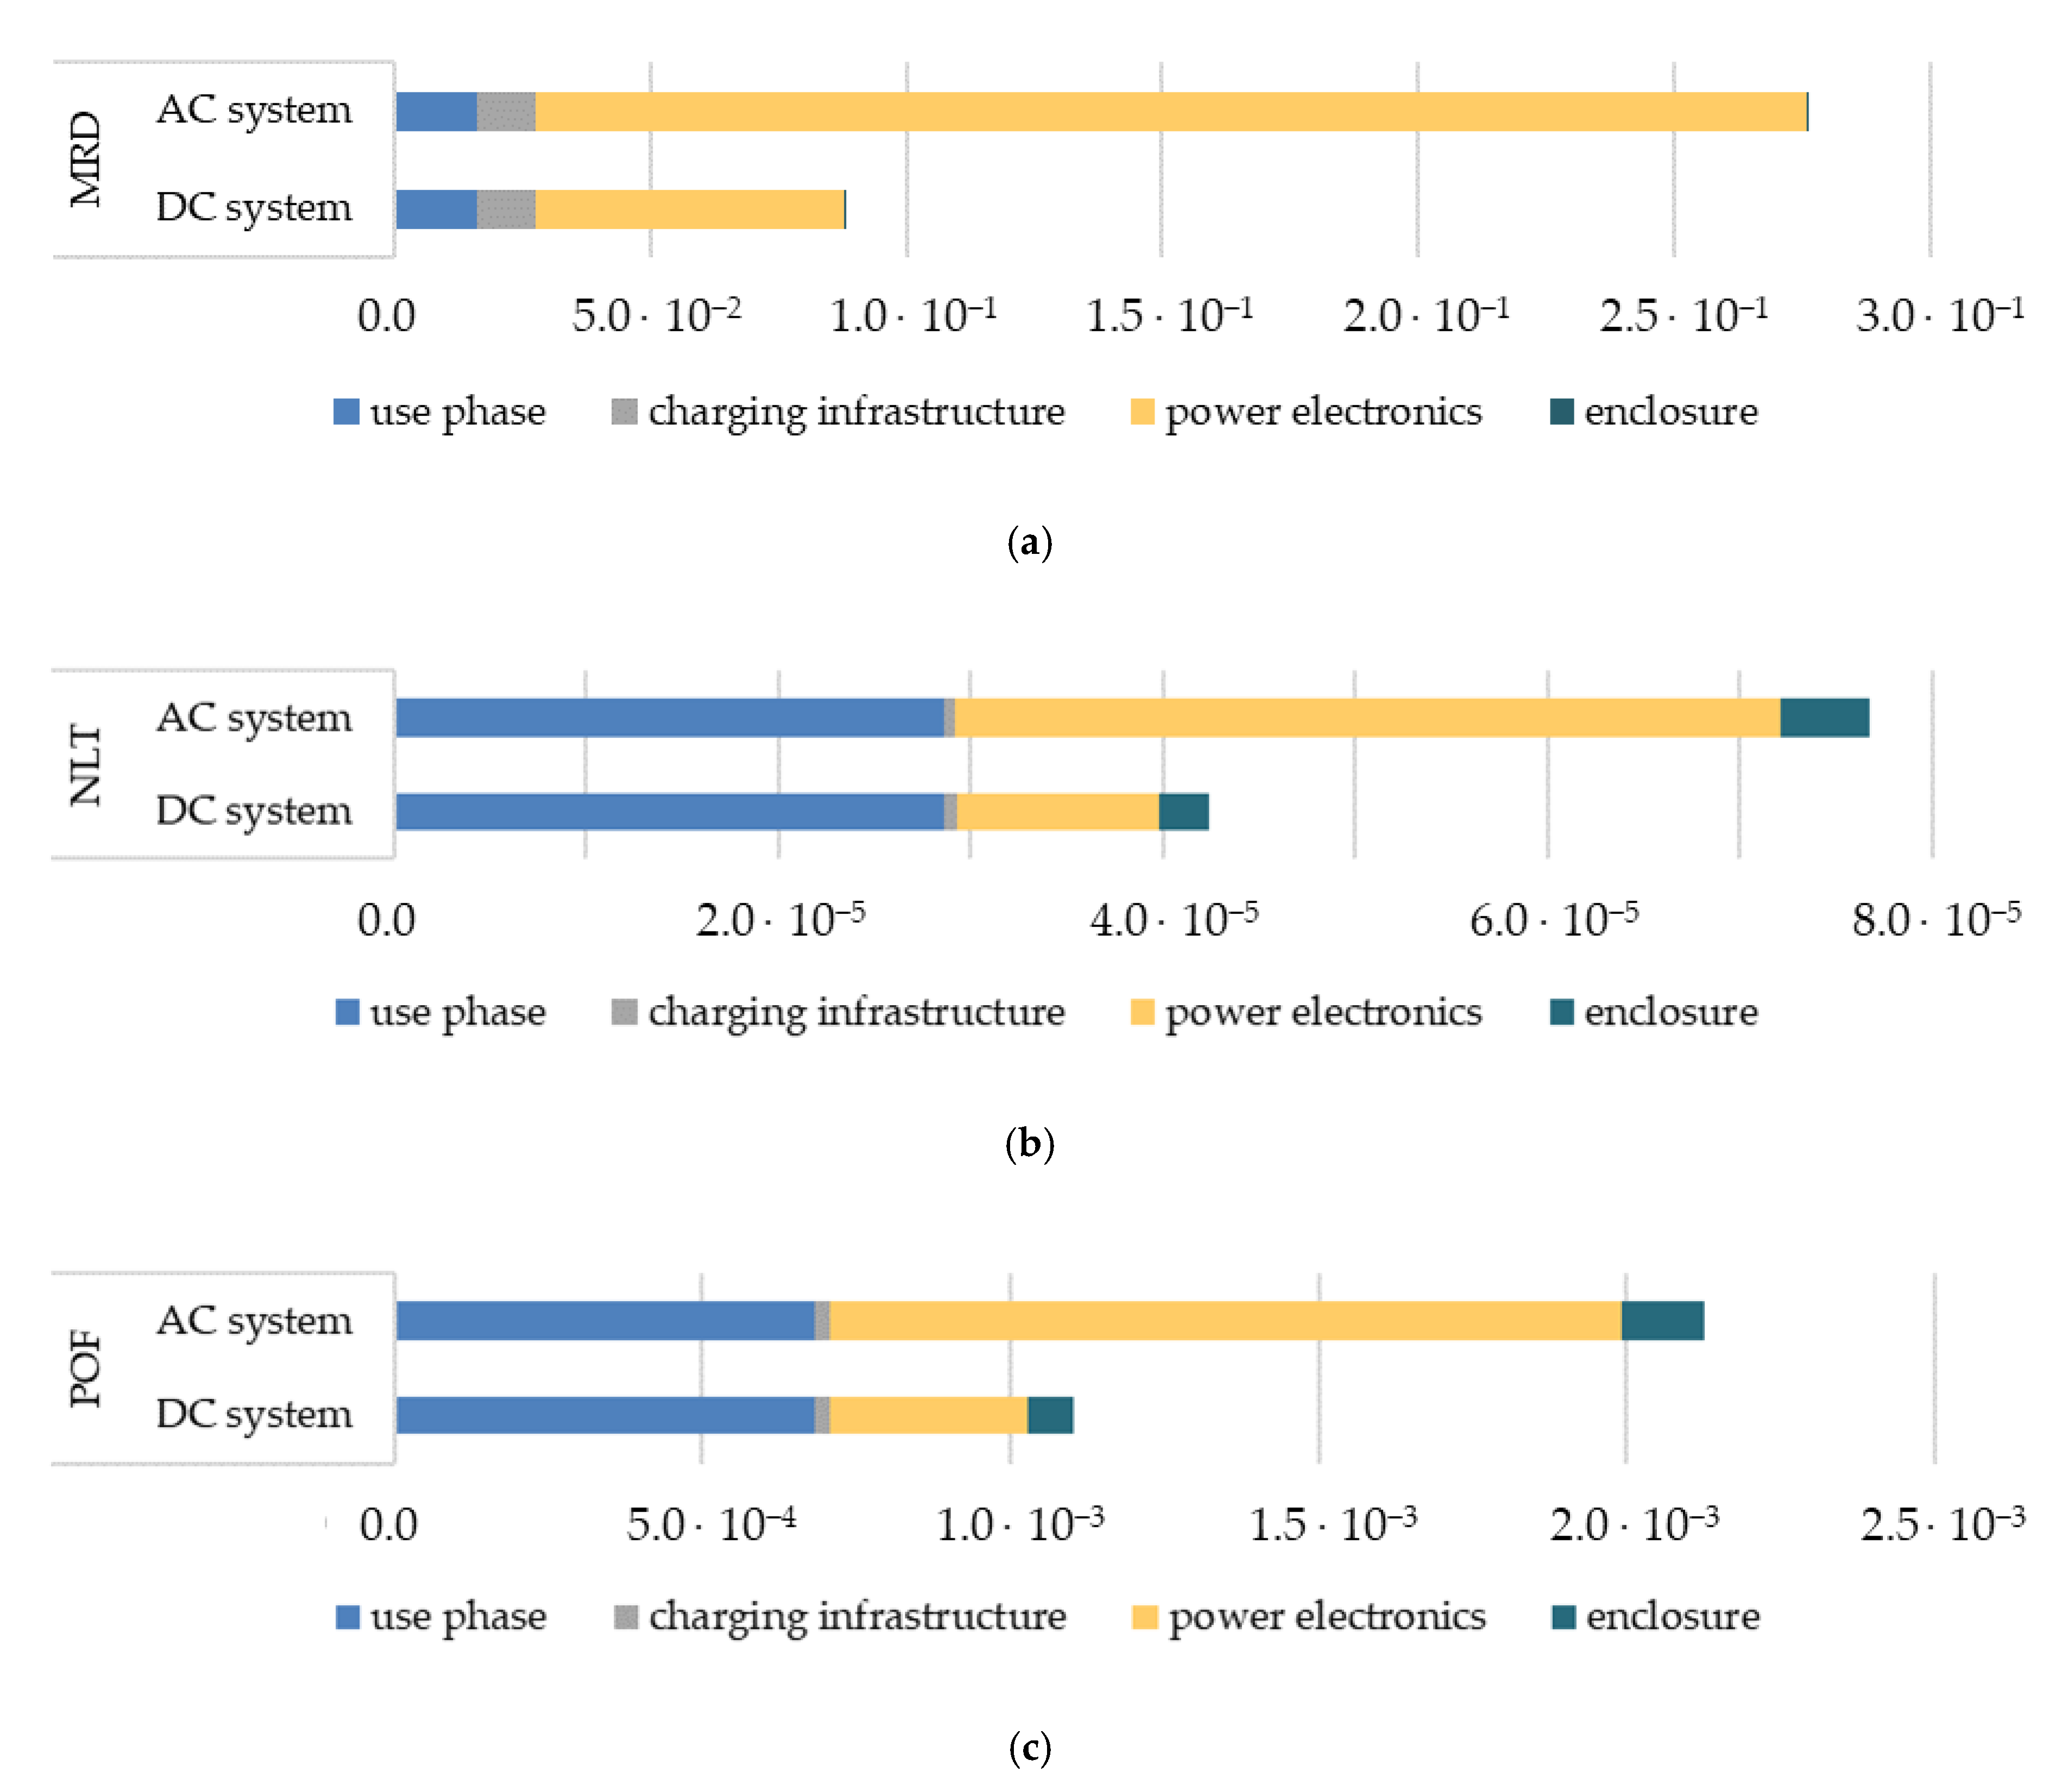
3.1.1. Component-Based Results

In the following, the component level is evaluated to identify individual components with high optimization potential within the power electronics and the charging infrastructure. This implies that the environmental impacts specified below apply to one provided kWh by one charger or one public charging station or one publicly accessible charging point, respectively.
  • Power electronics
We identify the filter to be a main polluter for 3.7 kW chargers as well as for 22 kW chargers. For 50 kW chargers, the filter as well as the DC-DC converter are main polluters. For all filters, the inverter-side coils are the main contributors to pollution. In the DC-DC converter, the coils and transformers are the components with a major influence in all impact categories. The transformers outvalue the coils when it comes to mineral resource depletion, which can be explained with the ferrite used for the core. For the AC-DC converter, the coils are main polluters as well, followed by diodes, MOSFETs, and capacitors. The percentage share of the components can be found in Figure 2, which is exemplary for the 22 kW charger. See Table A3 in Appendix C for more detailed results.
When considering the impact of power electronics and the enclosure, it turns out that for the 22 kW charger, the power electronics account for more than 50% of the environmental impacts for all impact categories. The enclosure has the main impact for all chargers when it comes to climate change and the least when considering mineral resource depletion.
  • Charging infrastructure (CIS)
As for the CIS, we consider the mains cable, the charging cable, and the housing. For the 22 kW CIS, the mains cable is the main emitter in all impact categories. The mains cable has the highest impact in 13 out of 18 impact categories (except agricultural land occupation, climate change, fossil resource depletion, ionizing radiation, and ozone depletion) for the 50 kW charging station. When comparing the mains cable of the 22 kW CIS and the 50 kW CIS, the mains cable for the 50 kW charging station has between 72% (fossil resource depletion) and 90% (mineral resource depletion) higher impacts than the mains cable for the 22 kW charging station. Considering the charging cable, the charging cable for the 50 kW charging station causes between 39% (fossil resource depletion) and 146% (mineral resource depletion) higher impacts than the charging cable for the 22 kW charging station. For the 22 kW charging station, the charging cable causes less than 3.2% in all impact categories. For the 50 kW charging station, the impact of the charging cable is below 4% in all impact categories. The housing of the 50 kW charging station causes about three times higher impacts than the 22 kW charging station for all impact categories. For both charging stations, the housing has the highest impact in the impact category climate change.

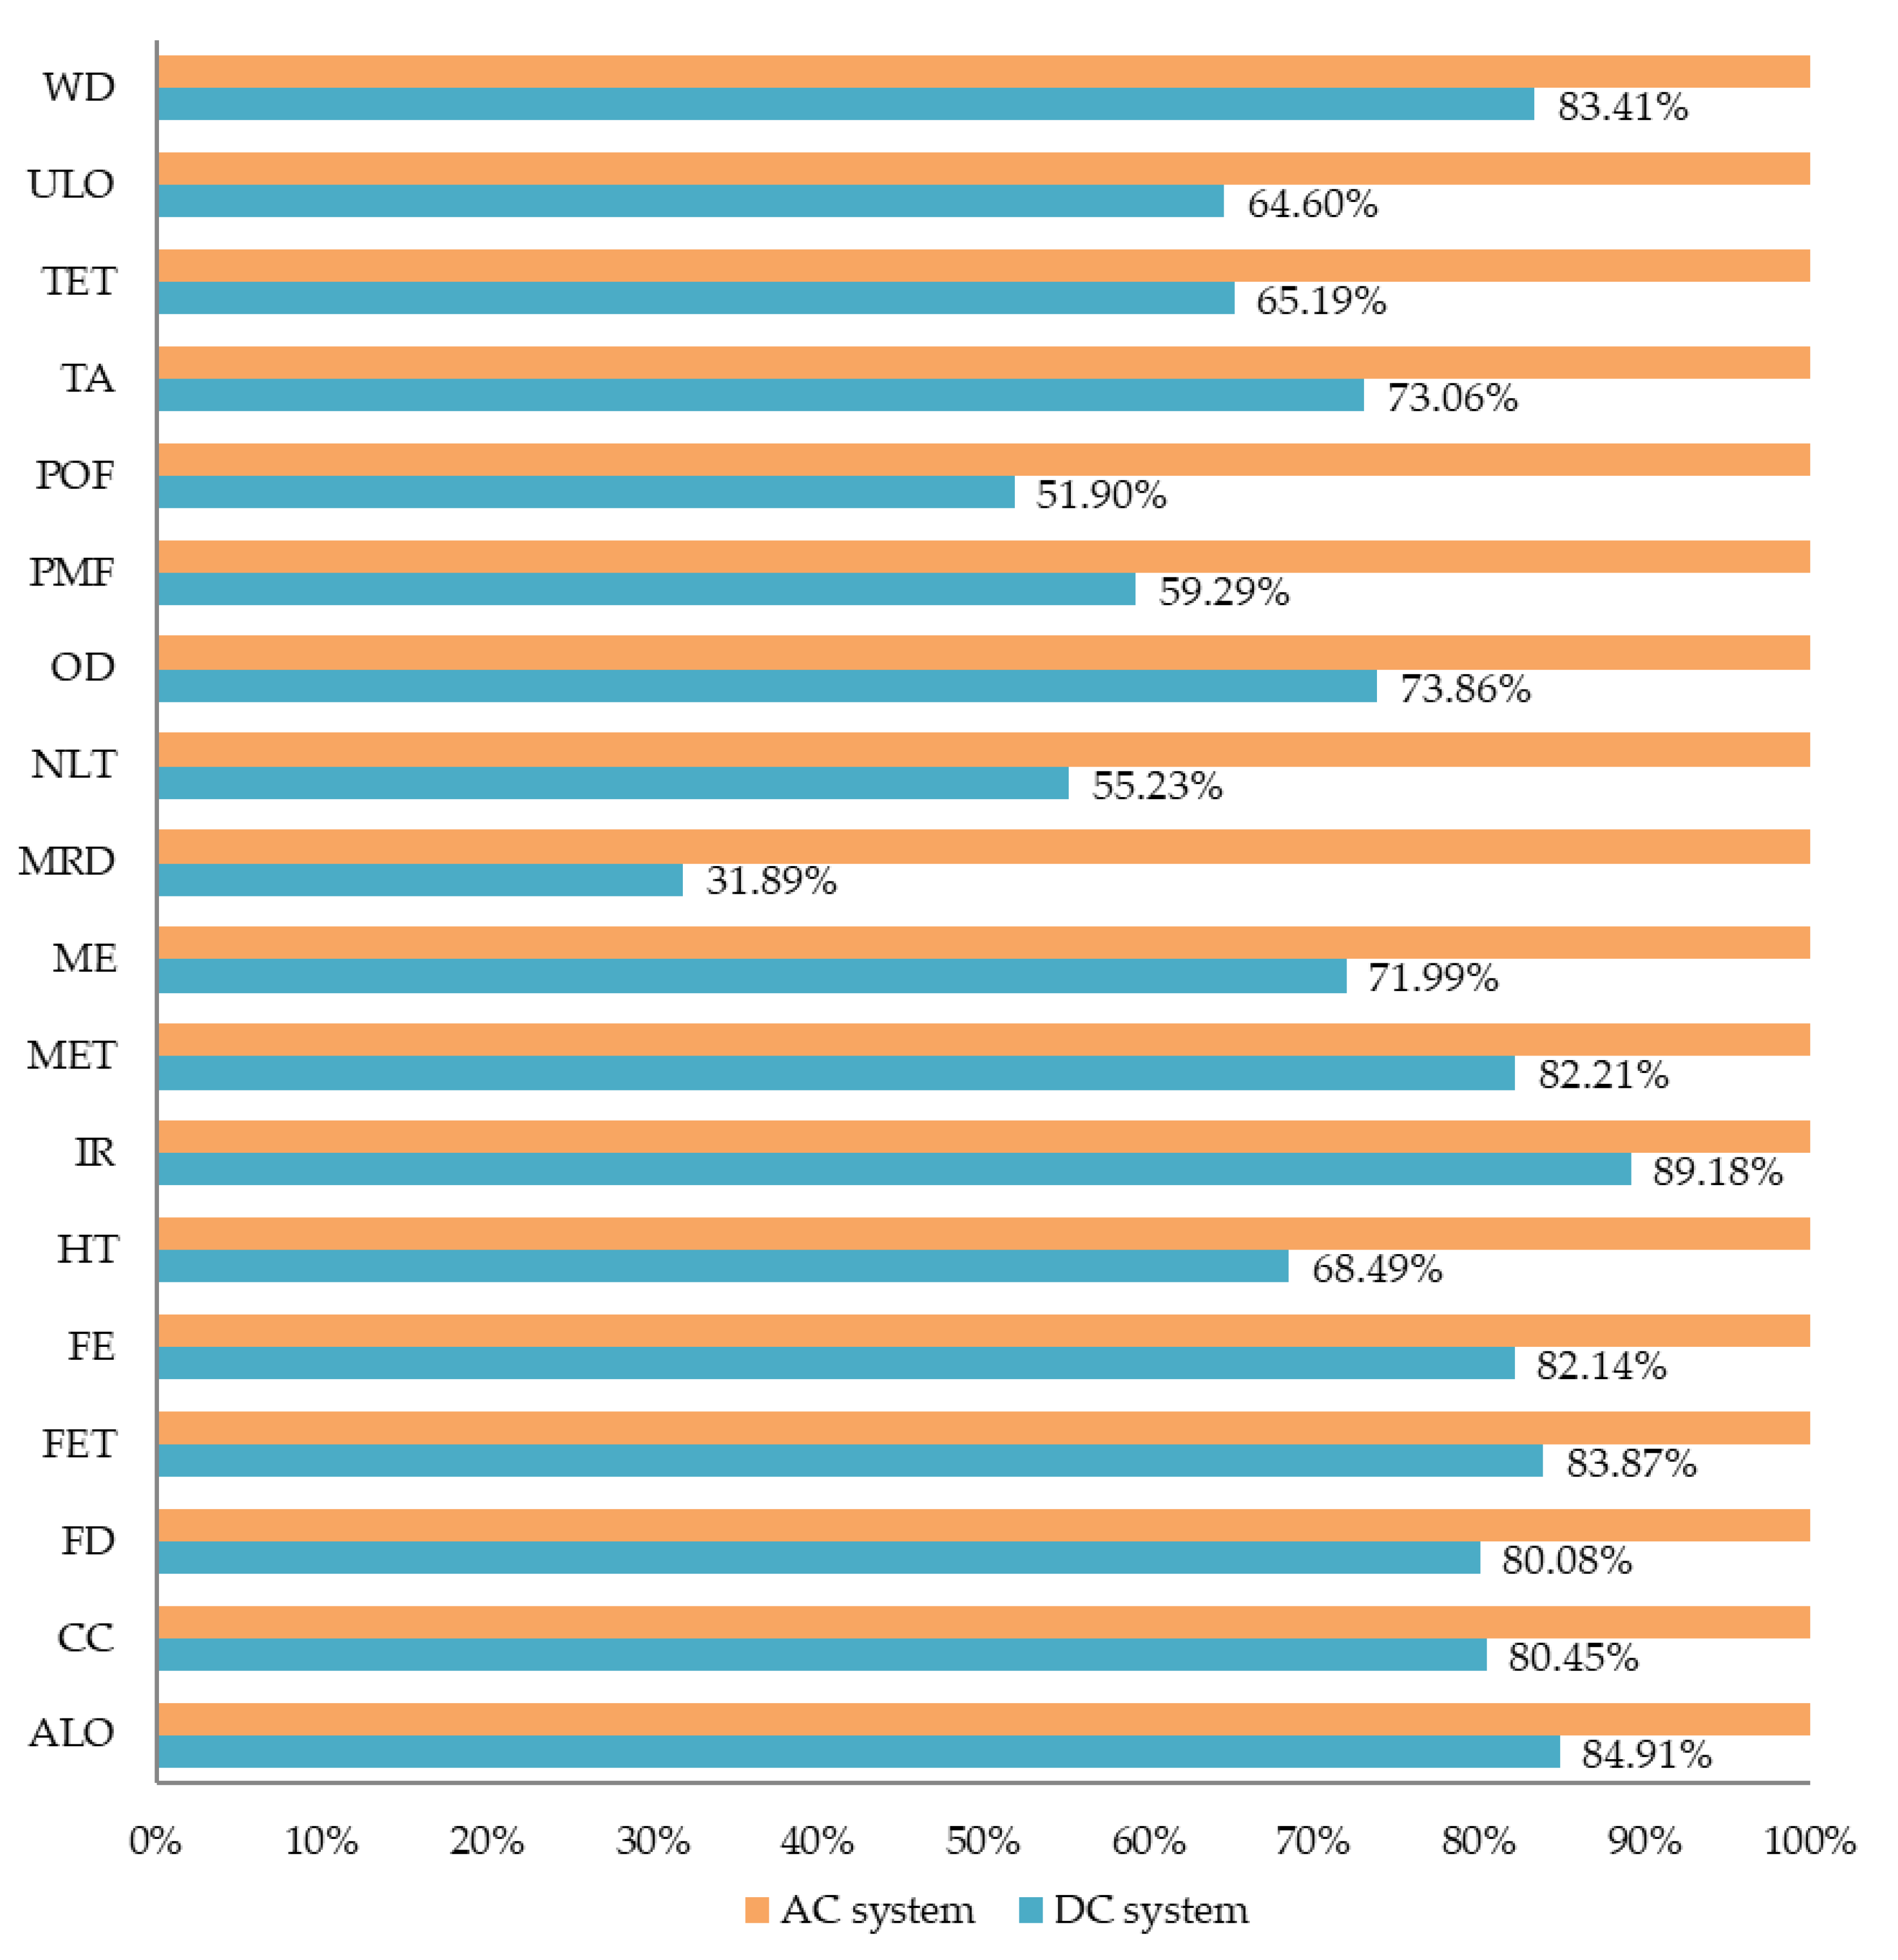
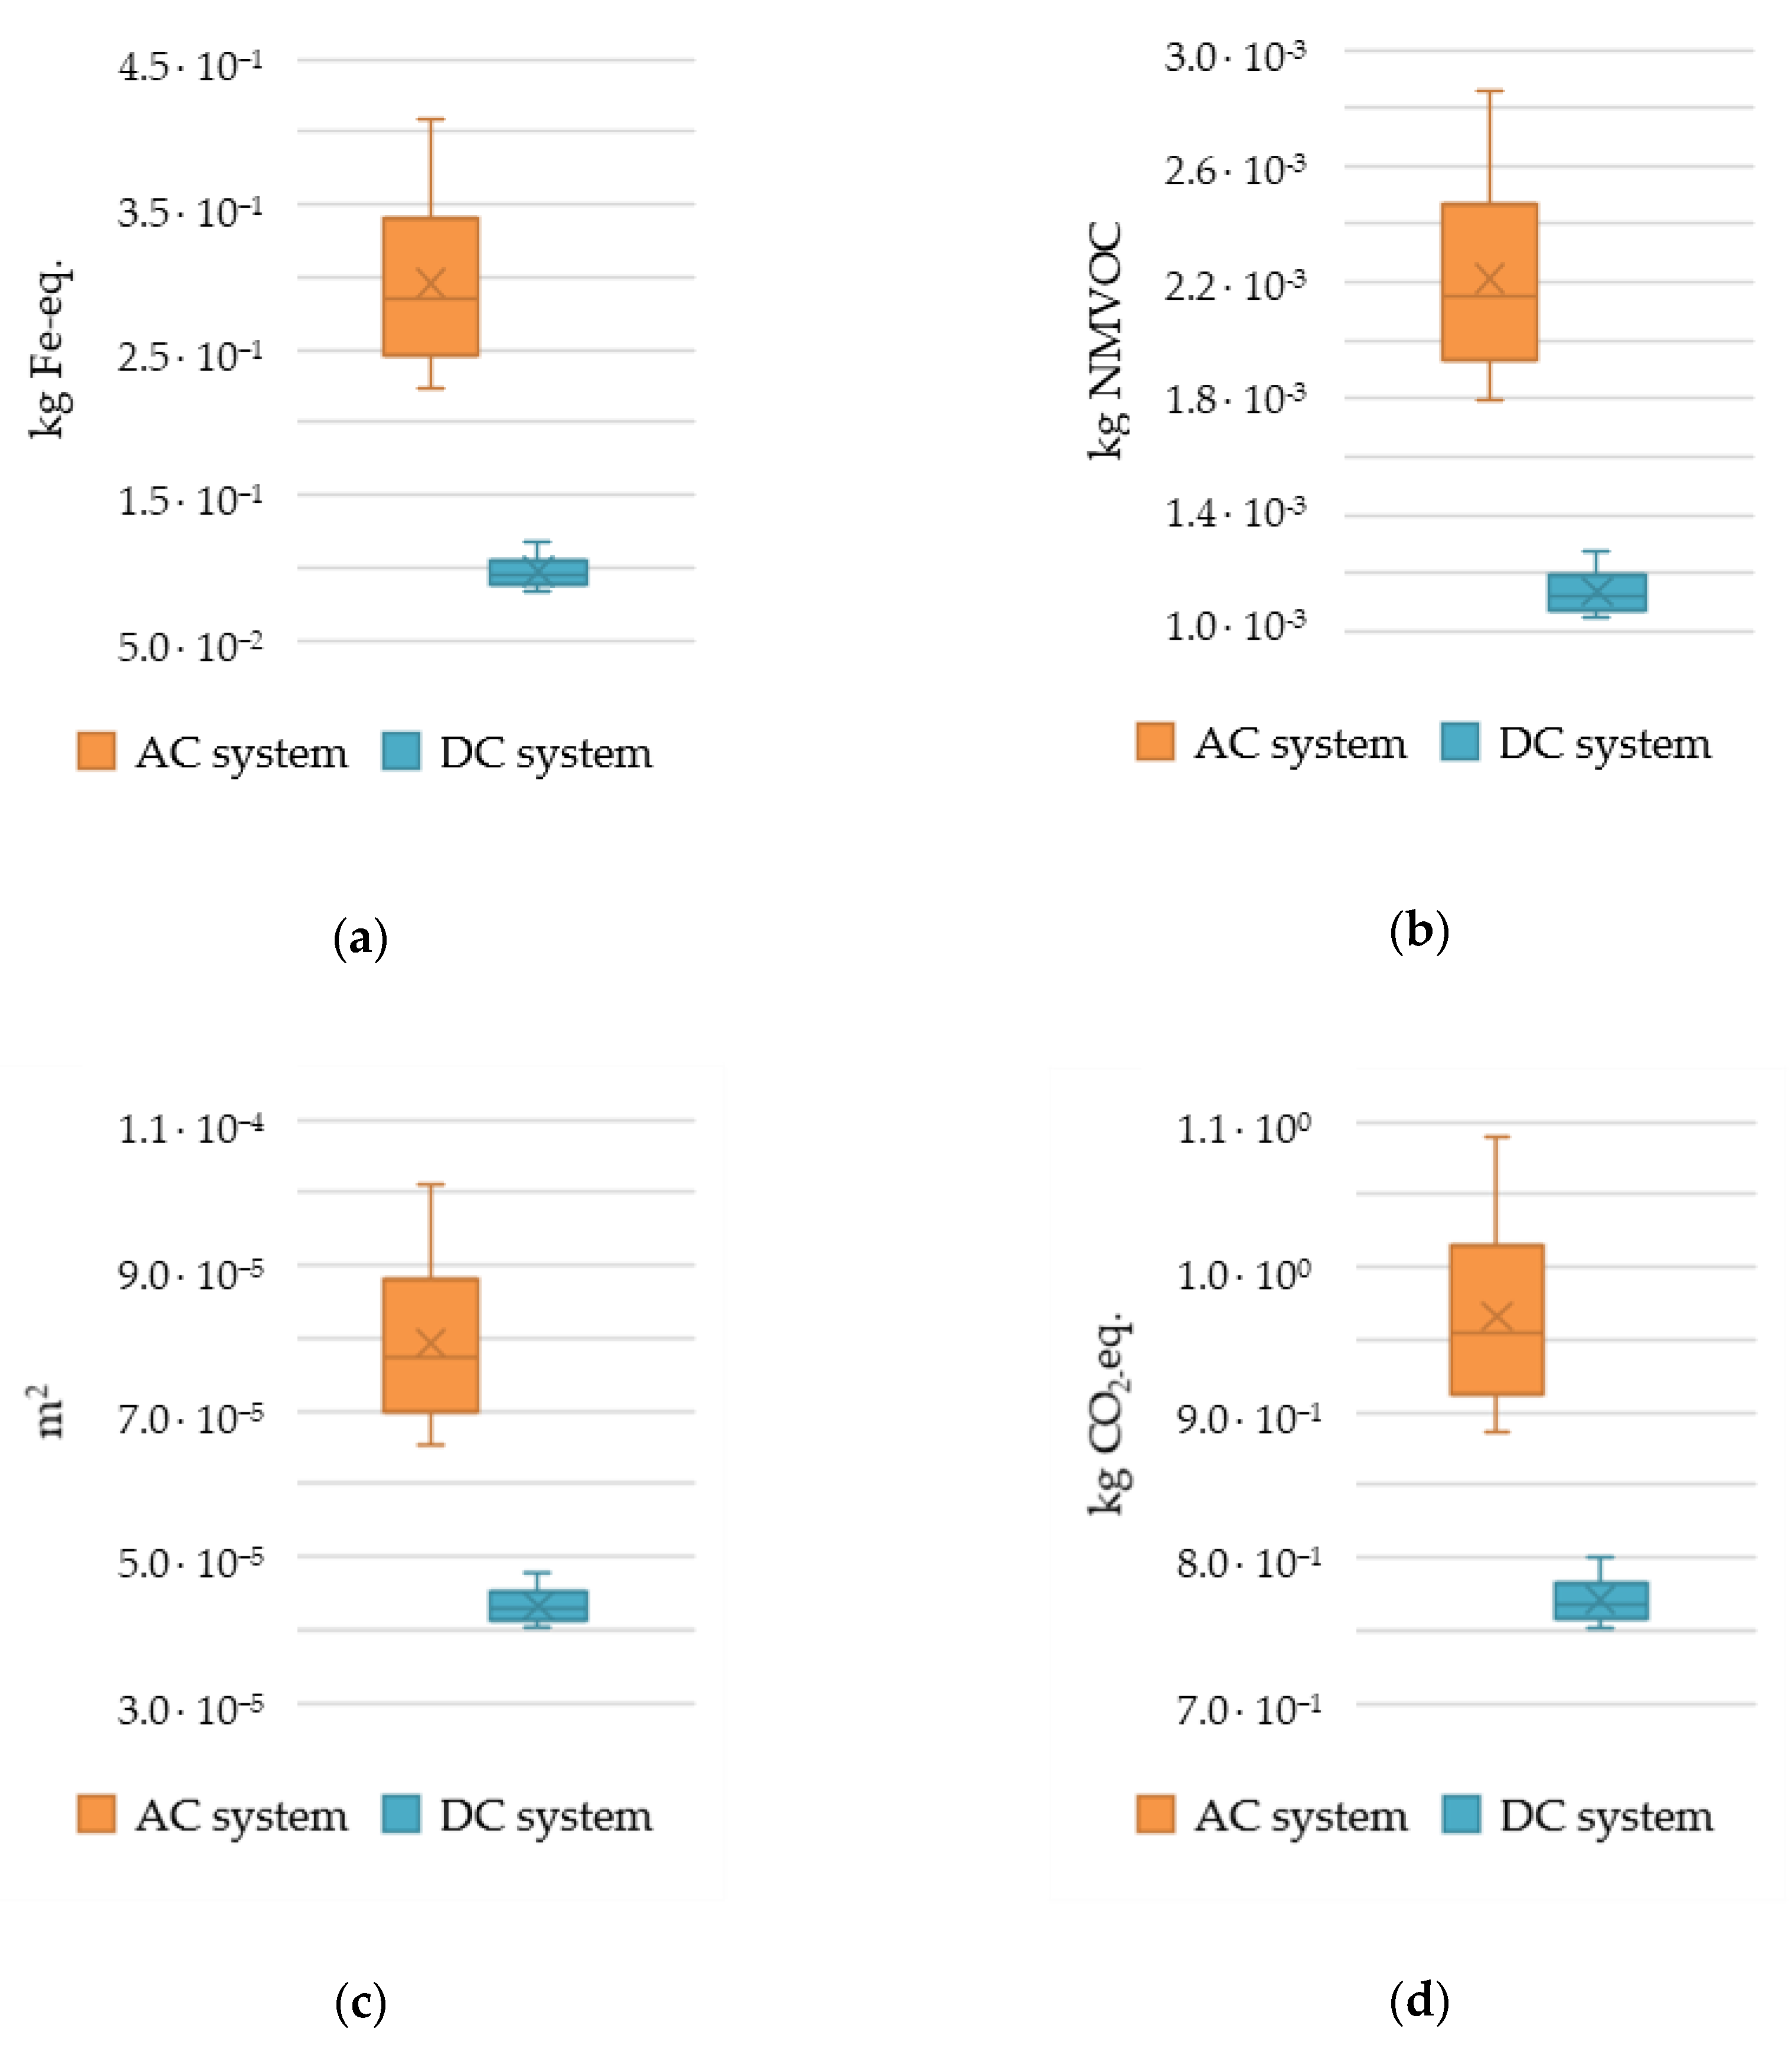
3.1.2. System-Based Results

The following results refer to a system level. The scaling of the components is shown in Table 1.
  • Chargers
For the DC system, the total amount of 3.7 kW OBCs (scales with the number of vehicles) leads to higher environmental impacts (more than 70% for all impact categories) than the sum of the 50 kW chargers (scales with the number of charging points). The relative impact of the 50 kW chargers is highest for human toxicity (about 28%). Concerning global warming, the 3.7 kW chargers account for about 80% of the emitted CO2-eq. (0.07 kg CO2-eq./kWh).
  • Charging infrastructure (CIS)
When comparing the environmental impacts of the CIS on a system base, the AC system has less environmental impacts in 10 out of 18 impact categories when compared to the CIS of the DC system. We find the most significant difference (percentage wise) to be present in climate change with additional emissions of 0.7 10 3 kg CO2-eq. per kWh when the DC system is used. The environmental impacts of the charging infrastructure for the AC system and the DC system can be found in Table A4 in Appendix C.
When comparing the environmental impacts of the total number of chargers and the CIS, chargers account for over 90% of the environmental impacts for all impact categories in the AC system. For the DC system, the CIS has a more significant environmental impact (percentage wise) than in the AC-based system. The most significant impact of the CIS in the DC system can be seen in human toxicity (about 25% or 0.05 kg 1,4-DCB-eq./kWh). The transport only accounts for less than 0.3% of the emissions in all impact categories; therefore, it is neglected in further examinations.
  • Charging infrastructure, chargers, transport, and use phase
When summing up the environmental impacts of the production (chargers as well as charging infrastructure) and comparing them with the environmental impacts of the use phase (energy provision), we find that the use phase is responsible for more than 50% of the environmental impacts in 12 impact categories for the AC system. Only mineral resource depletion, photochemical oxidant formation, natural land transformation, particulate matter formation, terrestrial ecotoxicity, and urban land occupation predominate in the production phase. When considering the DC system, solely mineral resource depletion is dominant during production, while all other environmental impacts are mainly emitted during the use phase. Referring to global change in the AC system, only about 30% of CO2-eq. are emitted during production; while in the DC system, it is less than 12%. Due to the scaling to one kWh (i.e., the functional unit) and the same charging efficiency for all chargers, the same total amount of emissions is emitted during the use phase in both systems, which also means that changes in the energy mix have the same impact on the use phase for both systems.
When comparing the overall environmental impacts of the two systems (production, transport, and use), a reduction of environmental impacts in all 18 impact categories is achieved by the DC system. Figure 3 shows the results—with the environmental impacts of the AC system scaling to 100%. We observe the most significant differences in percentage terms in mineral resource depletion (68.11%), photochemical oxidant formation (48.10%), and natural land transformation (44.77%). The most significant absolute changes can be observed in the impact categories human toxicity (0.36 kg 1,4-DCB-eq./kWh), mineral resource depletion (0.19 kg Fe/kWh), and climate change (0.19 kg CO2-eq./kWh).
For mineral resource depletion (see Figure 4a), power electronics have the most significant impact (≈68% and ≈90%, respectively). It was shown before that mainly the DC-DC converter and the filter contribute to that impact. Within the converter and the filter, the coils constitute the main demand for mineral resources. For natural land transformation (see Figure 4b) in the AC-based system, the production of power electronics (mainly the filter) could be identified as main contributors (≈55%) while for the DC system, the use phase is the main contributor. Considering photochemical oxidant formation (see Figure 4c), in the AC system, power electronics (filter and DC-DC converter) are the main contributors, while it is the use phase in the DC system.
The most significant absolute changes were observed in the impact categories human toxicity (0.36 kg 1,4-DCB-eq./kWh), mineral resource depletion (0.19 kg Fe/kWh), and climate change (0.19 kg CO2-eq./kWh). For human toxicity (see Figure 5a), the use phase has the highest impact followed by power electronics. Within the power electronics for the 22 kW charger, the main contributor is the DC-DC converter followed by the filter and the logic board. For climate change (see Figure 5b), the main source of environmental impacts is the use phase. Within the production of the power electronics, it is mainly the filter that contributes to climate change for both the 22 kW and the 50 kW charger.

3.1.3. Scenario-Based Results

In a next step, we apply our results to the diffusion scenarios that we have introduced in Section 2.2. Therefore, the analysis is no longer carried out for one kWh of charging electricity (i.e., the functional unit), but rather based on the stock of BEVs and the regarding charging requirements per scenario. The absolute environmental impacts for the scenarios can be found in Table A2 in Appendix B. Table 8 describes the absolute reductions of environmental impacts in selected impact categories that could be achieved by implementing the DC system instead of the AC system with considering a lifetime of 10 years for all components.
In the impact category, climate change of about 20, 25, and 35 mn. kg CO2-eq. yearly can be saved when implementing the DC system instead of the AC system. That would represent approximately 0.012%, 0.016%, and 0.022% of current annual greenhouse gas emissions in the transport sector in Germany [7]. The analysis also indicates that the potential for reductions increases as the number of BEVs increases.

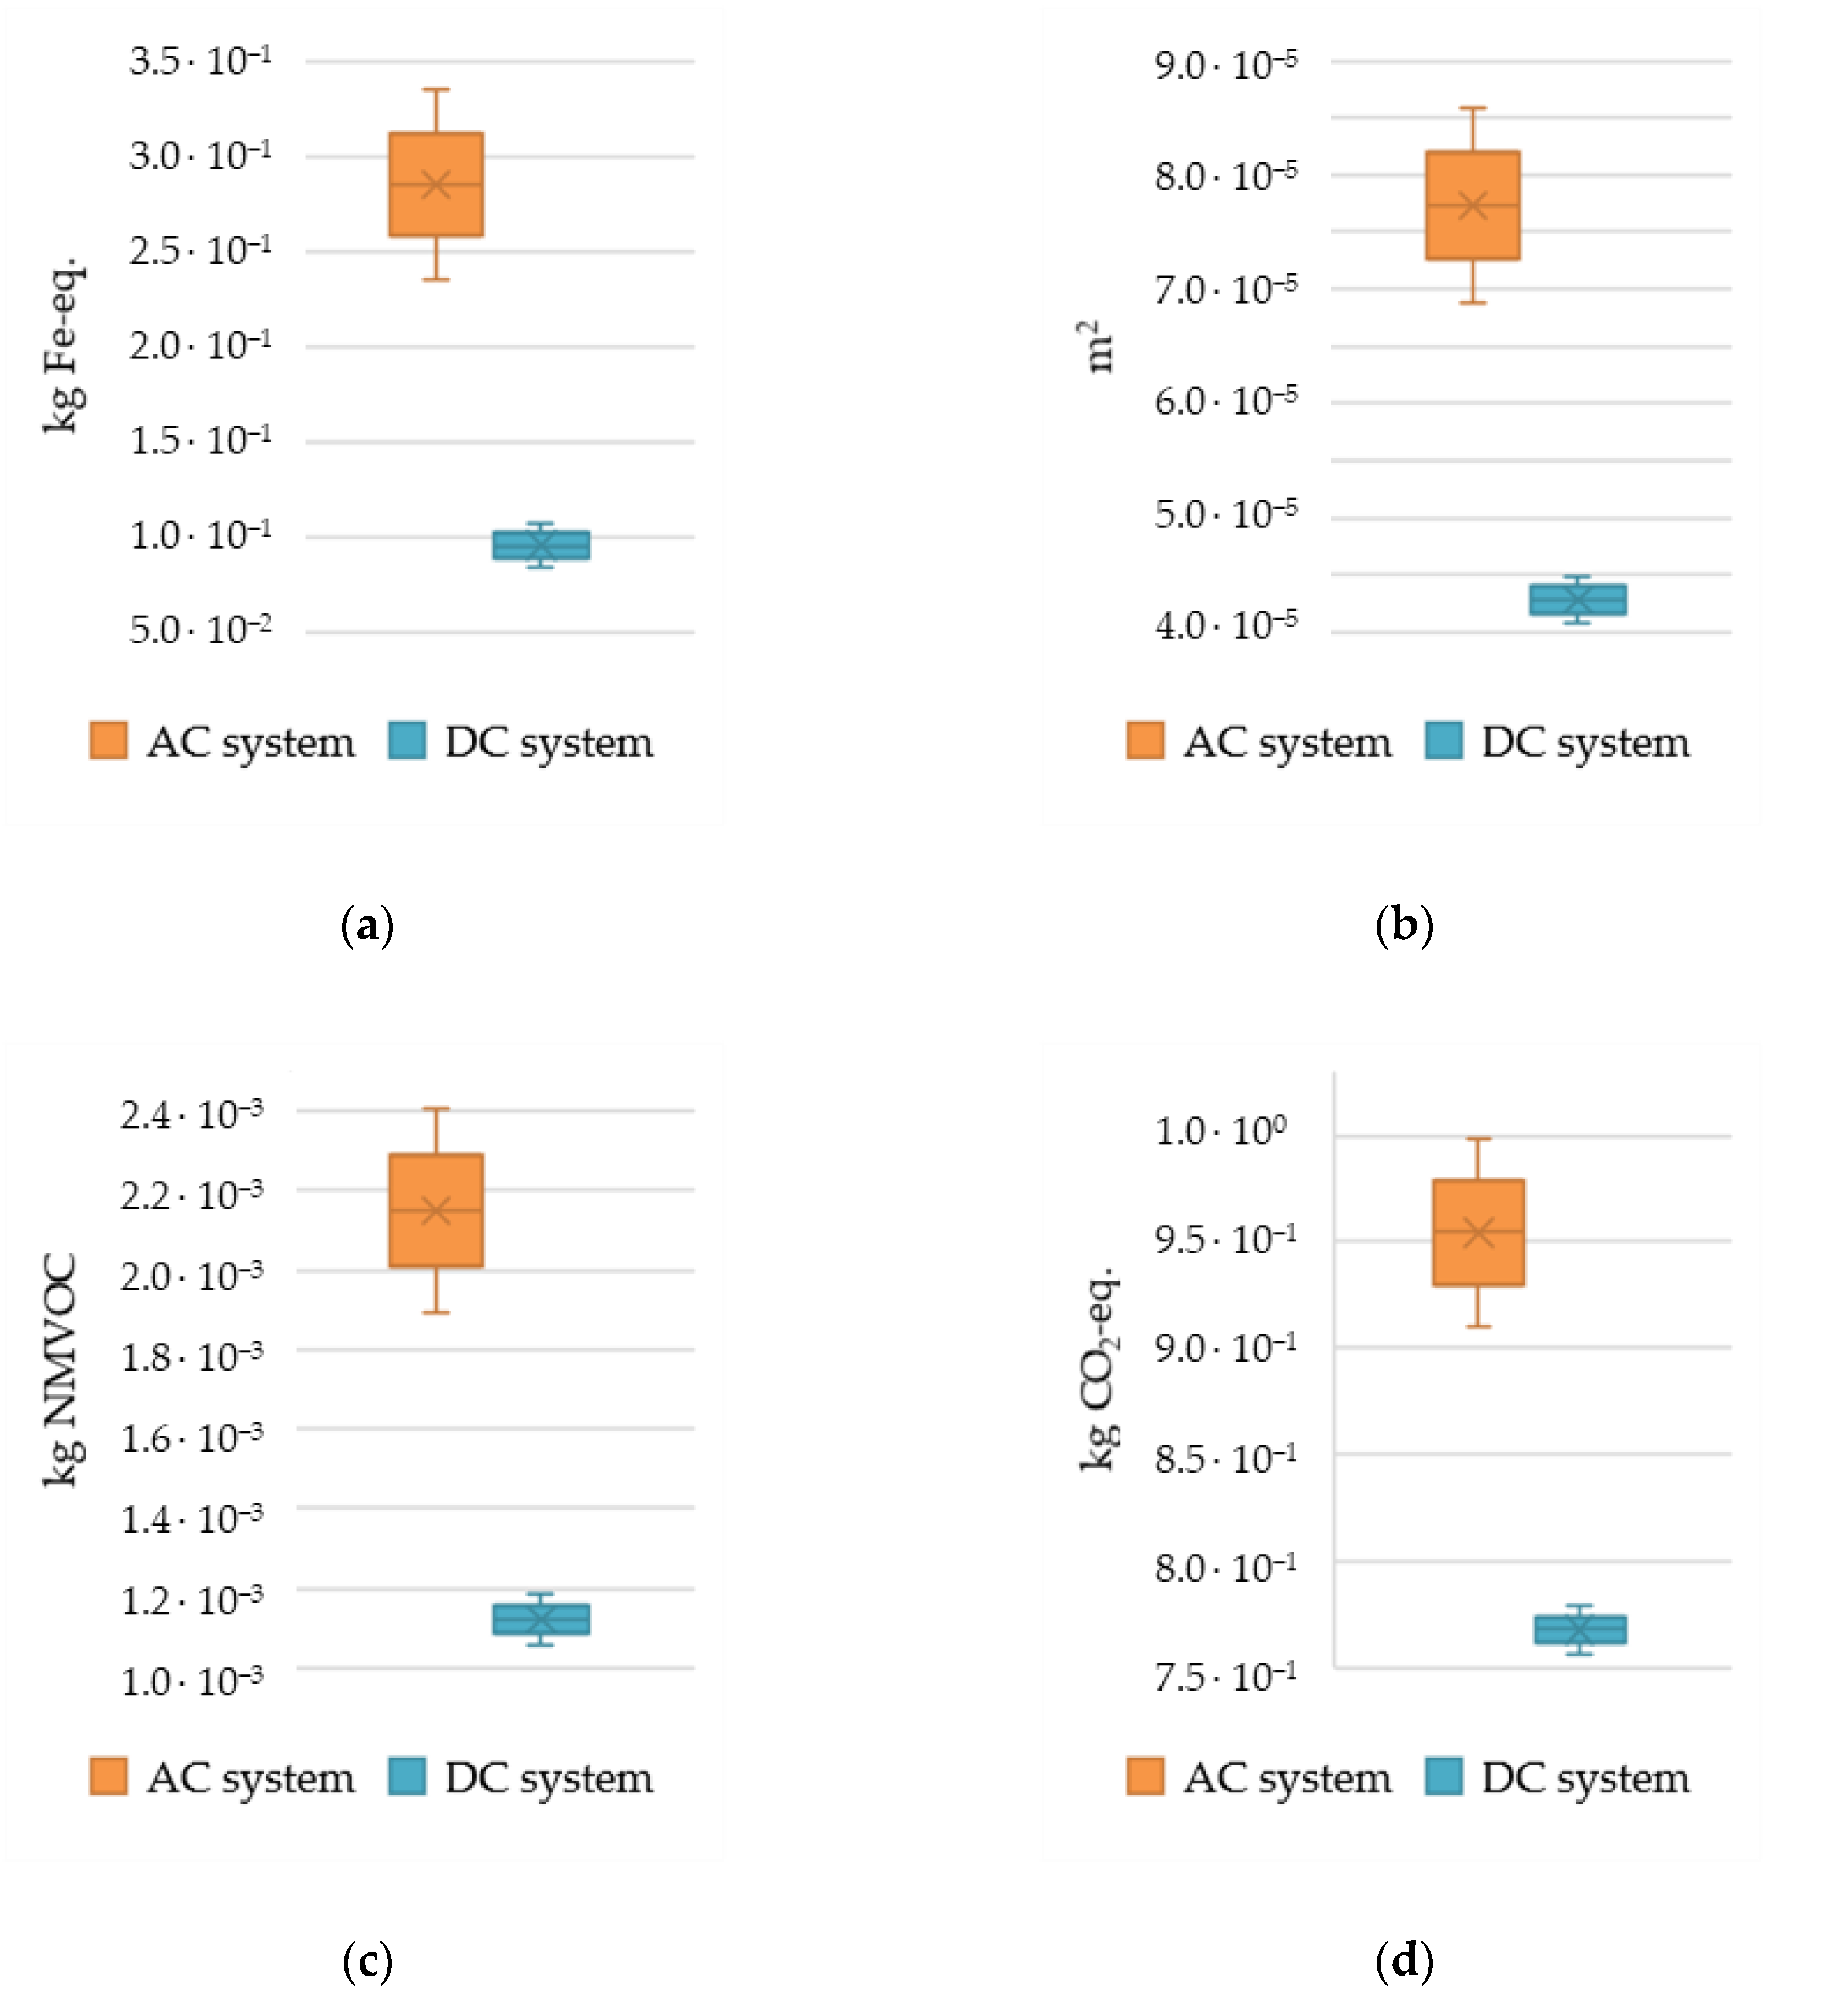
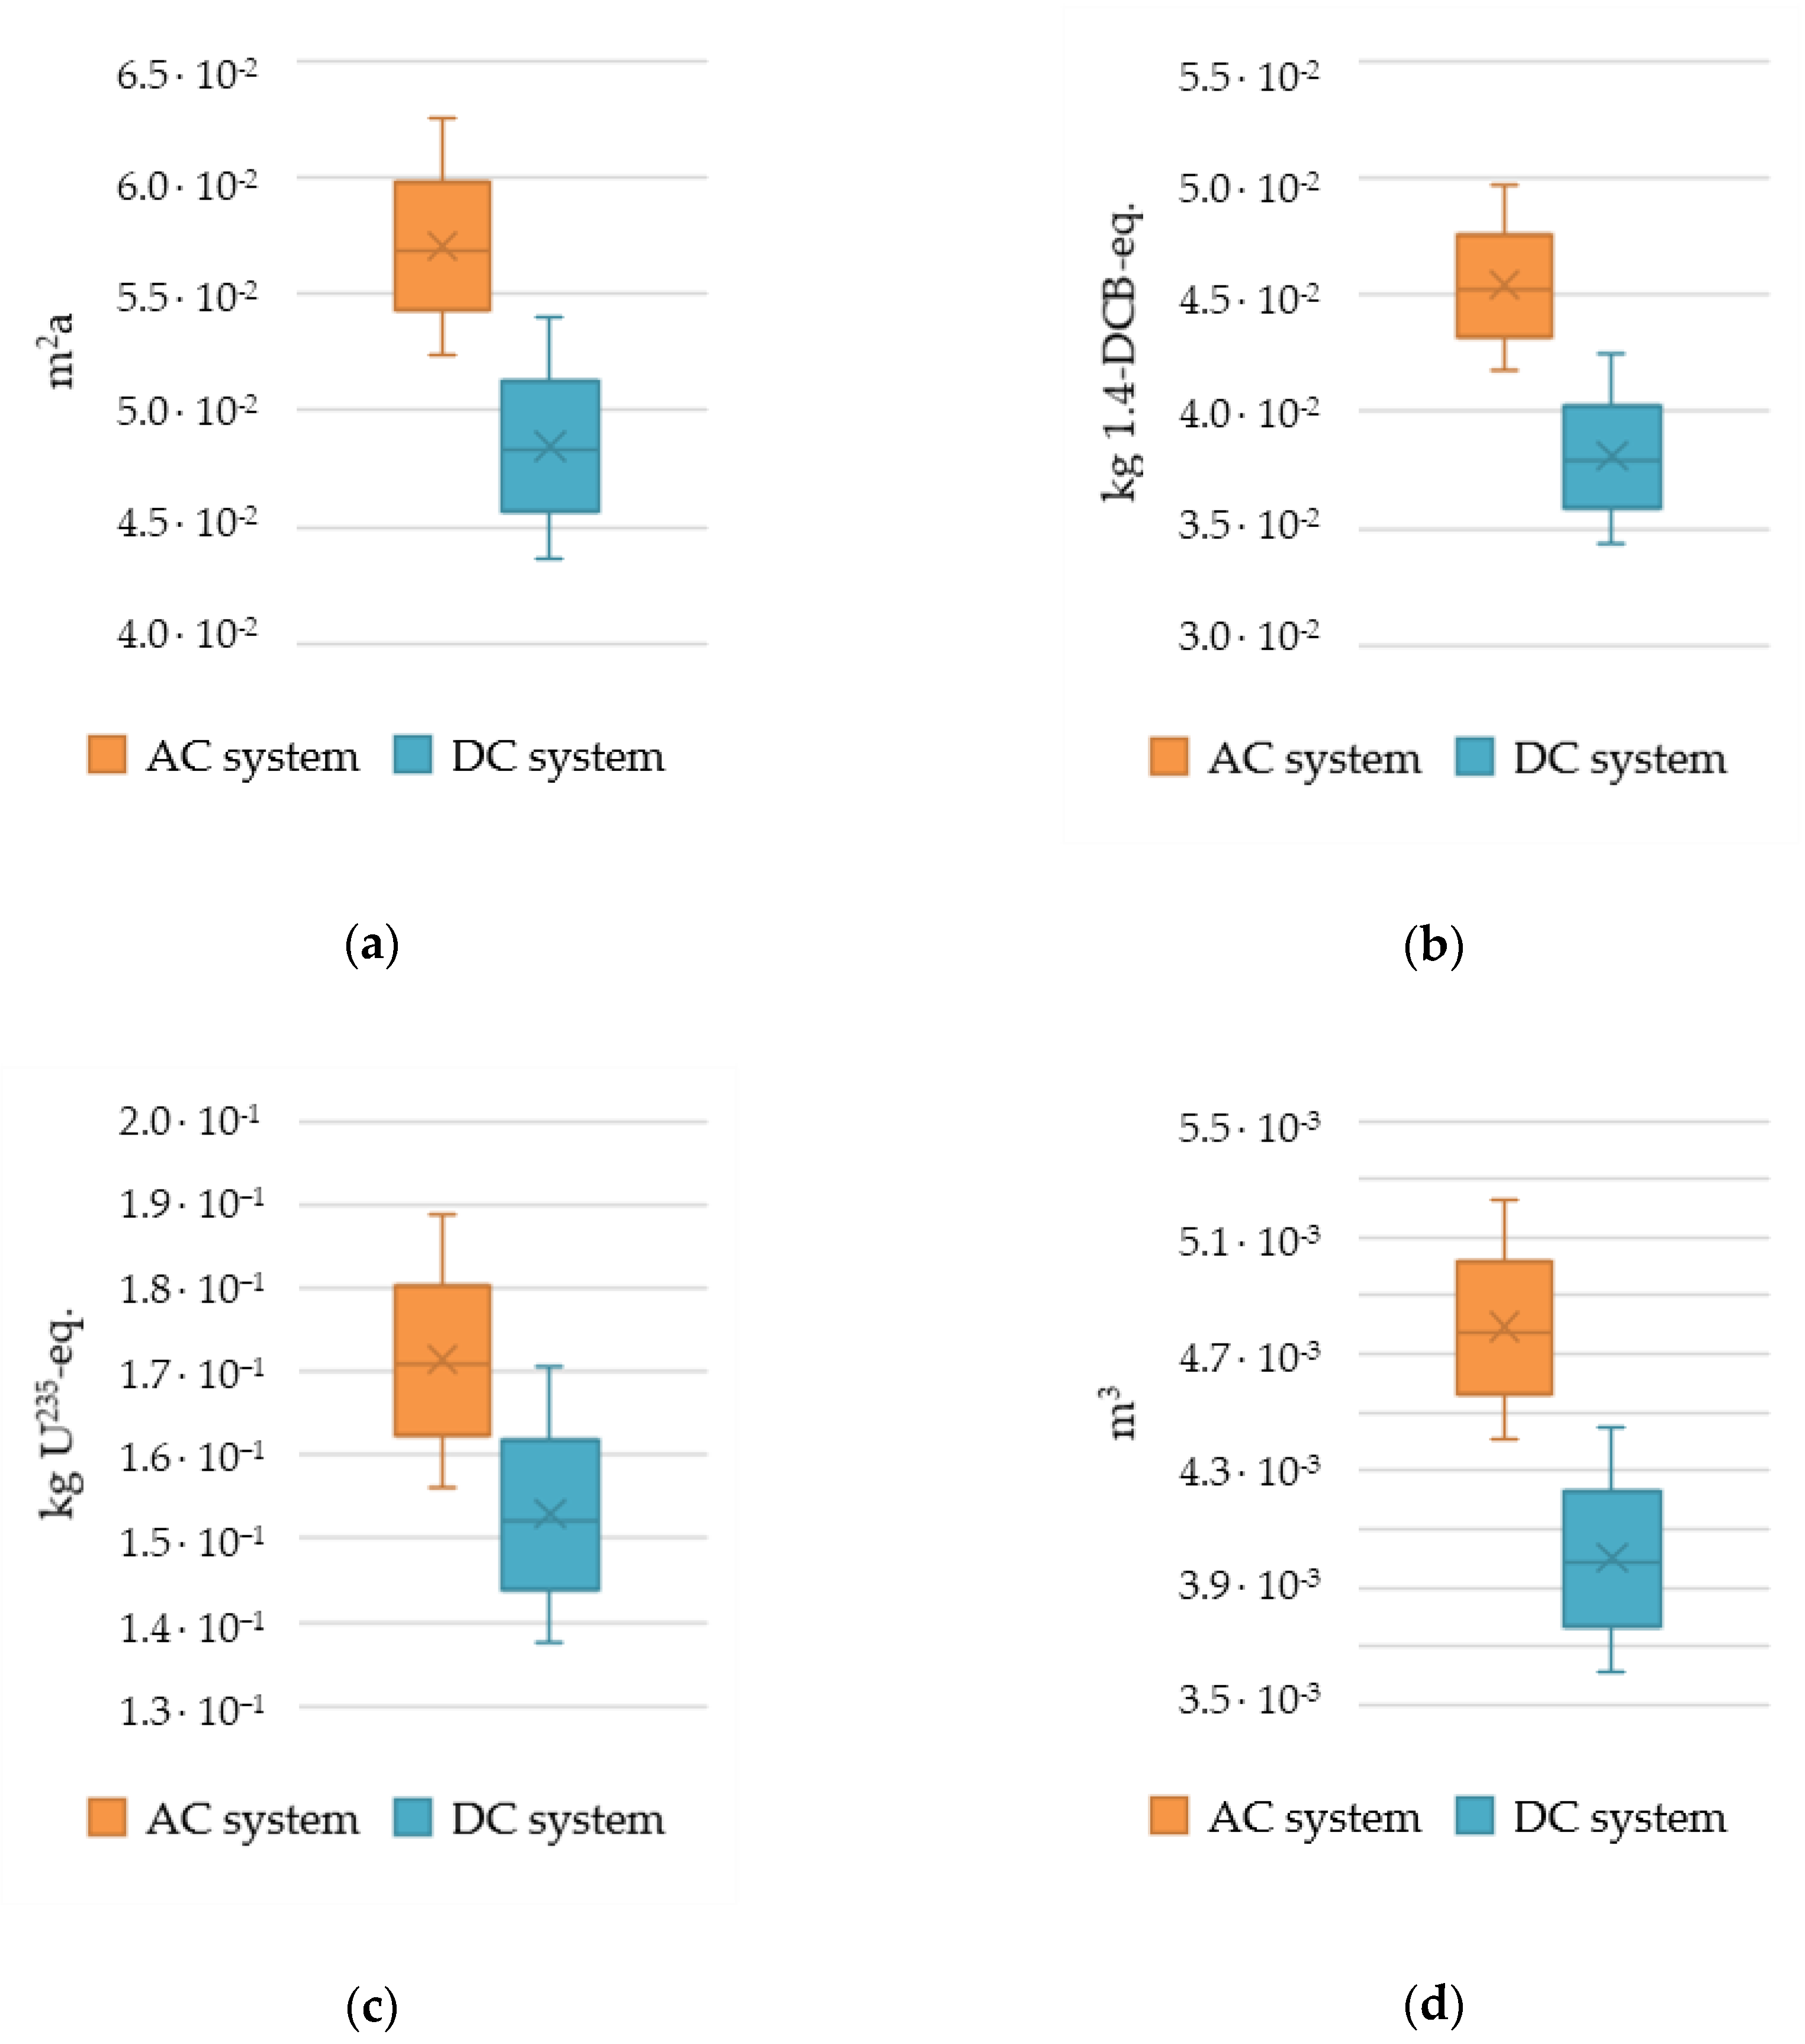
3.1.4. Sensitivity Analyses

To account for data uncertainties in modeling, we conduct sensitivity analyses. Therefore, we vary the emission intensity of the production of the power electronics. Additionally, we vary the average utilization of the charging points as well as the efficiency of the charging points and the ratio of home charging (i.e., non-public charging, see modeling in Section 2.2). We provide an overview of our parameter variations in Table 9. The investigated parameters represent those with the highest effect on our results. We conduct the analyses for all 18 impact categories and exemplify it for significant impact categories.
The variation in the environmental impact of power electronics production results in greater environmental impacts in the AC system even for the most unfavorable combination for the DC system (DC system: 120%; AC system: 80%) for all impact categories. As the power electronics have the main impact in the overall systems in mineral resource depletion (90% in the AC system and 68% in the DC system), natural land transformation (56% in the AC system and 25% in the DC system), and photochemical oxidant building (60% in the AC system and 29% in the DC system), the result of the sensitivity analyses is shown to be exemplary for those impact categories (Figure 6a–c). Additionally, the result for climate change is shown in Figure 6d. This suggests that even with greater uncertainties in the environmental impact of power electronics, the DC system has lower environmental impacts than the AC system in our model.
When varying the degree of utilization, the most considerable changes on a percentage basis are in human toxicity, mineral resource depletion, and terrestrial ecotoxicity (see Figure 7a–c). Again, Figure 7d shows the result for climate change.
The efficiency of the charging process can vary considerably, although charging stations with higher charging powers usually have a higher efficiency. When comparing the most unfavorable combination for the DC system (DC system: 80%; AC system: 100%), the AC system has less environmental impacts in the impact categories agricultural land occupation, freshwater ecotoxicity, ionizing radiation, and water depletion. The resulting sensitivities for the impact categories are shown in Figure 8a–d. From our results, we can conclude that although there are cases where the AC system causes less emissions than the DC system in the above-mentioned impact categories, the mean and median of the DC system are significantly below the mean and median of the AC system in all critical impact categories.
When varying the ratio of home charging (i.e., non-public charging and therefore the number of publicly accessible charging stations, see Section 2.1) and evaluating the DC system’s most unfavorable combination (DC system: 80%; AC system: 60%), the DC-based system has less environmental impacts in all impact categories, even though the DC system has more charging points than the AC system in this constellation. The results are shown in Figure 9, which are exemplary for the most significant changes (on a percentage basis) (Figure 9a–c) as well as for climate change (Figure 8d). However, it should be noted that the total energy demand does not change if the proportion of home charging is increased. Since the energy used for home charging is not included in the modeling, there are large variations in the considered impact categories. This effect would decrease if the energy required for home charging was included.
Summing up, the sensitivity analyses showed some combinations for which the DC system has more environmental impacts in some impact categories (i.e., agricultural land occupation, freshwater ecotoxicity, ionizing radiation, and water depletion; see Figure 8). Nevertheless, the overall finding, that the DC system has less environmental impacts than the AC system in the modeled system, seems to be consistent, as this constellation only represents rather unlikely parameter combinations.

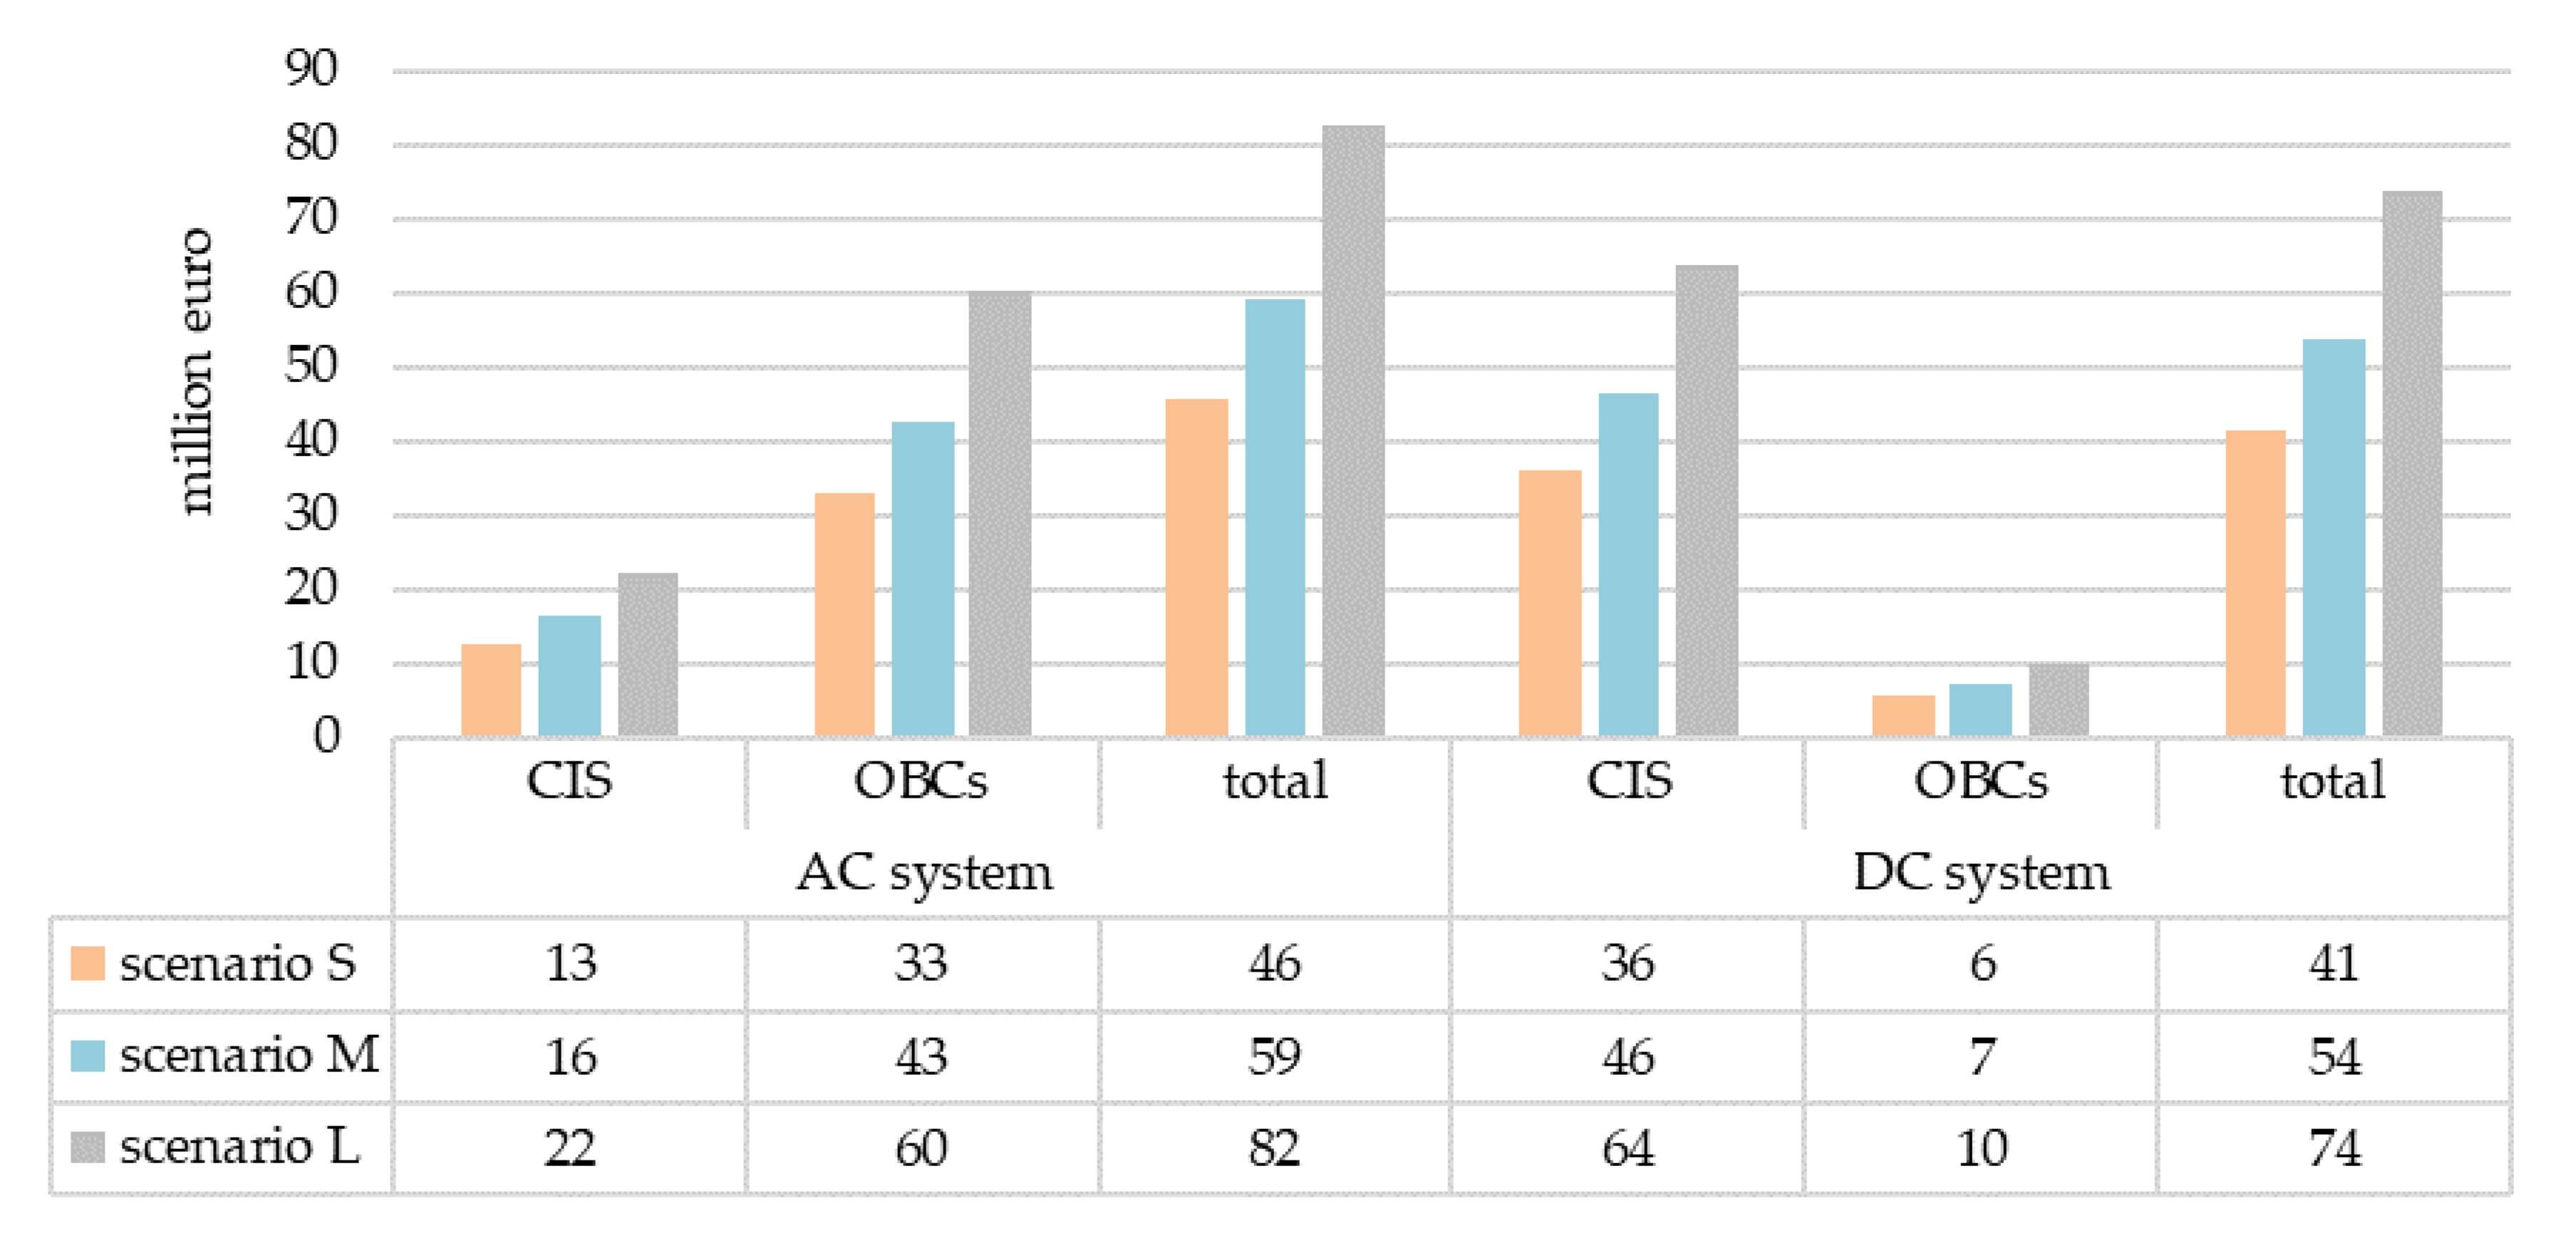
3.2. Economic Analysis

We conduct the economic analysis and distinguish between CIS and charging devices. The considered cost components are shown in Table 10. All estimates are based on [61,122,123]. The costs for the CIS and the chargers are annualized.
We calculate the cost for the CIS for all three diffusion scenarios. Figure 10 shows our results. Despite the fewer charging stations in the DC system, the higher costs of the charging stations cannot be compensated. The system costs for the CIS in the DC system are about 180% higher than the system costs in the AC system.
For the OBC, the cost estimation is based on Mathieu [124], who states about 250 EUR for a 3.7 kW charger. Due to the modular design in our paper, the cost for the 22 kW chargers results in 1500 EUR. The costs for the OBCs in the scenarios are shown in Figure 10.
The OBCs have a significant impact for the AC system. About 70% of the total cost for the AC system arise from the OBCs, while in the DC system, the OBCs are only about 13% of the total cost. Thus, in total, the AC system becomes more expensive than the DC system. From a system point of view, in our scenarios, 4.2 mn., 5 mn. and 8.5 mn. euros can be saved annually with the DC-based charging infrastructure compared to the AC-based system. The analysis also indicates that the potential for savings increases with the number of BEVs.

4. Conclusions and Outlook

In our study, we analyzed and compared the environmental impacts of different charging concepts for electric vehicles. Two systems were considered, which essentially differ in the position of the chargers. When charging with alternating current (AC), an on-board charger is used. In our AC system, a charging power of 22 kW is considered for the publicly accessible charging infrastructure, and home charging with 3.7 kW can be conducted without any additional components. Charging at higher power levels requires an off-board charger. In the DC system, a charging power of 50 kW is assumed. Additionally, a 3.7 kW on-board charger is designed to allow for AC charging at home (3.7 kW). In our modeled systems, publicly accessible infrastructure rather solely supports AC charging (22 kW) or DC charging (50 kW). The calculation of the required charging infrastructure is based on the total energy demand for charging in the publicly accessible area. We defined three diffusion scenarios to model the near-future stock of BEVs in Germany and the required amount of charging infrastructure.
According to the goal of our study, we evaluated the environmental impacts of the systems by conducting an LCA. Our results show that the DC charging system causes less environmental impacts than the AC system in all impact categories. Even though the use phase has a large impact on the environmental analysis, it has the same impact for both systems when scaling to 1 kWh due to the model parameters. For the production, we showed that—on a component level—chargers are the main contributor in both systems. In the DC system, the sum of 3.7 kW chargers has a greater impact than the sum of the 50 kW chargers. Within the chargers, we identified the filters as main polluters for the 3.7 kW and the 22 kW chargers. For 50 kW chargers, the filter and the DC-DC converter cause the most environmental impacts. For all filters, the inverter-side coils are the main polluters. In the DC-DC converter, the coils and transformers are the components with a major influence in all impact categories. When assigning the results to our scenarios, for global warming, annual emission reductions of 20 mn., 25 mn., and 35 mn. kg CO2-eq. could be achieved when the DC system is used instead of the AC system, which represent approximately 0.012%, 0.016%, and 0.022% of current annual greenhouse gas emissions in the German transport sector [7].
The main reason for the differences in the two systems is the scaling. While in the AC system each vehicle is equipped with a 22 kW charger (the number of chargers and the corresponding power electronics scales with the number of vehicles (see Table 1), in the DC system, the users of electric vehicles share the chargers and the corresponding power electronics in publicly accessible areas (the 50 kW chargers scale with the number of charging stations (see Table 1)).
Our sensitivity analyses confirmed the advantages of the DC system and showed the robustness of the results. Even in cases for the most unfavorable combination for the DC system, it causes less environmental impacts than the AC system.
For our economic analysis, we calculated the cost on a German-national level. Even though the DC charging infrastructure causes significantly higher cost than the AC charging infrastructure, this becomes less important when the costs of the OBCs are also considered. In our scenarios, annual savings of 4.2 mn., 5.4 mn., and 8.5 mn. euros are possible when the DC system is used instead of the AC system. The reductions of environmental impacts and the cost savings both scale with the stock of BEVs in our model.
All findings gained should be considered within the model boundaries. First, we want to mention that even though the Ecoinvent database is commonly used, some generic processes may have changed over time, so there may be some shifts of the environmental impacts. In addition, the database is often based on processes from the European area, which should be taken into account when transferring the results to other countries, although it cannot necessarily be assumed that the processes and environmental impacts differ significantly. Furthermore, our study is only valid for the modeled components. If different or additional components are used, e.g., if the charging power is changed, the resulting environmental impacts of these components must be considered separately. In addition, the density of the publicly available charging infrastructure is not explicitly investigated. Although the sensitivity analysis of the utilization shows that even when the DC system has more charging points than the AC system it causes less environmental impacts than the AC system, this aspect would need to be investigated further. Another assumption made is that the energy mix stays constant during the day. As the CO2 intensity of the energy supply differs intraday, considering the charging behavior of users within the systems is an interesting supplement as well. Nevertheless, the study provides a systems comparison of AC and DC-based charging and gives an overview of the components that have a relevant environmental impact and that may need to be modeled in more detail in future considerations.
Based on environmental as well as economic results, our study shows that DC charging offers both economic saving and environmental reduction potentials. The advantages of the DC system scale with the number of electric vehicles, so it can be assumed that the findings will become more relevant as the number of BEVs increases. With the current distribution of charging solutions in Germany, on-board charging dominates, while off-board charging accounts for about 7% of all public charging points. The on-board charging capacity of the newly offered vehicles seems to settle at a level of 11 kW. In order to achieve higher charging performance, off-board charging will be increasingly used.

Author Contributions

Conceptualization, M.K., L.N., B.J.M., J.C.K., W.K., R.W.D.D. and A.P.; Data curation, M.K.; Formal analysis, M.K.; Methodology, M.K., L.N., B.J.M., J.C.K., W.K., R.W.D.D. and A.P.; Resources, L.N., B.J.M., J.C.K., W.K., R.W.D.D. and A.P.; Software, M.K.; Supervision, L.N., B.J.M., J.C.K., W.K., R.W.D.D. and A.P.; Validation, L.N., B.J.M., J.C.K., W.K., R.W.D.D. and A.P.; Visualization, M.K.; Writing—original draft, M.K.; Writing—review and editing, M.K., L.N., B.J.M., J.C.K. and A.P. All authors have read and agreed to the published version of the manuscript.

Funding

L.N., B.J.M., R.W.D.D. and A.P. received funding by the Federal Ministry of Education and Research (BMBF) and the Ministry of Culture and Science of the German State of North Rhine-Westphalia (MKW) under the Excellence Strategy of the Federal Government and the Länder (grant ID: (DE-82)EXS-SF-OPSF560). J.C.K. and W.K. gratefully acknowledge funding of the center of excellence “Virtual Institute—Power to Gas and Heat” (EFRE-0400151) by the “Operational Program for the promotion of investments in growth and employment for North Rhine-Westphalia from the European fund for regional development” (OP EFRE NRW) through the Ministry of Economic Affairs, Innovation, Digitalization and Energy of the State of North Rhine-Westphalia.

Conflicts of Interest

The authors declare no conflict of interest.

Appendix A. Background Information to Section 2.2

The total number of charging stations is calculated as follows:
n C S = c l a s s e s   S , M , L   ( α P C · a m c a r · n B E V ,   c l a s s · c B E V , c l a s s ) n C P , C S · U T C P · P C P · η C P · t P C
with
α P C :   share public charging [/]
a m c a r : annual mileage of a car [km]
n B E V ,   c l a s s : number of BEVs in the class [/]
c B E V , c l a s s : consumption of BEVs in the class [kWh/km]
n C P , C S : number of charging points per charging station [/]
U T C P : utilization charging point [/]
P C P : power charging point [kW]
η C P : efficiency charging point [/]
t P C : time for public charging [h]

Appendix B. Background Information for the Life Cycle Inventory (LCI)

In the following, we provide a more detailed description of the components modeled in Section 2.3.2. The structure of the background information is similar to the structure in in the Sub-Section Production of Components.
  • Filter
For the calculations, we use a maximum current ripple of 15% [70]. For the design of the filter capacity, we assume that the maximum change in the power factor perceived by the grid is 5%. The desired attenuation is set to 20%, the switching frequency of 200 kHz and the DC voltage result from [68,69], respectively. Based on the specified parameters, we select electronic components that sufficiently fulfill the characteristics, are available on the market, and for which material data are available. The components used in our study can be found in Table 3.
  • AC-DC Converter
Even though the capacitors for surface-mounting in the Ecoinvent database are not specified in [125], the dataset shows a ratio of 40% ceramics and is therefore considered as the best available dataset for ceramic capacitors. As an estimate for the mass of the capacitor, a dataset with mass specification from Murata is used [80]. The coil EELP 58 is used instead of EELP 54 [81]. The mass of the core is given in the manufacturers’ dataset. For the windings, we assume that 60% of the cores’ air space is filled with wire. With the density of copper (8920 kg/m3), the mass of copper for the windings is estimated. The production process is modeled with the Ecoinvent dataset for inductors.
  • DC-DC Converter
For the coil core, EELP64 is used. The amount of copper is calculated as shown for the AC-DC converter.
  • Printed circuit board (PCB), driver board, logic board, and busbars
For the size estimation of the size of the PCB, we estimate the outer dimension of the chargers. Schmenger et al. [68] state the volumes of the modular chargers for different charging powers. Based on the assumption that the 50 kW charger has the same power density as the 22 kW charger, we estimate the volume for the 50 kW charger. The ratio of width and height is based on [89]. We assume that the ratio remains constant over power. Based on the model from [89], we assume that the area of the PCB is 30% of the area of the charger.
As stated above, we base the dimensioning of the busbar on [87,88]. As stated by Mersen [88], an ampacity of 5 A/mm2 is considered and a 5% security surcharge is obeyed for each additional conductor. The minimum cross-sectional area is based on [87]. The maximum current considered originates from [67,68]. We estimate the maximum current based on the modularity of the charging unit. For the AC busbars, a quantity of three trace pitches can be assumed [87]. For the DC busbars, two trace pitches are assumed. We estimate the length of the busbars based on the outer dimensions of the charger [67]. The production process is modeled based on [87]. The surface of the busbars is galvanically nickel-plated. With the assumption of a thickness of 1 mm for the bus bars, a thickness of 20 μM for nickel-plating [87] and the density of 8900 kg/m3 for nickel the material flow and process data are based on [87].
  • Enclosure of electronic components and heatsink
To calculate the material flows of the enclosure for electronic components, the dimensions of the heatsink need to be estimated in a first step. The heatsink for the electronic devices shown in [89] is liquid-cooled. Based on [87], a thickness of 2.5 cm can be assumed. Under the assumption that the remaining space is used by electronic devices, we calculate the height of the enclosure for the electronic components from the dimensions of the charging unit and the height of the heat sink. The heat sink composes the base plate of the charging unit and is modeled separately. The material flows and processes used for the production phase of the enclosure with an untreated surface are based on [87].
The size estimations for our air-cooled heatsink are based on the assumption of a forced cooling with an airflow of at least 7 m/s [87]. We do not model the fan. We determine the mass of the air-cooled heatsink on the basis of a standard heatsink [126]. In our estimations, the size of the heat sink matches the base area of the charging unit. With the given ratio of weight and length of the heatsink [126], we estimate the mass of aluminum. For surface refinement, the surface area of the heatsink is anodized [87]. We estimate the surface to be anodized by taking the number of lamellas from [126] without considering the changing number of lamellas with the changing width. Therefore, each lamella has two sides to be anodized. The side of the heatsink that forms the bottom surface of the housing is not treated. With the anodizing surface calculated, accordingly, the further process data is taken from [87].
  • Charging infrastructure (CIS)
Based on [127] for a charging station with two charging points at 22 kW, we select the mains cable by [128] (Type NYY-J 5 × 50 SW) and assume that the difference of the total weight to the weight of copper is caused by insulation. Due to the fact that the material for the insulation is not differentiated any further in the dataset of the manufacturer, we base our estimation of the composition of the insulation and the processes needed for production on the Ecoinvent dataset “cable connector for computer, without plugs” [125]. For 50 kW charging power, a cross-section of the mains cable of 75 mm2 or 90 mm2 is used [129]. Due to the non-availability of data, we use a 95 mm2 cable for modeling [128] (Type NYY-J 5 × 95 SW). We calculate the quantity of insulation as described above.
For the charging cable, the insulation is estimated as mentioned above as the difference between the weight of copper and the total weight. The materials used for insulation as well as the production processes are based on the aforementioned dataset in Ecoinvent.
Regarding the housing, the most common stainless steel alloy (steel of grade 304 and 304L which consists of 18% chrome and 8% nickel and has a density of 8000 kg/m3 [130]) is used. The wall thickness is set to 2 mm [131]. For its production, the Ecoinvent dataset for sheet rolling is used. According to [96], the stainless steel is powder-coated. The related process is taken from Ecoinvent.
Table A1. Energy mix considered for modeling.
Energy SourcePercentage Share [%]
Coal43.51
Nuclear25.05
Natural gas9.32
Wind power4.03
Hydropower3.32
oil1.47
Hydropower, pumped storage1.06
biomass0.57
biogas0.49
photovoltaic0.09
Other11.08
Reference: for detailed information, please refer to [115].
Table A2. Environmental impacts of the AC system and the DC system for modeled scenarios considering a lifetime of 10 years.
Impact CategoryAC SystemDC System
Scenario
S
Scenario
M
Scenario
L
Scenario
S
Scenario
M
Scenario
L
WD4.97 ∙ 1066.43 ∙ 1068.80 ∙ 1064.14 ∙ 1065.36 ∙ 1067.34 ∙ 106
ULO8.44 ∙ 1061.09 ∙ 1071.49 ∙ 1075.45 ∙ 1067.05 ∙ 1069.65 ∙ 106
TET6.79 ∙ 1048.79 ∙ 1041.20 ∙ 1054.43 ∙ 1045.73 ∙ 1047.84 ∙ 104
TA4.52 ∙ 1065.86 ∙ 1068.02 ∙ 1063.31 ∙ 1064.28 ∙ 1065.86 ∙ 106
POF2.23 ∙ 1062.88 ∙ 1063.94 ∙ 1061.16 ∙ 1061.50 ∙ 1062.05 ∙ 106
PMF1.46 ∙ 1061.89 ∙ 1062.59 ∙ 1068.65 ∙ 1051.12 ∙ 1061.53 ∙ 106
OD5.20 ∙ 1016.73 ∙ 1019.22 ∙ 1013.84 ∙ 1014.97 ∙ 1016.81 ∙ 101
NLT8.04 ∙ 1041.04 ∙ 1051.43 ∙ 1054.44 ∙ 1045.75 ∙ 1047.87 ∙ 104
MRD2.89 ∙ 1083.74 ∙ 1085.12 ∙ 1089.22 ∙ 1071.19 ∙ 1081.63 ∙ 108
ME8.42 ∙ 1051.09 ∙ 1061.49 ∙ 1066.06 ∙ 1057.84 ∙ 1051.07 ∙ 106
MET4.36 ∙ 1075.64 ∙ 1077.73 ∙ 1073.59 ∙ 1074.64 ∙ 1076.35 ∙ 107
IR1.78 ∙ 1082.31 ∙ 1083.16 ∙ 1081.59 ∙ 1082.06 ∙ 1082.82 ∙ 108
HT1.20 ∙ 1091.55 ∙ 1092.13 ∙ 1098.22 ∙ 1081.06 ∙ 1091.46 ∙ 109
FE1.31 ∙ 1061.70 ∙ 1062.33 ∙ 1061.08 ∙ 1061.40 ∙ 1061.91 ∙ 106
FET4.66 ∙ 1076.03 ∙ 1078.25 ∙ 1073.91 ∙ 1075.05 ∙ 1076.92 ∙ 107
FD2.67 ∙ 1083.46 ∙ 1084.74 ∙ 1082.14 ∙ 1082.77 ∙ 1083.79 ∙ 108
CC9.97 ∙ 1081.29 ∙ 1091.77 ∙ 1098.02 ∙ 1081.04 ∙ 1091.42 ∙ 109
ALO5.93 ∙ 1077.67 ∙ 1071.05 ∙ 1085.03 ∙ 1076.52 ∙ 1078.92 ∙ 107

Appendix C. Detailed Results on Component Level

Table A3. Absolute environmental impacts of the electronic components for the modeled 22 kW charger per kWh.
Impact
Category
AC-DC
Converter
FilterDC-DC
Converter
PCBDriver
Board
Logic
Board
Busbars
WD6.92 ∙ 10−10 2.71 ∙ 10−91.07 ∙ 10−99.21 ∙ 10−116.48 ∙ 10−105.58 ∙ 10−101.59 ∙ 10−11
ULO2.12 ∙ 10−91.12 ∙ 10−83.29 ∙ 10−92.18 ∙ 10−102.40 ∙ 10−92.08 ∙ 10−94.44 ∙ 10−11
TET2.20 ∙ 10−116.51 ∙ 10−113.95 ∙ 10−116.83 ∙ 10−122.63 ∙ 10−111.63 ∙ 10−111.19 ∙ 10−12
TA1.10 ∙ 10−94.26 ∙ 10−91.86 ∙ 10−98.32 ∙ 10−115.77 ∙ 10−104.46 ∙ 10−105.21 ∙ 10−11
POF8.54 ∙ 10−104.72 ∙ 10−91.25 ∙ 10−95.18 ∙ 10−113.59 ∙ 10−103.11 ∙ 10−101.07 ∙ 10−11
PMF5.00 ∙ 10−102.24 ∙ 10−98.09 ∙ 10−103.98 ∙ 10−112.75 ∙ 10−102.19 ∙ 10−101.52 ∙ 10−11
OD6.89 ∙ 10−156.12 ∙ 10−141.00 ∙ 10−141.19 ∙ 10−158.52 ∙ 10−158.35 ∙ 10−154.34 ∙ 10−17
NLT2.34 ∙ 10−111.63 ∙ 10−103.36 ∙ 10−112.20 ∙ 10−121.64 ∙ 10−111.36 ∙ 10−112.05 ∙ 10−13
MRD1.04 ∙ 10−79.36 ∙ 10−72.81 ∙ 10−77.64 ∙ 10−97.19 ∙ 10−85.54 ∙ 10−84.36 ∙ 10−9
ME1.89 ∙ 10−108.76 ∙ 10−103.00 ∙ 10−101.71 ∙ 10−111.27 ∙ 10−101.14 ∙ 10−104.54 ∙ 10−12
MET6.58 ∙ 10−92.18 ∙ 10−81.22 ∙ 10−85.29 ∙ 10−107.33 ∙ 10−98.14 ∙ 10−93.88 ∙ 10−10
IR1.65 ∙ 10−87.99 ∙ 10−82.40 ∙ 10−81.72 ∙ 10−91.03 ∙ 10−89.12 ∙ 10−96.74 ∙ 10−11
HT3.50 ∙ 10−79.26 ∙ 10−76.61 ∙ 10−72.50 ∙ 10−83.79 ∙ 10−74.25 ∙ 10−72.33 ∙ 10−8
FE1.99 ∙ 10−106.30 ∙ 10−103.56 ∙ 10−101.65 ∙ 10−112.35 ∙ 10−102.67 ∙ 10−101.05 ∙ 10−11
FET6.40 ∙ 10−91.99 ∙ 10−81.17 ∙ 10−84.80 ∙ 10−107.52 ∙ 10−98.62 ∙ 10−93.63 ∙ 10−10
FD3.92 ∙ 10−82.18 ∙ 10−75.62 ∙ 10−83.73 ∙ 10−92.38 ∙ 10−82.13 ∙ 10−81.99 ∙ 10−10
CC1.43 ∙ 10−77.77 ∙ 10−72.06 ∙ 10−71.37 ∙ 10−88.65 ∙ 10−87.75 ∙ 10−87.88 ∙ 10−10
ALO7.80 ∙ 10−94.03 ∙ 10−81.11 ∙ 10−84.44 ∙ 10−103.02 ∙ 10−92.42 ∙ 10−97.86 ∙ 10−11
Table A4. Comparison of total environmental impacts and changes in environmental impacts per kWh when considering the charging infrastructure of the AC system and the DC system.
Impact CategoryAC SystemDC SystemΔ Absolute 1Δ Relative 1
WD3.25 ∙ 10−53.13 ∙ 10−51.14 ∙ 10−63.50%
ULO1.13 ∙ 10−41.17 ∙ 10−4−3.86 ∙ 10−6−3.41%
TET2.74 ∙ 10−62.51 ∙ 10−62.34 ∙ 10−78.54%
TA9.74 ∙ 10−58.87 ∙ 10−58.69 ∙ 10−68.92%
POF2.70 ∙ 10−52.73 ∙ 10−5−2.79 ∙ 10−7−1.03%
PMF3.47 ∙ 10−53.55 ∙ 10−5−7.55 ∙ 10−7−2.18%
OD1.74 ∙ 10−102.13 ∙ 10−10−3.92 ∙ 10−11−22.54%
NLT5.53 ∙ 10−75.78 ∙ 10−7−2.55 ∙ 10−8−4.61%
MRD1.14 ∙ 10−21.17 ∙ 10−2−3.27 ∙ 10−4−2.86%
ME1.12 ∙ 10−51.08 ∙ 10−54.04 ∙ 10−73.61%
MET9.32 ∙ 10−48.85 ∙ 10−44.67 ∙ 10−55.01%
IR2.25 ∙ 10−42.67 ∙ 10−4−4.26 ∙ 10−5−18.99%
HT5.17 ∙ 10−24.48 ∙ 10−27.00 ∙ 10−313.52%
FE2.35 ∙ 10−52.05 ∙ 10−53.01 ∙ 10−612.81%
FET8.73 ∙ 10−48.33 ∙ 10−43.98 ∙ 10−54.56%
FD8.99 ∙ 10−41.06 ∙ 10−3−1.59 ∙ 10−4−17.66%
CC3.05 ∙ 10−33.79 ∙ 10−3−7.39 ∙ 10−4−24.22%
ALO2.51 ∙ 10−42.77 ∙ 10−4−2.55 ∙ 10−5−10.13%
1 AC system—DC system.

References

  1. Yilmaz, M.; Krein, P.T. Review of Battery Charger Topologies, Charging Power Levels, and Infrastructure for Plug-In Electric and Hybrid Vehicles. IEEE Trans. Power Electron. 2013, 28, 2151–2169. [Google Scholar] [CrossRef]
  2. Zeit Online. Forscher Warnen Vor Einer Heißzeit. 2018. Available online: https://www.zeit.de/wissen/umwelt/2018-08/klimaerwaermung-heisszeit-kippelemente-studie-klimaforschung (accessed on 10 August 2020).
  3. Umweltbundesamt. Beobachteter Klimawandel. 2013. Available online: https://www.umweltbundesamt.de/themen/klima-energie/klimawandel/beobachteter-klimawandel (accessed on 10 August 2020).
  4. Stern, N. The Economics of Climate Change: The Stern Review; Cambridge University Press: Cambridge, UK, 2007. [Google Scholar] [CrossRef] [Green Version]
  5. Breidenich, C.; Magraw, D.; Rowley, A.; Rubin, J.W. The Kyoto protocol to the United Nations framework convention on climate change. Am. J. Int. Law 1998, 92, 315–331. [Google Scholar] [CrossRef]
  6. Agreement, P. The Paris Agreement. In Proceedings of the Parties to the United Nations Framework Convention on Climate Change, Paris, France, 30 November–12 December 2015. [Google Scholar]
  7. Umweltbundesamt. Trendtabellen Treibhausgase 1990–2018 (Stand: EU-Submission). 2020. Available online: https://www.umweltbundesamt.de/dokument/trendtabellen-treibhausgase-1990-2018-stand-eu (accessed on 5 December 2020).
  8. Umweltbundesamt. Emissionsdaten. 2020. Available online: https://www.umweltbundesamt.de/themen/verkehr-laerm/emissionsdaten#verkehrsmittelvergleich_personenverkehr (accessed on 10 August 2020).
  9. Eisenkopf, A.; Fricke, H.; Friedrich, M.; Haasis, H.-D.; Knieps, G.; Knorr, A. Nach der Klimakonferenz in Paris: Wird eine neue Klimastrategie für den Verkehr benötigt? Z. Verk. 2016, 87. [Google Scholar]
  10. Hawkins, T.R.; Singh, B.; Majeau-Bettez, G.; Strømman, A.H. Comparative Environmental Life Cycle Assessment of Conventional and Electric Vehicles. J. Ind. Ecol. 2012, 17, 53–64. [Google Scholar] [CrossRef]
  11. International Energy Agency. Global EV Outlook 2017; International Energy Agency: Paris, France, 2017. [Google Scholar] [CrossRef]
  12. Nykvist, B.; Nilsson, M. Rapidly falling costs of battery packs for electric vehicles. Nat. Clim. Chang. 2015, 5, 329–332. [Google Scholar] [CrossRef]
  13. Faria, R.; Moura, P.; Delgado, J.; De Almeida, A.T. A sustainability assessment of electric vehicles as a personal mobility system. Energy Convers. Manag. 2012, 61, 19–30. [Google Scholar] [CrossRef]
  14. Elektromobilität, N.P. Fortschrittsbericht 2018—Markthochlaufphase; Nationale Plattform Elektromobilität (NPE): Berlin, Germany, 2018. [Google Scholar]
  15. Musavi, F.; Edington, M.; Eberle, W.; Dunford, W.G. Evaluation and Efficiency Comparison of Front End AC-DC Plug-in Hybrid Charger Topologies. IEEE Trans. Smart Grid 2012, 3, 413–421. [Google Scholar] [CrossRef]
  16. Nordelöf, A.; Messagie, M.; Tillman, A.-M.; Söderman, M.L.; Van Mierlo, J. Environmental impacts of hybrid, plug-in hybrid, and battery electric vehicles—What can we learn from life cycle assessment? Int. J. Life Cycle Assess. 2014, 19, 1866–1890. [Google Scholar] [CrossRef] [Green Version]
  17. Tintelecan, A.; Dobra, A.C.; Marțiș, C. Literature Review—Electric Vehicles Life Cycle Assessment. In Proceedings of the 2020 ELEKTRO, Taormina, Italy, 23 March 2020; pp. 1–6. [Google Scholar]
  18. Faria, R.; Marques, P.; Moura, P.; Freire, F.; Delgado, J.; De Almeida, A.T. Impact of the electricity mix and use profile in the life-cycle assessment of electric vehicles. Renew. Sustain. Energy Rev. 2013, 24, 271–287. [Google Scholar] [CrossRef]
  19. Zhang, Z.; Sun, X.; Ding, N.; Yang, J. Life cycle environmental assessment of charging infrastructure for electric vehicles in China. J. Clean. Prod. 2019, 227, 932–941. [Google Scholar] [CrossRef]
  20. Lucas, A.; Silva, C.A.; Neto, R.C. Life cycle analysis of energy supply infrastructure for conventional and electric vehicles. Energy Policy 2012, 41, 537–547. [Google Scholar] [CrossRef]
  21. Nansai, K.; Tohno, S.; Kono, M.; Kasahara, M.; Moriguchi, Y. Life-cycle analysis of charging infrastructure for electric vehicles. Appl. Energy 2001, 70, 251–265. [Google Scholar] [CrossRef]
  22. Traut, E.; Hendrickson, C.; Klampfl, E.; Liu, Y.; Michalek, J.J. Optimal design and allocation of electrified vehicles and dedicated charging infrastructure for minimum life cycle greenhouse gas emissions and cost. Energy Policy 2012, 51, 524–534. [Google Scholar] [CrossRef]
  23. Bass, F.M. A New Product Growth for Model Consumer Durables. Manag. Sci. 1969, 15, 215–227. [Google Scholar] [CrossRef]
  24. Massiani, J.; Gohs, A. The choice of Bass model coefficients to forecast diffusion for innovative products: An empirical investigation for new automotive technologies. Res. Transp. Econ. 2015, 50, 17–28. [Google Scholar] [CrossRef] [Green Version]
  25. Kraftfahrt-Bundesamt (KBA)–Federal Motor Transport Authority. Bestand an Pkw in den Jahren 2009 bis 2018 nach Ausgewählten Kraftstoffarten. 2018. Available online: www.kba.de/DE/Statistik/Fahrzeuge/Bestand/Umwelt/b_umwelt_z.html?nn=663524 (accessed on 15 December 2018).
  26. Kraftfahrt-Bundesamt (KBA)–Federal Motor Transport Authority. Bestand an Personenkraftwagen am 1. Januar 2020 nach Bundesländern und Ausgewählten Kraftstoffarten Absolut. 2020. Available online: https://www.kba.de/DE/Statistik/Fahrzeuge/Bestand/Umwelt/fz_b_umwelt_archiv/2020/2020_b_umwelt_dusl.html?nn=2601598 (accessed on 6 August 2020).
  27. Bergk, F.; Biemann, K.; Heidt, C.; Knörr, W.; Lambrecht, U.; Schmidt, T. Klimaschutzbeitrag des Verkehrs Bis 2050. Available online: https://www.umweltbundesamt.de/sites/default/files/medien/1410/publikationen/texte_56_2016_klimaschutzbeitrag_des_verkehrs_2050_getagged.pdf (accessed on 5 December 2020).
  28. Umweltbundesamt. Klimabilanz 2017: Emissionen Gehen Leicht Zurück. 2018. Available online: https://www.umweltbundesamt.de/presse/pressemitteilungen/klimabilanz-2017-emissionen-gehen-leicht-zurueck (accessed on 6 August 2020).
  29. Kraftfahrt-Bundesamt (KBA)–Federal Motor Transport Authority. Neuzulassungen von Pkw in den Jahren 2008 bis 2017 nach Ausgewählten Kraftstoffarten. 2018. Available online: https://www.kba.de/DE/Statistik/Fahrzeuge/Neuzulassungen/Umwelt/n_umwelt_z.htmlnn=652326 (accessed on 15 December 2018).
  30. Bundesregierung. Regierungsprogramm Elektromobilität; Publ. Bundesregierung: Berlin, Germany, 2011. [Google Scholar]
  31. Nationale Plattform Elektromobilität (NPE). Die Ziele. 2020. Available online: http://nationale-plattform-elektromobilitaet.de/hintergrund/die-ziele/ (accessed on 6 August 2020).
  32. Kraftfahrt-Bundesamt (KBA)–Federal Motor Transport Authority. Bestand am 01. Januar 2018 nach Segmenten. 2018. Available online: https://www.kba.de/DE/Statistik/Fahrzeuge/Bestand/Segmente/segmente_node.html (accessed on 15 May 2018).
  33. Kompetenzzentrum Elektromobilität NRW. Data Sheet: Hyundai Kona Elektro (100 kW). 2018. Available online: https://www.elektromobilitaet.nrw.de/fileadmin/Daten/Download_Dokumente/Fahrzeuge/Hyundai_Kona_Elektro__100_kW_.pdf (accessed on 10 January 2020).
  34. Kompetenzzentrum Elektromobilität NRW. Data Sheet: Jaguar I-PACE. 2018. Available online: https://www.elektromobilitaet.nrw.de/fileadmin/Daten/Download_Dokumente/Fahrzeuge/Jaguar_I-PACE.pdf (accessed on 10 January 2020).
  35. Kompetenzzentrum Elektromobilität NRW. Data Sheet: Nissan Leaf. 2018. Available online: https://www.elektromobilitaet.nrw.de/fileadmin/Daten/Download_Dokumente/Fahrzeuge/Nissan_Leaf.pdf (accessed on 10 January 2020).
  36. Kompetenzzentrum Elektromobilität NRW. Data Sheet: Hyundai Kona Elektro (150 kW). 2018. Available online: https://www.elektromobilitaet.nrw.de/fileadmin/Daten/Download_Dokumente/Fahrzeuge/Hyundai_Kona_Elektro__150_kW_.pdf (accessed on 10 January 2020).
  37. Kompetenzzentrum Elektromobilität NRW. Data Sheet: VW e-Golf. 2018. Available online: https://www.elektromobilitaet.nrw.de/fileadmin/Daten/Download_Dokumente/Fahrzeuge//VW_e-Golf.pdf (accessed on 10 January 2020).
  38. Kompetenzzentrum Elektromobilität NRW. Data Sheet: Opel Ampera-e. 2018. Available online: https://www.elektromobilitaet.nrw.de/fileadmin/Daten/Download_Dokumente/Fahrzeuge/Opel_Ampera-e.pdf (accessed on 10 October 2018).
  39. Kompetenzzentrum Elektromobilität NRW. Data Sheet: Renault Zoe, Z.E. 2018. Available online: https://www.elektromobilitaet.nrw.de/fileadmin/Daten/Download_Dokumente/Fahrzeuge/Renault_Zoe_Z.E..pdf (accessed on 10 October 2018).
  40. Kompetenzzentrum Elektromobilität NRW. Data Sheet: Tesla Model S 100D. 2018. Available online: https://www.elektromobilitaet.nrw.de/fileadmin/Daten/Download_Dokumente/Fahrzeuge/Tesla_Model_S_100D.pdf (accessed on 10 October 2018).
  41. Kompetenzzentrum Elektromobilität NRW. Data Sheet: Tesla Model X 100D. 2018. Available online: https://www.elektromobilitaet.nrw.de/fileadmin/Daten/Download_Dokumente/Fahrzeuge/Tesla_Model_X_100D.pdf (accessed on 10 January 2020).
  42. Kraftfahrt-Bundesamt (KBA)–Federal Motor Transport Authority. Erneut mehr Gesamtkilometer bei Geringerer Jahresfahrleistung je Fahrzeug. 2018. Available online: https://www.kba.de/DE/Statistik/Kraftverkehr/VerkehrKilometer/2017_vk_kurzbericht_pdf.pdf?__blob=publicationFile&v=14 (accessed on 3 June 2018).
  43. Kang, J.E.; Recker, W. An activity-based assessment of the potential impacts of plug-in hybrid electric vehicles on energy and emissions using 1-day travel data. Transp. Res. Part D Transp. Environ. 2009, 14, 541–556. [Google Scholar] [CrossRef]
  44. Robinson, A.; Blythe, P.; Bell, M.; Hübner, Y.; Hill, G. Analysis of electric vehicle driver recharging demand profiles and subsequent impacts on the carbon content of electric vehicle trips. Energy Policy 2013, 61, 337–348. [Google Scholar] [CrossRef] [Green Version]
  45. Siegrist, A.; Schnabl, P.; Burkhart, S.; de Haan, P.; Bianchetti, R. Elektromobilität: Studie Ladeinfrastruktur Region Basel. Available online: https://docplayer.org/8358125-Elektromobilitaet-studie-ladeinfrastruktur-region-basel.html (accessed on 5 December 2020).
  46. Nationale Plattform Elektromobilität. Vision und Roadmap der Nationalen Plattform Elektromobilität. Gem. Geschäftsst. Elektromobilität Bundesreg 2013, 27. Available online: http://nationale-plattform-elektromobilitaet.de/fileadmin/user_upload/Redaktion/1379668151_de_2122747422.pdf (accessed on 5 December 2020).
  47. Christensen, L.; Nørrelund, A.V.; Olsen, A. Travel behaviour of potential Electric Vehicle drivers. The need for changing A contribution to the Edison project. In Proceedings of the European Transport Conference 2010, Glasgow, UK, 11–13 October 2010. [Google Scholar]
  48. EAFO. Country Detail Electricity. 2019. Available online: https://www.eafo.eu/electric-vehicle-charging-infrastructure (accessed on 6 August 2020).
  49. Lucas, A.; Prettico, G.; Flammini, M.G.; Kotsakis, E.; Fulli, G.; Masera, M. Indicator-Based Methodology for Assessing EV Charging Infrastructure Using Exploratory Data Analysis. Energies 2018, 11, 1869. [Google Scholar] [CrossRef] [Green Version]
  50. Ladesäulen-Bestand in Deutschland für Dreimal so Viele Elektroautos Ausreichend. Available online: https://www.emobilserver.de/nachrichten/energie-ladetechnik/1131-ladesäulen-bestand-in-deutschland-für-dreimal-so-viele-elektroautos-ausreichend.html (accessed on 6 August 2020).
  51. ABB. Terra 184 Infographic. 2020. Available online: https://search.abb.com/library/Download.aspx?DocumentID=9AKK107680A8808&LanguageCode=en&DocumentPartId=&Action=Launch (accessed on 7 August 2020).
  52. Sheet NLG664—On Board Fast Charger. Available online: https://www.brusa.biz/fileadmin/template/Support-Center/Datenbl%C3%A4tter/BRUSA_DB_EN_NLG664.pdf (accessed on 5 December 2020).
  53. EVTEC AG. Data: Move&Charge 3in1. 2020. Available online: https://www.evtec.ch/en/products/move_and_charge/ (accessed on 7 August 2020).
  54. Stercom Power Solutions GmbH: Feel the Power. Available online: https://stercom.de/_media//PDFs/Deutsch/OBC_D1.7.pdf (accessed on 5 December 2020).
  55. Bundesnetzagentur. Ladesäulenkarte. 2020. Available online: https://www.bundesnetzagentur.de/DE/Sachgebiete/ElektrizitaetundGas/Unternehmen_Institutionen/HandelundVertrieb/Ladesaeulenkarte/Ladesaeulenkarte_node.html (accessed on 5 August 2020).
  56. McManus, M.C.; Taylor, C.M. The changing nature of life cycle assessment. Biomass Bioenergy 2015, 82, 13–26. [Google Scholar] [CrossRef] [Green Version]
  57. International Organization for Standardization. ISO 14040: Environmental Management—Life Cycle Assessment; Principles and Framework; ISO: Geneva, Switzerland, 2006. [Google Scholar]
  58. International Organization for Standardization. ISO 14044: Environmental Management—Life Cycle Assessment; Requirements and Guidelines; ISO: Geneva, Switzerland, 2006. [Google Scholar]
  59. Wernet, G.; Bauer, C.; Steubing, B.; Reinhard, J.; Moreno-Ruiz, E.; Weidema, B.P. The ecoinvent database version 3 (part I): Overview and methodology. Int. J. Life Cycle Assess. 2016, 21, 1218–1230. [Google Scholar] [CrossRef]
  60. Green Delta. 2020. OpenLCA. Available online: http://www.openlca.org/ (accessed on 5 December 2020).
  61. Schroeder, A.; Traber, T. The economics of fast charging infrastructure for electric vehicles. Energy Policy 2012, 43, 136–144. [Google Scholar] [CrossRef]
  62. Stella, K.; Wollersheim, O.; Fichtner, W.; Jochem, P.; Schücking, M.; Nastold, M. Über 300.000 Kilometer unter Strom: Physikalisch-Technische, Ökonomische, Ökologische und Sozialwissenschaftliche Begleitforschung des Schaufensterprojektes RheinMobil: Grenzüberschreitende, Perspektivisch Wirtschaftliche Elektrische Pendler-und Dienstwagenverkehre im Deutsch-Französischen Kontext: Schaufenster Elektromobilität-eine Initiative der Bundesregierung: LivingLab BWe Mobil; Karlsruher Institut für Technologie (KIT): Karlsruhe, Germany, 2015. [Google Scholar]
  63. Shiau, C.S.N.; Samaras, C.; Hauffe, R.; Michalek, J.J. Impact of battery weight and charging patterns on the economic and environmental benefits of plug-in hybrid vehicles. Energy Policy 2009. [Google Scholar] [CrossRef]
  64. ABB. Global Product Portfolio-Smarter Mobility. 2019. Available online: https://new.abb.com/about/our-businesses/electrification/e-mobilitysolutions (accessed on 5 December 2020).
  65. Evtec. Data Sheet: Espresso&Charge. 2018. Available online: https://www.evtec.ch/en/products/espressoandcharge-usp/ (accessed on 7 August 2020).
  66. Mortimer, B.; Olk, C.; Roy, G.K.; Tarnate, W.R.; Doncker, R.W.; Monti, A. Fast-Charging Technologies, Topologies and Standards 2.0; E.ON Energy Research Center Series: Aachen, Germany, 2019; Volume 11. [Google Scholar]
  67. Schmenger, J.; Zeltner, S.; Kramer, R.; Endres, S.; Marz, M. A 3.7 kW on-board charger based on modular circuit design. In Proceedings of the IECON 2015—41st Annual Conference of the IEEE Industrial Electronics Society, Yokohama, Japan, 9–12 November 2015; pp. 001382–001387. [Google Scholar]
  68. Schmenger, J.; Endres, S.; Zeltner, S.; März, M. A 22 kW on-board charger for automotive applications based on a modular design. In Proceedings of the 2014 IEEE Conference on Energy Conversion (CENCON), Johor Bahru, Malaysia, 13–14 October 2014; pp. 1–6. [Google Scholar]
  69. Schmenger, J.; Kramer, R.; Marz, M. Active hybrid common mode filter for a highly integrated on-board charger for automotive applications. In Proceedings of the 2015 IEEE 13th Brazilian Power Electronics Conference and 1st Southern Power Electronics Conference (COBEP/SPEC), Santos, Brazil, 29 November–2 December 2015; pp. 1–7. [Google Scholar]
  70. Hultin, A.; Wolgers, J. Integration of Fast Charger Stations. Master’s Thesis, Chalmers University of Technology, Göteborg, Sweden, 2017. [Google Scholar]
  71. Liserre, M.; Blaabjerg, F.; Hansen, S. Design and Control of an LCL-Filter-Based Three-Phase Active Rectifier. IEEE Trans. Ind. Appl. 2005, 41, 1281–1291. [Google Scholar] [CrossRef]
  72. Reznik, A.; Simoes, M.G.; Al-Durra, A.; Muyeen, S.M. LCL Filter design and performance analysis for grid-interconnected systems. IEEE Trans. Ind. Appl. 2014. [Google Scholar] [CrossRef]
  73. Beres, R.N.; Wang, X.; Liserre, M.; Blaabjerg, F.; Bak, C.L. A Review of Passive Power Filters for Three-Phase Grid-Connected Voltage-Source Converters. IEEE J. Emerg. Sel. Top. Power Electron. 2016, 4, 54–69. [Google Scholar] [CrossRef] [Green Version]
  74. Plaßmann, W.; Schulz, D. Handbuch Elektrotechnik, 6th ed.; Springer: Berlin/Heidelberg, Germany, 2013. [Google Scholar]
  75. Reznik, A.; Simões, M.G.; Al-Durra, A.; Muyeen, S.M. LCL filter design and performance analysis for small wind turbine systems. In Proceedings of the 2012 IEEE Power Electronics and Machines in Wind Applications, Denver, CO, USA, 16–18 July 2012; pp. 1–7. [Google Scholar]
  76. Fastron Group. Data Sheet: TLC/10A. 2016. Available online: http://fastrongroup.com/toroid-line-chokes/tlc10a (accessed on 5 December 2020).
  77. ICAR. Data Sheet: Power Electronics Capacitors: MKP Series. 2011. Available online: https://www.icar.com/wp-content/uploads/2018/05/MKP-Icar-Capacitors.pdf (accessed on 5 December 2020).
  78. Infineon. Data Sheet IPW60R045CP. 2013. Available online: https://www.mouser.es/datasheet/2/196/Infineon-IPW60R045CP-DS-v02_02-en-1227462.pdf (accessed on 5 December 2020).
  79. Infineon. Data Sheet IDW40G65C5B. 2015. Available online: https://www.infineon.com/dgdl/Infineon-IDW40G65C5B-DS-v02_00-EN.pdf?fileId=5546d4624e24005f014e451799b149e1 (accessed on 5 December 2020).
  80. Murata Manufacturing Co. Ltd. Data KC355WD72J474MH01#. 2020. Available online: https://www.murata.com/en-eu/products/productdetail?partno=KC355WD72J474MH01%23 (accessed on 7 August 2020).
  81. TDK. Epcos Data Book 2013: Ferrites and Accessories. 2013. Available online: https://www.tdk-electronics.tdk.com/download/519704/069c210d0363d7b4682d9ff22c2ba503/ferrites-and-accessories-db-130501.pdf (accessed on 5 December 2020).
  82. Chae, H.J.; Kim, W.Y.; Yun, S.Y.; Jeong, Y.S.; Lee, J.Y.; Moon, H.T. 3.3kW on board charger for electric vehicle. In Proceedings of the 8th International Conference on Power Electronics—ECCE, Jeju, Korea, 30 May–3 June 2011. [Google Scholar]
  83. Lai, J.S.; Miwa, H.; Lai, W.H.; Tseng, N.H.; Lee, C.S.; Lin, C.H. A high-efficiency on-board charger utilitzing a hybrid LLC and phase-shift DC-DC converter. In Proceedings of the 2014 International Conference on Intelligent Green Building and Smart Grid, IGBSG, Taipei, Taiwan, 23–25 April 2014. [Google Scholar]
  84. Infineon. Data Sheet IPW65R045C7. 2013. Available online: https://www.infineon.com/dgdl/Infineon-IPW65R045C7-DS-v02_01 (accessed on 5 December 2020).
  85. Elgström, T.; Nordgren, L. Evaluation and Design of High Frequency Transformers for on Board Charging Applications. Master’s Thesis, Chalmers University of Technology, Gothenburg, Sweden, 2016. [Google Scholar]
  86. TDK Electronics AG. Data Sheet: Ferrite Cores for Switching Power Supplies: Large PQ Series. 2016. Available online: https://product.tdk.com/info/en/catalog/datasheets/ferrite_mz_sw_large_pq_en.pdf (accessed on 5 December 2020).
  87. Nordelöf, A.; Alatalo, M. A scalable life cycle inventory of an automotive power electronic inverter unit—Part I: Design and composition. Int. J. Life Cycle Assess. 2019, 24, 78–92. [Google Scholar] [CrossRef] [Green Version]
  88. Laminated Bus Bar Solutions—Mersen. Available online: https://ep-us.mersen.com/sites/mersen_us/files/2018-12/Laminated-Busbar-Solutions.pdf (accessed on 5 December 2020).
  89. Fraunhofer Institute for Integrated Systems and Device Technology IISB. 3.7 kW Battery Charger for Automotive Applications. 2014. Available online: https://www.iisb.fraunhofer.de/content/dam/iisb2014/en/Documents/Research-Areas/vehicle_electronics/FraunhoferIISB_ProductSheet_FE_3k7W-Onboard-Battery-Charger_www.pdf (accessed on 5 December 2020).
  90. Conrad Electronics International GmbH & CoKG. Data: Universal Enclosures. 2020. Available online: https://www.conrad.com/o/universal-enclosures-0203042 (accessed on 7 August 2020).
  91. Star Charge. 180 kW Super DC Charger_DC Series. 2018. Available online: http://en.starcharge.com/show.asp?id=37 (accessed on 7 August 2020).
  92. ESL. Ladekabel Elektroauto. 2020. Available online: https://esl-emobility.com/de/ladekabel-elektroauto.html (accessed on 20 November 2018).
  93. Lapp Group. Data Sheet: ÖLFLEX® CHARGE. 2020. Available online: https://lappaustria.lappgroup.com/produkte/katalog-e-shop/anschluss-und-steuerleitungen/besondere-anwendungen/emobility/oelflex-charge.html (accessed on 5 December 2020).
  94. Phoenix Contact. Data Sheet: DC Charging Cable–EV-T2M4CC-DC60A-2,5M16ESBK00-1623043. 2020. Available online: https://www.phoenixcontact.com/online/portal/pi?uri=pxc-oc-itemdetail:pid=1623043&library=pien&tab=1 (accessed on 5 December 2020).
  95. Lapp Group. Data Sheet: ÖLFLEX® SERVO 2YSLCY-JB. 2020. Available online: https://products.lappgroup.com/online-catalogue/power-and-control-cables/servo-applications/pvc-sheath/oelflex-servo-2yslcy-jb.html (accessed on 5 December 2020).
  96. Walther-Werke Ferdinand Walther GmbH. Data Sheet: E41X01A249B0. 2017. Available online: https://www.walther-werke.de/pdf/datasheets/PD_E41X01A249B0_DE.pdf (accessed on 5 December 2020).
  97. Schrack Technik GmbH. Data: I-CHARGE Public. 2020. Available online: https://www.schrack.at/know-how/alternativenergie/elektromobilitaet/i-charge-stromtankstellen/i-charge-public/ (accessed on 7 August 2020).
  98. Elektrohandel Wandelt GmbH. Data: Mennekes 1311510SW Ladestation Basic 22. 2020. Available online: https://www.elektro-wandelt.de/Mennekes-1311510SW-Ladestation-Basic-22.html (accessed on 7 August 2020).
  99. Elektrohandel Wandelt GmbH. Data: Mennekes 1319610SW Ladestation Smart 22 SW. 2020. Available online: https://www.elektro-wandelt.de/Mennekes-1319610SW-Ladestation-Smart-22-SW.html (accessed on 7 August 2020).
  100. Circocontrol, S.A. Data Sheet: Serie eStreet (AC). Available online: https://circontrol.de/wp-content/uploads/saule-estreet-datasheet.pdf (accessed on 5 December 2020).
  101. Data: Alfen Twin. 2020. Available online: https://alfen.com/de/icu-twin (accessed on 7 August 2020).
  102. ABL SURSUM. Data Sheet: Ladesäule eMC2. 2018. Available online: https://www.ablmobility.de/global/downloads/datenblaetter/emc2/eMC2_DE/2P4445.pdf?m=1597417459& (accessed on 5 December 2020).
  103. ABL SURSUM. Data Sheet: LADESÄULE eMC3. 2019. Available online: https://www.ablmobility.de/global/downloads/anleitungen/emc3/eMC3_UM_IM_DE.pdf?m=1602138773& (accessed on 5 December 2020).
  104. Compleo Charging Solutions GmbH. Data Sheet: Compleo Advanced. Available online: https://www.compleo-cs.com/fileadmin/user_upload/ladestationen/datenblaetter_advanced_digital.pdf (accessed on 5 December 2020).
  105. EBG Group. Data Sheet: CITO BM2 500. Available online: https://pub-mediabox-storage.rxweb-prd.com/exhibitor/document/e2c22e9f-8306-4880-836f-6e42a889b7ae (accessed on 5 December 2020).
  106. Charge-ON GmbH. Data Sheet: Ladestation Pro. Available online: https://www.eon-drive.de/content/dam/eon-emobility-de/Playground/PDFs/Datasheets/Pro_Datenblatt.pdf (accessed on 5 December 2020).
  107. Walther-Werke Ferdinand Walther GmbH. Data: Charging Station Evolution 350 Key with Two Charging Points Type 2 up to 22kW and Basis Monitoring. Available online: https://www.walther-werke.de/nc/products-page/filter/ctrl/product/action/show/partno/e21901ae0910-14/?tx_waltherwerkeproducts_productfilter%5Bebene%5D=2&tx_waltherwerkeproducts_productfilter%5Bebene2%5D=13&tx_waltherwerkeproducts_productfilter%5Bebene3%5D (accessed on 7 August 2020).
  108. PC Electric GmbH. Data Sheet: Ladesäule LS4. Available online: https://oxomi.com/p/3000237/catalog/10163042 (accessed on 5 December 2020).
  109. Castellan, A.G. Data: Empfang-Ladestation. Available online: https://www.castellan-ag.de/details/empfang-ladestation.html (accessed on 7 August 2020).
  110. Swarco Traffic Systems GmbH. Data Sheet: Evolt Public 7″. 2017. Available online: https://www.swarco.com/sites/default/files/public/downloads/2018-10/01_2017%20SWARCO%20EVOLT%20Public%207%20Final.pdf (accessed on 5 December 2020).
  111. Delta Electronics (Netherlands) B.V. Data Sheet: 150 kW Ultra-Fast Charger. 2019. Available online: https://emobility.delta-emea.com/downloads/Brochure%20-%20UFC%20Ultra%20Fast%20Charger%20V7%20EN%202019-10-07.pdf.pdf (accessed on 5 December 2020).
  112. ABB Inc. Data Sheet: Terra 53 Multi-Standard DC Charging Station. 2014. Available online: https://new.abb.com/ev-charging/de/produkte/ladestationen-pkws/terra-schnelllades%c3%a4ulen/terra-54-cjg (accessed on 5 December 2020).
  113. Petrotec Group. Data Sheet: PFAST MULTI. 2014. Available online: https://www.petrotec.com/media/33069/modibp-fast-multi-05_2014.pdf (accessed on 5 December 2020).
  114. Borken-Kleefeld, J.; Weidema, B.P. Global default data for freight transport per product group. Manuscr. Spec. Ecoinvent 2013, 3. [Google Scholar]
  115. Frischknecht, R.; Tuchschmid, M.; Emmenegger, M.F.; Bauer, C.; Dones, R. Strommix. Sachbilanzen von Energiesystemen: Grundlagen Für Den Ökologischen Vergleich von Energiesystemen und den Einbezug von Energiesystemen in Ökobilanzen für Die Schweiz; Dones, R., Ed.; Paul Scherrer Institut, Villigen & Swiss Centre for Life Cycle Inventories: Dübendorf, Switzerland, 2007; ISBN 3-905594-38-2. [Google Scholar]
  116. Koj, J.C.; Wulf, C.; Zapp, P. Environmental impacts of power-to-X systems-A review of technological and methodological choices in Life Cycle Assessments. Renew. Sustain. Energy Rev. 2019, 112, 865–879. [Google Scholar] [CrossRef]
  117. Rosenbaum, R.K. Selection of Impact Categories, Category Indicators and Characterization Models in Goal and Scope Definition. In Goal and Scope Definition in Life Cycle Assessment; Springer: Berlin/Heidelberg, Germany, 2017; pp. 63–122. [Google Scholar]
  118. Huijbregts, M.; Steinmann, Z.J.N.; Elshout, P.M.F.M.; Stam, G.; Verones, F.; Vieira, M.D.M. ReCiPe 2016. Natl. Inst. Public Health Environ. 2016, 194. [Google Scholar] [CrossRef]
  119. Hauschild, M.Z.; Rosenbaum, R.K.; Olsen, S. Life Cycle Assessment; Springer: Berlin/Heidelberg, Germany, 2018. [Google Scholar]
  120. Jolliet, O.; Müller-Wenk, R.; Bare, J.; Brent, A.; Goedkoop, M.; Heijungs, R. The LCIA midpoint-damage framework of the UNEP/SETAC life cycle initiative. Int. J. Life Cycle Assess. 2004, 9, 394. [Google Scholar] [CrossRef] [Green Version]
  121. Bare, J.C.; Hofstetter, P.; Pennington, D.W.; De Haes, H.A.U. Midpoints versus endpoints: The sacrifices and benefits. Int. J. Life Cycle Assess. 2000, 5, 319. [Google Scholar] [CrossRef] [Green Version]
  122. Elektromobilität, N.P. Ladeinfrastruktur für Elektrofahrzeuge in Deutschland: Statusbericht und Handlungsempfehlungen; Nationale Plattform Elektromobilität (NPE): Berlin, Germany, 2015. [Google Scholar]
  123. Funke, S.Á. Techno-Ökonomische Gesamtbewertung Heterogener Maßnahmen zur Verlängerung der Tagesreichweite von Batterieelektrischen Fahrzeugen. Ph.D. Thesis, Universität Kassel, Kassel, Germany, 2018. [Google Scholar]
  124. Mathieu, G. Design of an On-Board Charger for Plug-In Hybrid Electrical Vehicle (PHEV). Master’s Thesis, Chalmers University of Technology, Gothenburg, Sweden, 2009. [Google Scholar]
  125. Hischier, R.; Classen, M.; Lehmann, M.; Scharnhorst, W. Life Cycle Inventories of Electric and Electronic Equipment: Production, Use and Disposal; Final Report Ecoinvent Data v2.0; Swiss Centre for Life Cycle Inventories: Dübendorf, Switzerland, 2007. [Google Scholar] [CrossRef]
  126. Austerlitz Electronic GmbH. Data Sheet: Heatsinks. 2018. Available online: http://austerlitz-electronic.de/katalog/Austerlitz_Katalog-13_DE-EN.pdf (accessed on 5 December 2020).
  127. MENNEKES Elektrotechnik GmbH & Co. KG. Data Sheet: Basic 3,7, Basic 11, Basic 22, Basic S 22. 2013. Available online: https://datatransfer.chargeupyourday.de/Graphics/XPic9/00039836_0.pdf (accessed on 5 December 2020).
  128. Klaus Faber, A.G. Data Sheet: Power Cable NYY-J/-O. 2020. Available online: https://www.faberkabel.de/upload/files/downloads/204/2017_faber_katalog.pdf (accessed on 5 December 2020).
  129. Charge-ON GmbH. Data Sheet: E.ON Ladestation Fast. Available online: https://www.eon-drive.de/content/dam/eon-emobility-de/Playground/PDFs/Datasheets/Fast_Datenblatt.pdf (accessed on 5 December 2020).
  130. Fine Tubes Ltd. Data Sheet: Stainless Steel Alloys 304/304L. 2018. Available online: https://www.finetubes.co.uk/-/media/ametekfinetubes/files/downloads/alloy%20data%20sheets/stainless%20steel%20-%20alloys%20304%20and%20304l.pdf?utm_source=&utm_medium=undefined (accessed on 5 December 2020).
  131. Classen, M.; Althaus, H.-J.; Blaser, S.; Tuchschmid, M.; Jungbluth, N.; Doka, G. Life Cycle Inventories of Metals; Final Report Ecoinvent Data v2.1 No.10; Swiss Centre for Life Cycle Inventories: Dübendorf, Switzerland, 2009. [Google Scholar]
Figure 1. Overview of the modeled systems. Abbreviations: OBC—On-board charger; OfBC—Off-board charger; PCB—printed circuit board.
Energies 13 06508 g001
Figure 2. Percentage share of the electronic components for the modeled 22 kW charger per kWh.
Energies 13 06508 g002
Figure 3. Comparison of the environmental impacts of the AC system and DC system. The environmental impacts of the AC system are scaled to 100%.
Energies 13 06508 g003
Figure 4. Mineral resource depletion (a), natural land transformation (b), and photochemical oxidant formation (c) for AC system and DC system per kWh.
Energies 13 06508 g004
Figure 5. Human toxicity (a) and climate change (b) for AC system and DC system per kWh.
Energies 13 06508 g005
Figure 6. Results per kWh for sensitivity analyses of the emission intensity of the production of power electronics exemplary for (a) mineral resource depletion; (b) natural land transformation; (c) photochemical oxidant building; and (d) climate change.
Energies 13 06508 g006
Figure 7. Results per kWh for sensitivity analyses of the degree of utilization (a) human toxicity; (b) mineral resource depletion; (c) terrestrial ecotoxicity; and (d) climate change.
Energies 13 06508 g007
Figure 8. Results per kWh for sensitivity analyses of the efficiency for (a) agricultural land occupation; (b) freshwater ecotoxicity; (c) ionizing radiation; and (d) water depletion.
Energies 13 06508 g008
Figure 9. Results per kWh for sensitivity analyses of the ratio of home charging for (a) mineral resource depletion; (b) photochemical oxidant formatting; (c) natural land transformation; (d) climate change.
Energies 13 06508 g009
Figure 10. Cost estimation AC system and DC system.
Energies 13 06508 g010
Table 1. General scaling of components.
AC SystemDC System
22 kW OBC22 kW CIS50 kW OfBC50 kW CIS3.7 kW OBC
Number of BEVsxx
Amount of charging infrastructure 1xxx
1 charging infrastructure can rather be a charging station or a charging point.
Table 2. Number of charging points and charging stations in the defined scenarios.
Scenario SScenario MScenario L
Vehicle stock 170,000220,000310,000
Number of public charging pointsAC system14,57918,86725,827
DC system6415830211,364
Number of public charging stationsAC system7290943412,914
DC system320741515682
Table 3. Components used to model filters.
ComponentManufacturerNotationRef.Number of Components
3.7 kW22 kW 150 kW 1
Coil
(mains side)
Fastron GroupTLC/10A-100M-00[76]248
Coil
(inverter side)
Fastron GroupTLC/10A-471M-00[76]24
Coil
(inverter side)
Fastron GroupTLC/10A-331M-00[76]8
CapacitorICARMKP-B1X-8-48[77]246
1 The number of components stated for the 22 kW and 50 kW charger is for each phase.
Table 4. Components used for the modeled AC-DC converter.
ComponentManufacturerNotationRef.Number of Components
3.7 kW22 kW 150 kW 1
MOSFETInfineonIPW60R045CP[78]224
DiodeInfineonIDW40G65C5B[79]6612
CapacitorMurataKC355WD72J474MH01#[80]224
CoilEpcosEELP 58 Core[81]224
1 The number of components stated for the 22 kW and 50 kW charger is for each phase. AC: alternating current, DC: direct current.
Table 5. Components used for the modeled DC-DC converter.
ComponentManufacturerNotationRef.Number of Components
3.7 kW22 kW 150 kW 1
MOSFETInfineonIPW65R045C7[84]4820
DiodeInfineonIDW40G65C5B[79]4820
CapacitorMurataKC355WD72J474MH01#[80]2410
CoilEpcosEELP 64 Core[81]125
1 The number of components for the 22 kW and 50 kW charger is for each phase.
Table 6. Dimensioning charging stations.
UnitCharging Power in Kw
2250
DimensionsHeightm1.52
Widthm0.40.85
Depthm0.241
Table 7. Abbreviations and units for impact categories used.
Impact CategoryAbbreviationUnit
Water depletionWDm3
Urban land occupationULOm2a
Terrestrial ecotoxicityTETkg 1,4-DCB-eq.
Terrestrial acidificationTAkg SO2-eq.
Photochemical oxidant formationPOFkg NMVOC
Particulate matter formationPMFkg PM10-eq.
Ozone depletionODkg CFC-11-eq.
Natural land transformationNLTm2
Mineral resource depletionMRDkg Fe-eq.
Marine eutrophicationMEkg N-eq.
Marine ecotoxicityMETkg 1,4-DCB-eq.
Ionizing radiationIRkg U235-eq.
Human toxicityHTkg 1,4-DCB-eq.
Freshwater eutrophicationFEkg P-eq.
Freshwater ecotoxicityFETkg 1,4-DCB-eq.
Fossil resource depletionFDkg oil-eq.
Climate changeCCkg CO2-eq.
Agricultural land occupationALOm2a
Table 8. Absolute reductions for selected environmental impact categories when comparing DC system and AC system for the modeled scenarios considering a lifetime of 10 years for all components.
Impact CategoryAbsolute Reductions
Scenario SScenario MScenario L
CC 1.95 10 8 2.52 10 8 3.45 10 8
HT 3.78 10 8 4.89 10 8 6.70 10 8
MRD 1.97 10 8 2.55 10 8 3.49 10 8
NLT 3.60 10 4 4.66 10 4 6.38 10 4
POF 1.07 10 6 1.39 10 6 1.90 10 6
Table 9. Parameter variation for sensitivity analysis.
ParameterOriginal ValueIntervalIterationsImpact On
Emission intensity of the production of power electronics100%[80%;120%]20Production
Degree of utilization10%[5%;25%]20Production
Efficiency90%[80%;100%]20Production and use phase
Ratio of charging at home/non-public charging70%[60%;80%]20Production and use phase
Table 10. Cost listing of the charging stations.
ParameterUnitSystem
Charging powerkW2250
Charging points (for each charging station)Pieces22
HardwareEUR25003000
Grid connection costEUR200010,000
Permission and planningEUR10003000
Montage, construction cost and signageEUR20007000
Total investment costEUR750050,000
Current costEUR/a7503000
Interest rate%55
Life spana1010
Reference: based on [61,122,123].
Publisher’s Note: MDPI stays neutral with regard to jurisdictional claims in published maps and institutional affiliations.

