Introduction to the Dynamics of Heat Transfer in Buildings
Abstract
1. Introduction
2. Methodology
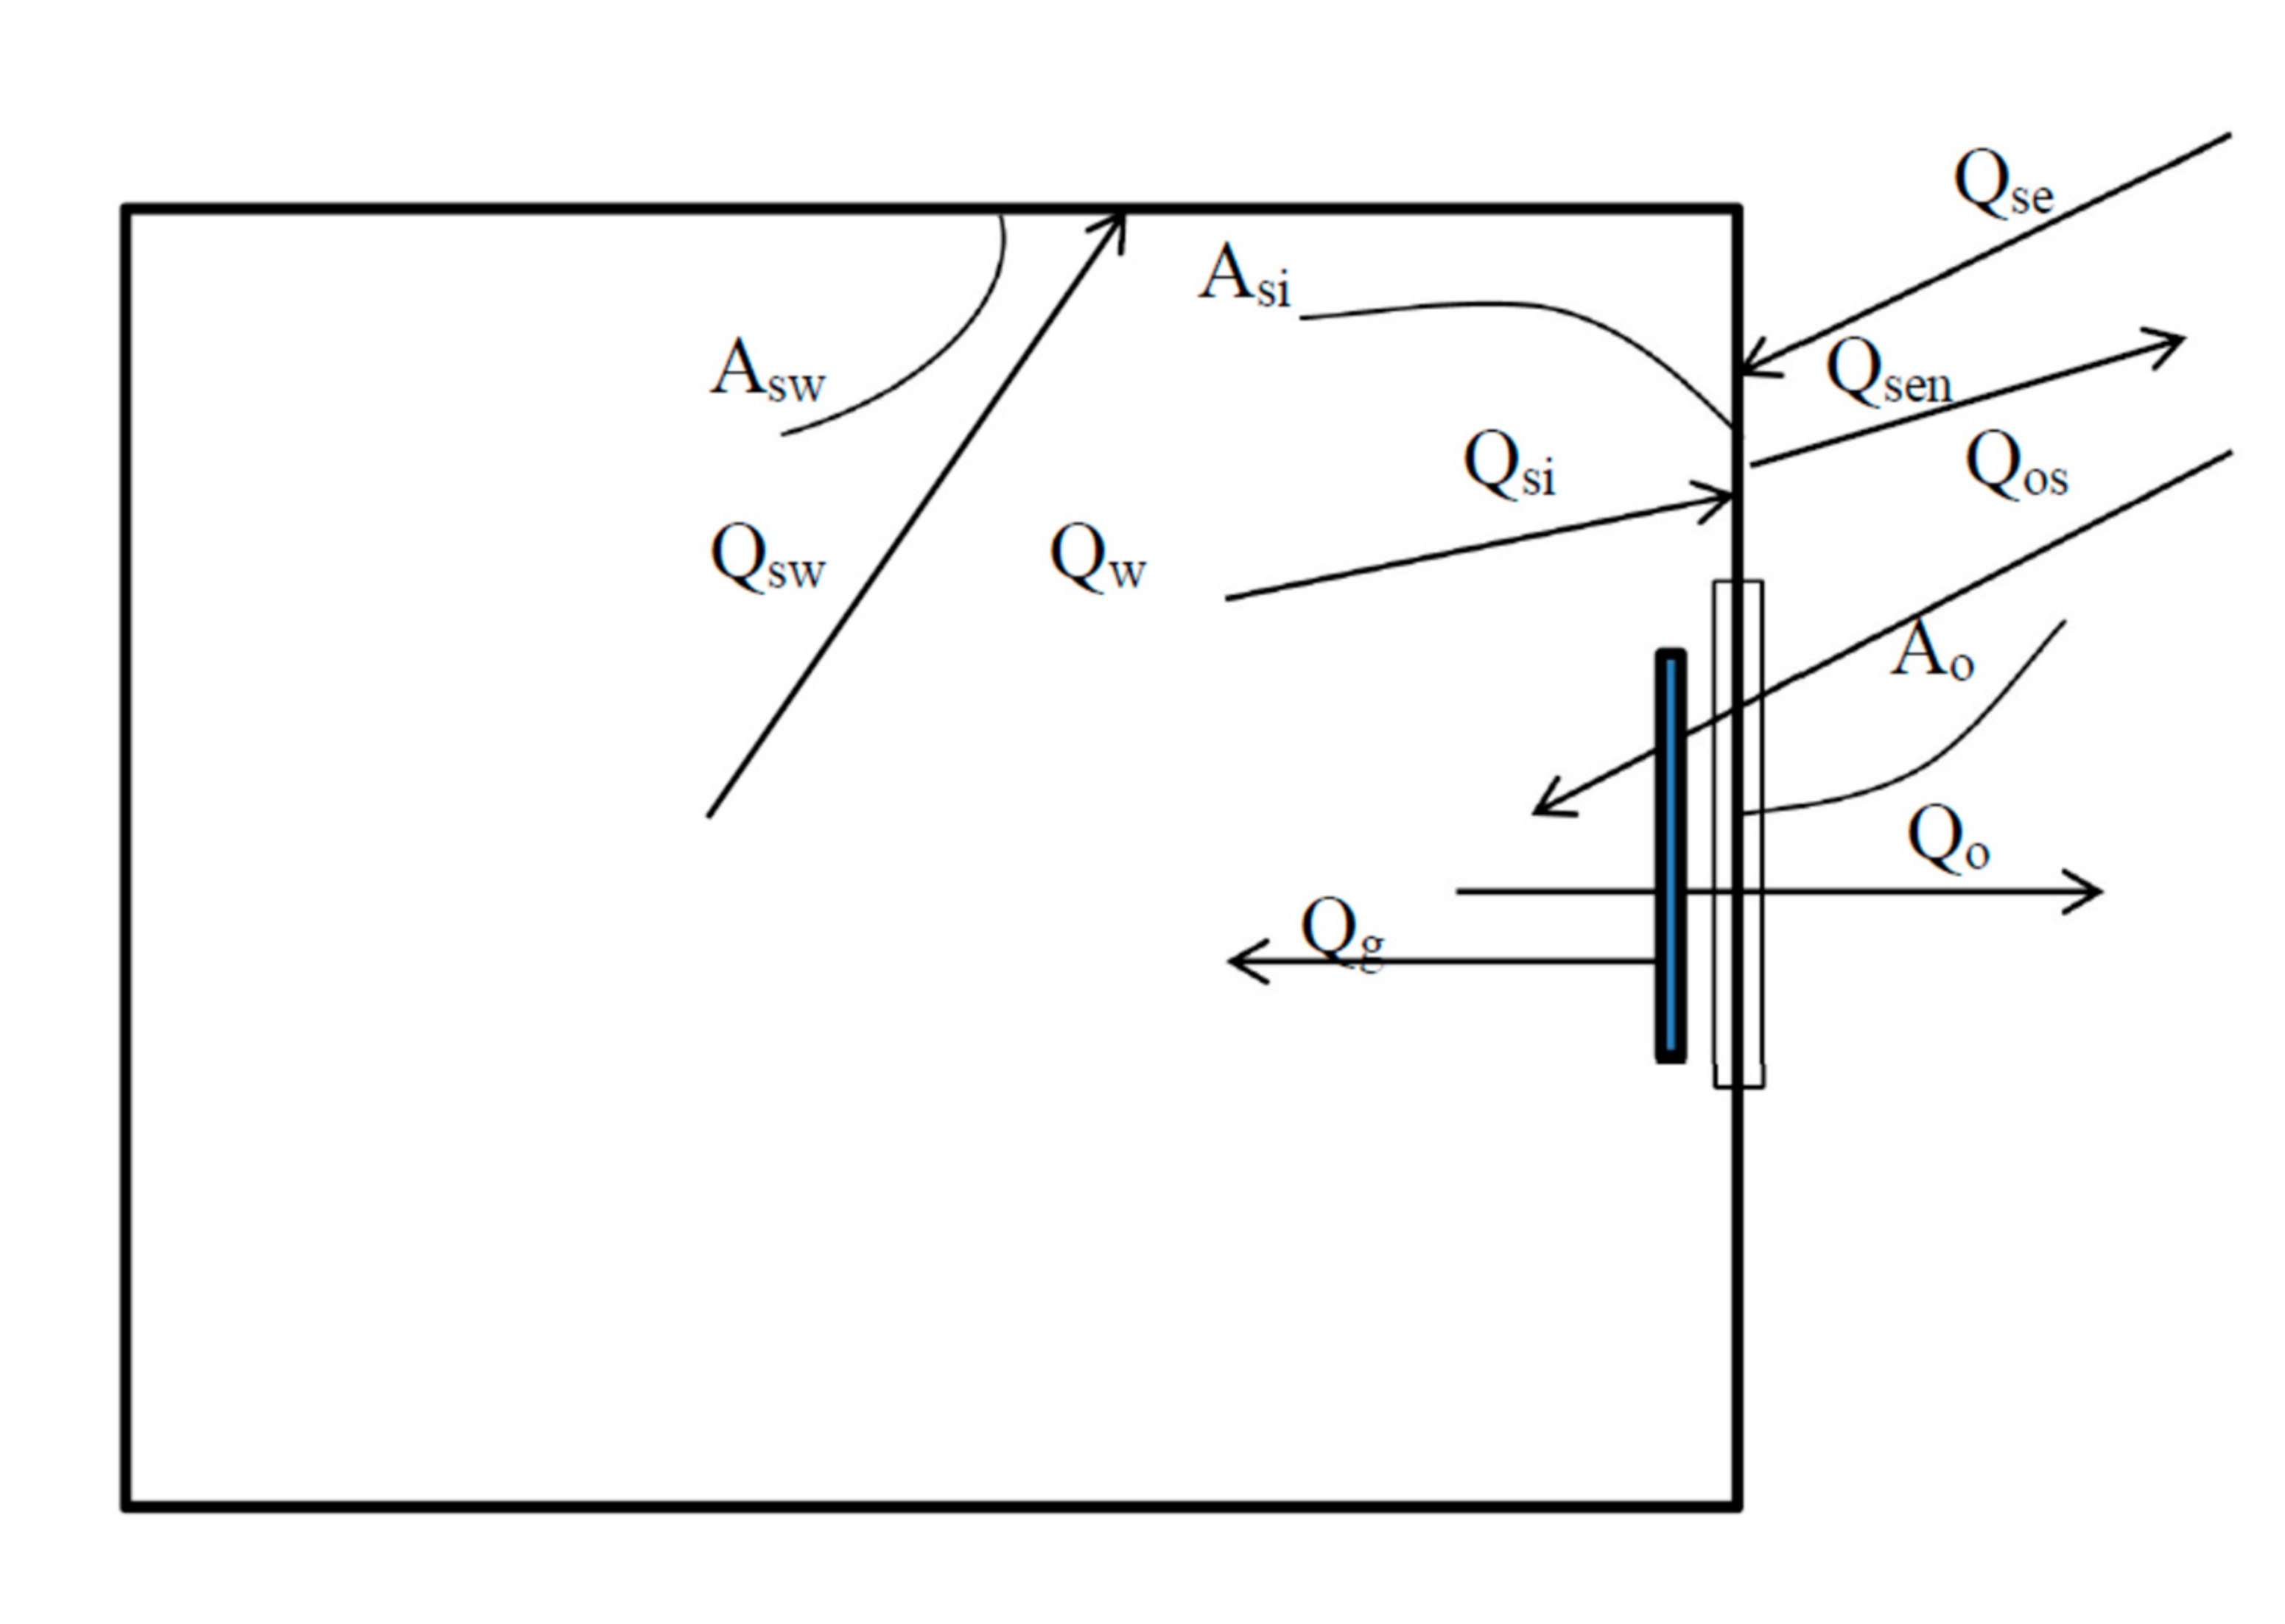
- –
- heating, QH,
- –
- the sun through non-transparent partitions, QSE,
- –
- the sun through transparent partitions, Qos,
- –
- permeating from adjacent rooms, Qiw,
- –
- people, Ql,
- –
- devices, Qu,
- –
- lighting, Qe
- –
- by penetrating through the external partitions Qsi,
- –
- by penetrating into adjacent Qsw rooms,
- –
- for QV ventilation.
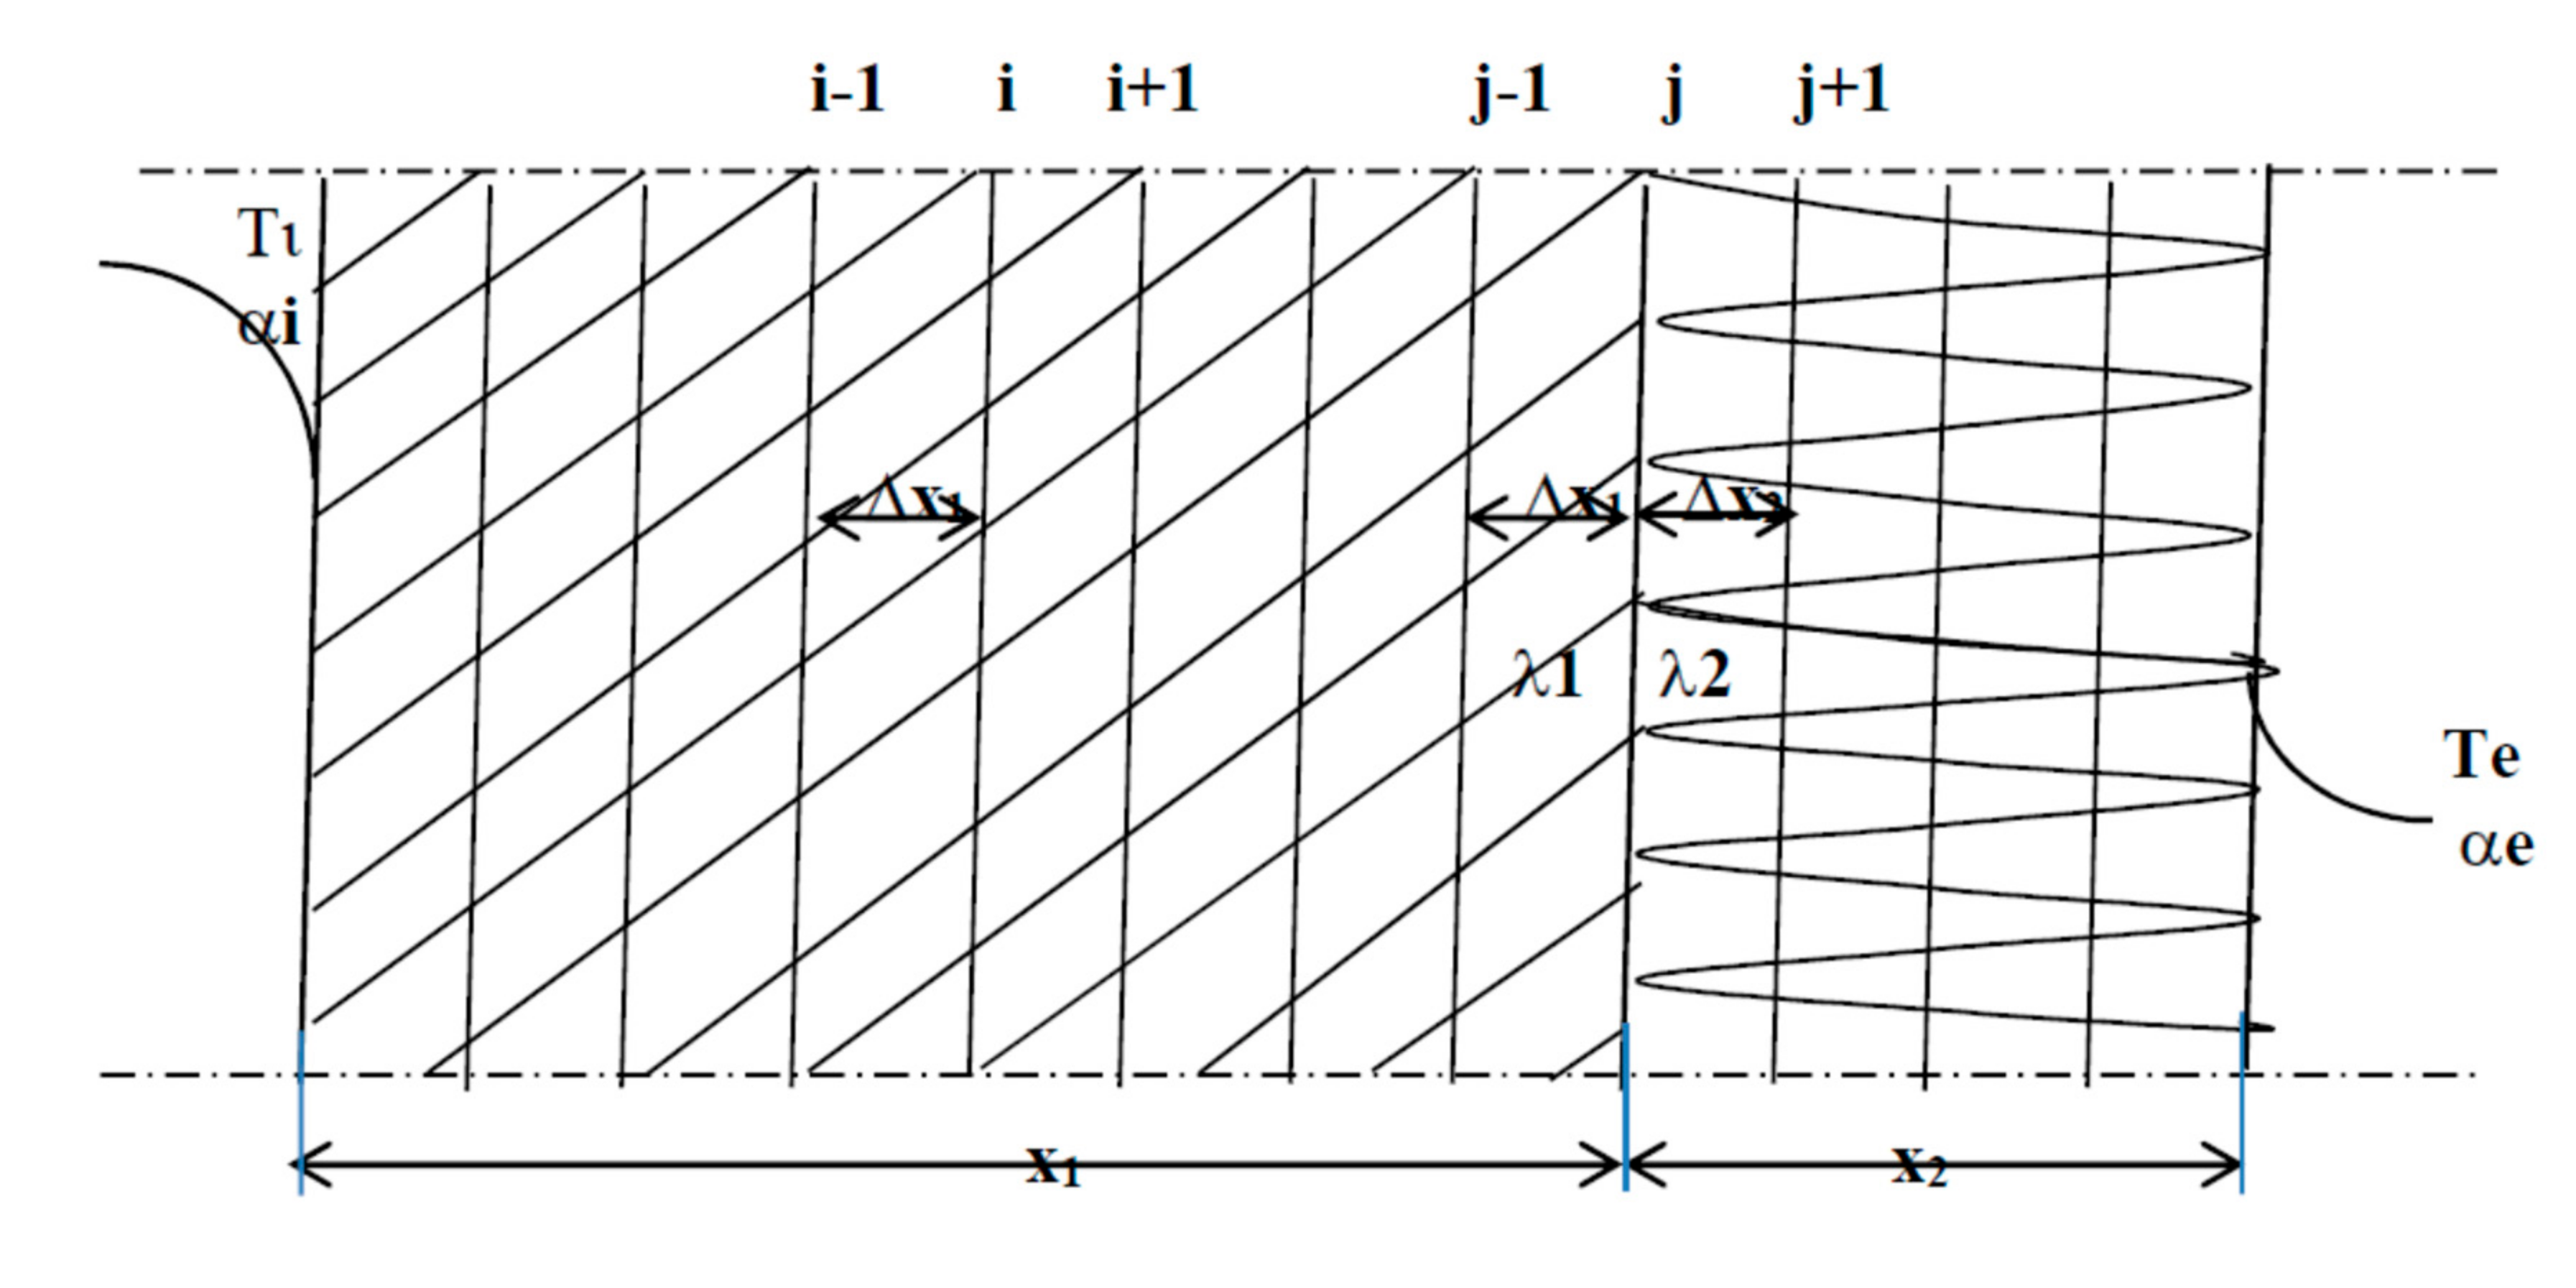
- αi—coefficient of heat transfer from the wall surface to the internal air,
- αe—heat transfer coefficient from the external wall surface to the outside air,
- Asi—the surface of the outer wall inside the room,
- Asw— the surface of the internal walls of the room,
- Ase—the outer surface of the outer wall,
- Af—reference surface (floors),
- Ao—window area,
- V—ventilation air stream,
- qA—indicator of internal heat sources,
- VVe—ventilation rate,
- z—shading coefficient,
- ws—radiation transmittance coefficient,
- σs = 5.67 × 10⁻⁸ [W/m2K4]—radiation constant,
- εsn—radiation absorption coefficient of the outer surface of the outer wall,
- εs—radiation emission coefficient of the outer surface of the outer wall,
- I—solar radiation intensity,
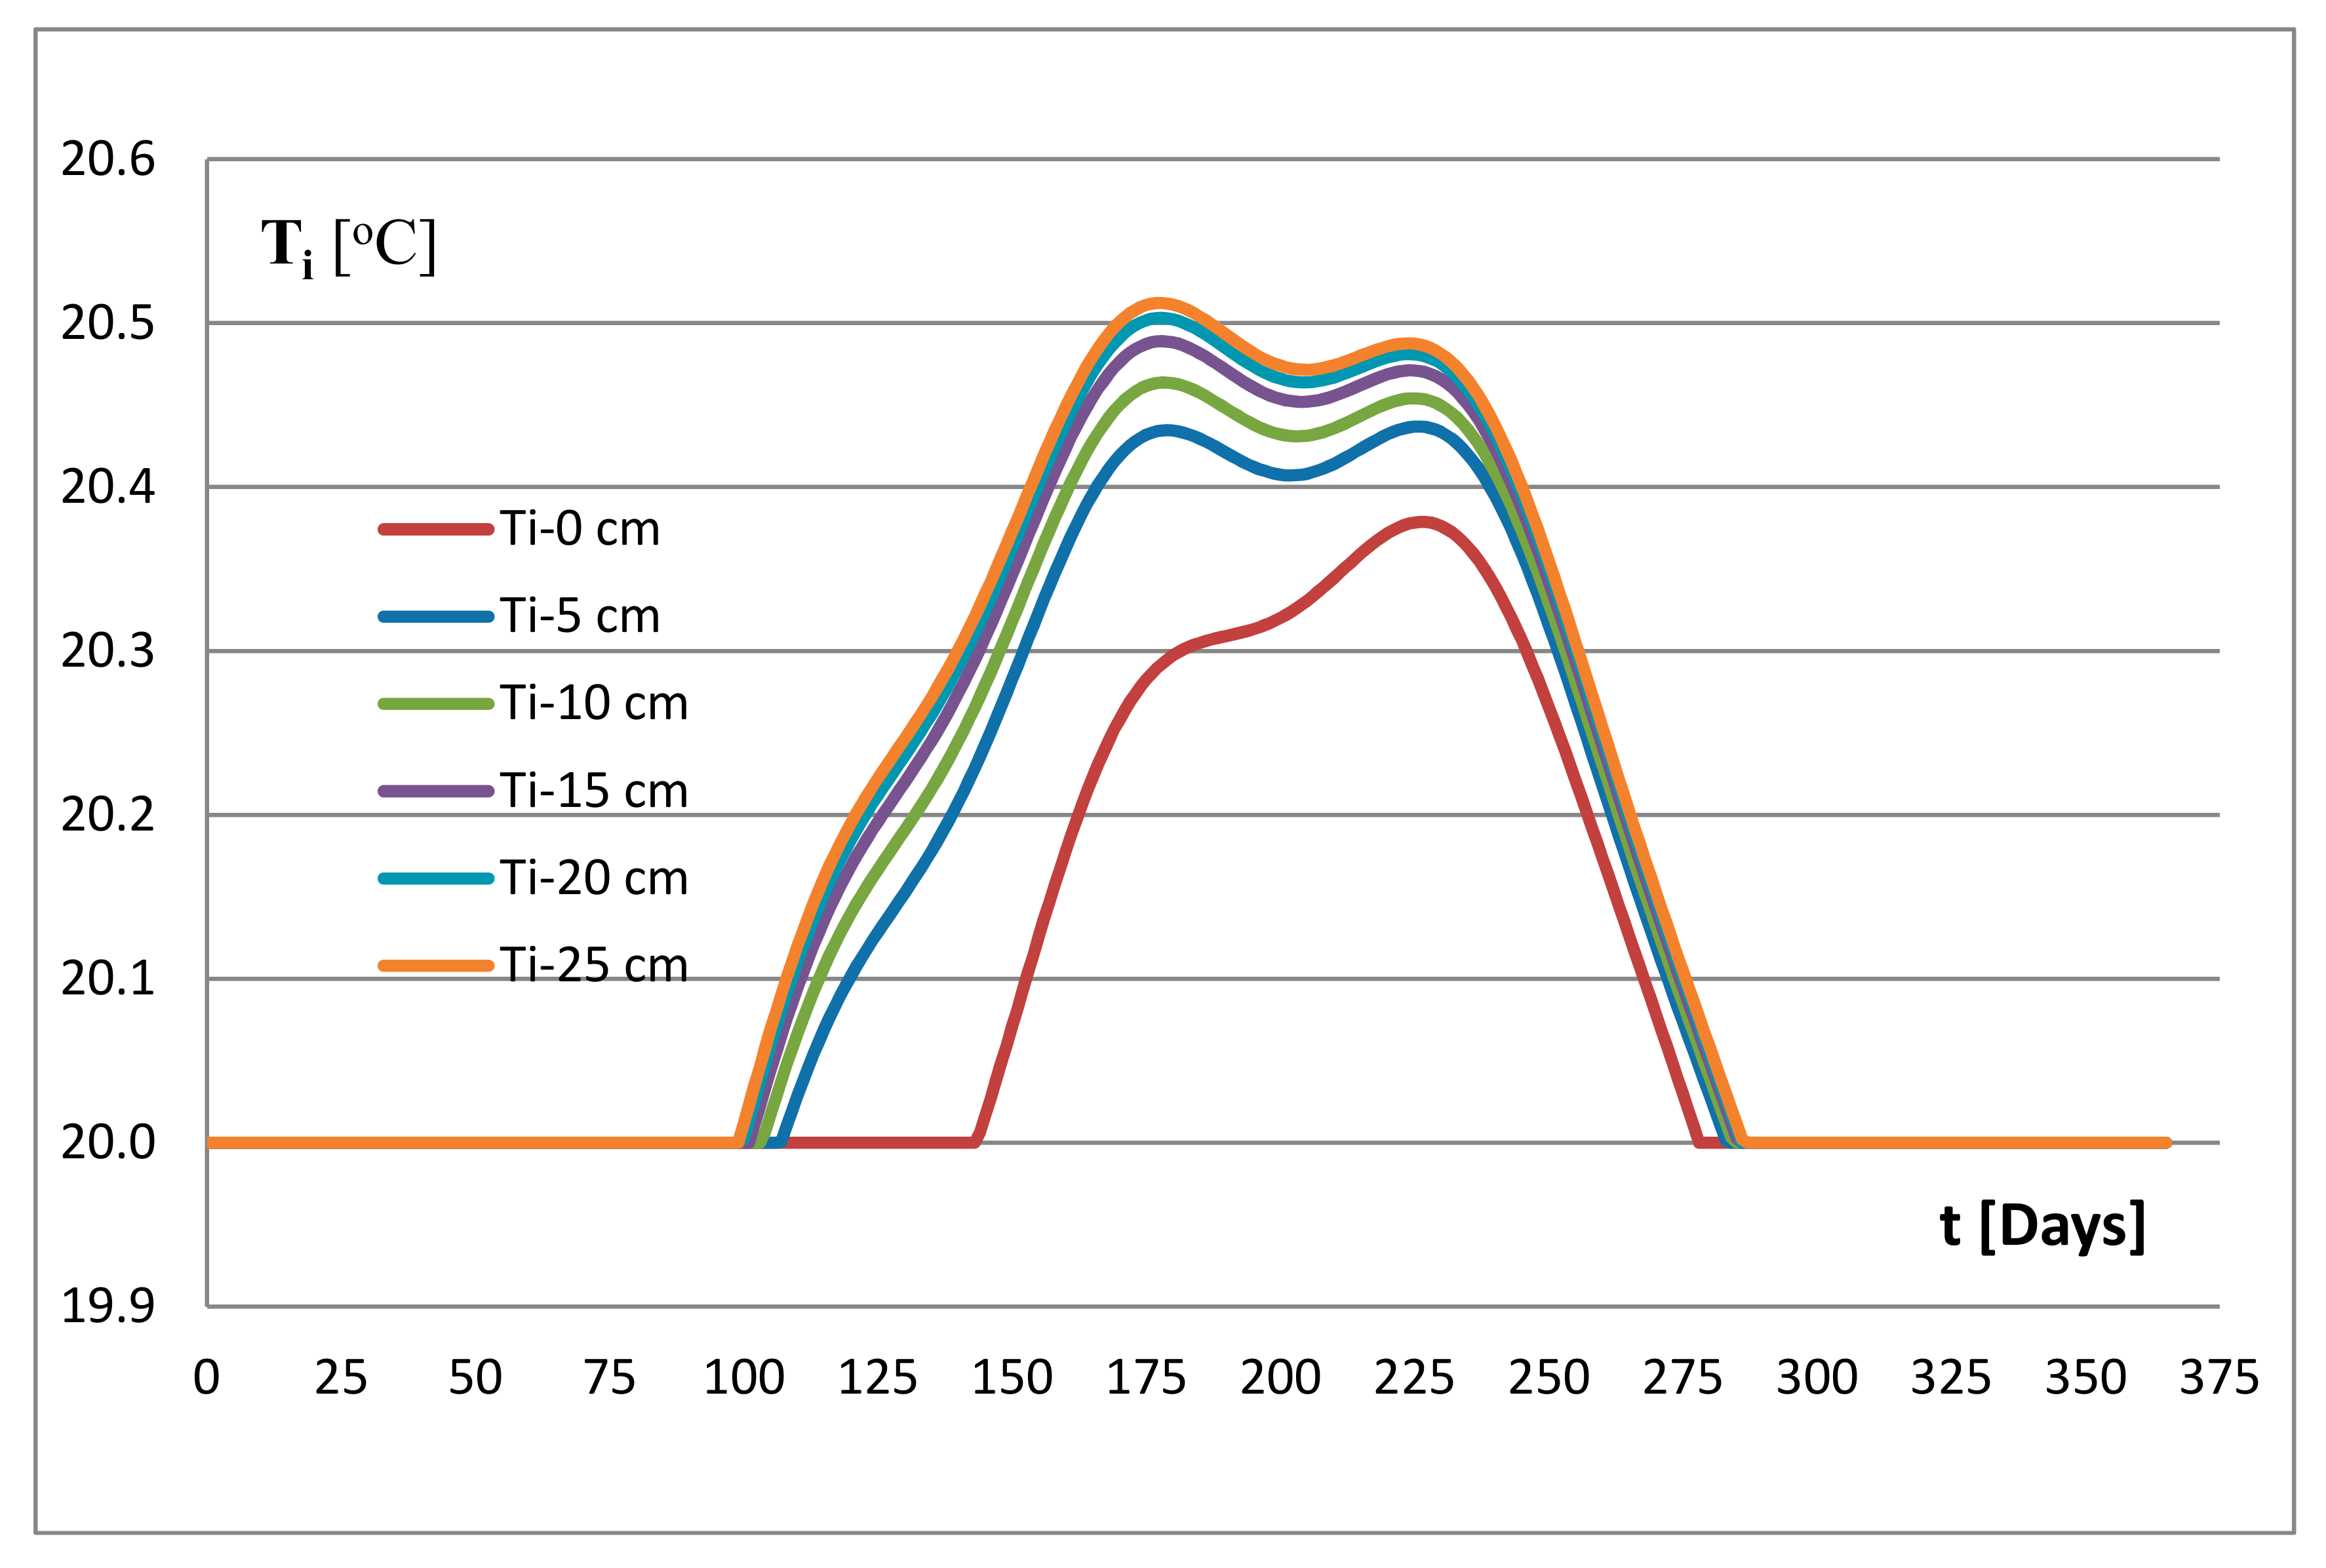
- Ti—internal air temperature,
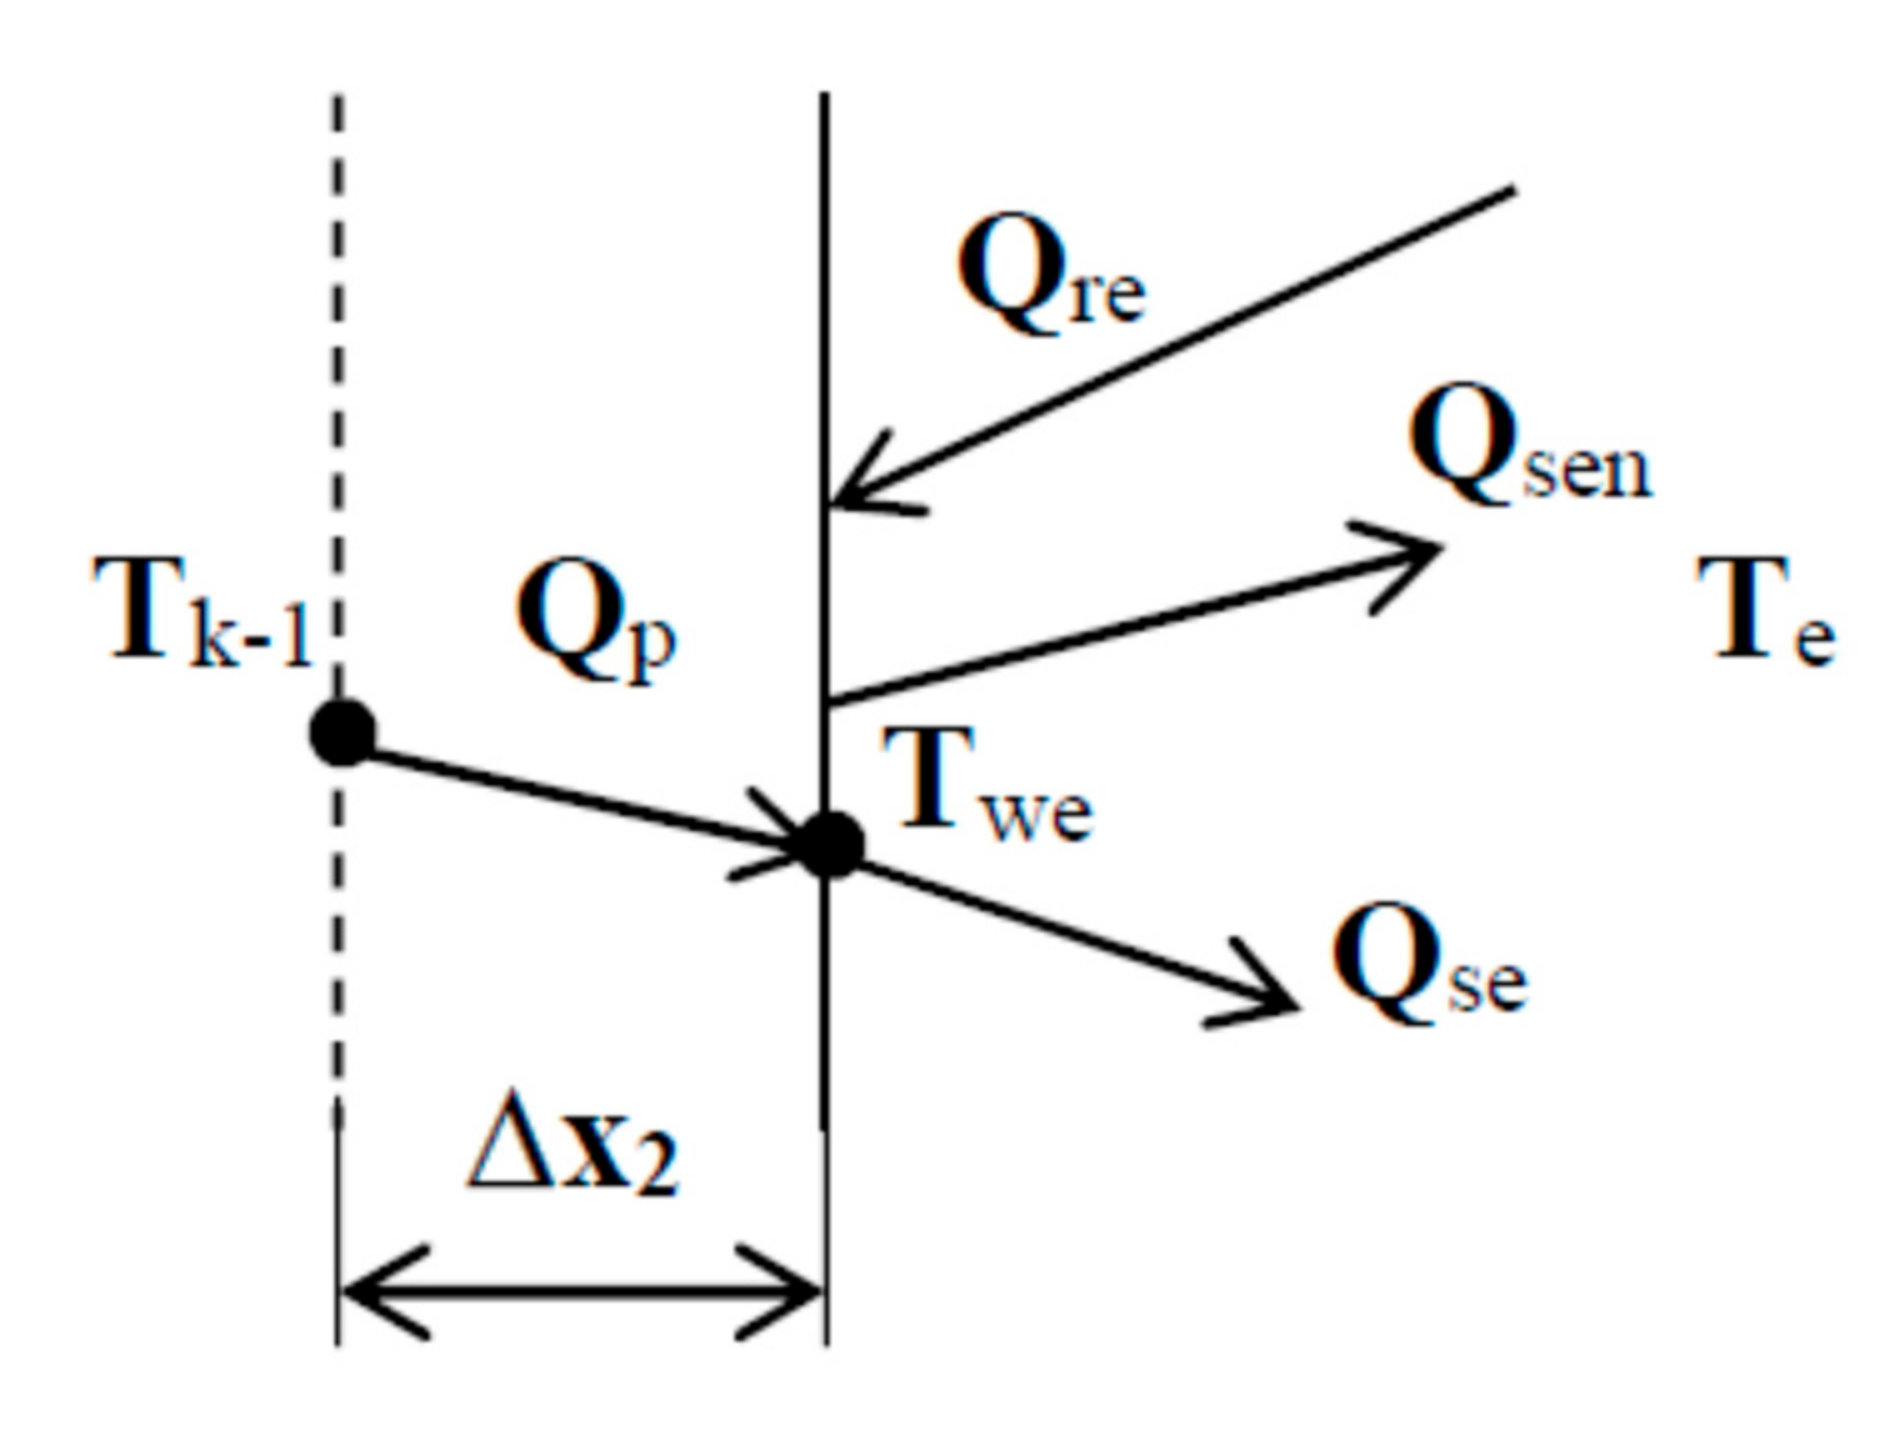
- Te—outside air temperature,
- Twi—temperature of the inner surface of the outer wall,
- Tsw—surface temperature of internal walls,
- Twe—external wall surface temperature,
- Tn—skyfall temperature.
- Tfo—amplitude of air temperature changes,
- t—time,
- ω—period of temperature changes,
- to—change period time,
- ν—frequency of changes,
- λ—thermal conductivity,
- a—thermal diffusivity of the area,
- α—coefficient of heat transfer from air to the surface.
3. Dynamics of Heat Transfer through an External Wall—Case Study
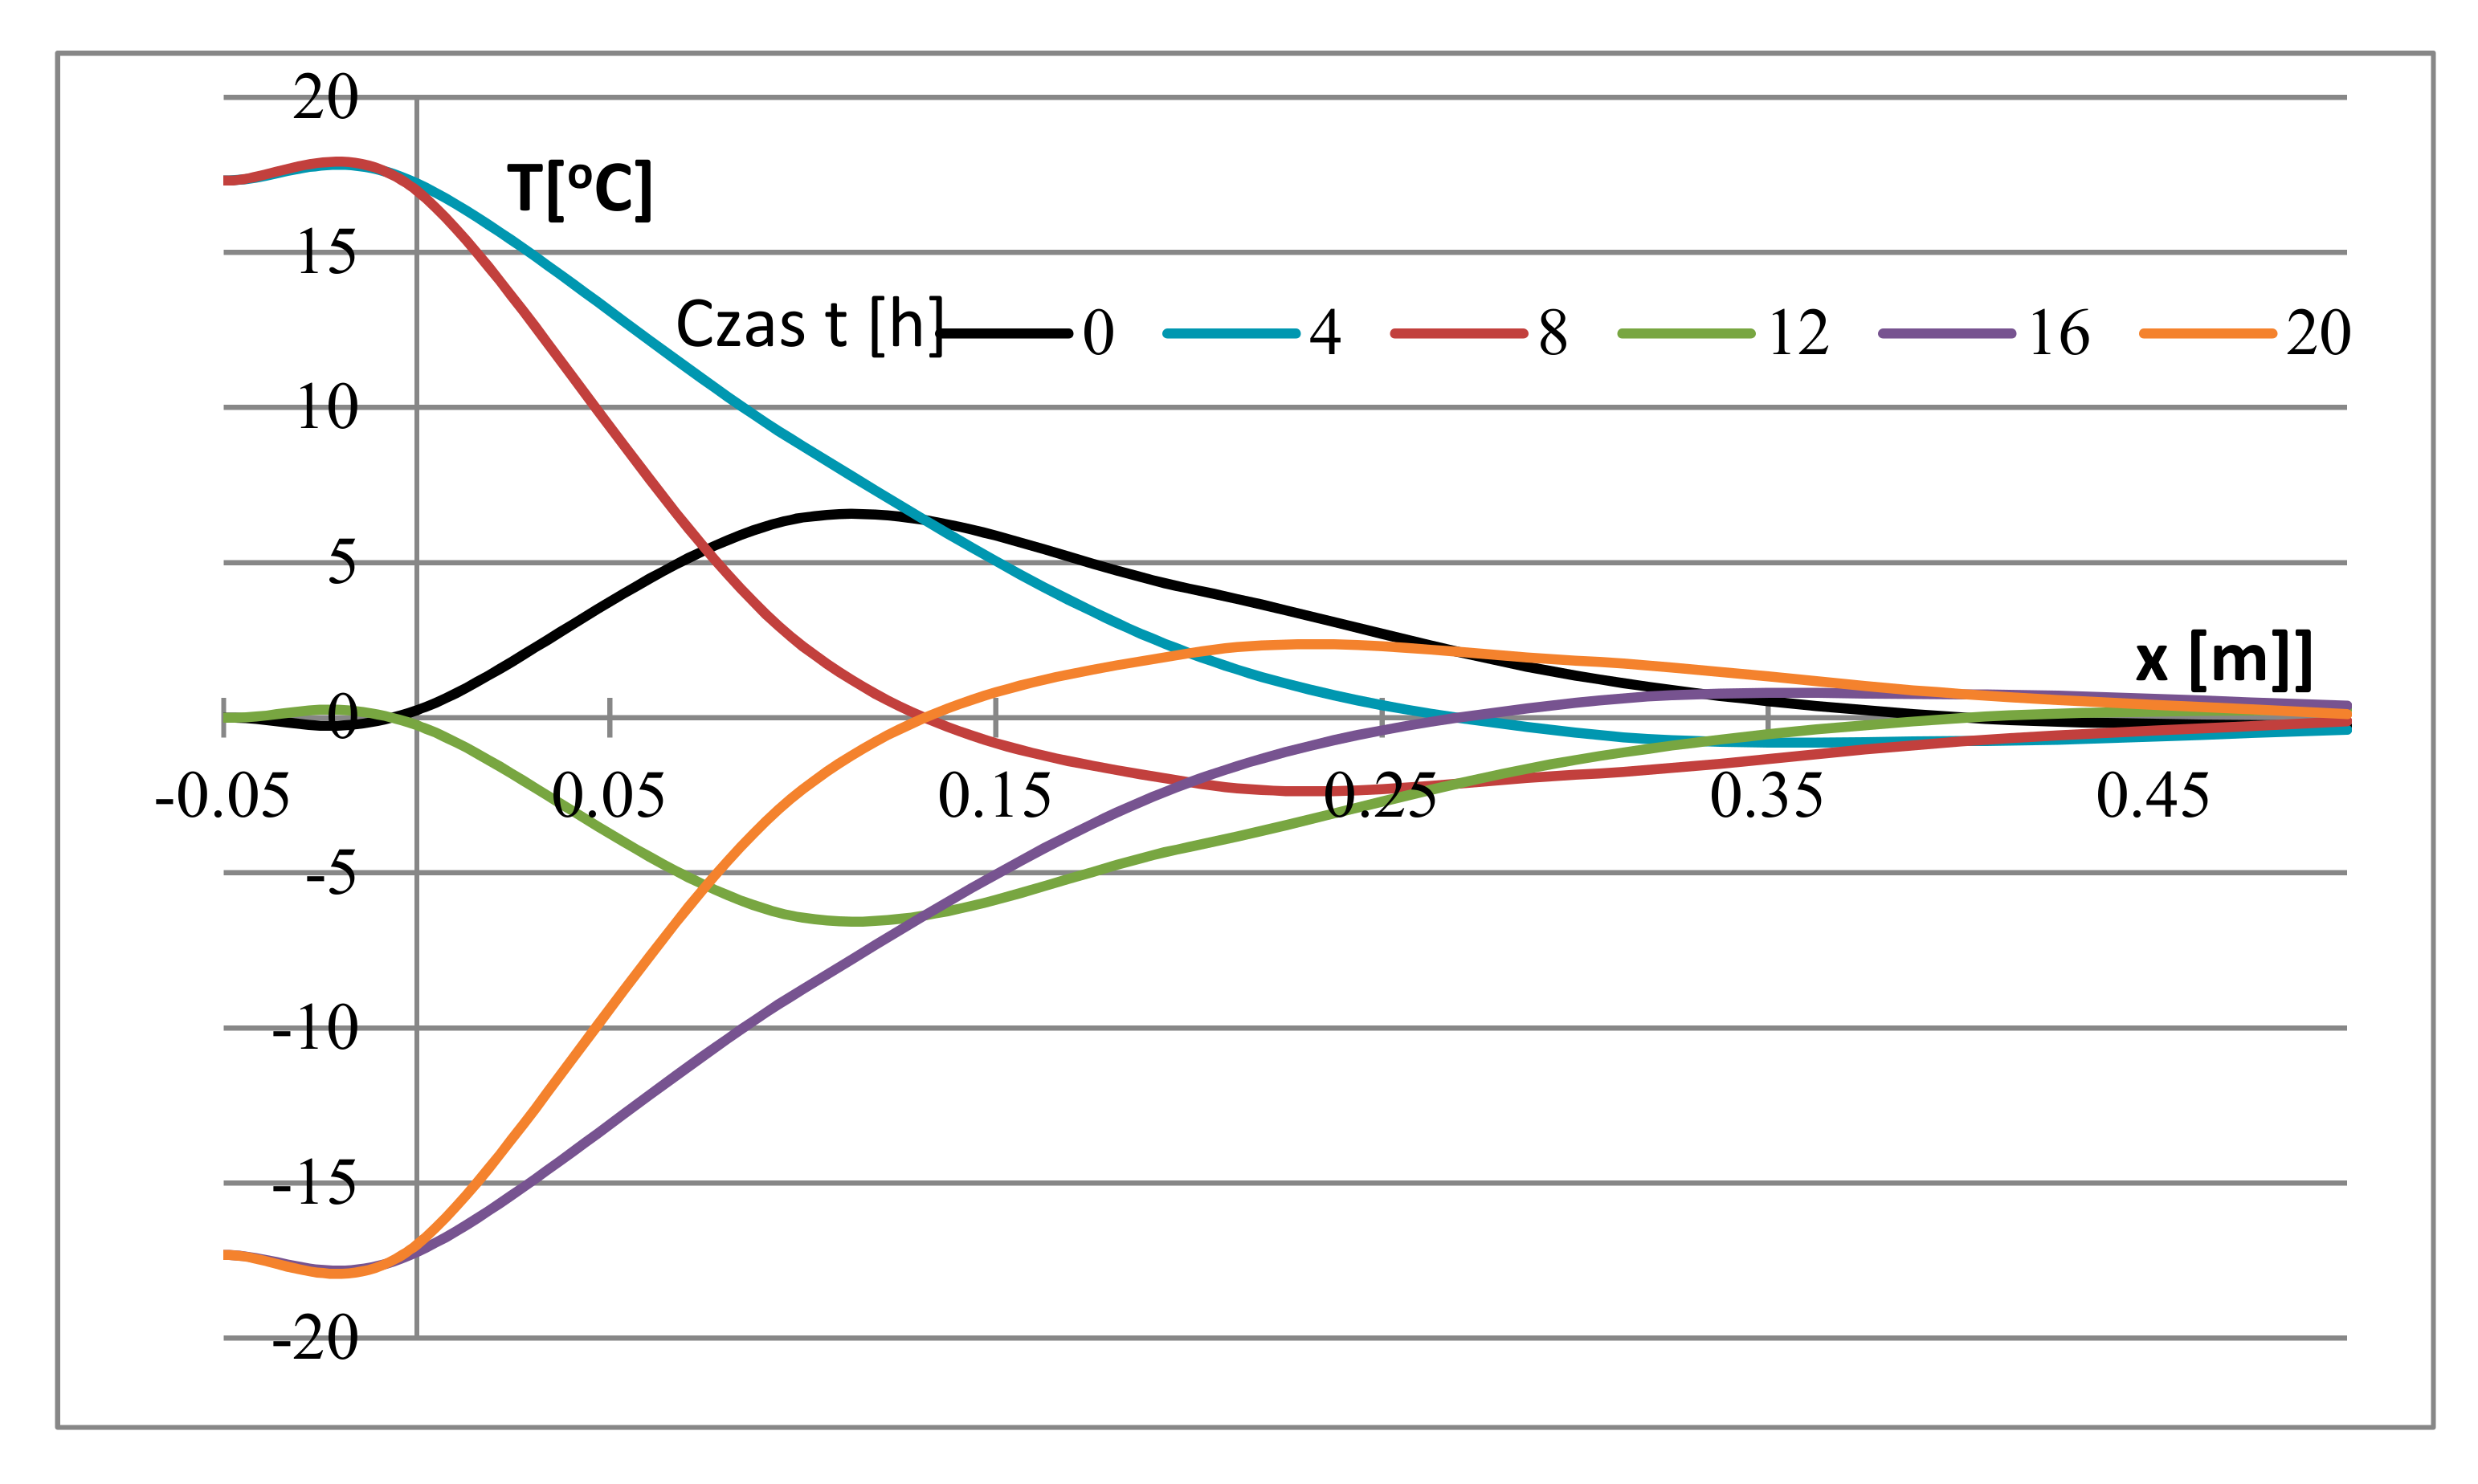
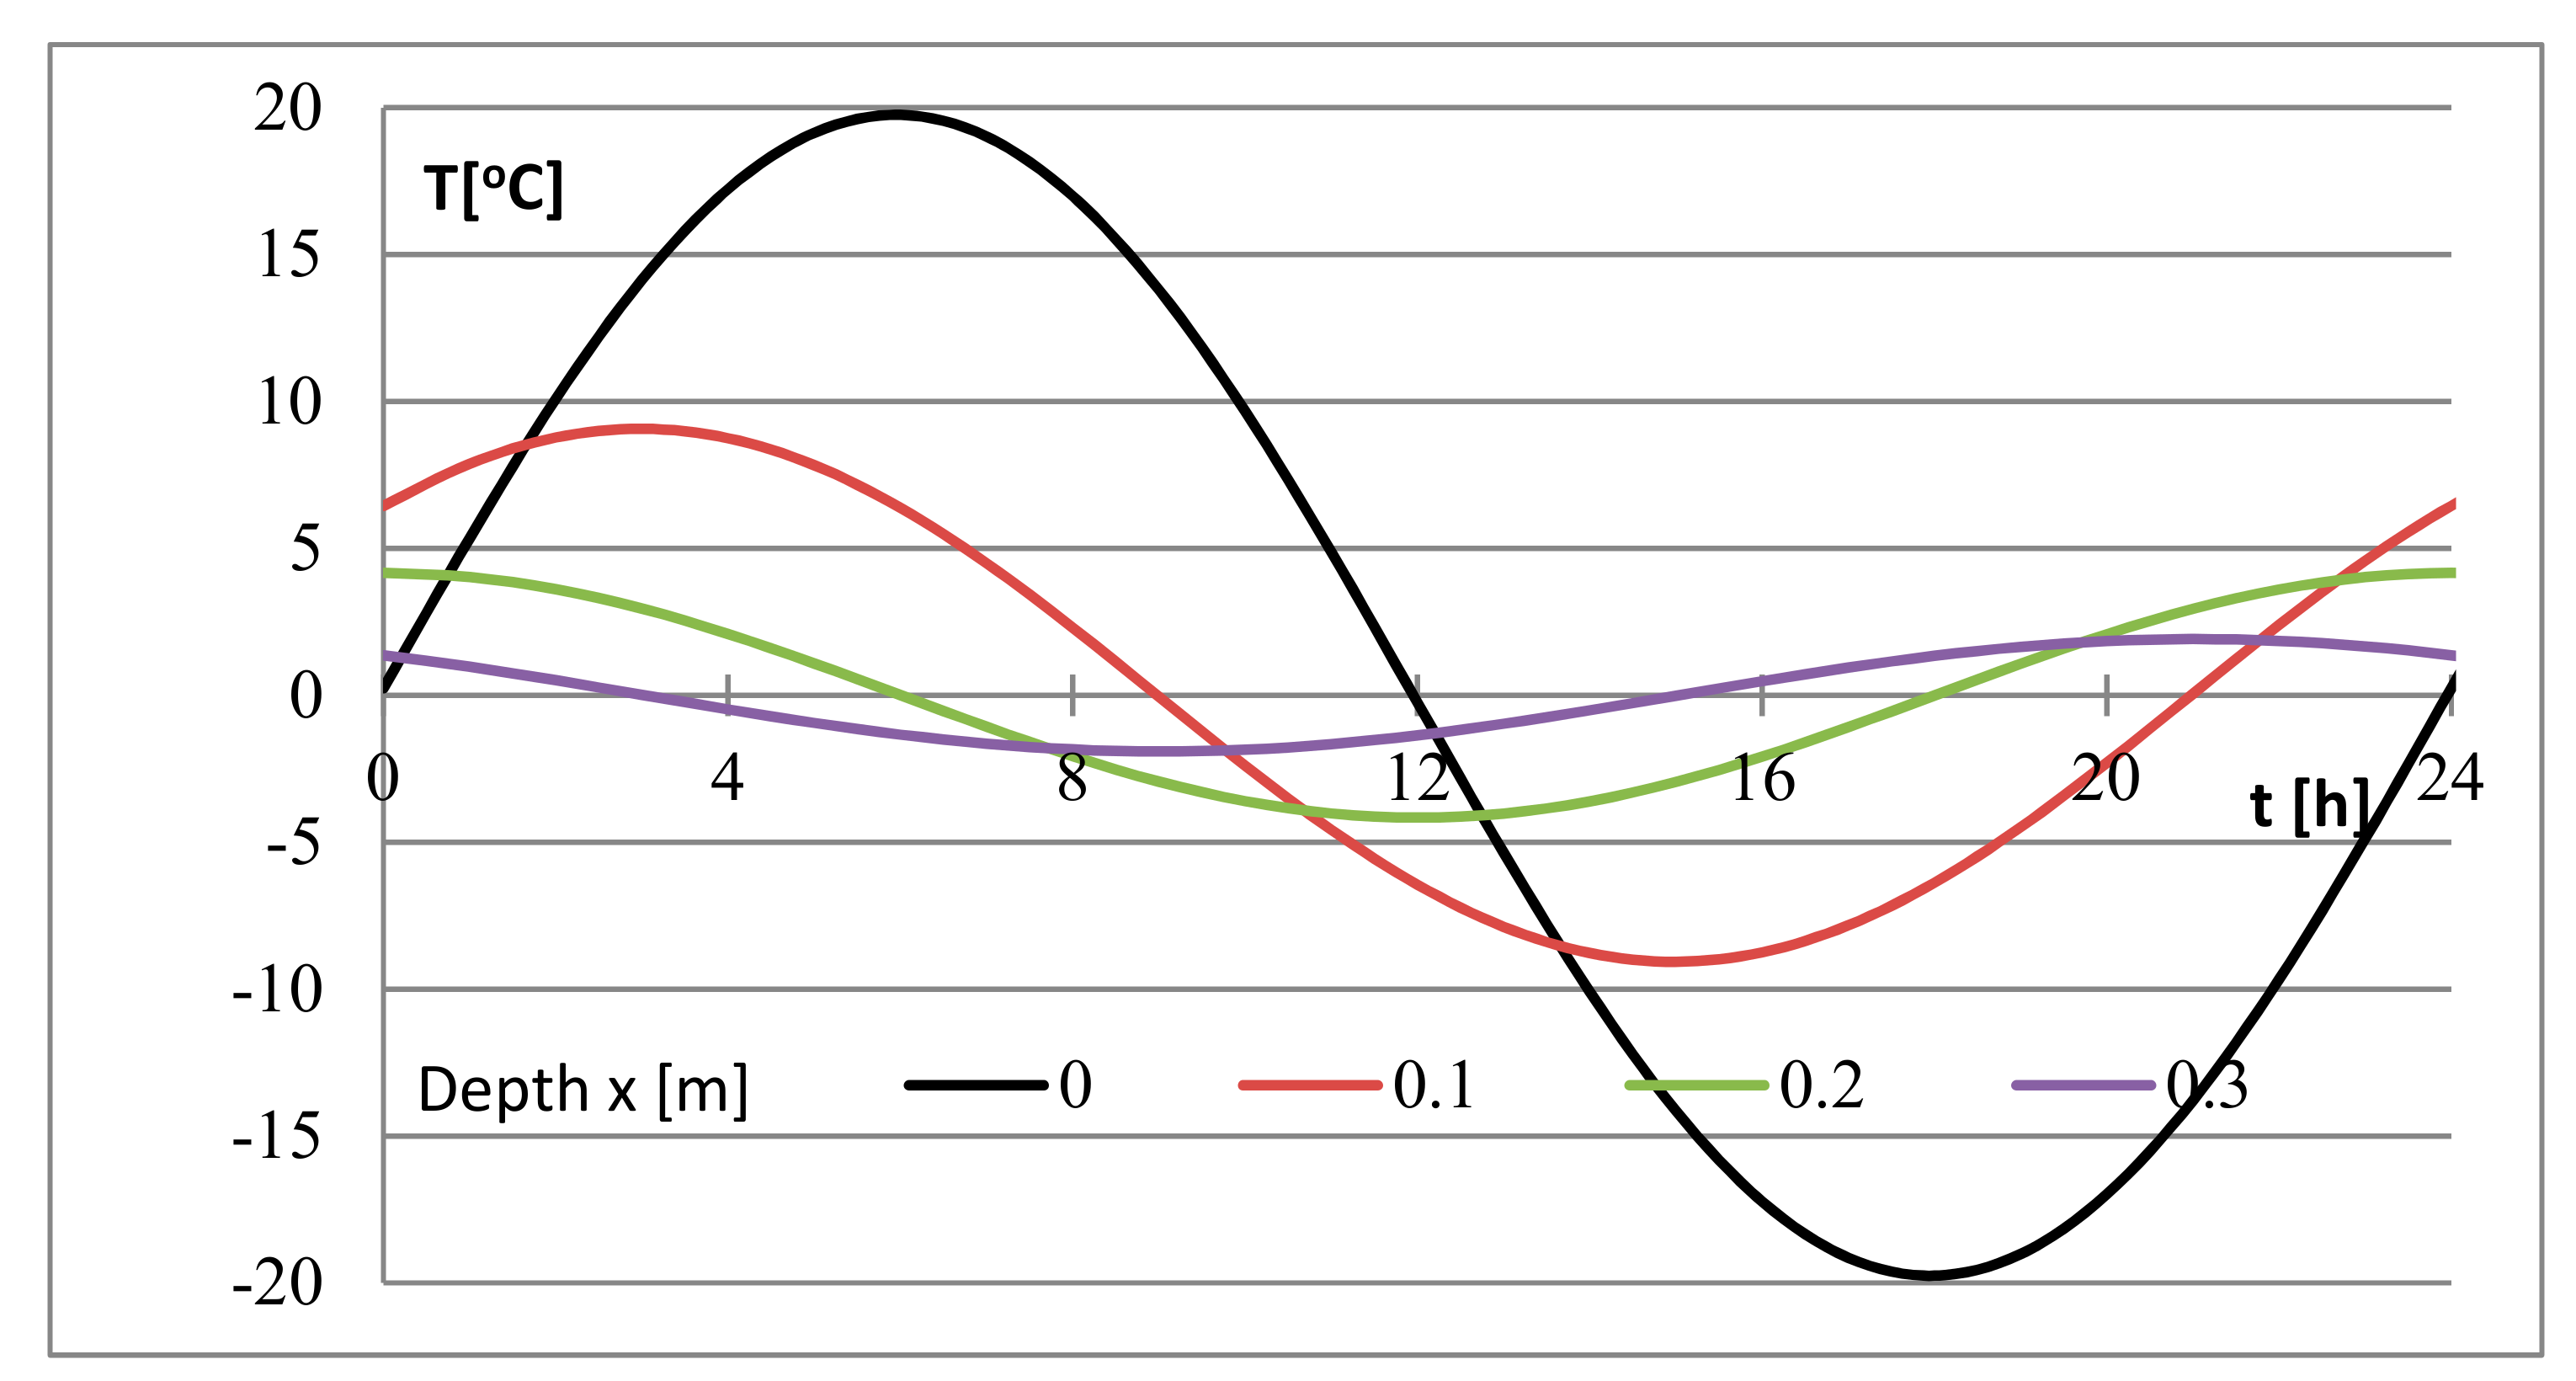
- Tfo = 20 °C,
- a = 0.485 × 10⁻⁶ m2/s,
- to = 24 h,
- α = 12 W/(m2·K),
- λ = 0.82 W/(m2·K).
- There are temperature oscillations in the material with the same period in each plane, but with a phase shift in relation to the surface.
- The amplitude of temperature changes on the surface is smaller than the amplitude of changes in air temperature (C1 < 1).
- There is a phase shift in temperature changes (C2 < 0).
- The amplitude of temperature changes in the material quickly decreases with depth.
- The lower the frequency of temperature changes, the greater the amplitudes at the same depth.
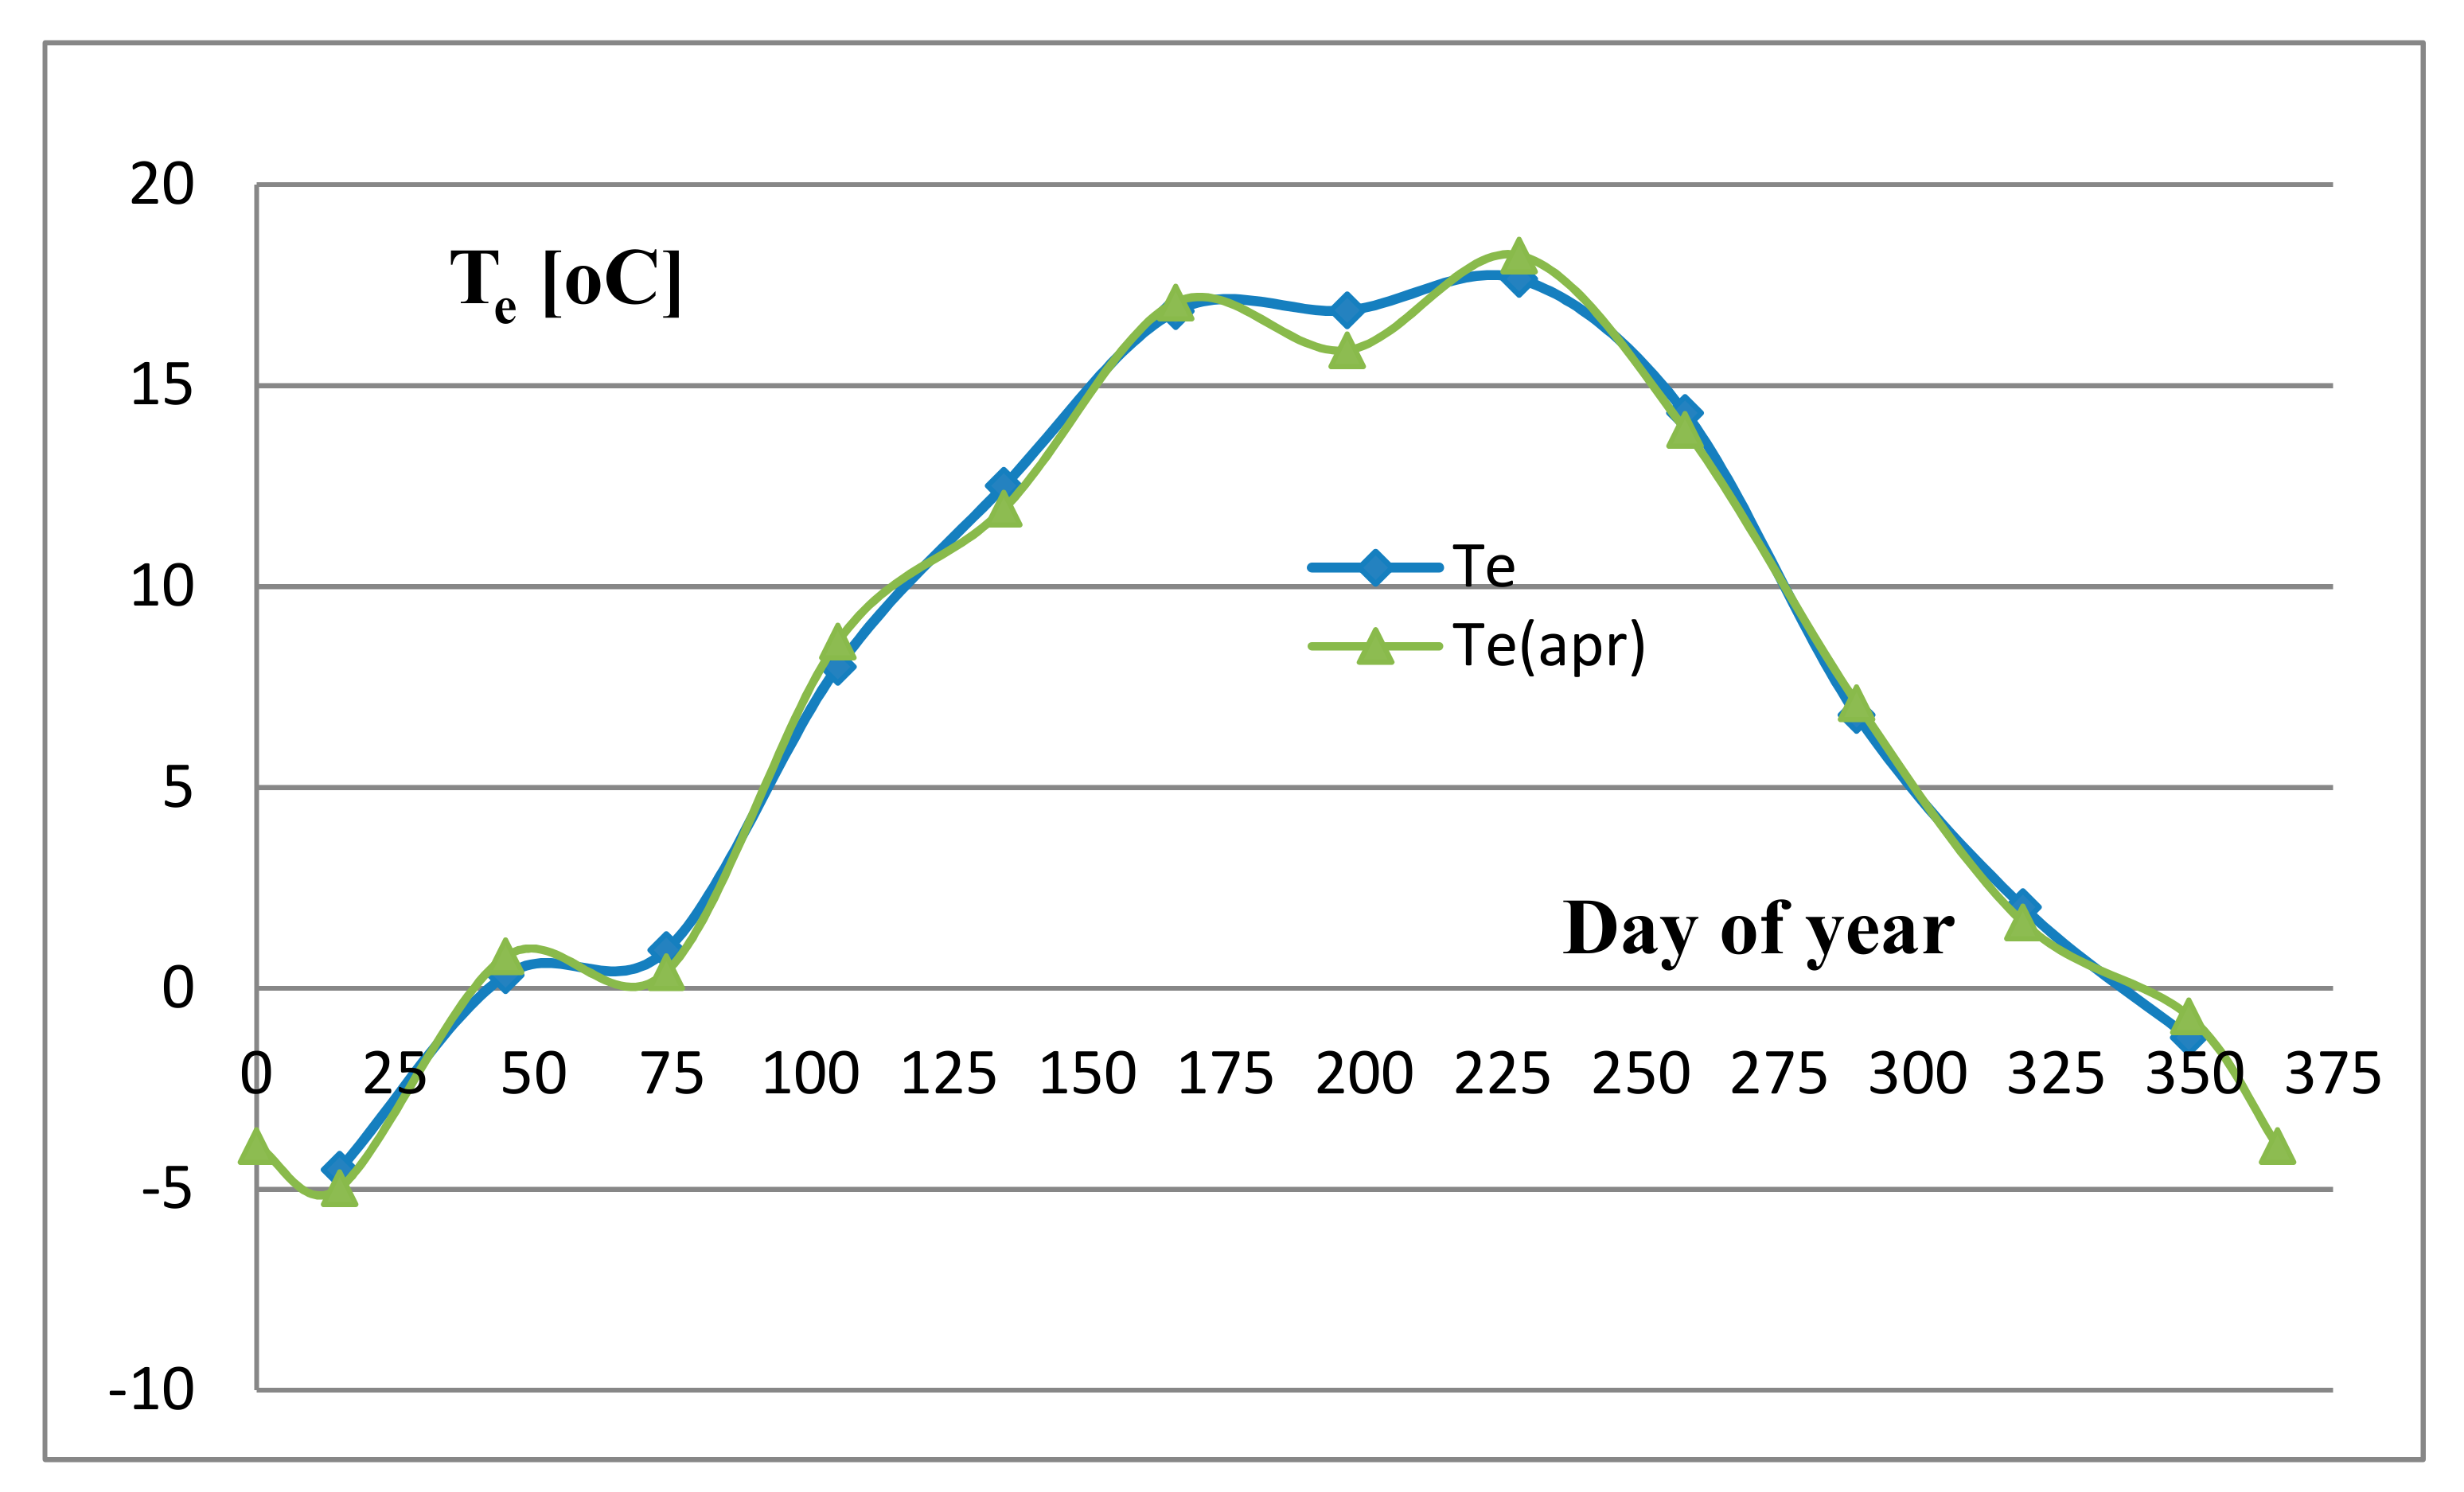
- Changes in outside air temperature are periodic, but a description of the changes with a simple cosine function would be a simplification.
- In addition to the transfer of heat between the outer surface and the air, there is a heat exchange by radiation (solar radiation).
- The outer wall is usually multi-layered and therefore heterogeneous.
4. Heat Losses through the External Wall—Case Study
- Tn—skyfall temperature
- σs = 5.67 × 10⁻⁸ [W/m2K4]—radiation constant
- εs—surface radiation absorption coefficient
- εsn—surface radiation emission coefficient
- αe—heat transfer coefficient from the external wall surface to the outside air
- λ2—thermal conductivity coefficient of the insulating layer
- Δx2—step of discretization of the insulating layer
- The heating season was assumed to occur during the period when the outside air temperature is lower than 12 °C (Te < 12 °C).
- If, during the heating season, the heat losses are greater than the heat gains, the heating control system maintains a constant internal temperature (Ti = Tio).
- If in the heating season the heat losses are lower than the heat gains, the control system switches the heating off and the internal temperature results from the thermal balance.
- Outside the heating season, the internal temperature results from the thermal balance.
5. Results and Discussion
5.1. Assumptions and Output Parameters
- A living room.
- The heat transfer coefficient on the inside and outside is constant in accordance with the standard [42].
- Natural ventilation with the intensity resulting from meeting the requirements of the standard [43].
- The thermal conductivity coefficient of the wall construction material and insulation is constant.
- Internal heat gains are constant.
- qA = 6.8 W/m2—single-family buildings,
- qA = 7.0 W/m2—multi-family buildings,
- VVe = 0.31 × 10⁻³ m3/(s’m2)—single-family buildings,
- VVe = 0.32 × 10⁻³ m3/(s’m2)—multi-family buildings.
- h—room height.
- λ1 = 0.82 W/mK (brick wall),
- λ2 = 0.032 W/mK (polystyrene insulation).
- a = 3.0 m—the width of the room,
- b = 4.0 m—room depth,
- h = 3.0 m—room height,
- Ao = 1.96 m2—window area.
5.2. Calculation of Indoor Air Temperature
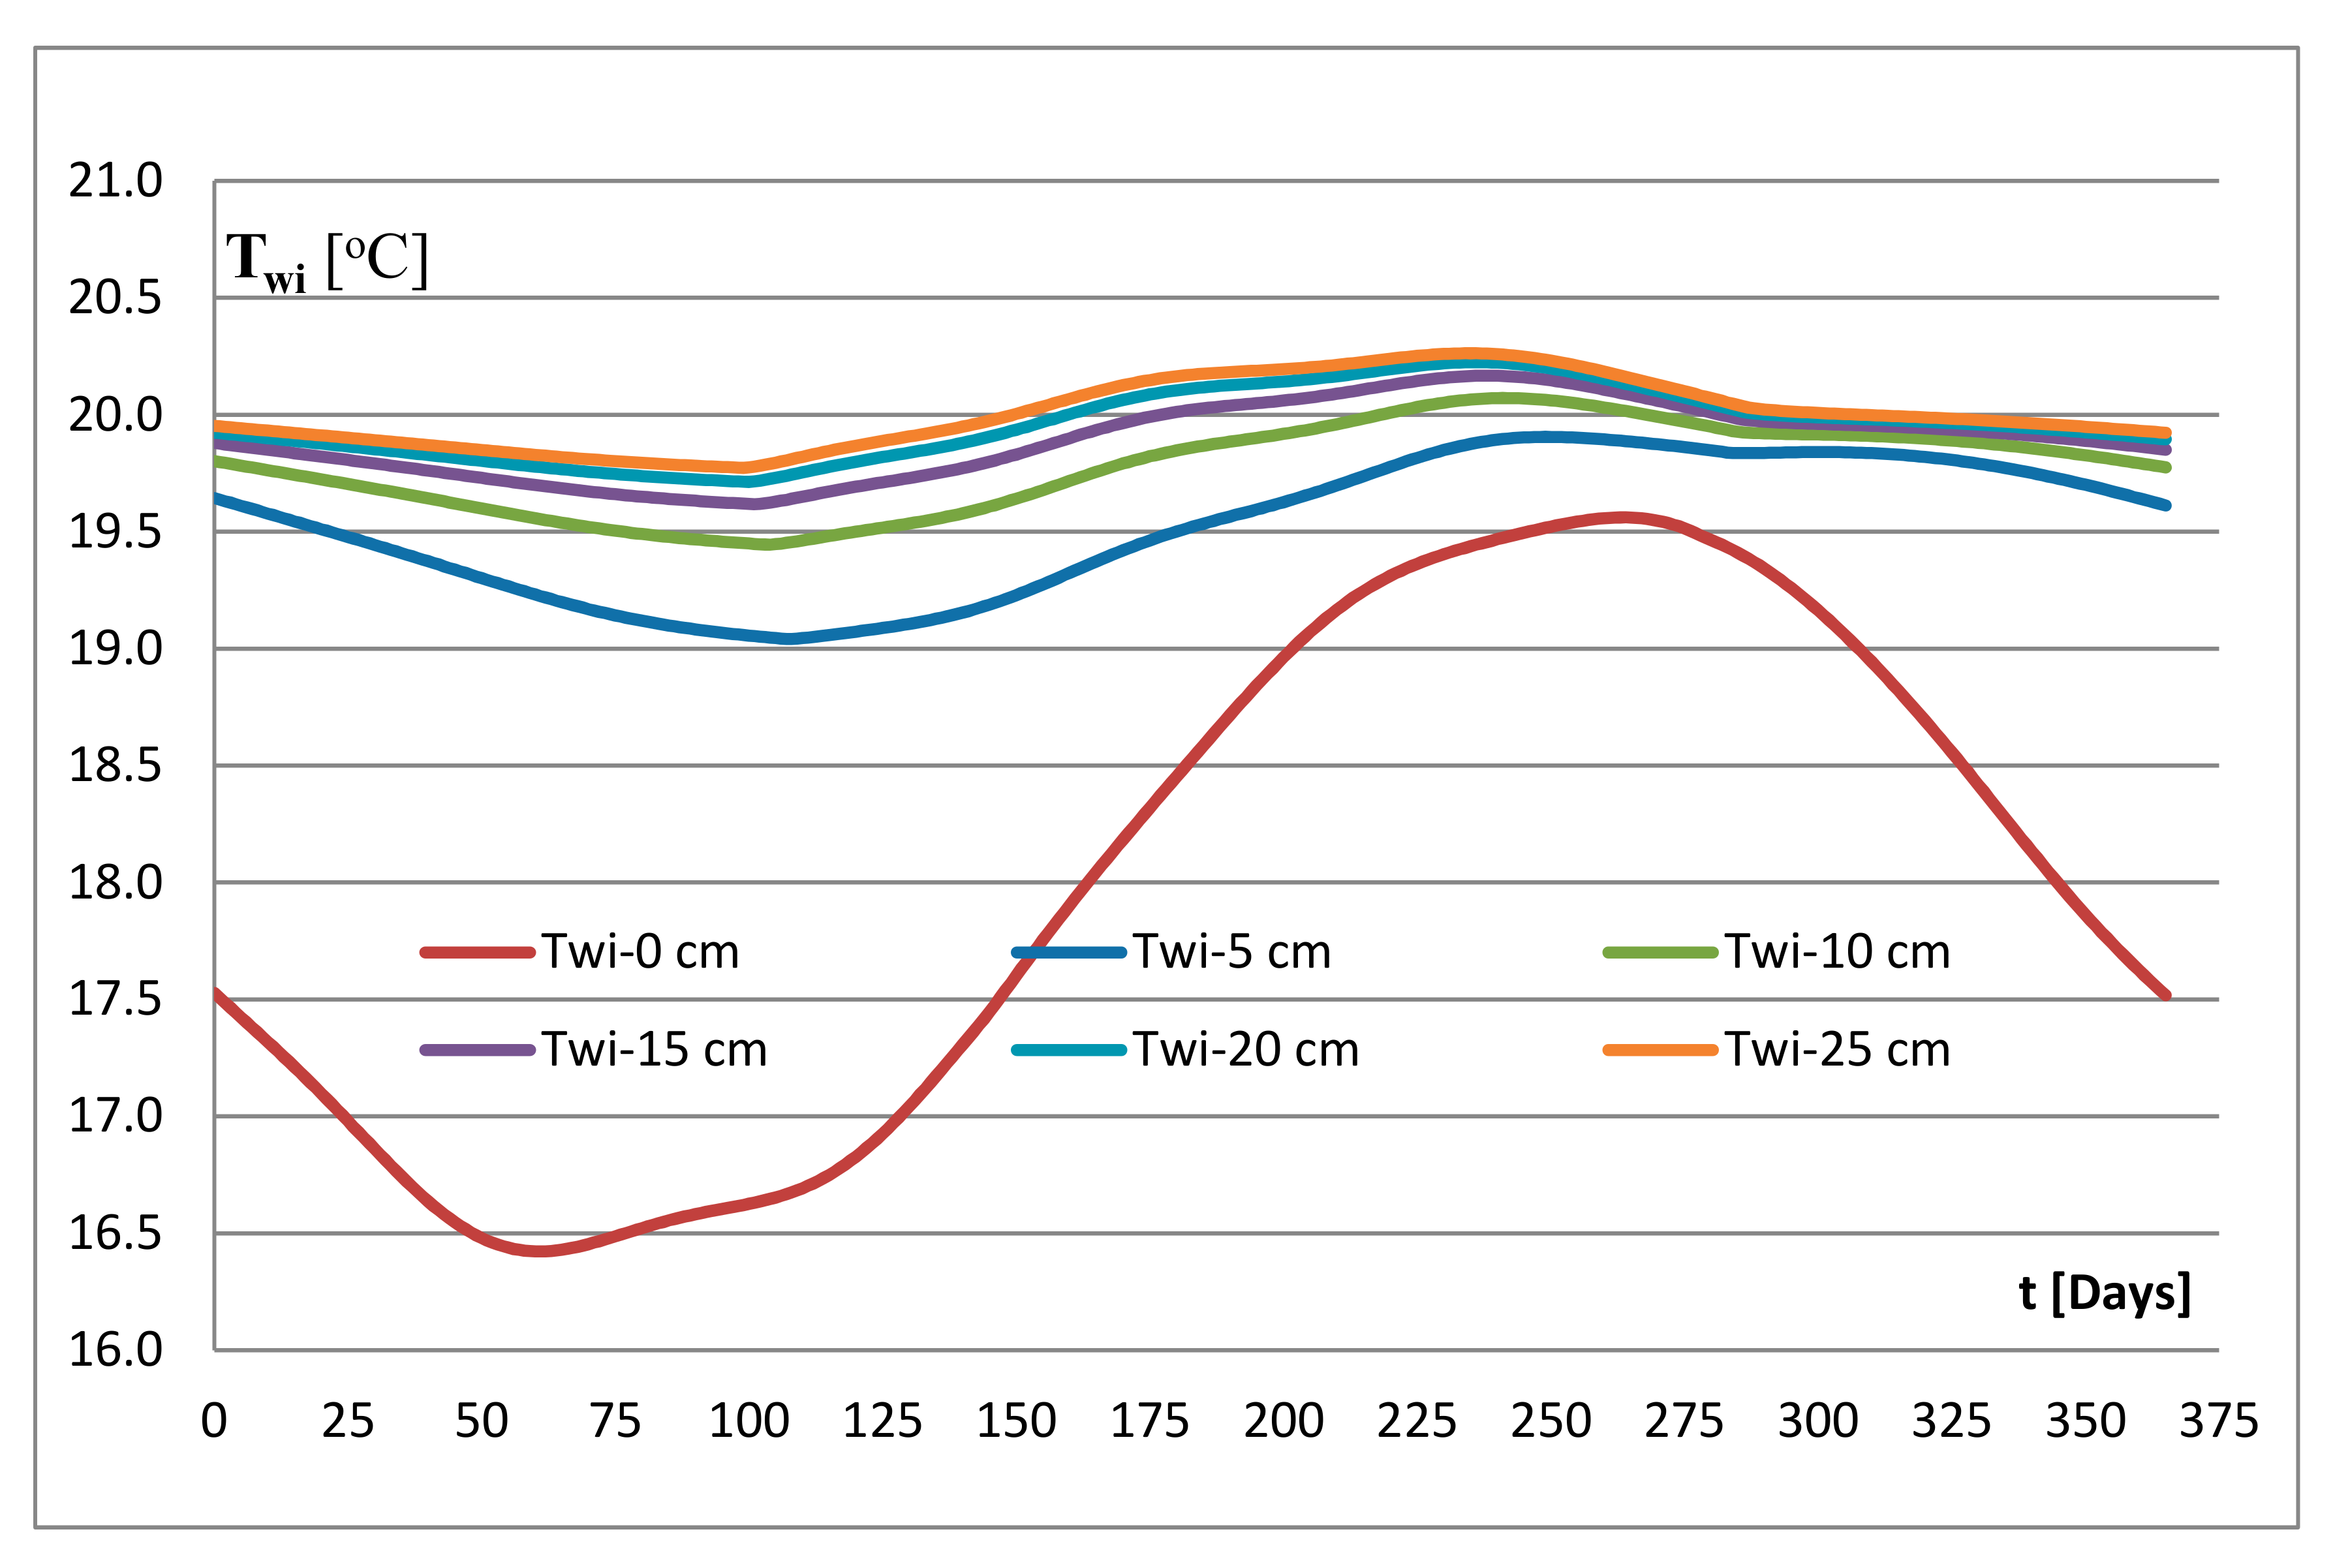
5.3. Calculation of the Surface Temperature of the Inner Outer Wall
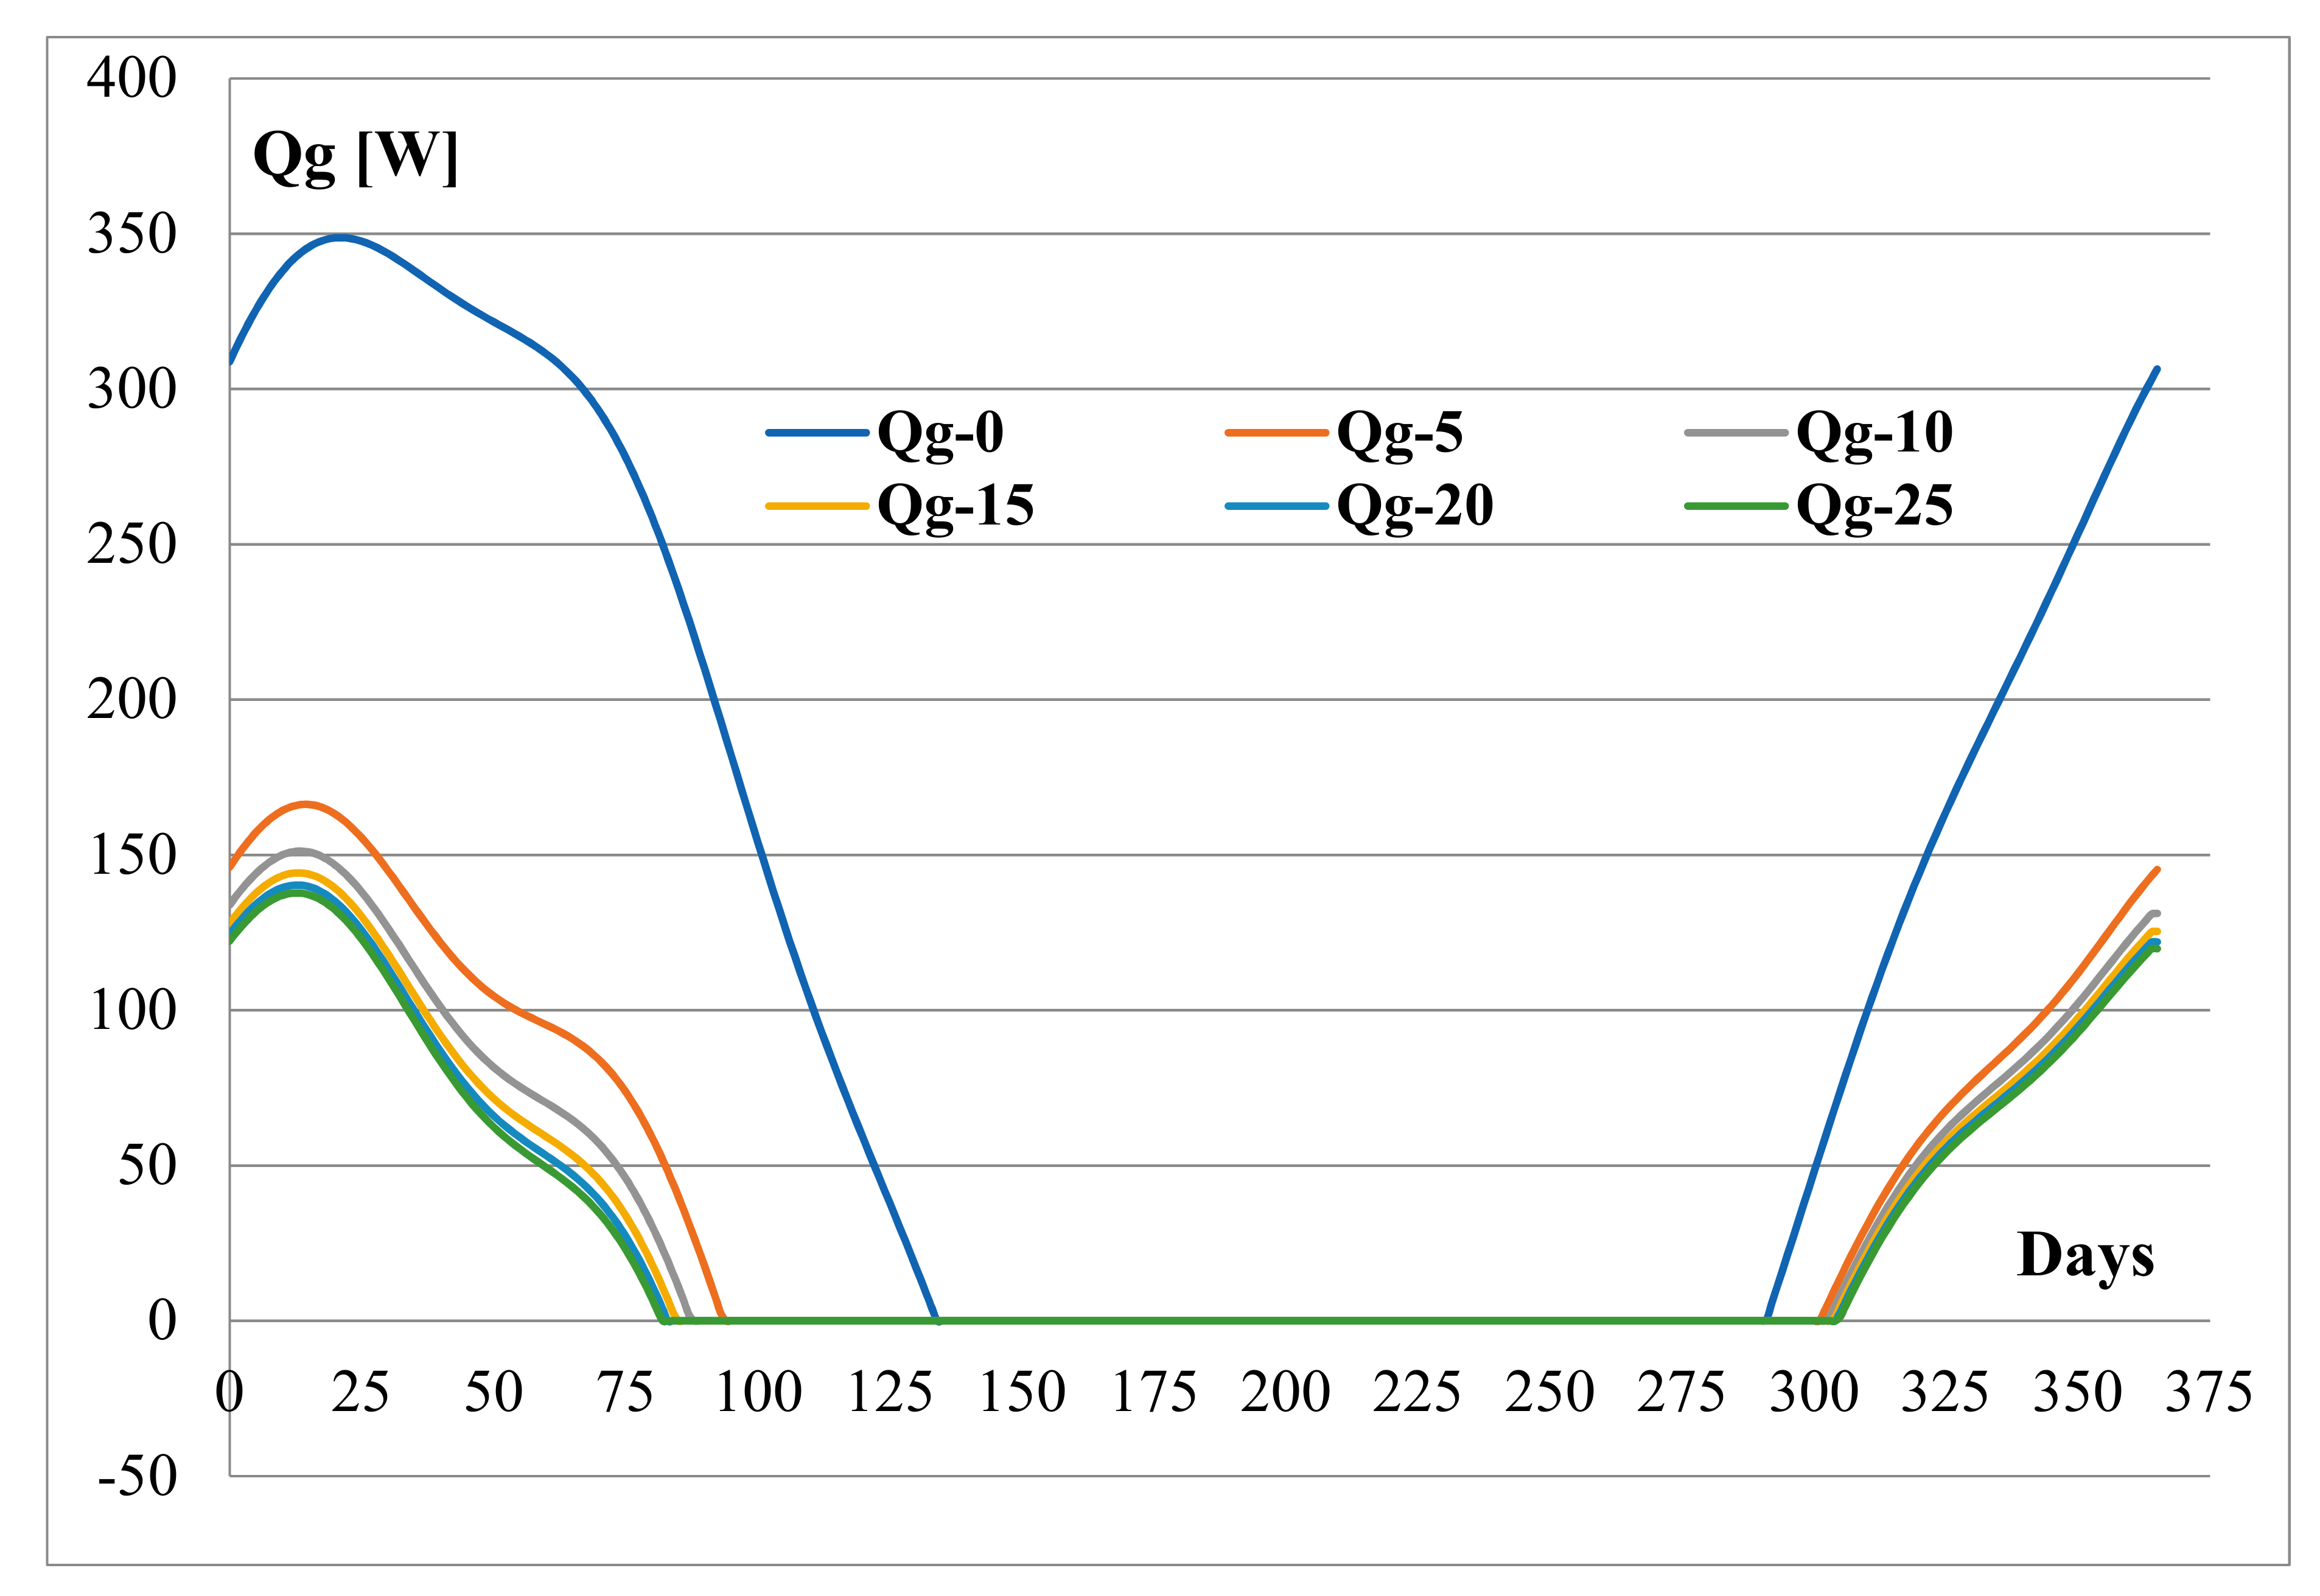
5.4. Analysis of Thermal Power Variability for Heating Purposes
- Taking into account the thermal inertia of the partitions makes it possible to perform a significant reduction in the demand for thermal power, and thus the use of smaller devices.
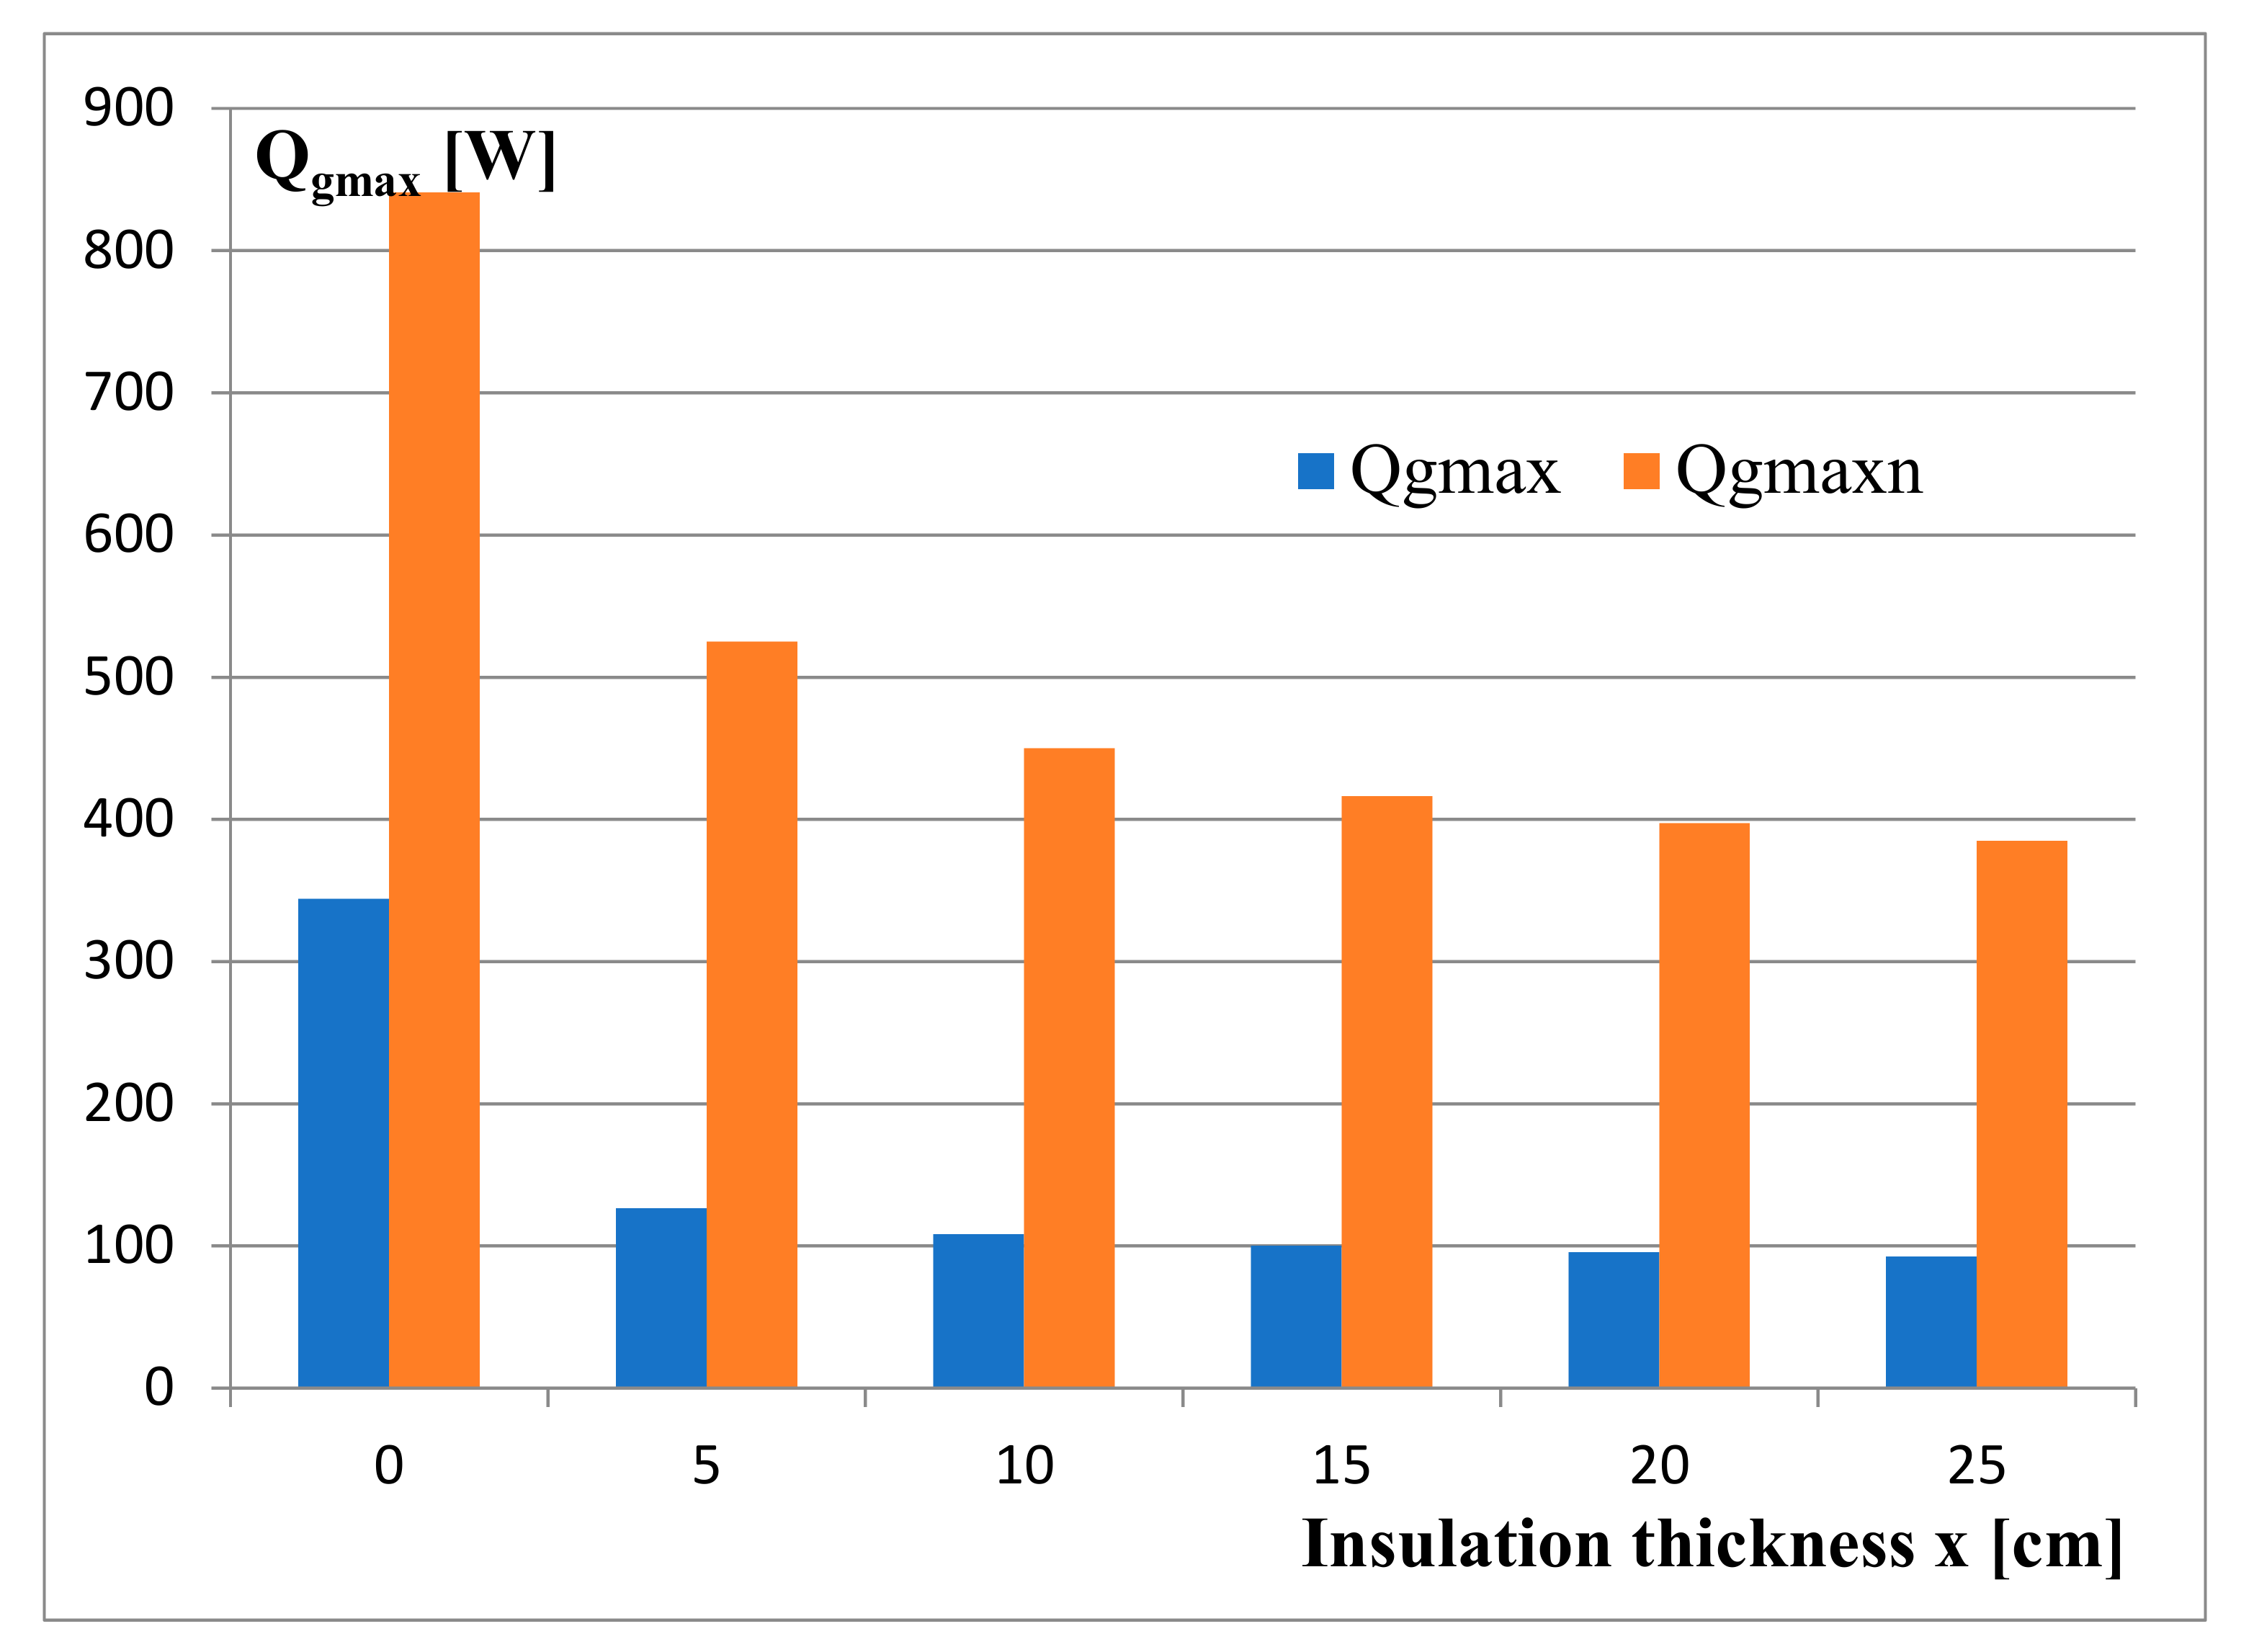
- For the considered partition, the calculated thermal power determined by the adopted method is only about 40% of the value calculated according to the standard.
- The reduction in thermal power depends on the thermal inertia of the partitions.
- Due to the low thermal capacity, the insulation thickness has a little effect on the maximum heat output.
5.5. The Dependence of the Time of the Heating Season on the Thickness of the Insulation
5.6. Validation of the Model by Using Fragmented Temperature Measurements
- Wall thickness: 50 cm,
- Thickness of the outer polystyrene insulation: 10 cm
- Thermal conductivity of the wall: λ = 0.82 W/(m·K)
- Thermal conductivity of the insulation: λ= 0.032 W/(m·K)
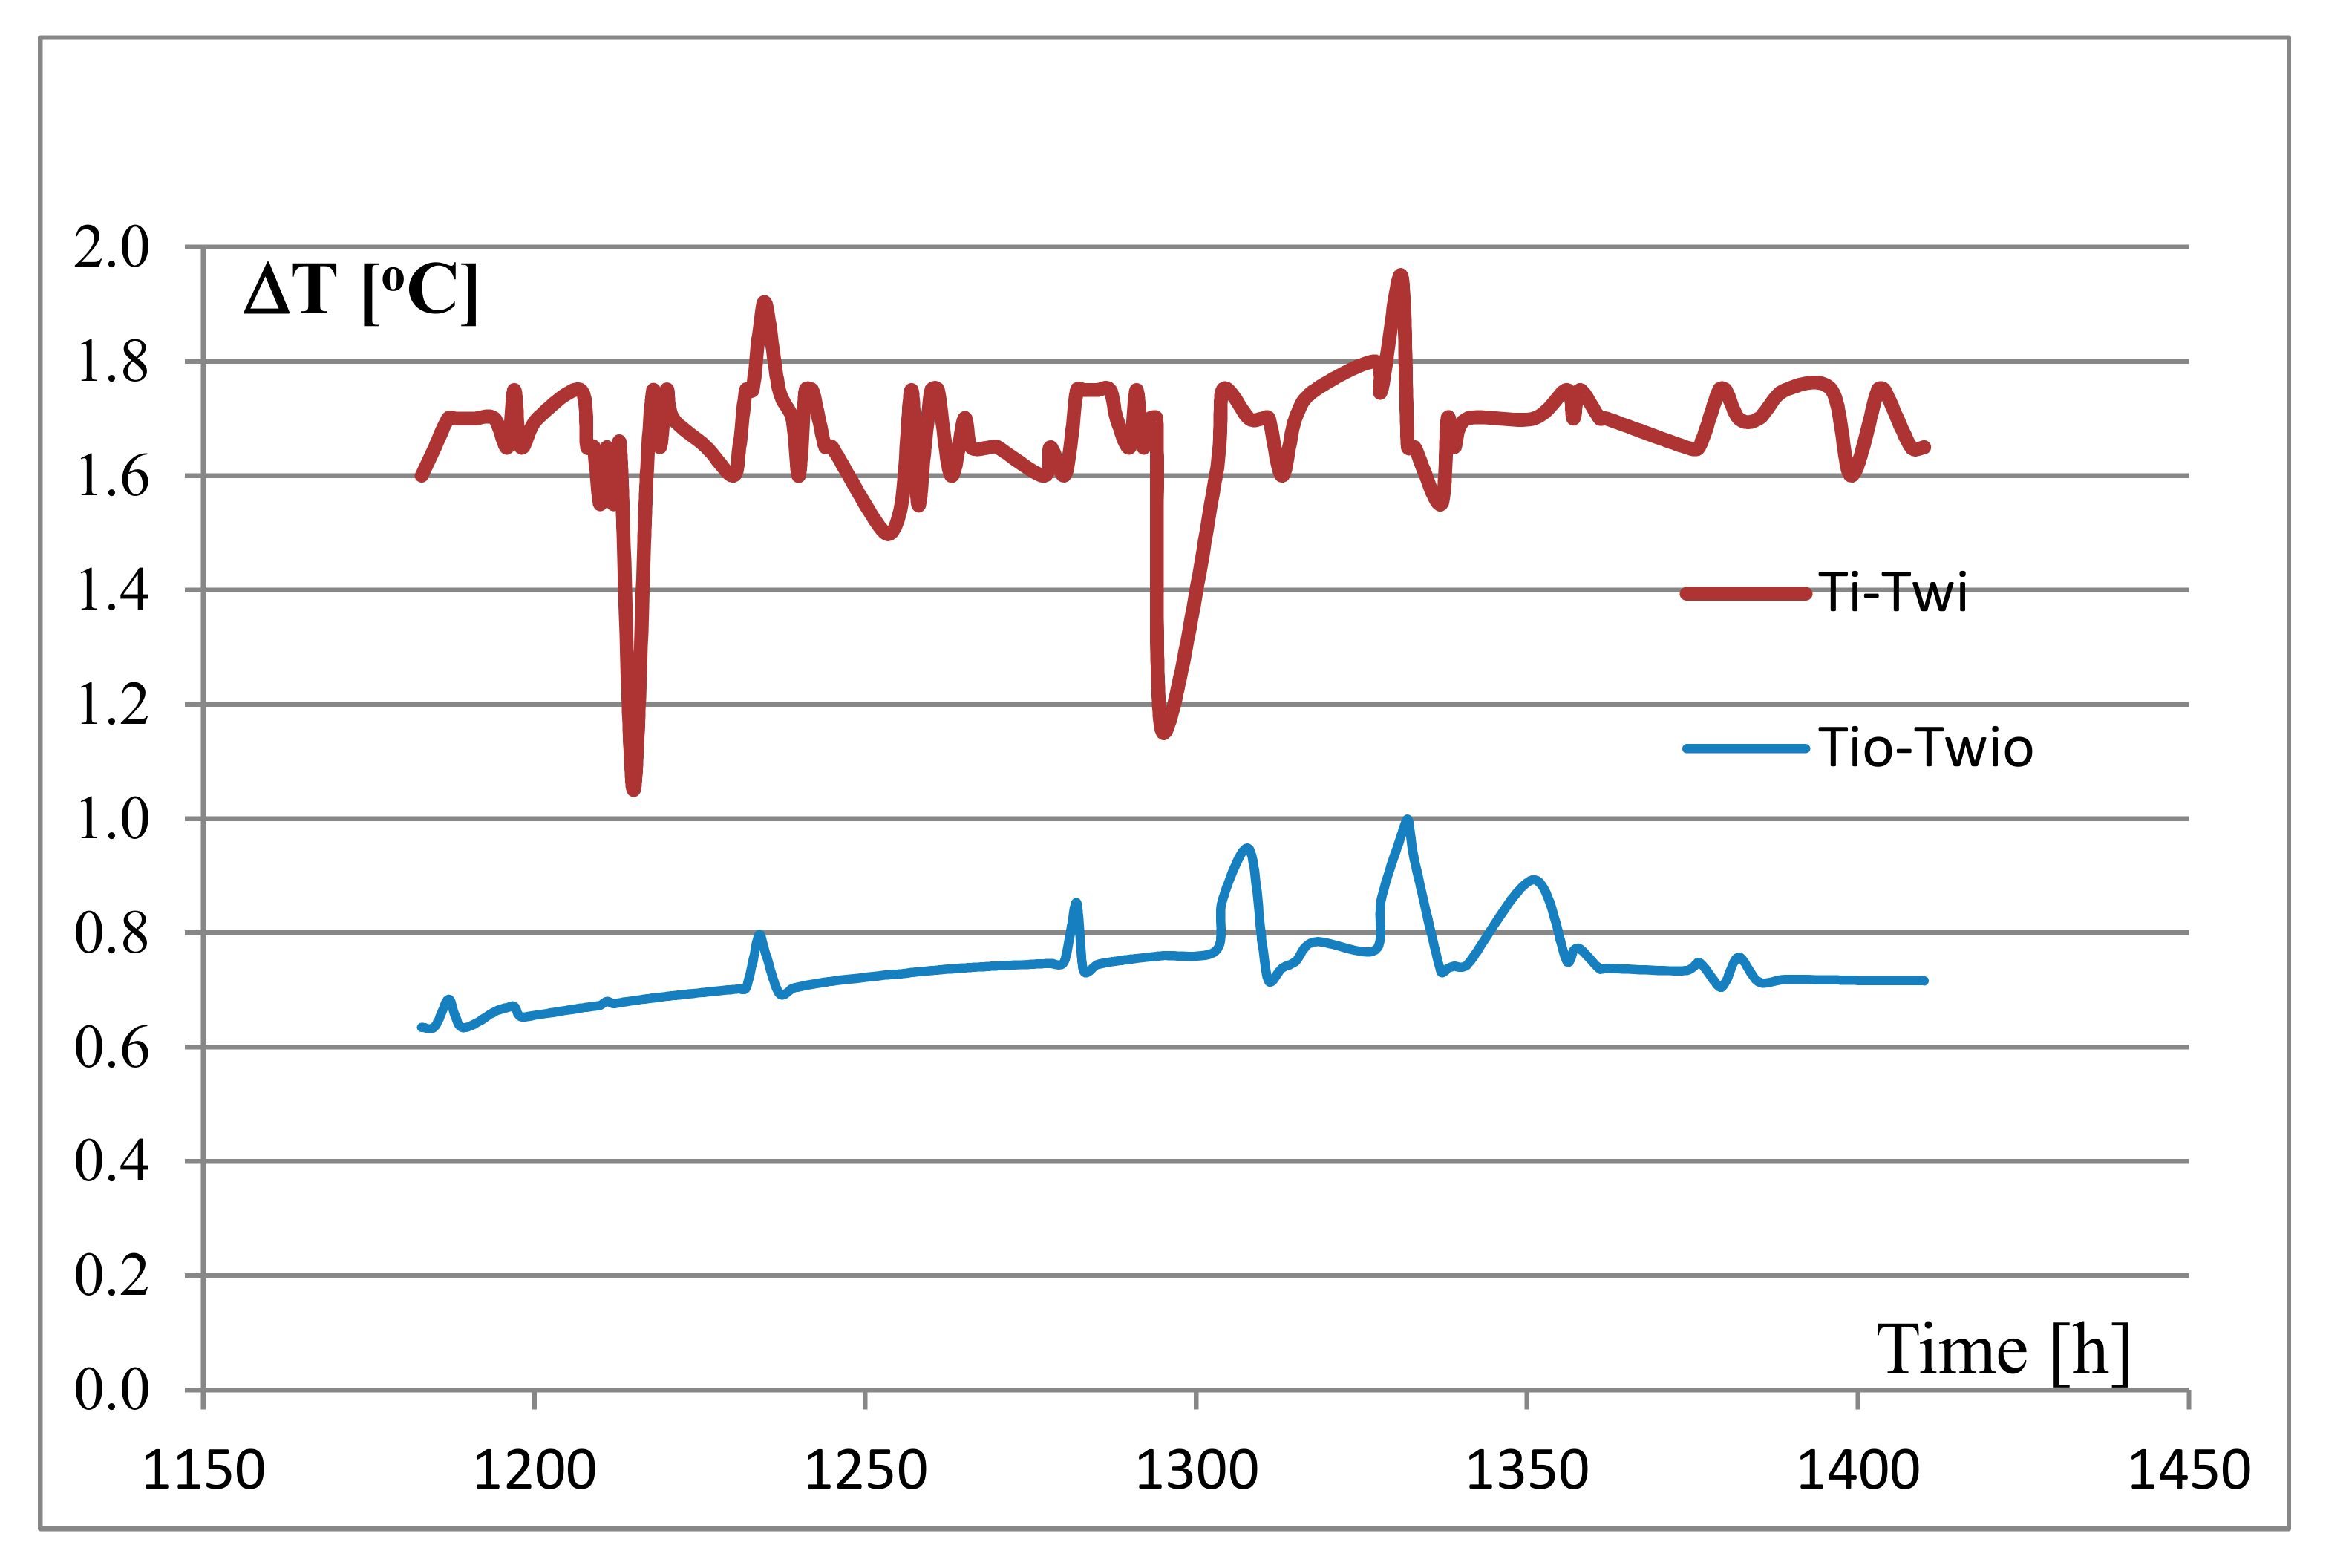
- Ti—internal air temperature
- Twi—temperature of the inner surface of the outer wall
- Te—outside air temperature
- Ti—measured internal air temperature
- Te—measured outside air temperature
- Twi—measured temperature of the inner surface of the outer wall
- Tio—internal air temperature adopted for calculations
- Teo—outside air temperature taken for calculations
- Twio—calculated temperature of the inner surface of the outer wall
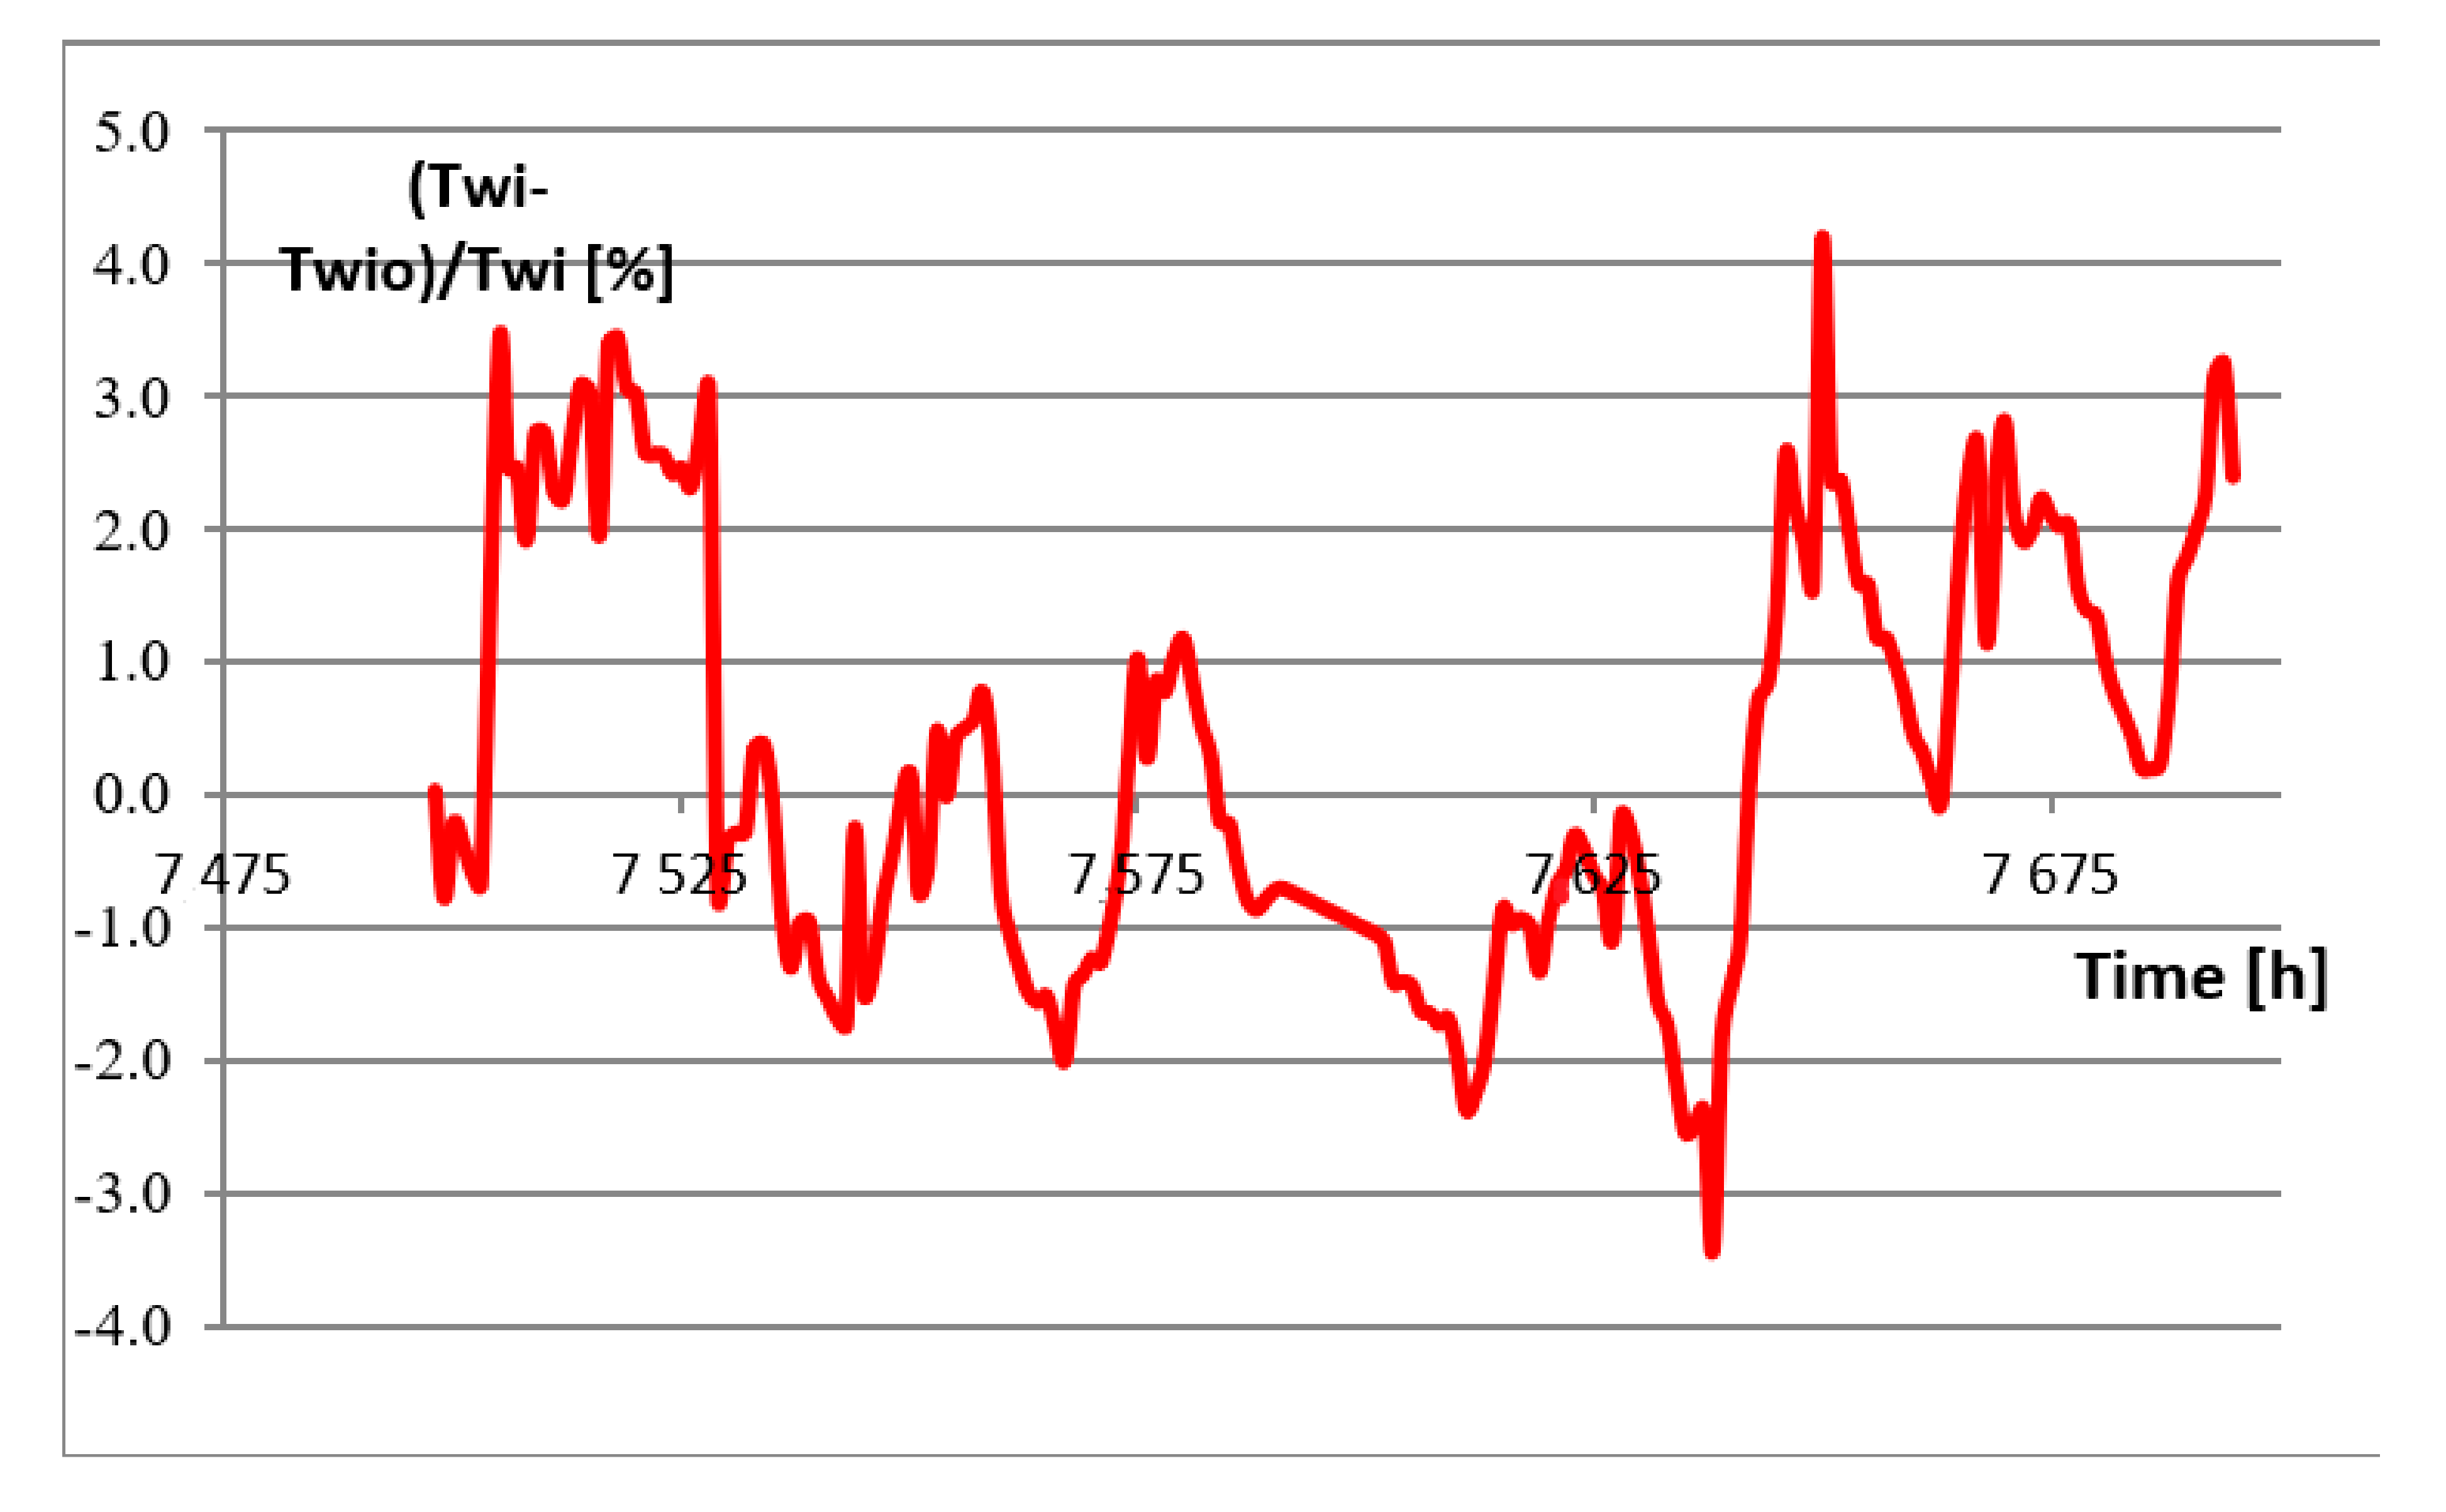
- δ—relative deviation of the measured and calculated internal surface temperature.
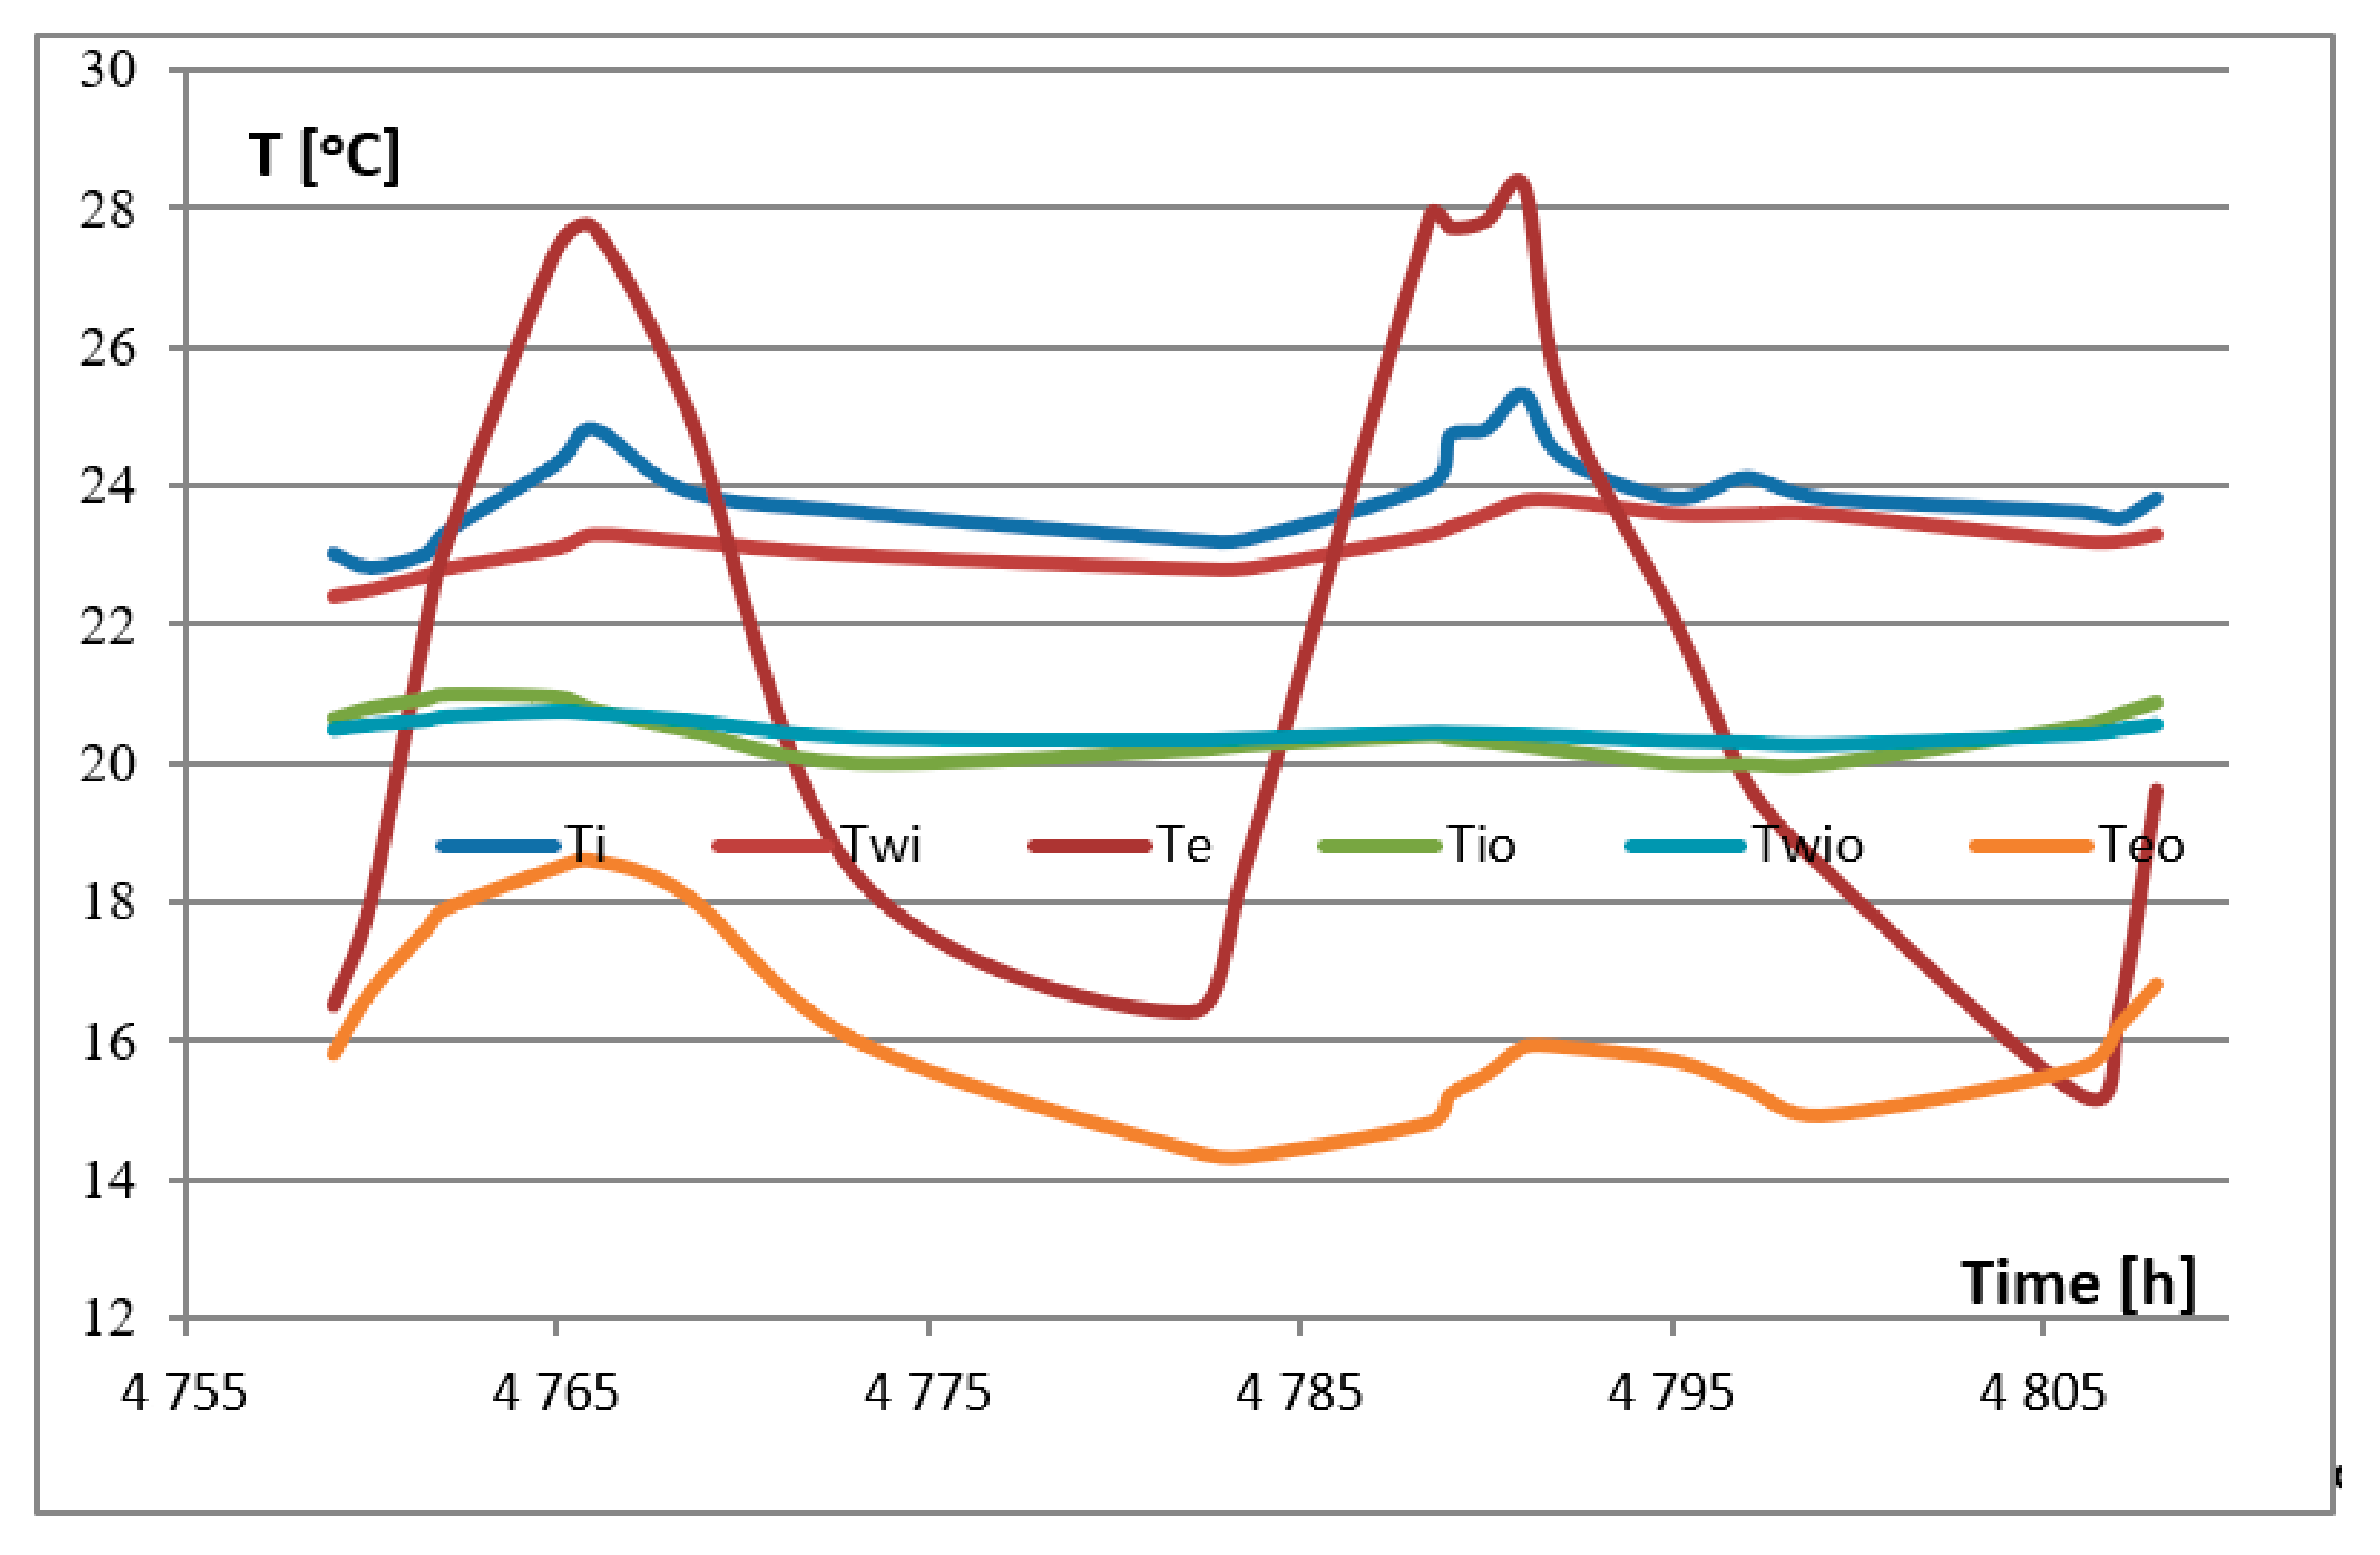
- In the winter period (February), the measured amplitude of changes in the outside temperature of 11.50 °C corresponds to the amplitude of changes in the internal temperature of 1.30 °C and the amplitude of changes in the temperature of the inside surface of the external wall, which equals 1.00 °C.
- Similar relations exist for the period from 18 to 20 July 2020.
- In any case, the average amplitude of changes in the temperature of the internal surface of the external wall is smaller than the amplitude of changes in the temperature of internal air.
- The same conclusion follows from the calculation results. Quantitative differences are caused by the random selection of the measurement period and the uniqueness of the climate parameters.
- Reducing the amplitude has a positive effect on maintaining thermal comfort.
6. Summary and Conclusions
- Maximum power for heating, determining the selection of heating devices, is lower than the values determined according to the applicable calculation rules. The difference between the thermal power calculated on the basis of the applicable PN EN 12831 standard and the maximum power for a given case of the partition structure, calculated in accordance with the considered methodology presented in the article, decreases with increasing insulation thickness and equals from 41% to 24%.
- The reduction in heat output depends on the thickness of the insulation, but to a much lesser extent than the increase in thickness. The economic correlation between these values requires further analysis.
- The duration of the heating season is also dependent on the insulation of external partitions and it is definitely shorter than that determined on the basis of changes in external temperature.
- With the efficient regulation of the internal temperature in the heating season, the insulation of the external partition allows for very small temperature fluctuations of the internal surface of the partitions, which has a positive effect on the thermal comfort of the rooms.
- The results of the research on temperature variability over time presented in the article confirm the fact that the temperature fluctuations of the surface of the partitions, which reflect the heat transfer from the internal air to the partition surface, and the heat conduction inside the partition and heat transfer from the partition to the outside air are much less variable than the fluctuations of outdoor and indoor temperatures. With the amplitude of changes in the outside air temperature in summer amounting to 11.5 °C, the amplitude of changes in the internal temperature of the surface of the analyzed external wall is 1.00 °C, while the amplitude of changes in the internal temperature is 1.30 °C. In winter, these fluctuations demonstrate similar relationships with greater differences.
- The performed research confirms the compliance of the adopted model of heat transfer dynamics testing. Average temperature deviations measured and calculated in the winter season range from −0.85% to +0.45%. A significant deviation in the summer season is due to the lack of temperature regulation.
Author Contributions
Funding
Conflicts of Interest
References and Notes
- Directive 2002/91/EC of the European Parliament and of the Council of 16 December 2002 on the Energy Performance of Buildings. Official Journal of the European Union, L 1/65.
- Directive 2010/31/EU of the European Parliament and of the Council of 19 May 2010 on the Energy Performance of Buildings (Recast). Official Journal of the European Union, L 153/13.
- Directive 2012/27/EU of the European Parliament and of the Council of 25 October 2012 on Energy Efficiency, Amending Directives 2009/125/EC and 2010/30/EU and Repealing Directives 2004/8/EC and 2006/32/EC. Official Journal of the European Union, L 315/1.
- The Act of 20 May 2016 on energy efficiency (Journal of Laws of 2016, item 831), as amended.
- The Act of 29 August 2014 on the energy performance of buildings (Journal of Laws of 2014, item 1200), as amended.
- Directive (EU) 2018/844 of the European Parliament and of the Council of 30 May 2018 Amending Directive 2010/31/EU on the Energy Performance of Buildings and Directive 2012/27/EU on Energy Efficiency. Official Journal of the European, L 156/75.
- Regulation of the Minister of Infrastructure of 12 April 2002 on Technical Conditions to be Met by Buildings and Their Location (Journal of Laws No. 75, item 690), as amended.
- Regulation of the Minister of Infrastructure of 27 February 2015 on the Methodology for Determining the Energy Performance of a Building or Part of a Building and Energy Performance Certificates (Journal of Laws of 2015, item 376).
- Satchwell, A.J.; Cappers, P.A.; Deason, J.; Forrester, S.P.; Frick, N.M.; Gerke, B.F.; Piette, M.A. A Conceptual Framework to Describe Energy Efficiency and Demand Response Interactions. Energies 2020, 13, 4336. [Google Scholar] [CrossRef]
- Babiarz, B. Aspects of heat supply security management using elements of decision theory. Energies 2018, 11, 2764. [Google Scholar] [CrossRef]
- Cholewa, T.; Życzyńska, A. Experimental evaluation of calculated energy savings in schools. J. Therm. Anal. Calorim. 2020, 1–8. [Google Scholar] [CrossRef]
- Babiarz, B. Heat supply system reliability management. Safety and reliability: Methodology and Applications. In Proceedings of the European Safety and Reliability Conference, ESREL 2014, Wroclaw, Poland, 14–18 September 2014; Taylor & Francis Group: London, UK, 2015; pp. 1501–1506. [Google Scholar]
- Cholewa, T.; Balaras, C.A.; Nižetić, S.; Siuta-Olcha, A. On calculated and actual energy savings from thermal building renovations—Long term field evaluation of multifamily buildings. Energy Build. 2020, 223, 110145. [Google Scholar] [CrossRef]
- Babiarz, B.; Kut, P. District heating simulation in the aspect of heat supply safety. In Proceedings of the VI International Conference of Science and Technology INFRAEKO 2018 Modern Cities. Infrastructure and Environment, Cracov, Poland, 7–8 June 2018. [Google Scholar] [CrossRef]
- Chicherin, S.; Mašatin, V.; Siirde, A.; Volkova, A. Method for Assessing Heat Loss in A District Heating Network with A Focus on the State of Insulation and Actual Demand for Useful Energy. Energies 2020, 13, 4505. [Google Scholar] [CrossRef]
- Basinska, M.; Koczyk, H.; Szczechowiak, E. Sensitivity analysis in determining the optimum energy for residential buildings in Polish conditions. Energy Build. 2015, 107, 307–318. [Google Scholar] [CrossRef]
- Rim, M.; Sung, U.J.; Kim, T. Application of Thermal Labyrinth System to Reduce Heating and Cooling Energy Consumption. Energies 2018, 11, 2762. [Google Scholar] [CrossRef]
- Dec, E.; Babiarz, B.; Sekret, R. Analysis of temperature, air humidity and wind conditions for the needs of outdoor thermal comfort. In Proceedings of the 10th Conference on Interdisciplinary Problems in Environmental Protection and Engineering EKO-DOK 2018 E3S Web of Conferences 44, Dolny Śląsk, Poland, 8–10 April 2019. [Google Scholar] [CrossRef]
- Krawczyk, D.A.; Wądołowska, B. Analysis of indoor air parameters in an education building. Energy Procedia 2018, 147, 96–103. [Google Scholar] [CrossRef]
- Oldewurtel, F.; Sturzenegger, D.; Morari, M. Importance of occupancy information for building climate control. Appl. Energy 2013, 101, 521–532. [Google Scholar] [CrossRef]
- Korkas, C.D.; Baldi, S.; Michailidis, I.; Kosmatopoulos, E.B. Occupancy-based demand response and thermal comfort optimization in microgrids with renewable energy sources and energy storage. Appl. Energy 2016, 163, 93–104. [Google Scholar] [CrossRef]
- Xue, Y.; Ge, Z.; Du, X.; Yang, L. On the Heat Transfer Enhancement of Plate Fin Heat Exchanger. Energies 2018, 11, 1398. [Google Scholar] [CrossRef]
- Emmel, M.G.; Abadie, M.O.; Mendes, N. New external convective heat transfer coefficient correlations for isolated low-rise buildings. Energy Build. 2007, 39, 335–342. [Google Scholar] [CrossRef]
- Dylewski, R. Optimal Thermal Insulation Thicknesses of External Walls Based on Economic and Ecological Heating Cost. Energies 2019, 12, 3415. [Google Scholar] [CrossRef]
- Krasoń, J.; Miąsik, P.; Lichołai, L.; Dębska, B.; Starakiewicz, A. Analysis of the Thermal Characteristics of a Composite Ceramic Product Filled with Phase Change Material. Buildings 2019, 9, 217. [Google Scholar] [CrossRef]
- Kim, D.; Cox, S.J.; Cho, H.; Yoon, J. Comparative investigation on building energy performance of double skin façade (DSF) with interior or exterior slat blinds. J. Build. Eng. 2018, 20. [Google Scholar] [CrossRef]
- Wilson, M.; Luck, R.; Mago, P.J.; Cho, H. Building Energy Management Using Increased Thermal Capacitance and Thermal Storage Management. Buildings 2018, 8, 86. [Google Scholar] [CrossRef]
- Zheng, X.; Heshmati, A. An Analysis of Energy Use Efficiency in China by Applying Stochastic Frontier Panel Data Models. Energies 2020, 13, 1892. [Google Scholar] [CrossRef]
- Seo, B.; Yoon, Y.B.; Yu, B.H.; Cho, S.; Lee, K.H. Comparative Analysis of Cooling Energy Performance Between Water-Cooled VRF and Conventional AHU Systems in a Commercial Building. Appl. Therm. Eng. 2020, 170, 114992. [Google Scholar] [CrossRef]
- Kim, C.-H.; Lee, S.-E.; Lee, K.H.; Kim, K.-S. Detailed Comparison of the Operational Characteristics of Energy-conserving HVAC Systems during the Cooling Season. Energies 2019, 12, 4160. [Google Scholar] [CrossRef]
- Wetter, M. Modelica-based modelling and simulation to support research and development in building energy and control systems. J. Build. Perform. Simul. 2009, 2. [Google Scholar] [CrossRef]
- Manz, H.; Frank, T.h. Thermal simulation of buildings with double-skin façades. Energy Build. 2005, 37. [Google Scholar] [CrossRef]
- Clarke, J.A. Energy Simulation in Building Design; Butterworth-Heinemann: Oxford, UK, 2001. [Google Scholar]
- Gerlich, V. Modelling of Heat Transfer in Buildings. In Proceedings of the 25th Conference on Modelling and Simulation, Krakow, Poland, 7–10 June 2011. [Google Scholar] [CrossRef]
- Simões, N.; Prata, J.; Tadeu, A. 3D Dynamic Simulation of Heat Conduction through a Building Corner Using a BEM Model in the Frequency Domain. Energies 2019, 12, 4595. [Google Scholar] [CrossRef]
- Madejski, J. Theory of Heat Transfer; Szczecin University of Technology: Szczecin, Poland, 1998. (In Polish) [Google Scholar]
- Staniszewski, B. Heat transfer. In Theoretical Basics; PWN: Warsaw, Poland, 1979. [Google Scholar]
- Szymański, W. Heat transfer. Fundamentals, Federation of Scientific and Technical Associations Council in Rzeszów, Rzeszów 2019 (In Polish).
- Bronsztejn, I.N.; Siemiendiajew, K.A. Maths. In Encyclopedic Guide; PWN: Warsaw, Poland, 1968. [Google Scholar]
- Typical Meteorological Years and Statistical Climatic Data for Energy Calculations of Buildings. Available online: www.mib.gov.pl (accessed on 15 September 2020).
- PN-EN ISO 52016-1: 2017 Energy performance of buildings—Energy needs for heating and cooling, internal temperatures and sensible and latent heat loads—Part 1: Calculation procedures (ISO 52016-1:2017).
- PN-EN-ISO 6946: Building components and building elements. Thermal resistance and heat transfer coefficients. Calculation Method.
- PN-83/B-03430 Ventilation in residential buildings, collective residence and public utility buildings. Requirements.
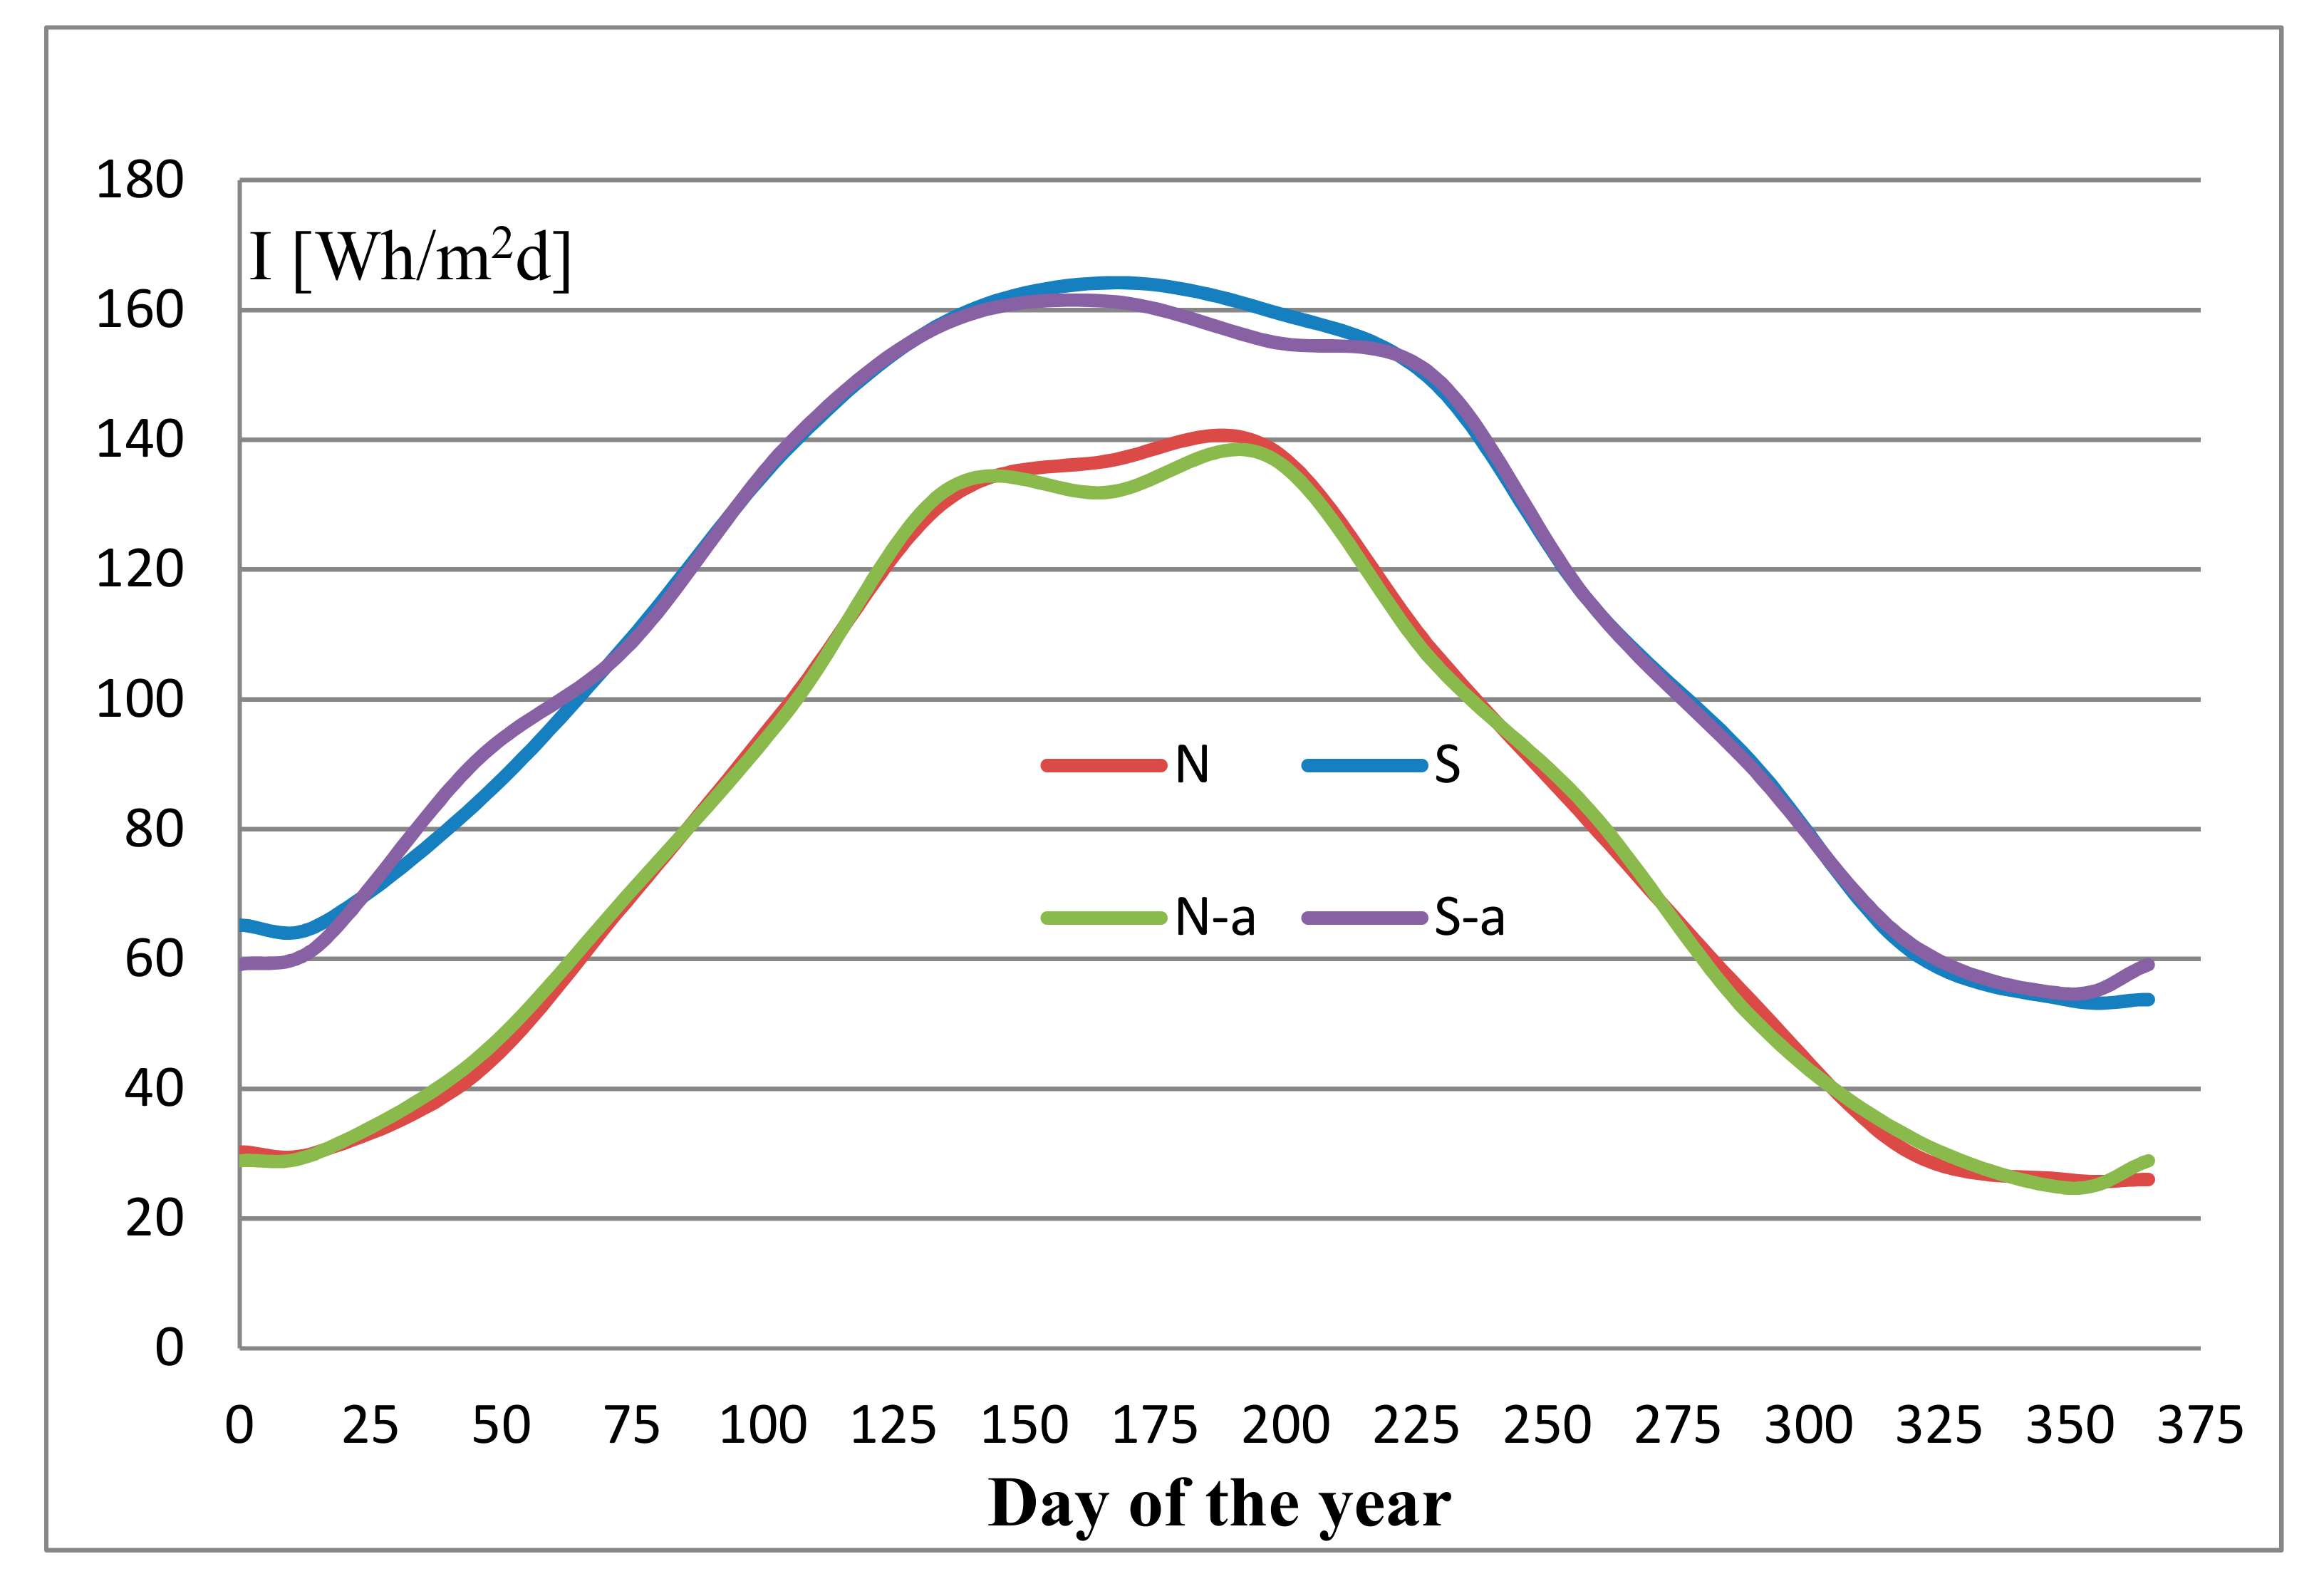






| a0 | a1 | a2 | a3 | a4 | a5 | a6 |
| 7.5416667 | −10.20434 | −0.475828 | 0.4847788 | −0.658554 | −0.804472 | 0.1787785 |
| b0 | b1 | b2 | b3 | b4 | b5 | b6 |
| 0 | −2.751565 | 0.3030664 | 0.1518707 | −0.543962 | −0.141402 | −1.064303 |
| Azimuth | a0 | a1 | a2 | a3 | a4 | a5 | a6 |
| S-E | 2148 | −1086.93 | −290.441 | −0.1582 | −57.45 | 61.83312 | 88.37249 |
| S | 2184 | −808.599 | −411.05 | −75.1664 | −56.1412 | 45.27268 | 88.73687 |
| S-W | 2052 | −989.688 | −246.853 | −64.7049 | −62.5093 | 29.71963 | 82.69103 |
| W | 1694 | −1152.13 | −57.8825 | −50.2884 | −37.8367 | 19.73632 | 68.45242 |
| N-W | 1310 | −972.617 | 32.30067 | −60.987 | −11.8132 | 9.586983 | 51.39972 |
| N | 1124 | −760.472 | 15.24531 | −75.8967 | 1.364588 | 11.80952 | 45.10691 |
| N-E | 1358 | −1040.44 | 28.53617 | −17.6399 | −36.229 | 17.43642 | 54.88028 |
| E | 1804 | −1271.09 | −98.6696 | 13.37886 | −43.3159 | 49.50059 | 75.13932 |
| S-E | b1 | b2 | b3 | b4 | b5 | b6 | b1 |
| S | 247.2218 | 89.42463 | 44.11991 | −26.3514 | −60.4461 | 13.67889 | 247.2218 |
| S-W | 220.6692 | 208.4086 | 60.60816 | −27.2299 | −62.535 | −10.4756 | 220.6692 |
| W | 312.2481 | 211.5765 | 38.31833 | −18.5326 | −63.0764 | 6.145611 | 312.2481 |
| N-W | 358.7338 | 142.2012 | 0.810727 | −13.0379 | −51.4592 | 27.8375 | 358.7338 |
| N | 294.664 | 75.47576 | −16.0399 | −8.85253 | −30.6874 | 37.86873 | 294.664 |
| N-E | 262.2807 | 59.18627 | 21.32114 | −22.0431 | −30.7906 | 42.58792 | 262.2807 |
| E | 317.4635 | 19.13467 | 25.85404 | −18.7495 | −33.7939 | 45.45755 | 317.4635 |
| Parameter | Insulation Thickness x [cm] | |||||
|---|---|---|---|---|---|---|
| x [cm] | 0 | 5 | 10 | 15 | 20 | 25 |
| Qgmax | 344.02 | 126.41 | 108.16 | 100.02 | 95.56 | 92.60 |
| Qgmaxn | 840.98 | 525.07 | 449.96 | 416.30 | 397.21 | 384.90 |
| Qgmax/Qgmaxn | 0.409 | 0.241 | 0.240 | 0.240 | 0.241 | 0.241 |
| Period | From 20 to 29 February 2020 | From 18 to 20 July 2020 | |||||
|---|---|---|---|---|---|---|---|
| Parameter | Ti [°C] | Twi [°C] | Te [°C] | Ti [°C] | Twi [°C] | Te [°C] | |
| Calculation | Tmin | 20.00 | 19.25 | −4.40 | 20.00 | 20.23 | 13.60 |
| Tmax | 20.20 | 19.33 | 7.80 | 21.17 | 20.77 | 23.70 | |
| ΔT | 0.20 | 0.08 | 12.20 | 1.17 | 0.54 | 10.10 | |
| Measurement | Tmin | 20.10 | 18.90 | −0.30 | 23.50 | 22.40 | 15.20 |
| Tmax | 21.40 | 19.90 | 11.20 | 24.90 | 23.80 | 28.30 | |
| ΔT | 1.30 | 1.00 | 11.50 | 1.40 | 1.40 | 13.10 | |
| Period | From 20 to 29 February 2020 | From 18 to 20 July 2020 | ||
|---|---|---|---|---|
| Parameter | Measurement (Ti – Twi) [°C] | Calculation (Tio – Twio) [°C] | Measurement (Ti – Twi) [°C] | Calculation (Tio – Twio) [°C] |
| Max | 1.95 | 1.00 | 1.50 | 0.35 |
| Min | 1.05 | 0.63 | 0.20 | −0.34 |
| Average | 1.69 | 0.74 | 9.70 | 0.01 |
| Measurement | Calculation | |||||
|---|---|---|---|---|---|---|
| Parameter | Ti [°C] | Twi [°C] | Te [°C] | Tio [°C] | Twio [°C] | Teo [°C] |
| Tmin | 20.42 | 19.73 | 3.87 | 20.00 | 19.68 | −3.90 |
| Tmax | 22.78 | 21.81 | 12.03 | 20.30 | 21.16 | 9.10 |
| ΔT | 2.36 | 2.08 | 9.08 | 0.30 | 1.48 | 13.00 |
| Period | From 20 to 29 February 2020 | From 18 to 20 July 2020 | From 9 to 11 November 2020 |
|---|---|---|---|
| Max [%] | 17.3 | 14.39 | 4.19 |
| Min [%] | −3.47 | 8.61 | −3.43 |
| Average [%] | −0.85 | 12.34 | 0.45 |
Publisher’s Note: MDPI stays neutral with regard to jurisdictional claims in published maps and institutional affiliations. |
© 2020 by the authors. Licensee MDPI, Basel, Switzerland. This article is an open access article distributed under the terms and conditions of the Creative Commons Attribution (CC BY) license (http://creativecommons.org/licenses/by/4.0/).
Share and Cite
Babiarz, B.; Szymański, W. Introduction to the Dynamics of Heat Transfer in Buildings. Energies 2020, 13, 6469. https://doi.org/10.3390/en13236469
Babiarz B, Szymański W. Introduction to the Dynamics of Heat Transfer in Buildings. Energies. 2020; 13(23):6469. https://doi.org/10.3390/en13236469
Chicago/Turabian StyleBabiarz, Bożena, and Władysław Szymański. 2020. "Introduction to the Dynamics of Heat Transfer in Buildings" Energies 13, no. 23: 6469. https://doi.org/10.3390/en13236469
APA StyleBabiarz, B., & Szymański, W. (2020). Introduction to the Dynamics of Heat Transfer in Buildings. Energies, 13(23), 6469. https://doi.org/10.3390/en13236469


