Setting up Energy Efficiency Management in Companies: Preliminary Lessons Learned from the Petroleum Industry


Abstract

1. Introduction
- RQ1:
- What key process steps and sources of information ought to be involved in the pilot implementation of EEM in a multi-facility organization?
- RQ2:
- What level of telemetry and data processing systems involvement is expected to maintain EEM?
- RQ3:
- How the structure of a contract between the organization that sets up EEM and an external EE solution provider should look like?
2. Research Background
2.1. EE and its Determinants
- strictly market-related factors, such as awareness of actual energy costs, anticipating high market prices of energy in the future and subsequent attempts to constrain energy-related company costs, or availability of favorable loans for EE financing [20];
- technological progress [23];
- environmental regulation at both national and regional levels [24], including increasing energy tariffs [25], drawing voluntary programs and agreements between industry and governing bodies that feature negotiated targets and timetables, as well as threatening to introduce future taxes/regulation [26].
2.2. Energy Efficiency Policies
2.3. Energy Efficiency Management
- introducing review techniques that involve professionals who represent highly diversified business disciplines;
- scrutinizing historical data;
- performing energy audits;
- preparing feasibility analyses of energy improvement plans prepared by a business organization and possible implementation of those plans;
- conducting training in energy efficiency.
3. Methods
- G1:
- an innovative, purposeful artifact ought to be created;
- G2:
- the artifact must yield utility for a specified problem domain;
- G3:
- the artifact is to be submitted for attentive evaluation;
- G4:
- the artifact needs to address a heretofore unsolved challenge or feature a more effective solution to a well-known problem;
- G5:
- the artifact itself must be strictly defined, internally consistent, and represented in a formal way;
- G6:
- developing the artifact should involve a search process whereby a problem space is constructed, and a mechanism posed or enacted to find an effective solution;
- G7:
- the outcomes of the DSR must be tellingly reported to practitioners responsible for putting them into practice, to the scientific community perfecting them, as well as to decision-makers, whose organizations shall take advantage of the artifact.
4. Results
4.1. Conceptualization of the Artifact
4.2. Implementation and Validation of the Artifact
5. Discussion
6. Implications and Limitations
6.1. Implications for Theory and Practice
6.2. Limitations and Potential Future Research Directions
7. Conclusions
Author Contributions
Funding
Acknowledgments
Conflicts of Interest
References
- Tugcu, C.T.; Ozturk, I.; Aslan, A. Renewable and non-renewable energy consumption and economic growth relationship revisited: Evidence from G7 countries. Energy Econ. 2012, 34, 1942–1950. [Google Scholar] [CrossRef]
- Fernando, Y.; Hor, W.L. Impacts of energy management practices on energy efficiency and carbon emissions reduction: A survey of malaysian manufacturing firms. Resour. Conserv. Recycl. 2017, 126, 62–73. [Google Scholar] [CrossRef]
- International Energy Agency. Global Energy & CO2 Status Report. 2019. Available online: https://iea.org/reports/global-energy-co2-status-report-2019 (accessed on 12 October 2020).
- United Nations. Report of the Conference of the Parties on its Twenty-First Session. Addendum Part Two: Action Taken by the Conference of the Parties at its Twenty-First Session. Available online: https://unfccc.int/resource/docs/2015/cop21/eng/10a01.pdf (accessed on 12 October 2020).
- Saboori, B.; Sulaiman, J.; Mohd, S. Economic growth and CO2 emissions in malaysia: A cointegration analysis of the environmental kuznets curve. Energy Policy 2012, 51, 184–191. [Google Scholar] [CrossRef]
- Bukarica, V.; Tomšić, Ž. Energy efficiency policy evaluation by moving from techno-economic towards whole society perspective on energy efficiency market. Renew. Sustain. Energy Rev. 2017, 70, 968–975. [Google Scholar] [CrossRef]
- Cooremans, C.; Schönenberger, A. Energy management: A key driver of energy-efficiency investment? J. Clean. Prod. 2019, 230, 264–275. [Google Scholar] [CrossRef]
- May, G.; Kiritsis, D. Business model for energy efficiency in manufacturing. Procedia Cirp. 2017, 61, 410–415. [Google Scholar] [CrossRef]
- Marcinkowski, B.; Gawin, B. Data-driven business model development—Insights from the facility management industry. J. Facil. Manag. 2020, earlycite. [Google Scholar] [CrossRef]
- Gauthier, C.; Gilomen, B. Business models for sustainability: Energy efficiency in urban districts. Organ. Environ. 2016, 29, 124–144. [Google Scholar] [CrossRef]
- Hilorme, T.; Zamazii, O.; Judina, O.; Korolenko, R.; Melnikova, Y. Formation of risk mitigating strategies for the implementation of projects of energy saving technologies. Acad. Strateg. Manag. J. 2019, 18, 1–6. [Google Scholar]
- Environmental and Energy Study Institute. Energy Efficiency. Available online: https://www.eesi.org/topics/energy-efficiency/description (accessed on 7 March 2020).
- Pérez-Lombard, L.; Ortiz, J.; Velázquez, D. Revisiting energy efficiency fundamentals. Energy Effic. 2013, 6, 239–254. [Google Scholar] [CrossRef]
- Bhardwaj, K.; Gupta, E. Analyzing the “energy-efficiency gap”. Indian Growth Dev. Rev. 2017, 10, 66–88. [Google Scholar] [CrossRef]
- Chai, K.-H.; Baudelaire, C. Understanding the energy efficiency gap in Singapore: A motivation, opportunity, and ability perspective. J. Clean. Prod. 2015, 100, 224–234. [Google Scholar] [CrossRef]
- Johansson, M.T.; Thollander, P. A review of barriers to and driving forces for improved energy efficiency in swedish industry—Recommendations for successful in-house energy management. Renew. Sustain. Energy Rev. 2018, 82, 618–628. [Google Scholar] [CrossRef]
- Fresner, J.; Morea, F.; Krenn, C.; Uson, J.A.; Tomasi, F. Energy efficiency in small and medium enterprises: Lessons learned from 280 energy audits across Europe. J. Clean. Prod. 2017, 142, 1650–1660. [Google Scholar] [CrossRef]
- Jaffe, A.B.; Stavins, R.N. The energy-efficiency gap. What does it mean? Energy Policy 1994, 22, 804–810. [Google Scholar] [CrossRef]
- Solnørdal, M.T.; Foss, L. Closing the energy efficiency gap—A systematic review of empirical articles on drivers to energy efficiency in manufacturing firms. Energies 2018, 11, 518. [Google Scholar] [CrossRef]
- Hasan, A.S.M.; Rokonuzzaman, M.; Tuhin, R.A.; Salimullah, S.M.; Ullah, M.; Sakib, T.H.; Thollander, P. Drivers and barriers to industrial energy efficiency in textile industries of Bangladesh. Energies 2019, 12, 1775. [Google Scholar] [CrossRef]
- Zobel, T.; Malmgren, C. Evaluating the management system approach for industrial energy efficiency improvements. Energies 2016, 9, 774. [Google Scholar] [CrossRef]
- Marchi, B.; Zanoni, S. Supply chain management for improved energy efficiency: Review and opportunities. Energies 2017, 10, 1618. [Google Scholar] [CrossRef]
- Wang, C.N.; Ho, H.X.T.; Hsueh, M.H. An integrated approach for estimating the energy efficiency of seventeen countries. Energies 2017, 10, 1597. [Google Scholar] [CrossRef]
- Lin, J.; Xu, C. The impact of environmental regulation on total factor energy efficiency: A cross-region analysis in China. Energies 2017, 10, 1578. [Google Scholar] [CrossRef]
- Cagno, E.; Trianni, A.; Spallina, G.; Marchesani, F. Drivers for energy efficiency and their effect on barriers: Empirical Evidence from Italian manufacturing enterprises. Energy Effic. 2016, 10, 855–869. [Google Scholar] [CrossRef]
- Worrell, E.; Bernstein, L.; Roy, J.; Price, L.; Harnisch, J. Industrial energy efficiency and climate change mitigation. Energy Effic. 2009, 2, 109. [Google Scholar] [CrossRef]
- Thollander, P.; Backlund, S.; Trianni, A.; Cagno, E. Beyond barriers—A case study on driving forces for improved energy efficiency in the foundry industries in Finland, France, Germany, Italy, Poland, Spain, and Sweden. Appl. Energy 2013, 111, 636–643. [Google Scholar] [CrossRef]
- Cai, W.; Lai, K.-H.; Liu, C.; Wei, F.; Ma, M.; Jia, S.; Jiang, Z.; Lv, L. Promoting sustainability of manufacturing industry through the lean energy-saving and emission-reduction strategy. Sci. Total Environ. 2019, 665, 23–32. [Google Scholar] [CrossRef]
- Avgerinou, M.; Bertoldi, P.; Castellazzi, L. Trends in data centre energy consumption under the european code of conduct for data centre energy efficiency. Energies 2017, 10, 1470. [Google Scholar] [CrossRef]
- Yuan, X.; Ma, R.; Zuo, J.; Mu, R. Towards a sustainable society: The status and future of energy performance contracting in China. J. Clean. Prod. 2016, 112, 1608–1618. [Google Scholar] [CrossRef]
- Tang, T.; Hill, H. Implementation and impacts of intergovernmental grant programs on energy efficiency in the USA. Curr. Sustain. Renew. Energy Rep. 2018, 5, 59–66. [Google Scholar] [CrossRef]
- Guerrini, A.; Romano, G.; Indipendenza, A. Energy efficiency drivers in wastewater treatment plants: A double bootstrap DEA analysis. Sustainability 2017, 9, 1126. [Google Scholar] [CrossRef]
- Gawin, B.; Marcinkowski, B. Business intelligence in facility management: Determinants and benchmarking scenarios for improving energy efficiency. Inf. Syst. Manag. 2017, 34, 347–358. [Google Scholar] [CrossRef]
- Backlund, S.; Thollander, P.; Palm, J.; Ottosson, M. Extending the energy efficiency gap. Energy Policy 2012, 51, 392–396. [Google Scholar] [CrossRef]
- Schulze, M.; Nehler, H.; Ottosson, M.; Thollander, P. Energy management in industry—A systematic review of previous findings and an integrative conceptual framework. J. Clean. Prod. 2016, 112, 3692–3708. [Google Scholar] [CrossRef]
- Ameli, N.; Brandt, N. Determinants of households’ investment in energy efficiency and renewables: Evidence from the OECD survey on household environmental behaviour and attitudes. Environ. Res. Lett. 2015, 10, 044015. [Google Scholar] [CrossRef]
- Harris, J.; Anderson, J.; Shafron, W. Investment in energy efficiency: A survey of Australian firms. Energy Policy 2000, 28, 867–876. [Google Scholar] [CrossRef]
- Riehle, D.M.; Fleischer, S.; Becker, J. A web-based information system to evaluate different versions of IT artefacts in online experiments. AIS Trans. Enterp. Syst. 2019, 4, 10. [Google Scholar] [CrossRef]
- Stal, J.; Paliwoda-Pekosz, G. Fostering development of soft skills in ICT curricula: A case of a transition economy. Inf. Technol. Dev. 2019, 25, 250–274. [Google Scholar] [CrossRef]
- March, S.T.; Storey, V.C. Design science in the information systems discipline: An introduction to the special issue on design science research. Mis. Q. 2008, 32, 725–730. [Google Scholar] [CrossRef]
- Mendling, J. From scientific process management to process science: Towards an empirical research agenda for business process management. In Proceedings of the 8th ZEUS Workshop, Vienna, Austria, 27–28 January 2016; pp. 1–4. [Google Scholar]
- Offermann, P.; Blom, S.; Schönherr, M.; Bub, U. Artifact types in information systems design science—A literature review. Lect. Notes Comput. Sci. 2010, 6105, 77–92. [Google Scholar] [CrossRef]
- Hevner, A.R.; March, S.T.; Park, J.; Ram, S. Design science in information systems research. Mis. Q. 2004, 28, 75–105. [Google Scholar] [CrossRef]
- Murphy, A.; Tucker, H.; Coyne, M.; Touryalai, H. GLOBAL 2000. The World’s Largest Public Companies; Forbes: Jersey City, NJ, USA, 2020. [Google Scholar]
- Coulter, L.M. Energy for a better future. Annual Report and Accounts for the Year Ended December 31, 2019; Royal Dutch Shell PLC: Hague, The Netherlands, 2020. [Google Scholar]
- Fowlie, M.; Greenstone, M.; Wolfram, C. Do energy efficiency investments deliver? Evidence from the weatherization assistance program. Q. J. Econ. 2018, 133, 1597–1644. [Google Scholar] [CrossRef]
- Zivin, J.G.; Novan, K. Upgrading efficiency and behavior: Electricity savings from residential weatherization programs. Energy J. 2016, 37, 1–24. [Google Scholar] [CrossRef]
- Themistocleous, M.; Soja, P.; Cunha, P.R. The same, but different: Enterprise systems adoption lifecycles in transition economies. Inf. Syst. Manag. 2011, 28, 223–239. [Google Scholar] [CrossRef]
- Soja, P.; Cunha, P.R. ICT in transition economies: Narrowing the research gap to developed countries. Inf. Technol. Dev. 2015, 21, 323–329. [Google Scholar] [CrossRef]


| Step | Description | ||
|---|---|---|---|
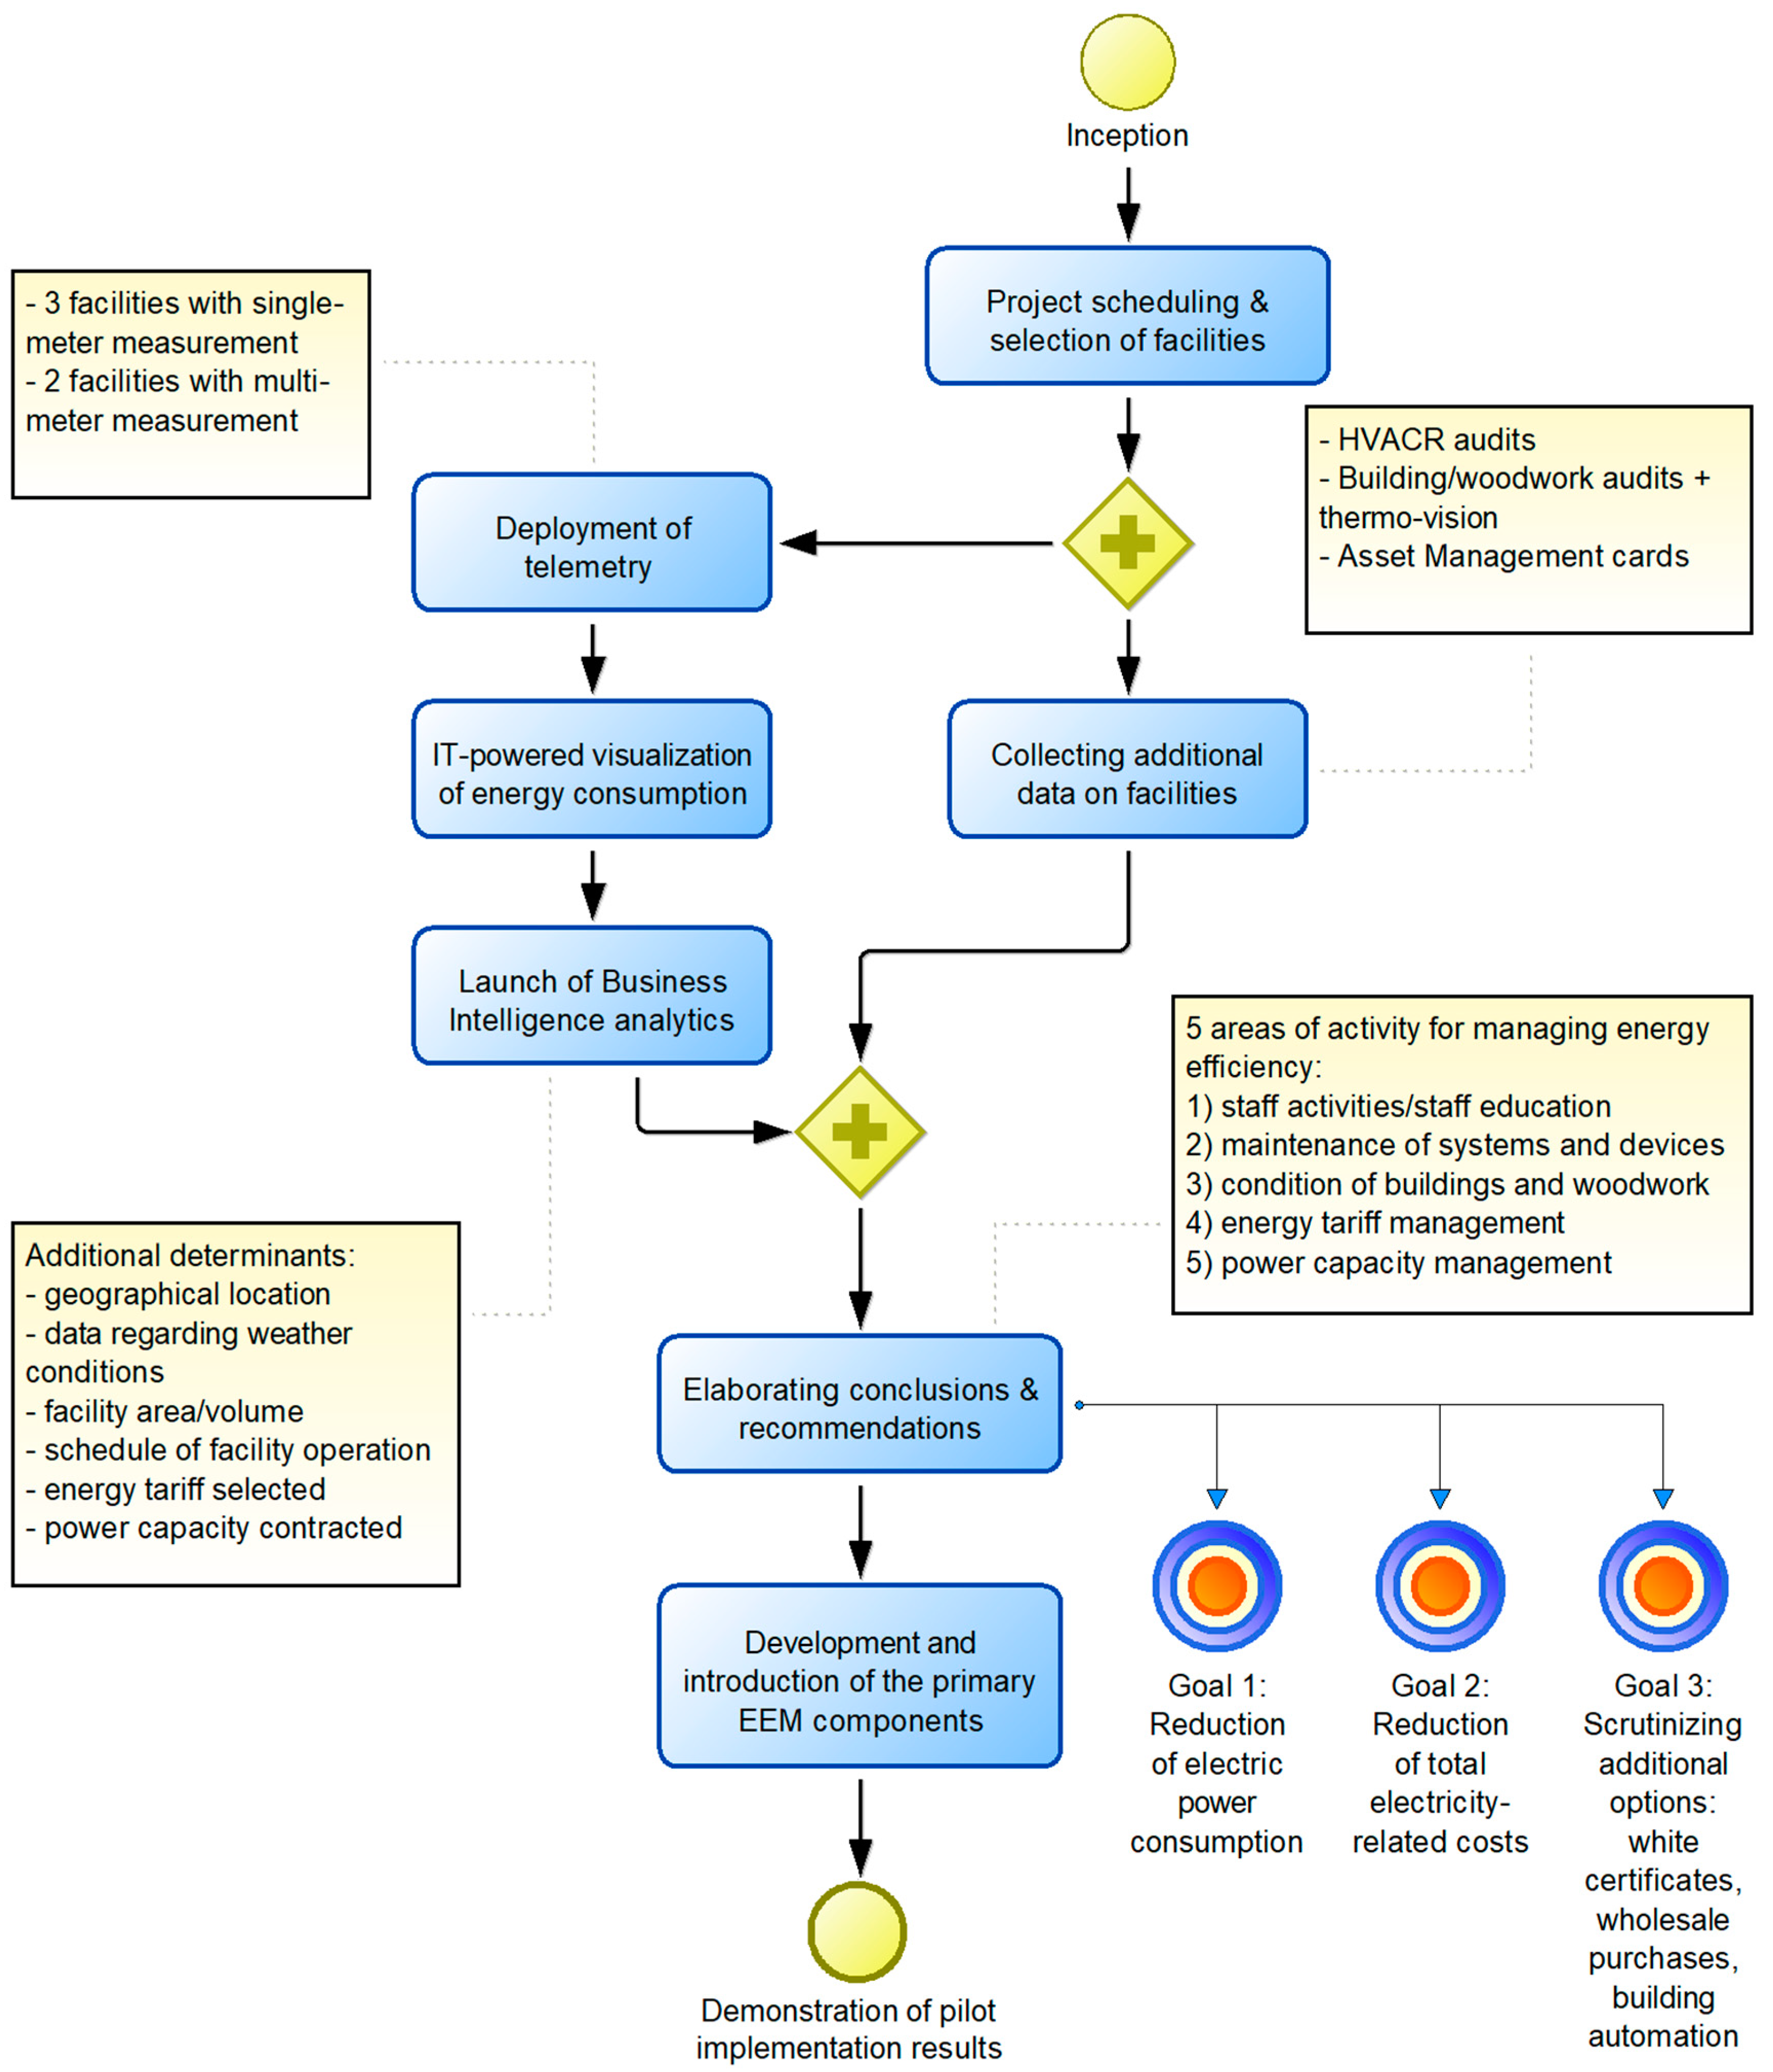
| Inception | The prerequisites for the pilot works include the readiness of both the provider of a telemetry system for measuring power consumption and the customer to jointly develop and test the foundations of the EEM on a small pool of facilities. | ||
| Project scheduling & selection of facilities | Five facilities shall be designated by the customer to create a pool of entities covered by pilot works. Measurement of the power consumption exclusively on the main power input is assumed regarding two facilities. Another two shall be provided with a multi-meter environment. Such an approach enables performing test measurements for both configurations and identifying their advantages and disadvantages. On top of selecting the facilities, a timetable and rules for telemetry installations shall be worked out. | ||
| Further steps to be carried out simultaneously | |||
| Step | Description | Step | Description |
| Deployment of telemetry | Putting the measurement environment in place will not require ceasing the operations of any facility. Short breaks are expected on some retail circuits (HVACR, light sources). The estimated duration of a single installation varies from 2 to 6 h per facility. | Collecting additional data on facilities | In line with telemetry readings, additional data on facilities shall be collected and processed. The sources of knowledge include:
|
| IT-powered visualization of energy consumption | Consumption-related data are to be visualized using a dedicated IT solution. Access to reports shall be provided via a web browser. | ||
| Launch of Business Intelligence analytics | Power consumption measurements are to be benchmarked against several determinants:
| ||
| Follow-through upon completing the aforementioned activities | |||
| Step | Description | ||
| Elaborating conclusions & recommendations | A document addressing cost reduction opportunities for the customer shall be delivered. In particular, options to be explored in the following areas of EEM are to be unveiled:
| ||
| Development and introduction of the primary EEM components | Priority items that may be immediately streamlined in terms of EE are to be pointed out in this phase. Such potential decisions include, but are not limited to, switching tariffs, rehauling or fine-tuning devices, introducing simple automation of devices, forcing certain behaviors of the staff, etc. | ||
| Demonstration of pilot implementation results | A physical meeting of the interested parties that summarizes the works accomplished throughout the implementation. | ||
| Area of Activity | Estimated Reduction in Power Consumption [% of Current kWh] | Estimated Cost Reduction [% of Pre-Implementation Invoice Amounts] |
|---|---|---|
| Staff activities/staff education | 7% | 7% |
| Maintenance of systems and devices | (7%) | (7%) |
| Condition of buildings and woodwork | (5%) | (6%) |
| Energy tariff management | n/a | 8% |
| Power capacity management | n/a | 3% |
| Total | 18% (31%) |
| Year | Phase of Contract | Description |
|---|---|---|
| 1 | The inception of the EE improvement contract | Based on the feedback of the pilot project implementation, the contract between the interested parties shall be drafted and then carried into effect. The contract itself aims to reduce the electric power consumption/costs owing through the design, implementation and continuously enhanced EEM measures on the customer side. |
| Introduction of the EEM measures | Accomplishing the following tasks:
| |
| Progress towards the goal (1st-year milestone) | Summarizing the first year of the contract. Verifying the achievement of the adopted partial goals and indicators. Laying down detailed goals and indicators for the following year. | |
| 2 | Refinement and monitoring of the EEM measures | Based on the experience gained and taking advantage of the database being populated with annual telemetry data, EE improvement shall go on. This involves in particular:
|
| Progress towards the goal (2nd-year milestone) | Summarizing the second year of the contract. Verifying the achievement of the adopted partial goals and indicators. Laying down detailed goals and indicators for the final year. | |
| 3 | Development and diffusion of the EEM measures | Cleaning the project backlog of implementation-related activities, continuous improvement, and verifying the efficacy of measures in place. Adjusting all internal business processes on the customer side in line with the EE improvement best practices and available toolset. |
| Progress towards the goal (3rd-year milestone) | Summarizing the third year of the contract. Verifying the achievement of the adopted partial goals and indicators. Laying down detailed goals and indicators for the foreseeable future. | |
| N/A | Continuous use and development of EEM | Further workflows related to developing techniques, tools, and best practices in EEM. Maintaining results achieved to date. |
Publisher’s Note: MDPI stays neutral with regard to jurisdictional claims in published maps and institutional affiliations. |
© 2020 by the authors. Licensee MDPI, Basel, Switzerland. This article is an open access article distributed under the terms and conditions of the Creative Commons Attribution (CC BY) license (http://creativecommons.org/licenses/by/4.0/).
Share and Cite
Gawin, B.; Marcinkowski, B. Setting up Energy Efficiency Management in Companies: Preliminary Lessons Learned from the Petroleum Industry. Energies 2020, 13, 5604. https://doi.org/10.3390/en13215604
Gawin B, Marcinkowski B. Setting up Energy Efficiency Management in Companies: Preliminary Lessons Learned from the Petroleum Industry. Energies. 2020; 13(21):5604. https://doi.org/10.3390/en13215604
Chicago/Turabian StyleGawin, Bartlomiej, and Bartosz Marcinkowski. 2020. "Setting up Energy Efficiency Management in Companies: Preliminary Lessons Learned from the Petroleum Industry" Energies 13, no. 21: 5604. https://doi.org/10.3390/en13215604
APA StyleGawin, B., & Marcinkowski, B. (2020). Setting up Energy Efficiency Management in Companies: Preliminary Lessons Learned from the Petroleum Industry. Energies, 13(21), 5604. https://doi.org/10.3390/en13215604