Article

Effectiveness of Instruments Supporting Inter-Organizational Cooperation in the RES Market in Europe. Case Study of Enterprise Europe Network

1
Department of Economics and Enterprise Organization, Cracow University of Economics, 31-510 Krakow, Poland
2
Department of Applications of Mathematics in Economics, Faculty of Management, AGH University of Science and Technology, 30-067 Kraków, Poland
3
Department of Organizational Management and Social Capital, Faculty of Management, AGH University of Science and Technology, 30-067 Krakow, Poland
4
Faculty of Production and Power Engineering, University of Agriculture in Krakow, 30-149 Kraków, Poland
5
Faculty of Agriculture and Economics, University of Agriculture in Krakow, 31-121 Kraków, Poland
*
Author to whom correspondence should be addressed.
Energies 2020, 13(23), 6443; https://doi.org/10.3390/en13236443
Submission received: 14 November 2020 / Revised: 27 November 2020 / Accepted: 3 December 2020 / Published: 5 December 2020

Abstract

:
In the renewable energy source (RES) market, which is highly atomized, business events play an important role in supporting inter-organizational cooperation. The aim of this paper was to examine the impact of three characteristics of the events, namely, the location of the event, type of event (brokerage event versus company mission), and type of leading partner (public versus private), on the effectiveness of the business events (expressed by the number of meetings during an event and the number of partnerships initiated as a result of these meetings). We analyzed 304 promotional events organized in the European RES market. We employed basic statistical tests to verify our hypotheses. Our findings suggest that (1) the numbers of meetings and partnerships differ depending on the event’s location (country and region of Europe), (2) the type of the event (brokerage event versus company mission) affects the numbers of meetings and partnerships (in particular, during brokerage events (BEs), significantly more meetings take place than during company meetings (CMs)), and (3) the type of an event’s leading partner (public versus private) has no impact on the numbers of meetings and partnerships. With its findings, this paper contributes to RES market development and the theory of inter-organizational relations. It presents meaningful implications and recommendations for enterprises, business networks, and event managers operating in RES markets.

1. Introduction

Society and the economy face a challenge of the transformation of the structure of energy sources. According to the Directive (EU) 2018/2001 of the European Parliament and of the Council of 11 December 2018 on the promotion of the use of energy from renewable sources, by 2030, at least 27% of the energy consumed in the EU is to come from renewable sources [1,2,3,4,5,6]. The implementation of this plan will have a positive impact on the quality of the natural environment. In particular, the highly innovative energy and environmental technologies open up the possibility of minimizing the negative impact of human intervention on the natural environment, including the emissions of air pollutants and greenhouse gases into the atmosphere. At the same time, they increase the competitiveness of economies [7,8,9,10,11,12].
The enterprises play a crucial role in this long-term process. Their capacity and efficiency determine the pace of the transformation. Renewable energy production often depends on local or regional small and medium enterprises (SMEs). The market for the production and assembly of equipment for obtaining renewable energy is fragmented/has a different structure in individual European countries [13,14]. The development of SMEs resulting from their involvement in renewable energy source (RES) technologies may have a positive impact on stimulating the development of small businesses, sustainable growth, and high-quality employment, which are created in the EU Member States by regional and local investments in renewable energy production.
However, most SMEs suffer from resource limitations. One way to overcome these limitations is to leverage external resources by collaborating with other entities. Therefore, from the point of view of the development of the RES market and the dissemination of RES technologies, it is important to support this cooperation. Regional and industry-specific business networks, including technology transfer networks and centers, can play an important role in this process [15]. They can organize meetings and integrate environments to stimulate inter-organizational cooperation and thus contribute to the improvement of innovation and the development of RES technologies. According to Erickson and Chapman [16], RES technology transfer and collaboration would be a supply impulse on the RES market.
One of the ways to overcome the limitations faced by SMEs in the RES market is external cooperation. Inter-organizational cooperation occurs within a frame of supply chains, network structures, alliances, and industrial clusters. Enterprises cooperate with suppliers, customers, non-business bodies (e.g., public authorities), and even competitors [17,18]. Collaboration occurs “when a group of autonomous stakeholders of a problem domain engages in an interactive process, using shared rules, norms, and structures, to act or decide on issues related to that domain” [19]. External linkages may be a source of relational rents and competitive advantages [20]. In particular, collaboration leads to an increase in firm performance [21,22,23]. Additionally, organizations cooperate with others to overcome limitations of access to resources [24] and to enhance innovativeness [25]. Moreover, inter-organizational cooperation is positively correlated with entrepreneurial orientation, and it impacts firm performance as strongly as proactiveness [26]. Consequently, we assume that strengthening inter-organizational cooperation can significantly support the development of enterprises operating in the RES market as well as the overall RES market.
Despite numerous studies on inter-organizational cooperation, business networks, and the RES technology and market, there is a research gap related to supporting inter-organizational cooperation among enterprises operating in the RES market. In particular, the literature lacks studies on the efficiency of instruments dedicated to supporting cooperation among these enterprises. This also applies to the instruments for the promotion of RES technologies in the technology transfer network, especially public networks.
The article is a continuation of the research conducted by the authors in their research laboratory [14]. This paper presents the results of research focused on the instruments used by the Enterprise Europe Network. This study aimed to fulfill the above-indicated research gap and to examine the effectiveness of instruments supporting cooperation among enterprises operating in the European RES market. In particular, this study intended to examine how the effectiveness of events (measured by the number of partnership-building meetings and the number of established partnerships) is affected by:
  • The location of the event (country and region of Europe where it takes place);
  • The type of activity (brokerage event versus company mission);
  • The main supporting partner (public versus private).
Furthermore, we aimed to propose recommendations for entities managing events; these recommendations are to help them to adjust the event’s profile regarding the location, type of event, and type of the main partner to increase the event’s efficiency in terms of facilitating inter-organization cooperation in the RES market. This study intended to contribute to RES market development and inter-organizational relations theory. The planned indication of the ways to increase the effectiveness of the instruments used in the RES market, along with an explanation of the role of business networks and events organized within these networks in strengthening the inter-organizational cooperation, indicates the significance of the study.
The remainder of the article includes the following parts: a literature review and hypothesis development, the methodology, the results, the theoretical implications and a discussion, the limitations of the analysis, and future research and conclusions.

2. Literature Review and Hypothesis Development

Inter-organizational cooperation is one of the antecedents leading to business networking. Business networks consist of actors and relationships (ties). Business networks also incorporate resources, rules, norms, and sanctions that regulate the interactions among a network’s actors [27]. Networking provides access to advice, information, knowledge, expertise, and finances, as well as business contacts or emotional support [28]. Networking plays a crucial role in building and developing social capital [29]. Participation in business networks is expected to increase a firm’s performance [30] and innovation [31]. In particular, business networks have an impact on communication, information exchange, the access to knowledge, and, consequently, the reduction of total costs [32], enhancing the efficiency of operation [33] Additionally, business networking can facilitate capturing emerging business opportunities [33,34]. However, larger entrepreneurial networks are not always more beneficial than smaller ones [35]. Networking is perceived as a strategic resource for small- and medium-sized enterprises (SMEs) [36]; cooperation with other enterprises helps them to overcome limitations of access to resources [24], obtain access to new markets, and increase the level of their innovativeness [37]. Thus, network relationships are perceived as a source of competitive advantage [38]. The role of networking is highlighted in the network theory of competitive advantage [39]. In this line, the advantages of firms embedded in the network are linked [40].
Business networks are an important element of the business ecosystem, and they can significantly strengthen business activity. Thus, public policy should support the network’s development, including subsidizing private network brokers [41]. Business networks play an important role, especially in emerging markets or underdeveloped regions [42]. Those that are formalized represent a higher capacity [43]. In terms of fostering innovation, innovation brokers play a special role [7]. They are broadly defined as “organizations supporting collaboration between two or more parties at different stages of the innovation process” [14]. The role of innovation brokers covers a wide range of services, from liaising between the parties, to establishing and mediating relationships, to filling a wide range of knowledge, competence, and skill gaps [14].
Previous research has shown that many events are organized on the RES market with the view of supporting the development of RESs by promoting technologies and initiating cooperation [7,14]. The current analysis aims at deepening the previous observations in the context of the effectiveness of organized events in terms of cooperation support. Bresci and Malerba [41] posit a sector’s impact on the innovation system. Thus, the RES sectoral innovation system may differ from other sectors and requires examination. Earlier research has shown a significant geographic diversity in the types of events used. Numerous studies indicate the impact of the external environment on the functioning of enterprises [44,45,46]. Therefore, it is assumed that this diversity is related to local conditions and may be associated with the different effectiveness of individual types of events in different locations. Therefore, we propose the following hypotheses:
Hypothesis H1.
An event’s location has a significant impact on the event’s effectiveness in terms of supporting inter-organizational cooperation in RES markets.
Hypothesis H2.
An event’s type has a significant impact on the event’s effectiveness in terms of supporting inter-organizational cooperation in RES markets.
Our previous research [14] showed the diversity of organized events in terms of the type of supporting partner, divided by private and public partners. The two types of actors can have different approaches to supporting business networks and sharing knowledge, and can experience different limitations [46]. In this study, we wanted to assess whether the choice of supporting partner impacted the effectiveness of the event in the context of supporting cooperation between market participants. Therefore, we proposed:
Hypothesis H3.
The type of an event’s supporting partner has a significant impact on the event’s effectiveness in terms of supporting inter-organizational cooperation in RES markets.

3. Materials and Methods

3.1. Sample

Our sample comprised promotional events organized by the Enterprise Europe Network (EEN) in the RES market in Europe. The EEN is the world’s largest network for technology transfer and business and innovation support. It consists of 625 partner organizations located in over 60 countries [7,8,14]. A statistical and visual analysis of RES promotion instruments (events) was carried out based on data obtained from the EEN from the years 2017 to 2018. From the entire database numbering 2131 records, only events related to the promotion of RESs and taking place in Europe were selected. As a result of the filtering, 304 promotional events were analyzed, divided into two types: brokerage events (BEs) and company missions (CMs). A brokerage event is a direct form of searching for a partner for cooperation. It enables the exchange of information on innovative technologies and new trends, as well as searching for business and technological partners. A company mission is a direct form of reaching the right potential business partner in the natural place of their activity. It allows familiarization not only with their possibilities but also with their immediate business and legal environment [8,14]. Both types of events provide opportunities to hold meetings and initiate partnerships. Thus, they can be considered as instruments supporting cooperation between organizations.

3.2. Variables, Structure of Data, and Description of Statistical Methods

This study examined the effectiveness of instruments supporting inter-organizational cooperation in RES markets. The effectiveness was measured with two variables: the number of meetings during events and the number of established partnerships initiated as a result of these meetings. These two factors were our dependent variables. Our independent variables were three characteristics of the events, namely, the location of the event, type of event (brokerage event versus company mission), and type of leading partner (public versus private).
The first stage of statistical analysis was divided into two parts. In the first part, the numeric data regarding the meetings, which took place as part of the promotional events recorded in the EEN database, were analyzed. On the other hand, the second part of the study included data on the number of partnerships established between the entities participating in these events.
The preliminary results of the analysis of the number of meetings taking place within the studied cases lead to the conclusion that no meeting took place during a significant part of the events. Out of 304 analyzed events, no meetings were recorded in over 86 cases. Thus, at every fourth promotional event, on average, there was no meeting. This may be due to the fact that the organizer of the leading event developed the program independently and did not propose cooperation to the EEN.
To approximate the structure of the number of meetings held as part of individual promotional events registered in the EEN database, Table 1 presents basic descriptive statistics for events from all over Europe in total.
When analyzing the values of the above statistics, a very large difference can be noticed between the average value of the number of meetings and the median. Statistically, there were approx. 137 meetings per one of the 304 analyzed events, while the median for the number of meetings was much lower, approx. 55.5. This conclusion is confirmed by the value of the coefficient of variation, which is over 176%, indicating a significant variation in the number of meetings. This fact is additionally confirmed by the value of the range. The difference between the highest and lowest number of matches is 1446. The values of the above statistics may point to high outliers. The results obtained were also significantly impacted by the occurrence of a large group of events during which no meetings were recorded. In conclusion, in the part of the analysis concerning the number of meetings, attention is drawn to the fact that there is a large variation in the number of meetings for individual events. The results of the above analysis and the significant variation in the tested values may lead to the formulation of hypotheses regarding the factors that differentiate the number of meetings during the studied events.
When analyzing the data on the declared cooperation following a promotional event, it can also be noticed that there were a significant number of events that did not develop into any cooperation. Out of 304 analyzed events, in 38% of cases, no cooperation was recorded. Thus, the participants of three out of five promotional events, on average, showed a willingness to cooperate.
Determining the basic descriptive statistics for the number of partnerships recorded in the EEN database would help to better characterize this variable. The obtained results (see Table 2), similarly to the analysis of the meetings, indicate a large diversity of the studied set.
The first symptom is a significant difference between the mean and the median. The analysis shows that, on average, a promotional event generated approx. 32 business connections. However, the median for this value is only 5. The large disproportion in the data is additionally demonstrated by the coefficient of variation amounting to over 260%. This proves that the analyzed data are very diverse. Therefore, there are two conclusions that emerge from this analysis. First of all, a significant proportion of the meetings did not have any effect in the form of cooperation. Secondly, there are large disproportions in the values determining the number of partnerships undertaken for the analyzed data set.
As already mentioned, the indicated large differences in the sets, concerning the number of meetings and the number of partnerships, could be related to the existence of factors that significantly differentiate the analyzed events in the studied aspects.
Therefore, in this study, two categories of factors were selected, the impact of which on the numbers of meetings and partnerships was examined. The first factor is a geographical one, related to the place where the event took place, i.e., in which part of Europe and in which country. The second group of factors is related to the type of event, i.e., its form, and the type of partner supporting the event. The choice of such factors is related to the fact that the event organizer can decide on the event’s place, its form, and potential partners.
In order to analyze the impact of selected factors on the number of meetings and the number of partnerships during the analyzed events, limit values were defined for three intervals to determine the size level based on the 33rd and 66th percentiles. To determine them, only the cases were used in which at least one meeting took place. Thus, four classes were created to define the level of interest in the meetings, expressed as the number of meetings and the number of partnerships.
In the case of the number of meetings, the division into individual classes based on the above-mentioned percentiles was as follows:
Level 0—no meetings;
Level 1—low number of meetings—for events with 1 to 61 meetings;
Level 2—average number of meetings—for events with 62 to 142 meetings;
Level 3—large number of meetings—for events with more than 142 meetings.
For the number of partnerships, individual promotional events were grouped according to the following scheme:
Level 0—no partnerships;
Level 1—low number of partnerships—for events with 1 to 9 partnerships;
Level 2—average number of partnerships—for events with 10 to 32 partnerships;
Level 3—large number of partnerships—for events with more than 32 partnerships.
Moreover, in the analysis of the influence of selected factors, the additional basic measures of location and dispersion were compared for the number of meetings and for the number of instances of cooperation, respectively. In order to verify the statistical significance of the indicated differences, appropriate statistical tests were used.
In order to verify the occurrence of differences in the structure of the number of meetings and the number of partnerships, the chi-square test of independence, also called the Pearson independence test [47], was used. The comparative analysis of the position measures was performed using the one-way ANOVA test and Student’s t-test [47], which allows determining the significance of the variation in the arithmetic mean among the indicated groups. Since these tests require meeting relevant assumptions [47], in situations where applying them was not possible (the data did not meet the appropriate assumptions), one of the two following tests was used—the Mann–Whitney U test and the Kruskal–Wallis test [48,49]—in which, instead of the arithmetic mean values, the significance of the differentiation of a given characteristic is determined by comparing the medians. These tests require data to meet far fewer assumptions. In the analyses in question, all the assumptions required for the described tests were met. The hypotheses were verified with a 5% significance level. The above-described tests and analyses were carried out with the Statgraphics 18 software (Statgraphics Technologies, Inc., The Plains, VA, USA), while the graphs and drawings included in the article were prepared using Excel (Microsoft, Redmond, WA, USA) and Corel Draw software (Corel, Ottawa, Canada).

4. Results

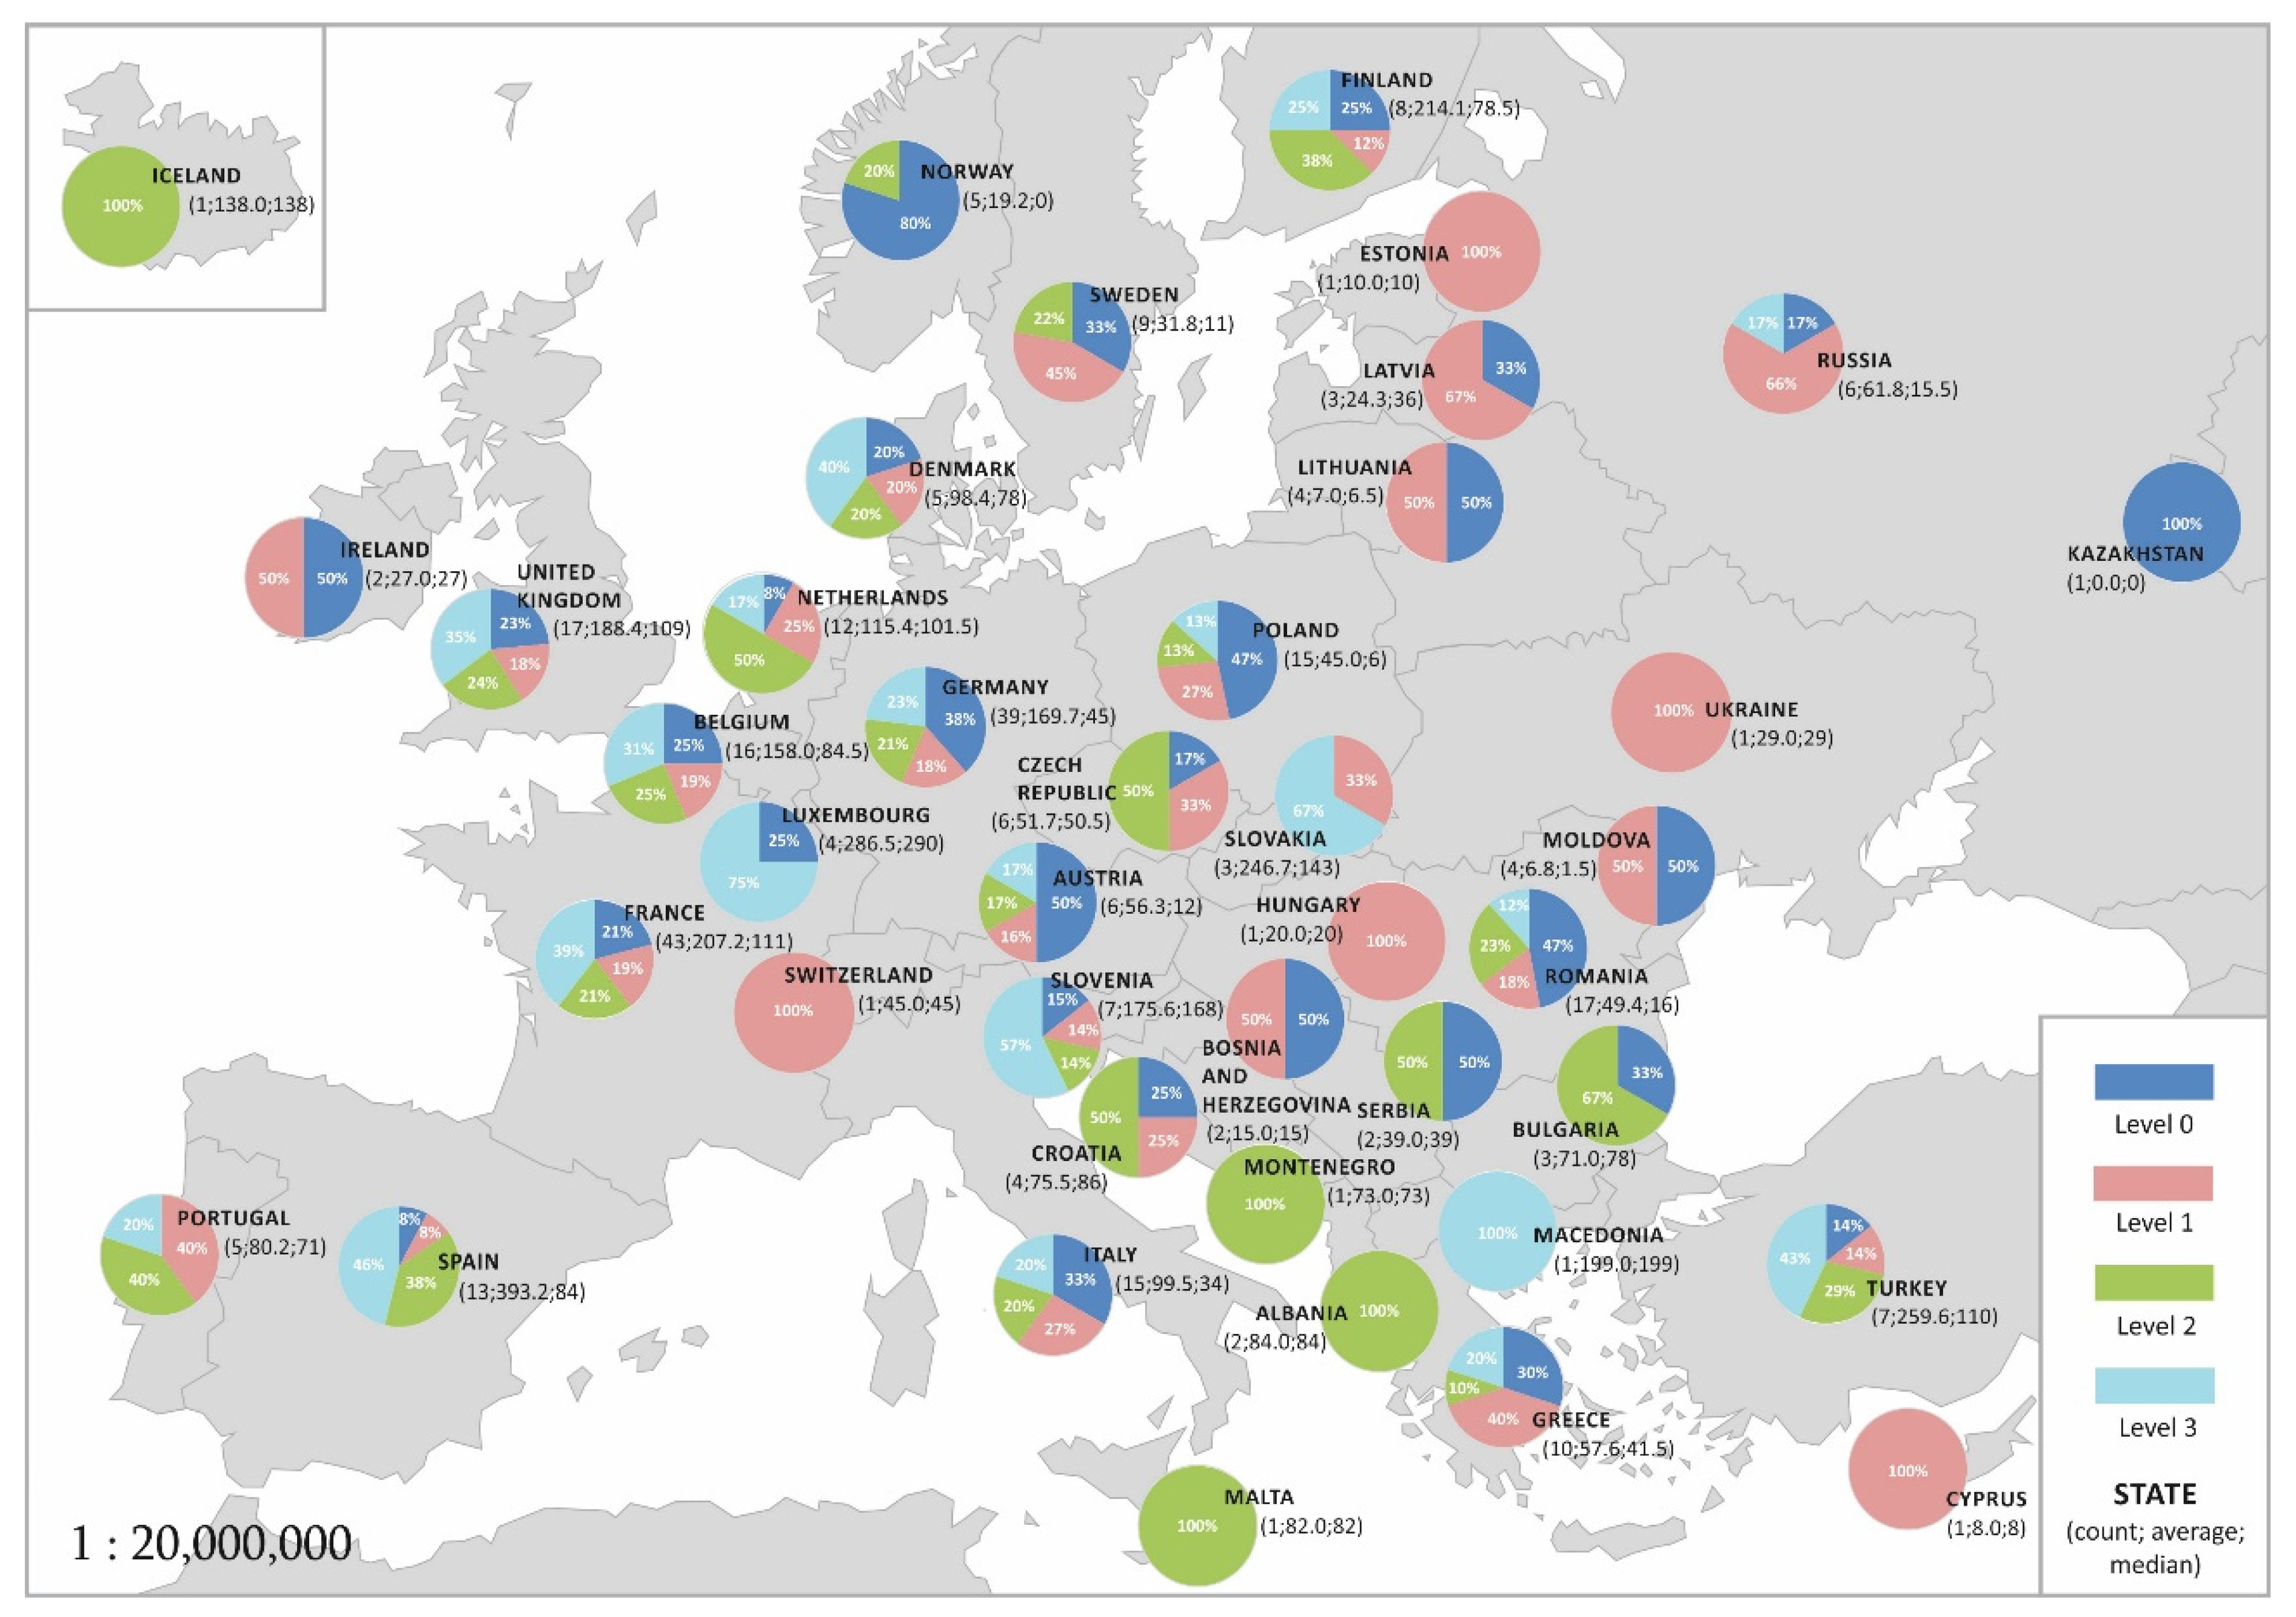
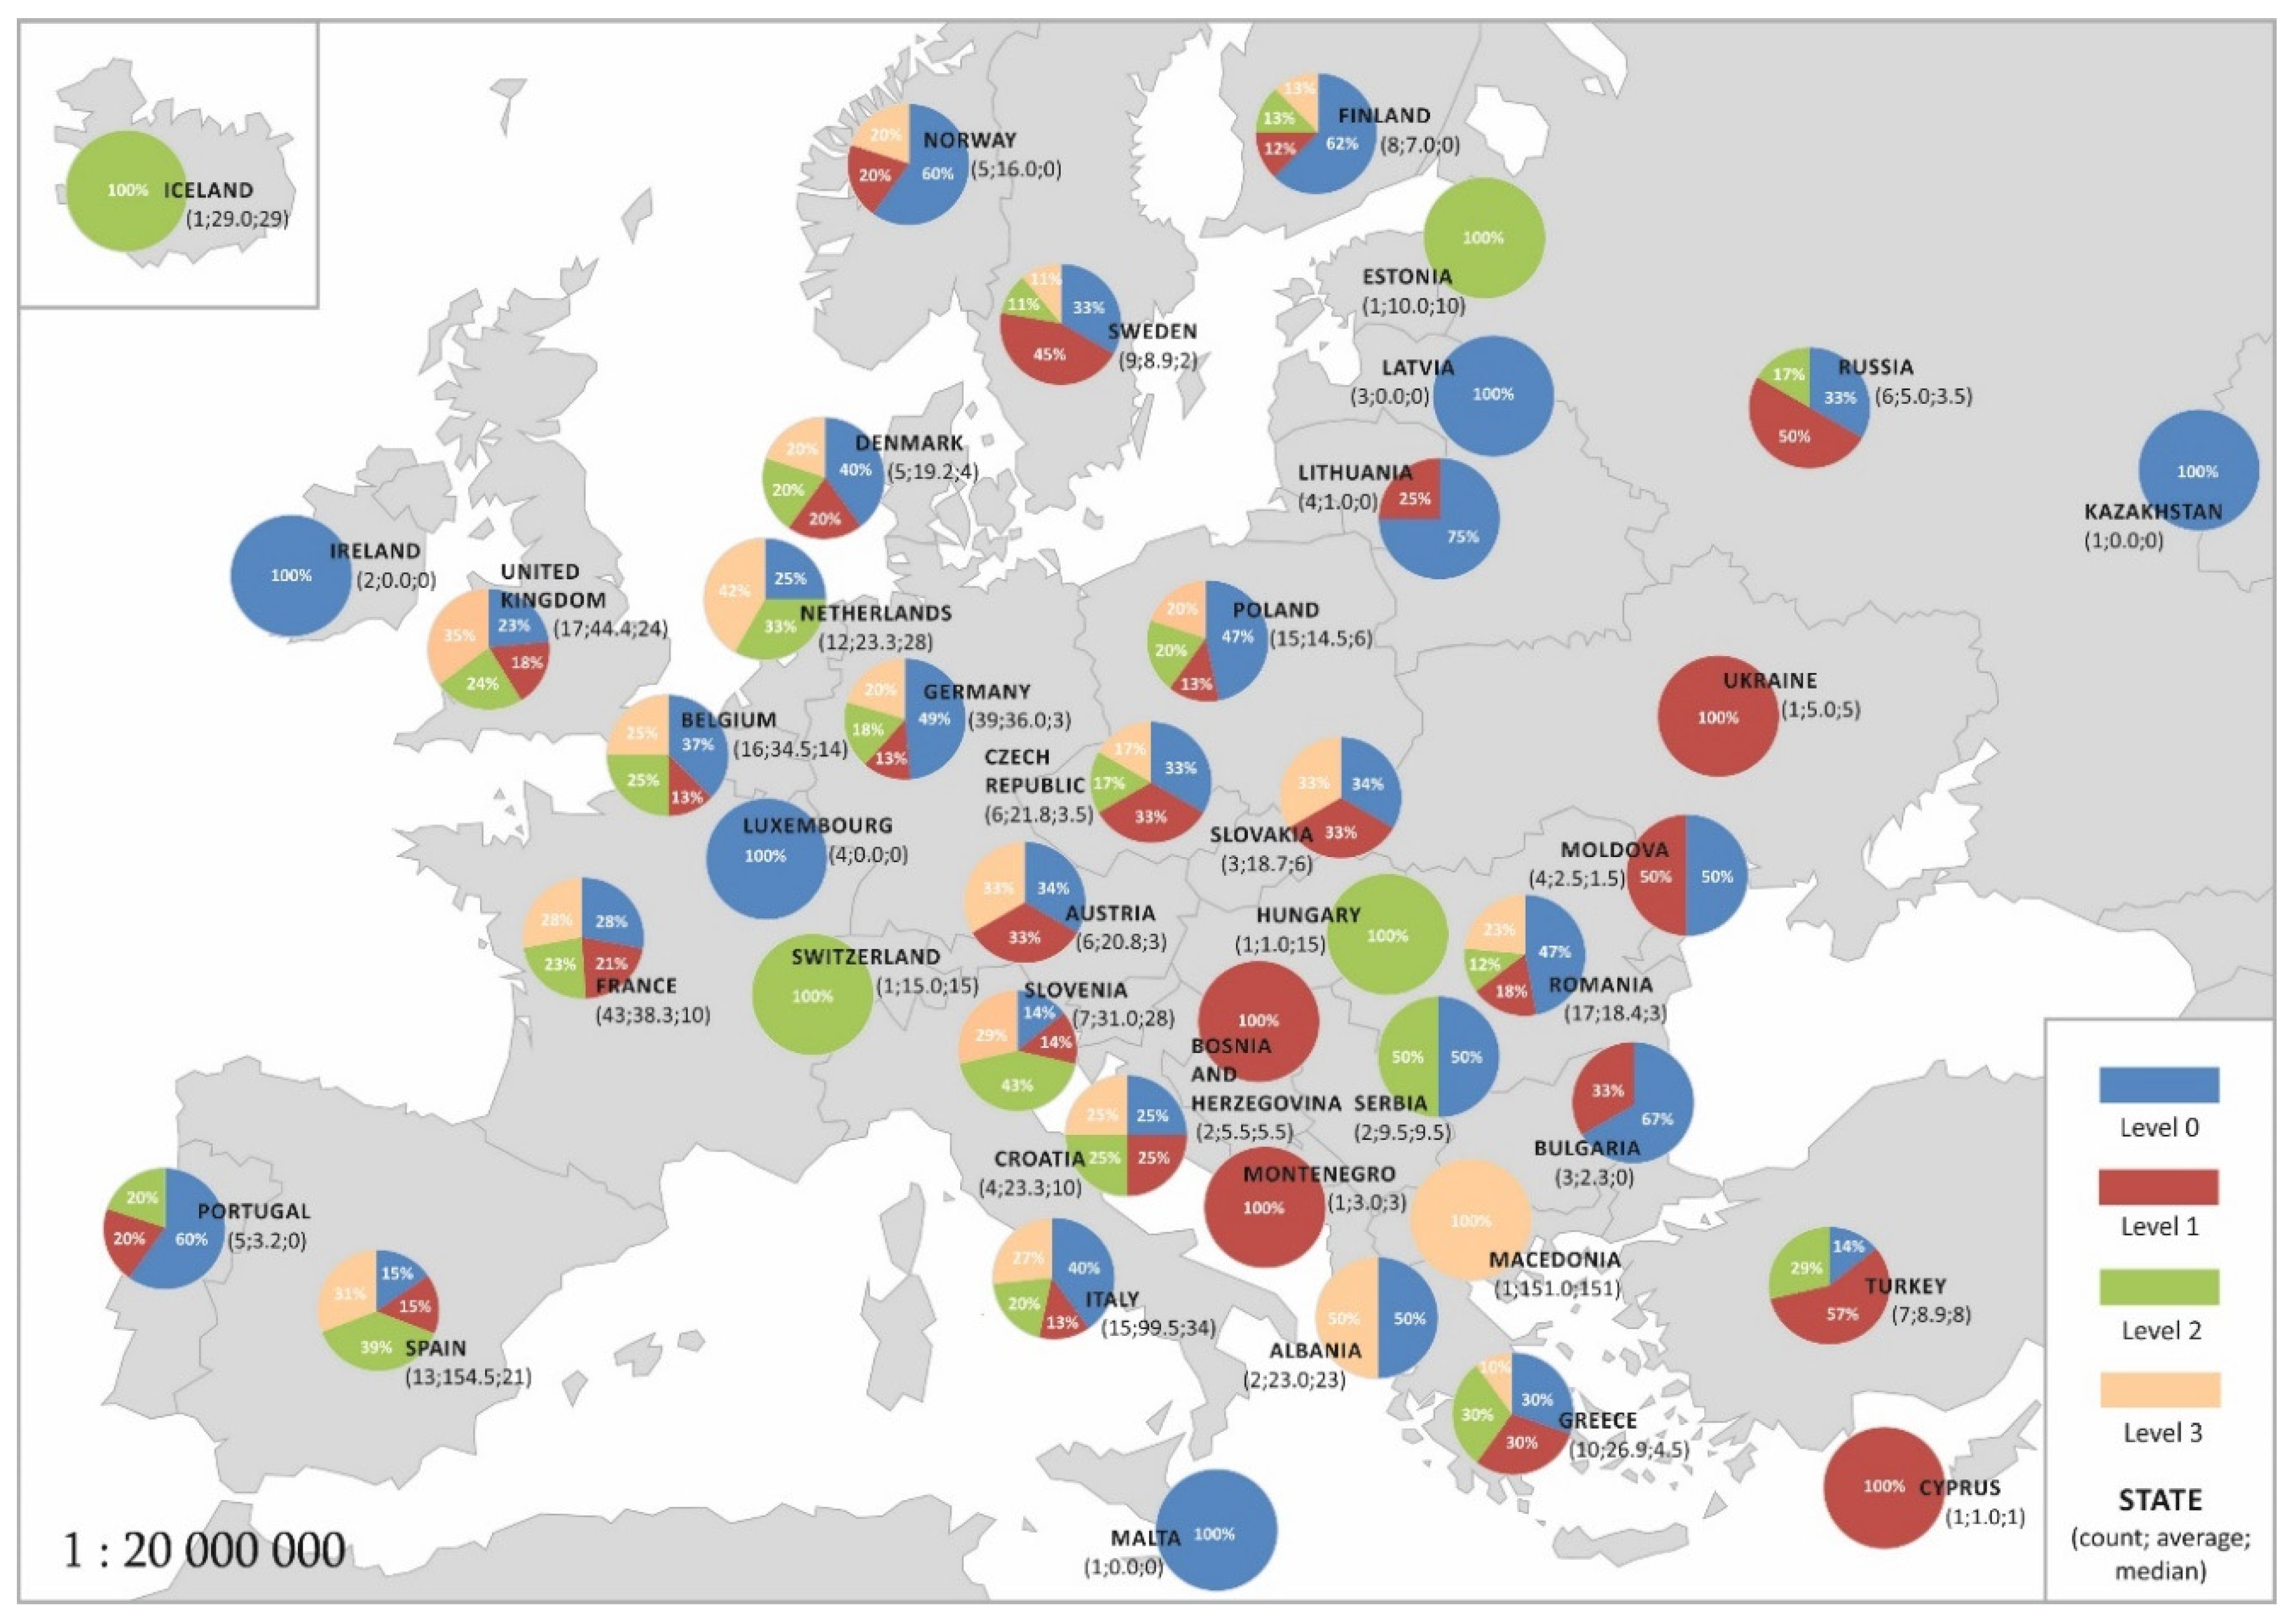
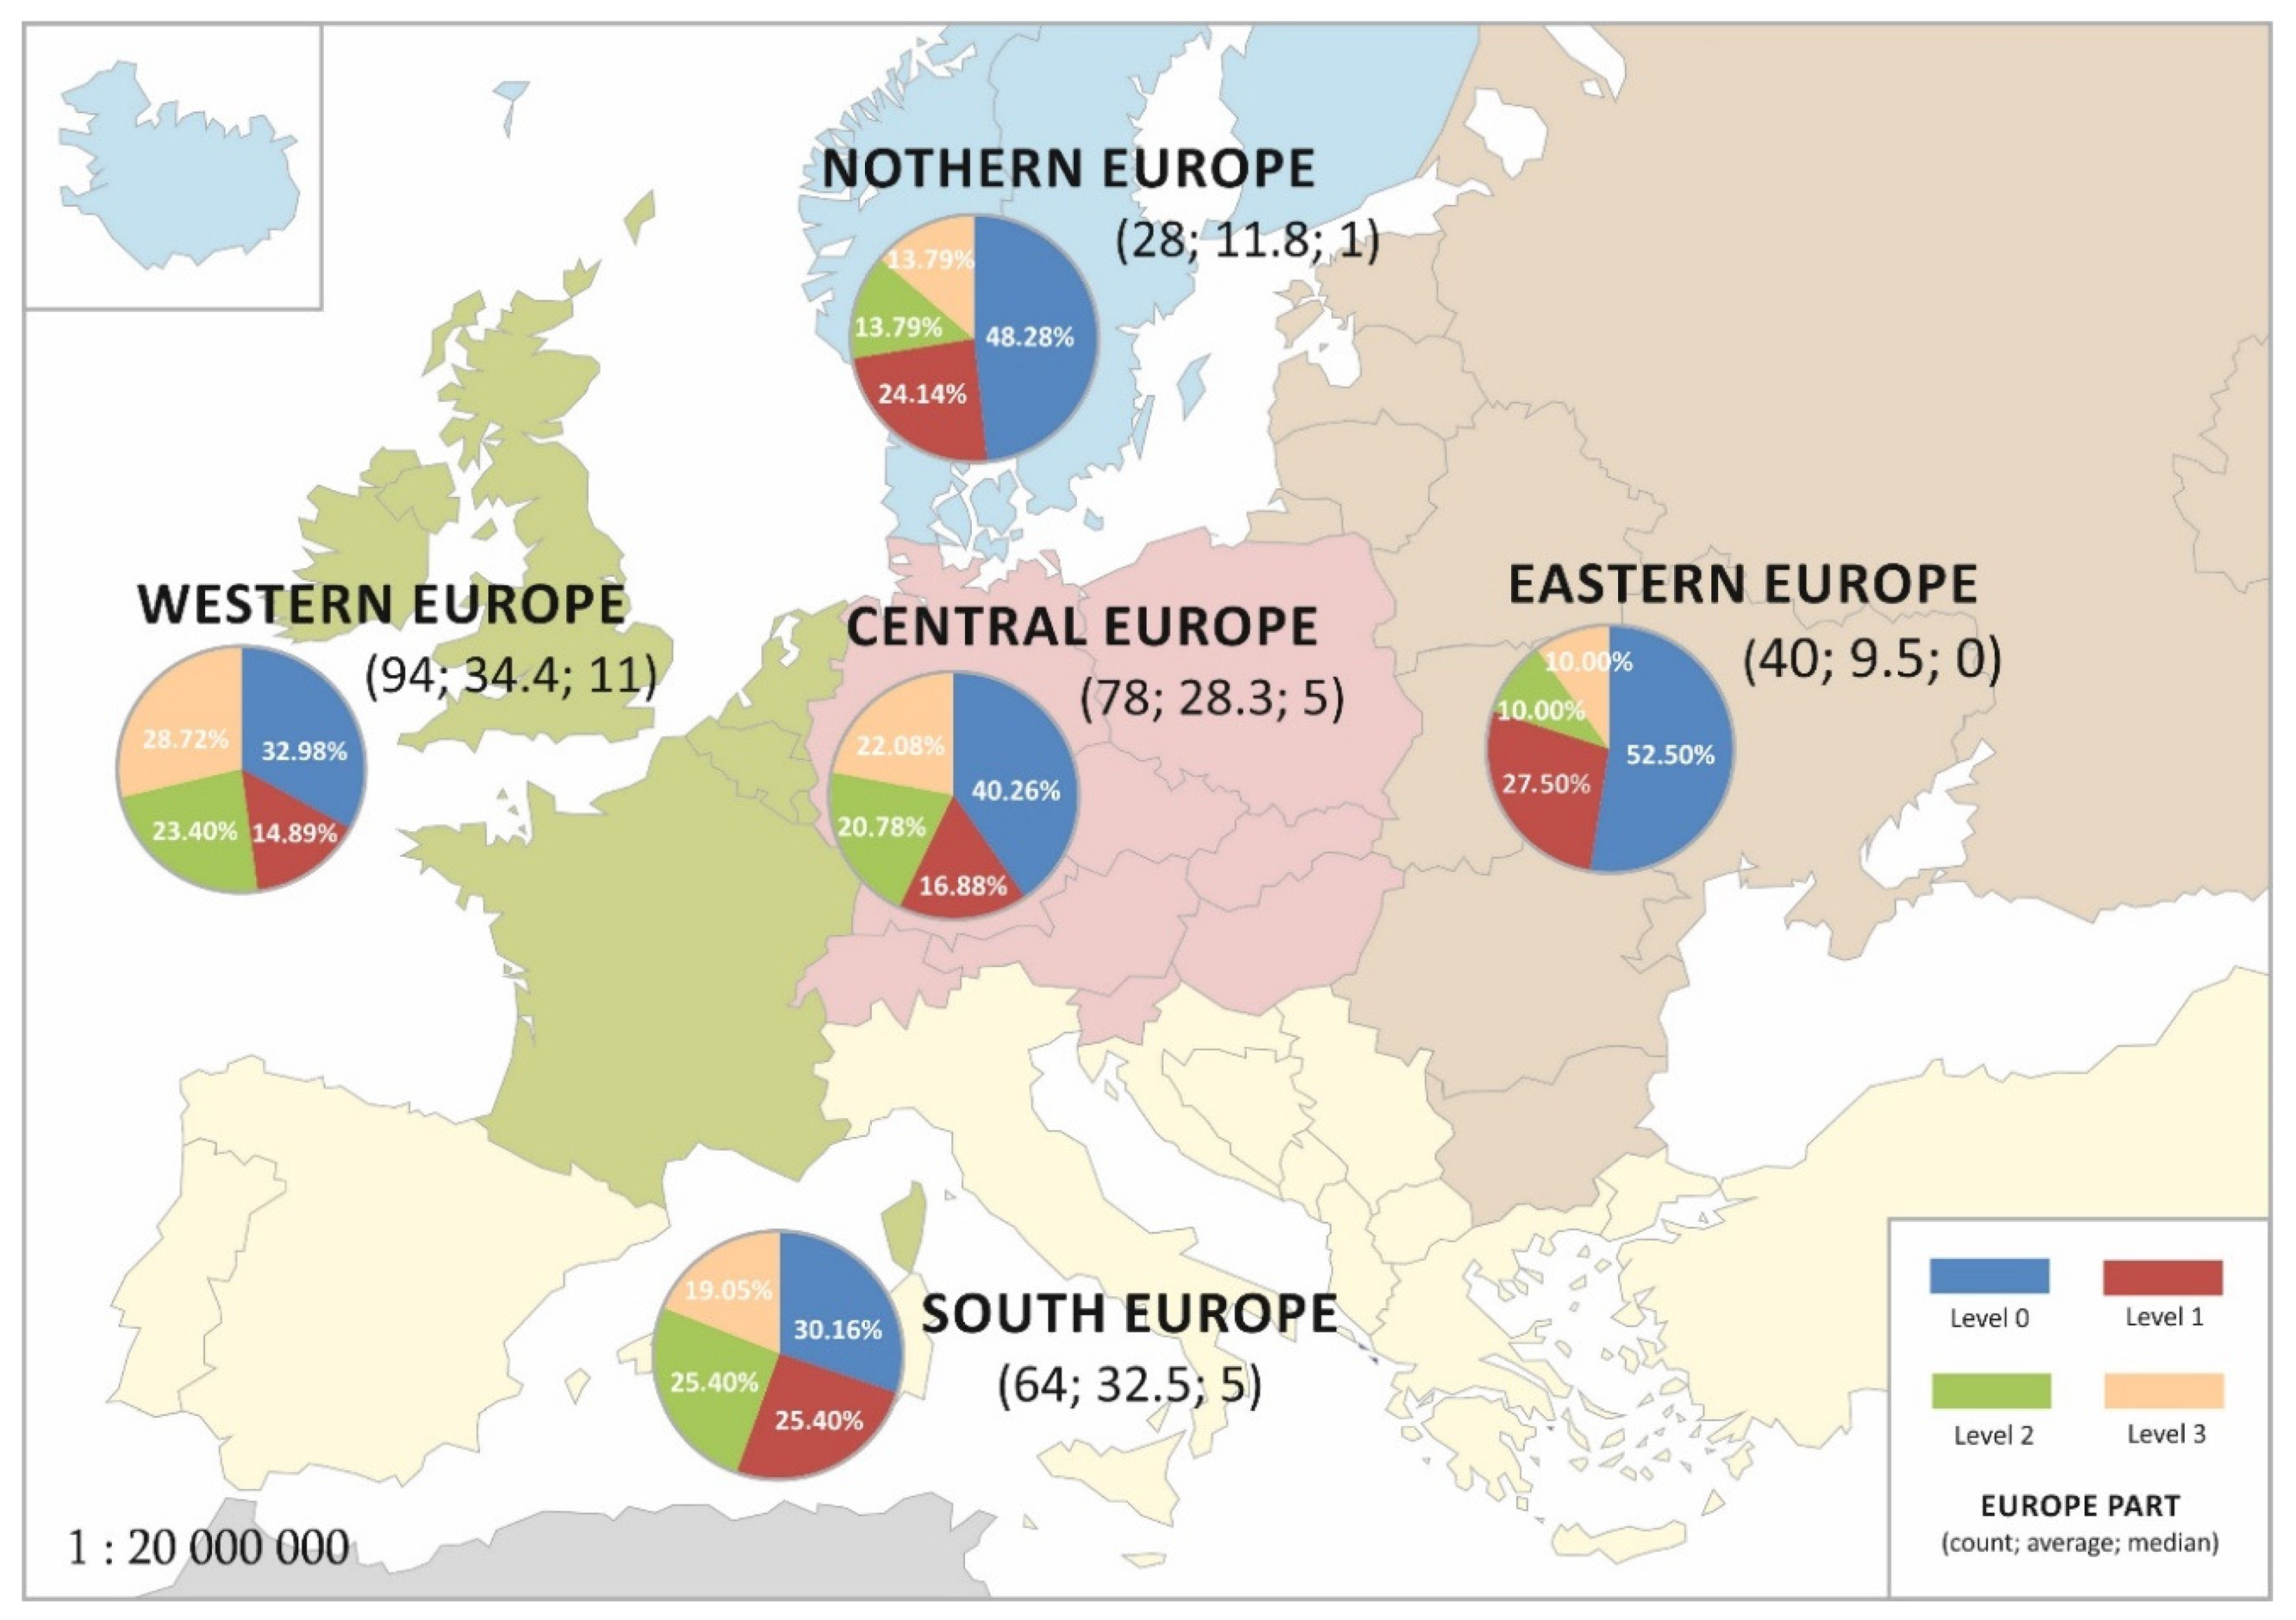
4.1. The Impact of the Event’s Location on the Number of Meetings and the Number of Partnerships Established

As mentioned, one of the analyzed determinants of the effectiveness of organizing promotional events is the location of the event.
Figure 1 shows a map of Europe with the marked countries in which the events took place. The map of each country includes a pie chart with the percentage distribution of the events taking place there, divided into four levels. In addition, under the name of each country, there is information on how many of the 304 events surveyed were held there, together with the mean number of meetings and the median number of meetings taking place within these events.
Upon analyzing the results presented on the map, please note that there are many countries with too low a number of recorded events for conducting a statistical analysis. The countries with fewer than three events were considered such countries.
Among the countries where at least three events within the EEN network were recorded, the largest number of meetings during the events took place in Spain. The average number of meetings was approx. 393. Additionally, it can be noticed that in Spain, the events with high numbers of meetings constitute the largest part, i.e., 46%. The group of countries where a significant number of meetings (over 200) took place as part of promotional events also include Luxembourg (mean, 286.5), Turkey (mean, 259.6), Slovakia (mean, 246.7), and Finland (214.1). There are also countries where meetings were held during each organized event. These countries include Portugal and Slovakia. An interesting result was obtained for events organized in Germany, Belgium, and the United Kingdom. In these countries, the average number of meetings was over 150, despite the fact that during a significant proportion of the events, no meetings were recorded.
Upon analyzing Figure 1, it is possible to indicate a few countries where a low number of meetings were recorded during the organized events. The countries where the average number of matches per event was below 50 include Norway (average—19), Latvia (average—24), Lithuania (average—7), Sweden (average—3), Poland (average—45), Moldova (average—6.8), and Romania (average—49.4). These are also countries where most of the events took place without any meetings. Relatively, the largest number of such events took place in Norway. They accounted for 80% of all the events taking place there.
The small number of meetings recorded in some countries makes it impossible to verify the significance of the indicated differences in the number of meetings for individual countries. Therefore, an attempt was made to analyze the number of meetings held as part of the events as per the part of Europe in which they were held.
For a more detailed statistical analysis of the relationship between the type of promotional instrument and physical location, the authors divided the countries included in the database into respective parts of Europe. To organize the research, the continent was divided into five main regions (Eastern, Western, Northern, and Southern), with an additional fifth region, i.e., Central Europe [14]. The proposed arrangement is a conventional division, resulting mainly from geography but also shared history and culture (the division of countries into individual regions includes only those countries for which at least one promotional event was recorded):
  • Western Europe—United Kingdom, Ireland, the Netherlands, Belgium, Luxembourg, and France.
  • Central Europe—Poland, Slovakia, Czech Republic, Hungary, Slovenia, Austria, Germany, and Switzerland.
  • Northern Europe—Norway, Sweden, Denmark, Finland, and Iceland.
  • Eastern Europe—Lithuania, Latvia, Estonia, Ukraine, Bulgaria, Moldova, Romania, Russia, and Kazakhstan.
  • Southern Europe—Serbia, Bosnia and Herzegovina, Croatia, Albania, Montenegro, Spain, Macedonia, Greece, Malta, Portugal, Turkey, and Italy and Cyprus.
Figure 2 presents the results of the statistical analysis of the data describing the number of meetings that took place as part of organized events in individual regions of Europe. On the basis of the pie charts presented on the map, it can be concluded that most of the events with no meetings took place in Northern Europe (37.9%). A significant percentage of such meetings also took place in Central Europe (33.8%). In turn, the lowest numbers of such meetings were organized in Southern (20.6%) and Western Europe (21.38%). In Eastern Europe, the number of events in terms of the respective number levels of the meetings was the same. When comparing the percentage of promotional events in the group with the largest number of meetings, Western Europe was the clear leader. In this part of Europe, at least 142 meetings (level 3—high) were held as part of over 35% of the events. Definitely, the lowest number of such meetings took place in Northern Europe. They accounted for almost 14% of all the events taking place there. Following this short analysis, it can therefore be concluded that there was a variation in the structure of the distribution of events in terms of the adopted levels describing the number of meetings, depending on the region. In this case, the test probability value in the independence test was 0.0142, which means that the indicated differentiation is statistically significant.
This analysis was supplemented by a comparison of the mean number of meetings held as part of the events in individual regions. The highest mean number of meetings was recorded for Western Europe. In this part of Europe, there were approximately 183 meetings for each event, i.e., over 140 more than the result obtained for Eastern Europe, where at a single promotional event, there were fewer than 40 meetings. Generally, there is a noticeable difference between the mean values of the numbers of meetings for individual parts of Europe. The same is true for the mean value or the median. This was confirmed by the Kruskal–Wallis test for the equality of the median, in which the null hypothesis was rejected. Therefore, it can be concluded that there was a significant variation in the number of meetings that were part of events organized in individual regions of Europe. Thus, the H1 hypothesis in the part relating to the number of meetings is confirmed. Additionally, it is indicated that most meetings took place at events organized in Western Europe, and the fewest, in Eastern Europe.
As in the case of the number of meetings, an analysis of the impact of the event’s location on the number of partnerships was carried out. Figure 3 presents a map with the results of statistical analysis for the numbers of partnerships in individual European countries. Among all the countries, Spain was the undisputed leader in terms of the number of partnerships. In this country, there were an average of 154.5 partnerships for each organized event. This country also had a high percentage of events with a high number of partnerships. Italy is also one of the countries where the mean value of partnerships was high, with over 99 partnerships per one of the 15 events. For the remaining countries, the numbers of cooperating entities observed are much lower. From this perspective, France, the UK, Belgium, Germany, and Slovenia were still the leaders, with 30–50 partnerships per event. Countries such as Luxembourg, Moldova, Lithuania, Latvia, and Bulgaria definitely had the lowest scores from this perspective. In these countries, the average number of partnerships was close to 0, and, in addition, a significant percentage of events were without any partnerships. Therefore, as in the case of the number of meetings, there was also a significant variation in the number of partnerships per event in individual European countries. This confirms the H1 hypothesis in terms of the number of partnerships.
Therefore, the data on the number of partnerships undertaken for individual parts of Europe were also analyzed. Figure 4 demonstrates a map with the results for the selected regions of Europe. It turns out that there are two groups of regions that differ significantly in terms of the average number of partnerships initiated.
The first group includes Central, Southern, and Western Europe. The average value of the number of partnerships was approx. 30 per meeting. However, what differentiates these groups is the median value. For Western Europe, its value was 11, and for Central and Mediterranean Europe, 5. Moreover, for Western Europe, the percentage of meetings with a large number of partnerships was the highest and amounted to nearly 29%. Therefore, it can be concluded that despite the similar values of the average number of partnerships for these three regions of Europe, a leader can be distinguished, which is Western Europe.
The second group is Northern and Eastern Europe. The average number of partnerships for these parts of Europe was close to 10, and the median was 0 for Eastern Europe and 1 for Northern Europe. These values indicate a much lower effectiveness for the meetings in these European regions compared to other regions, especially since in these regions, approximately half of the meetings ended without any cooperation. The indicated differences in the structure of the distribution of the partnership levels for individual regions, as well as the differences between the medians of the numbers of partnerships, turned out to be statistically significant, as the test probability values are lower than 0.05.
In conclusion, from this part of the analysis, it can be stated that Western Europe was the region with the highest effectiveness for the organized events, expressed as the numbers of meetings and partnerships. This is due to countries such as France and the UK, where promotional events were highly effective. In this respect, indicators not much lower were obtained for Mediterranean Europe, where the highest number of meetings and partnerships was observed at events organized in Spain and Italy. Central Europe demonstrates quite high indexes in terms of the number of meetings and partnerships. However, in this part of Europe, there are large disproportions in the analyzed values for individual events. A fairly large group of events in this part of Europe was those that did not result in any meeting or partnership. However, there was also a large group of events with high indexes in terms of meetings and partnerships.
Regions such as Northern and Central Europe have similar indexes for the number of meetings and event partnerships, and they are significantly lower than for the rest of Europe. This means that events organized in these parts of Europe were much less effective in the analyzed approach.

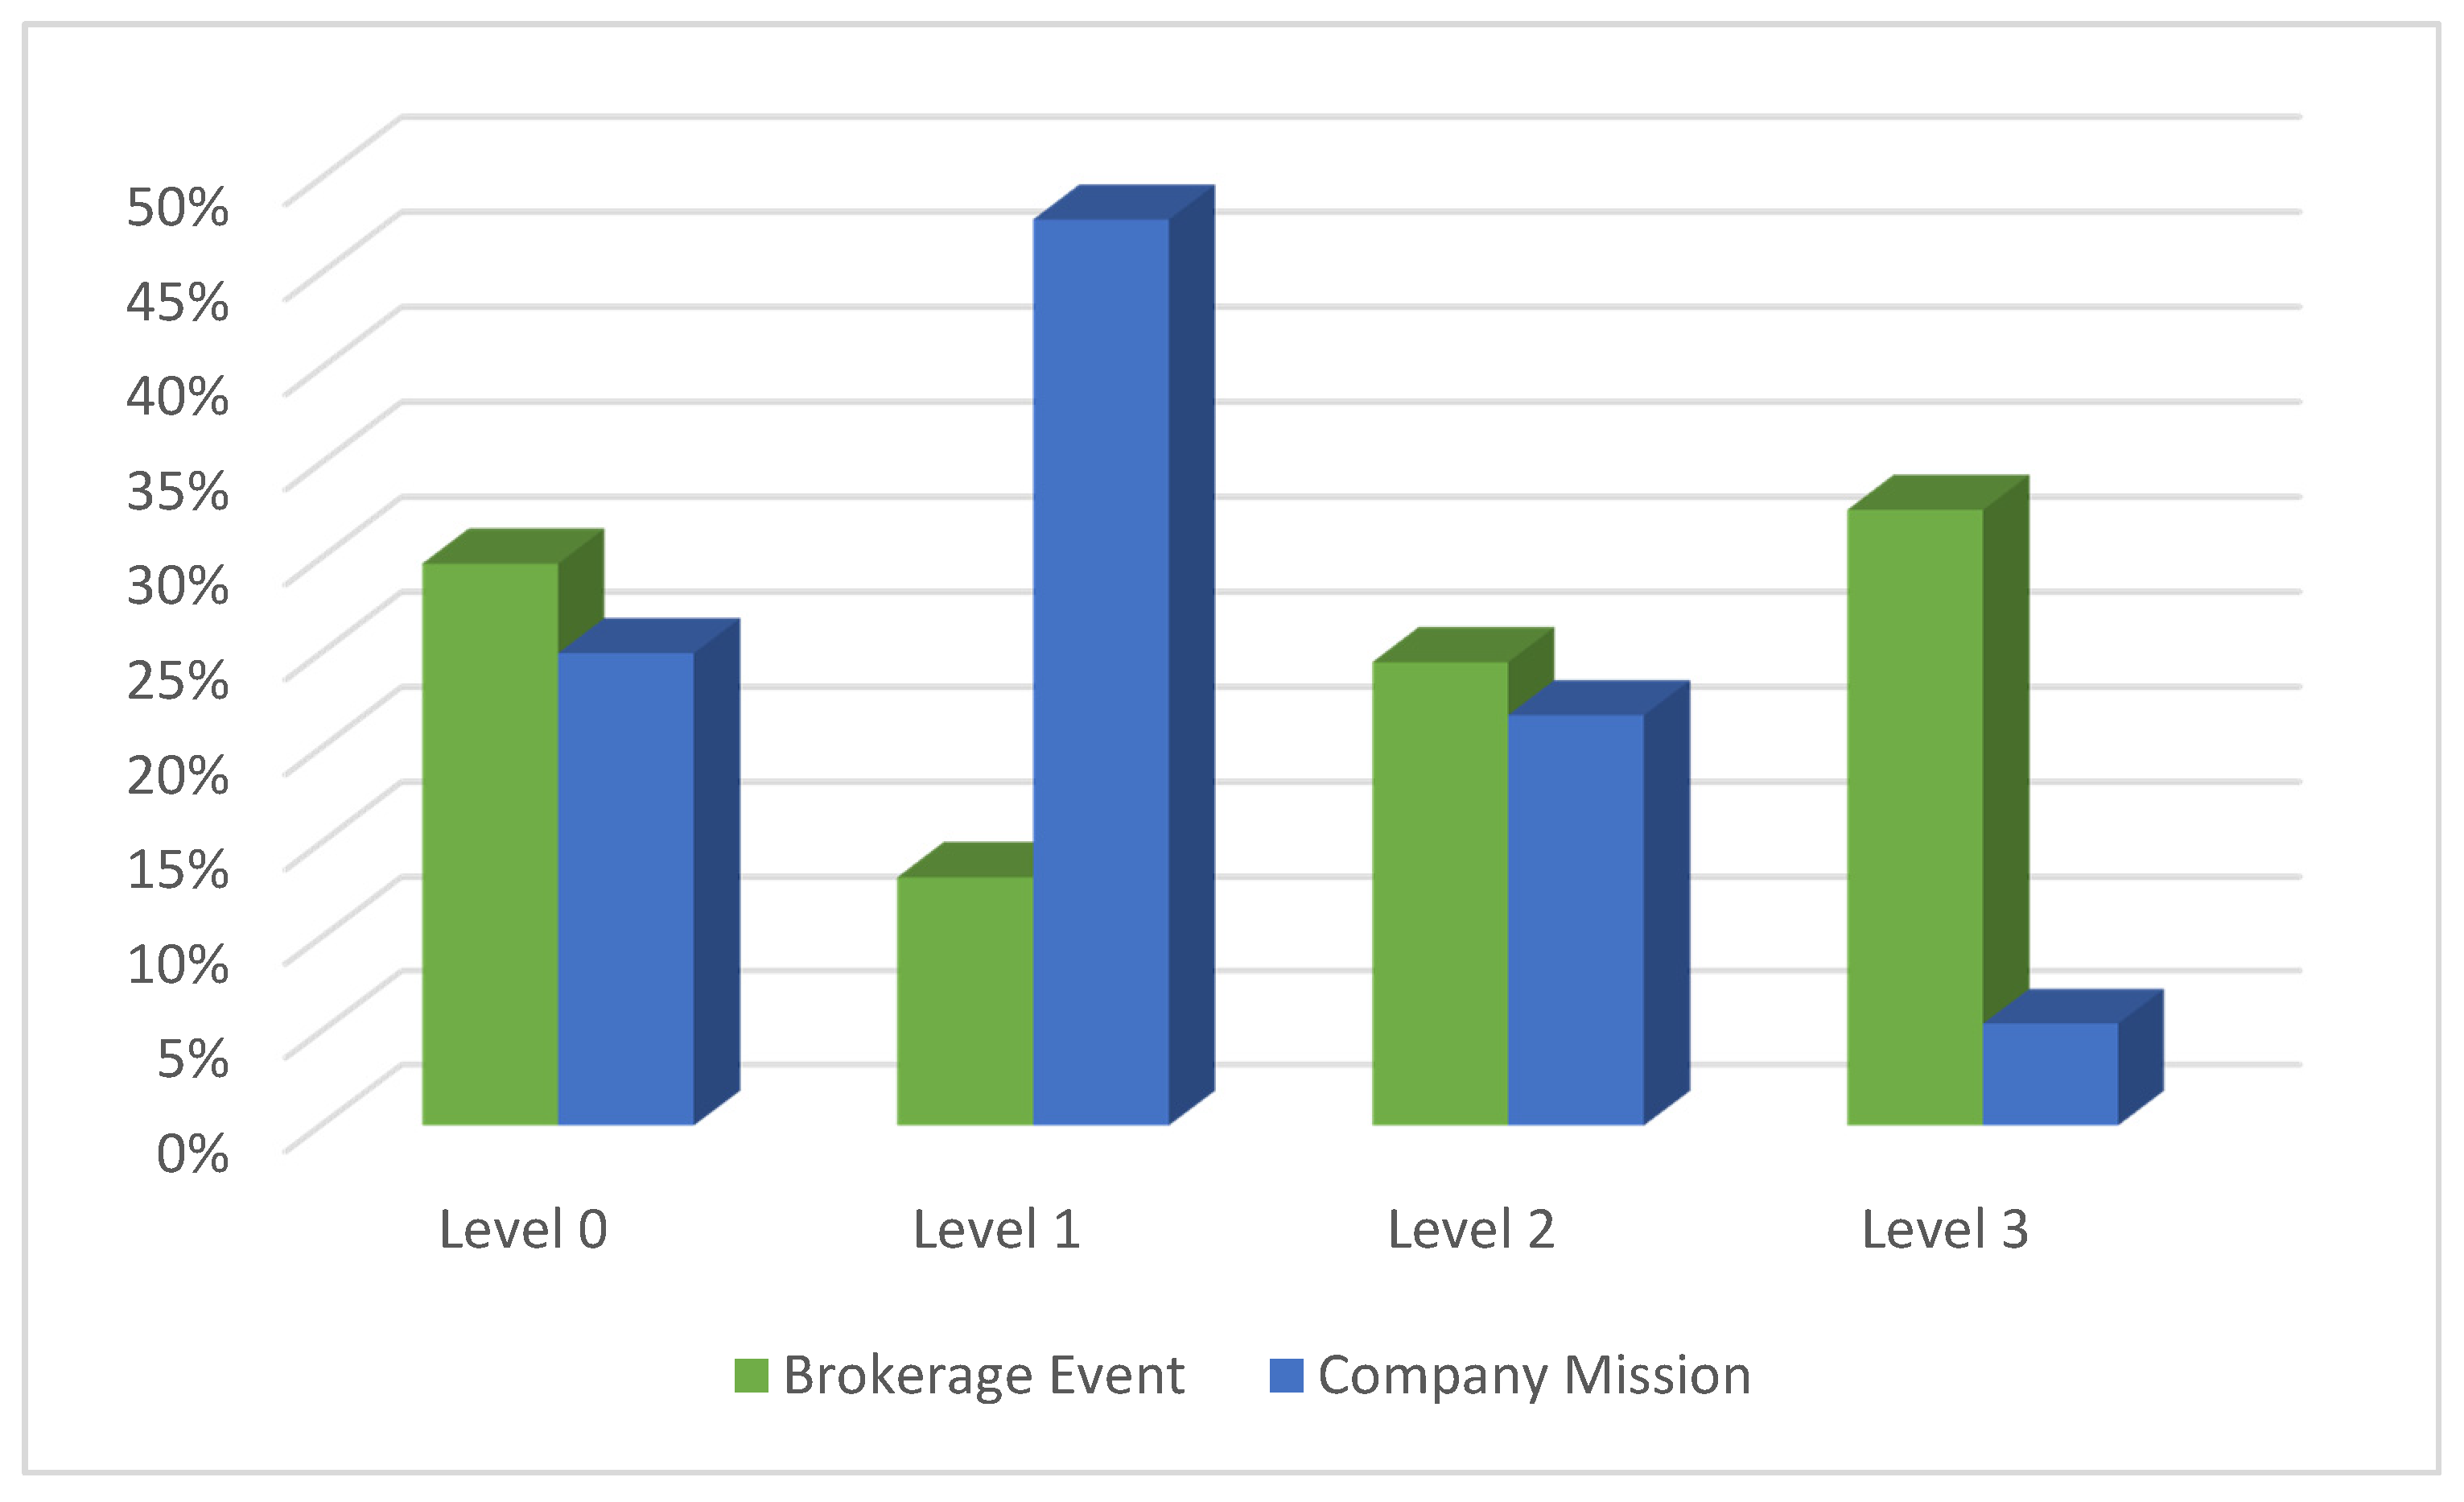
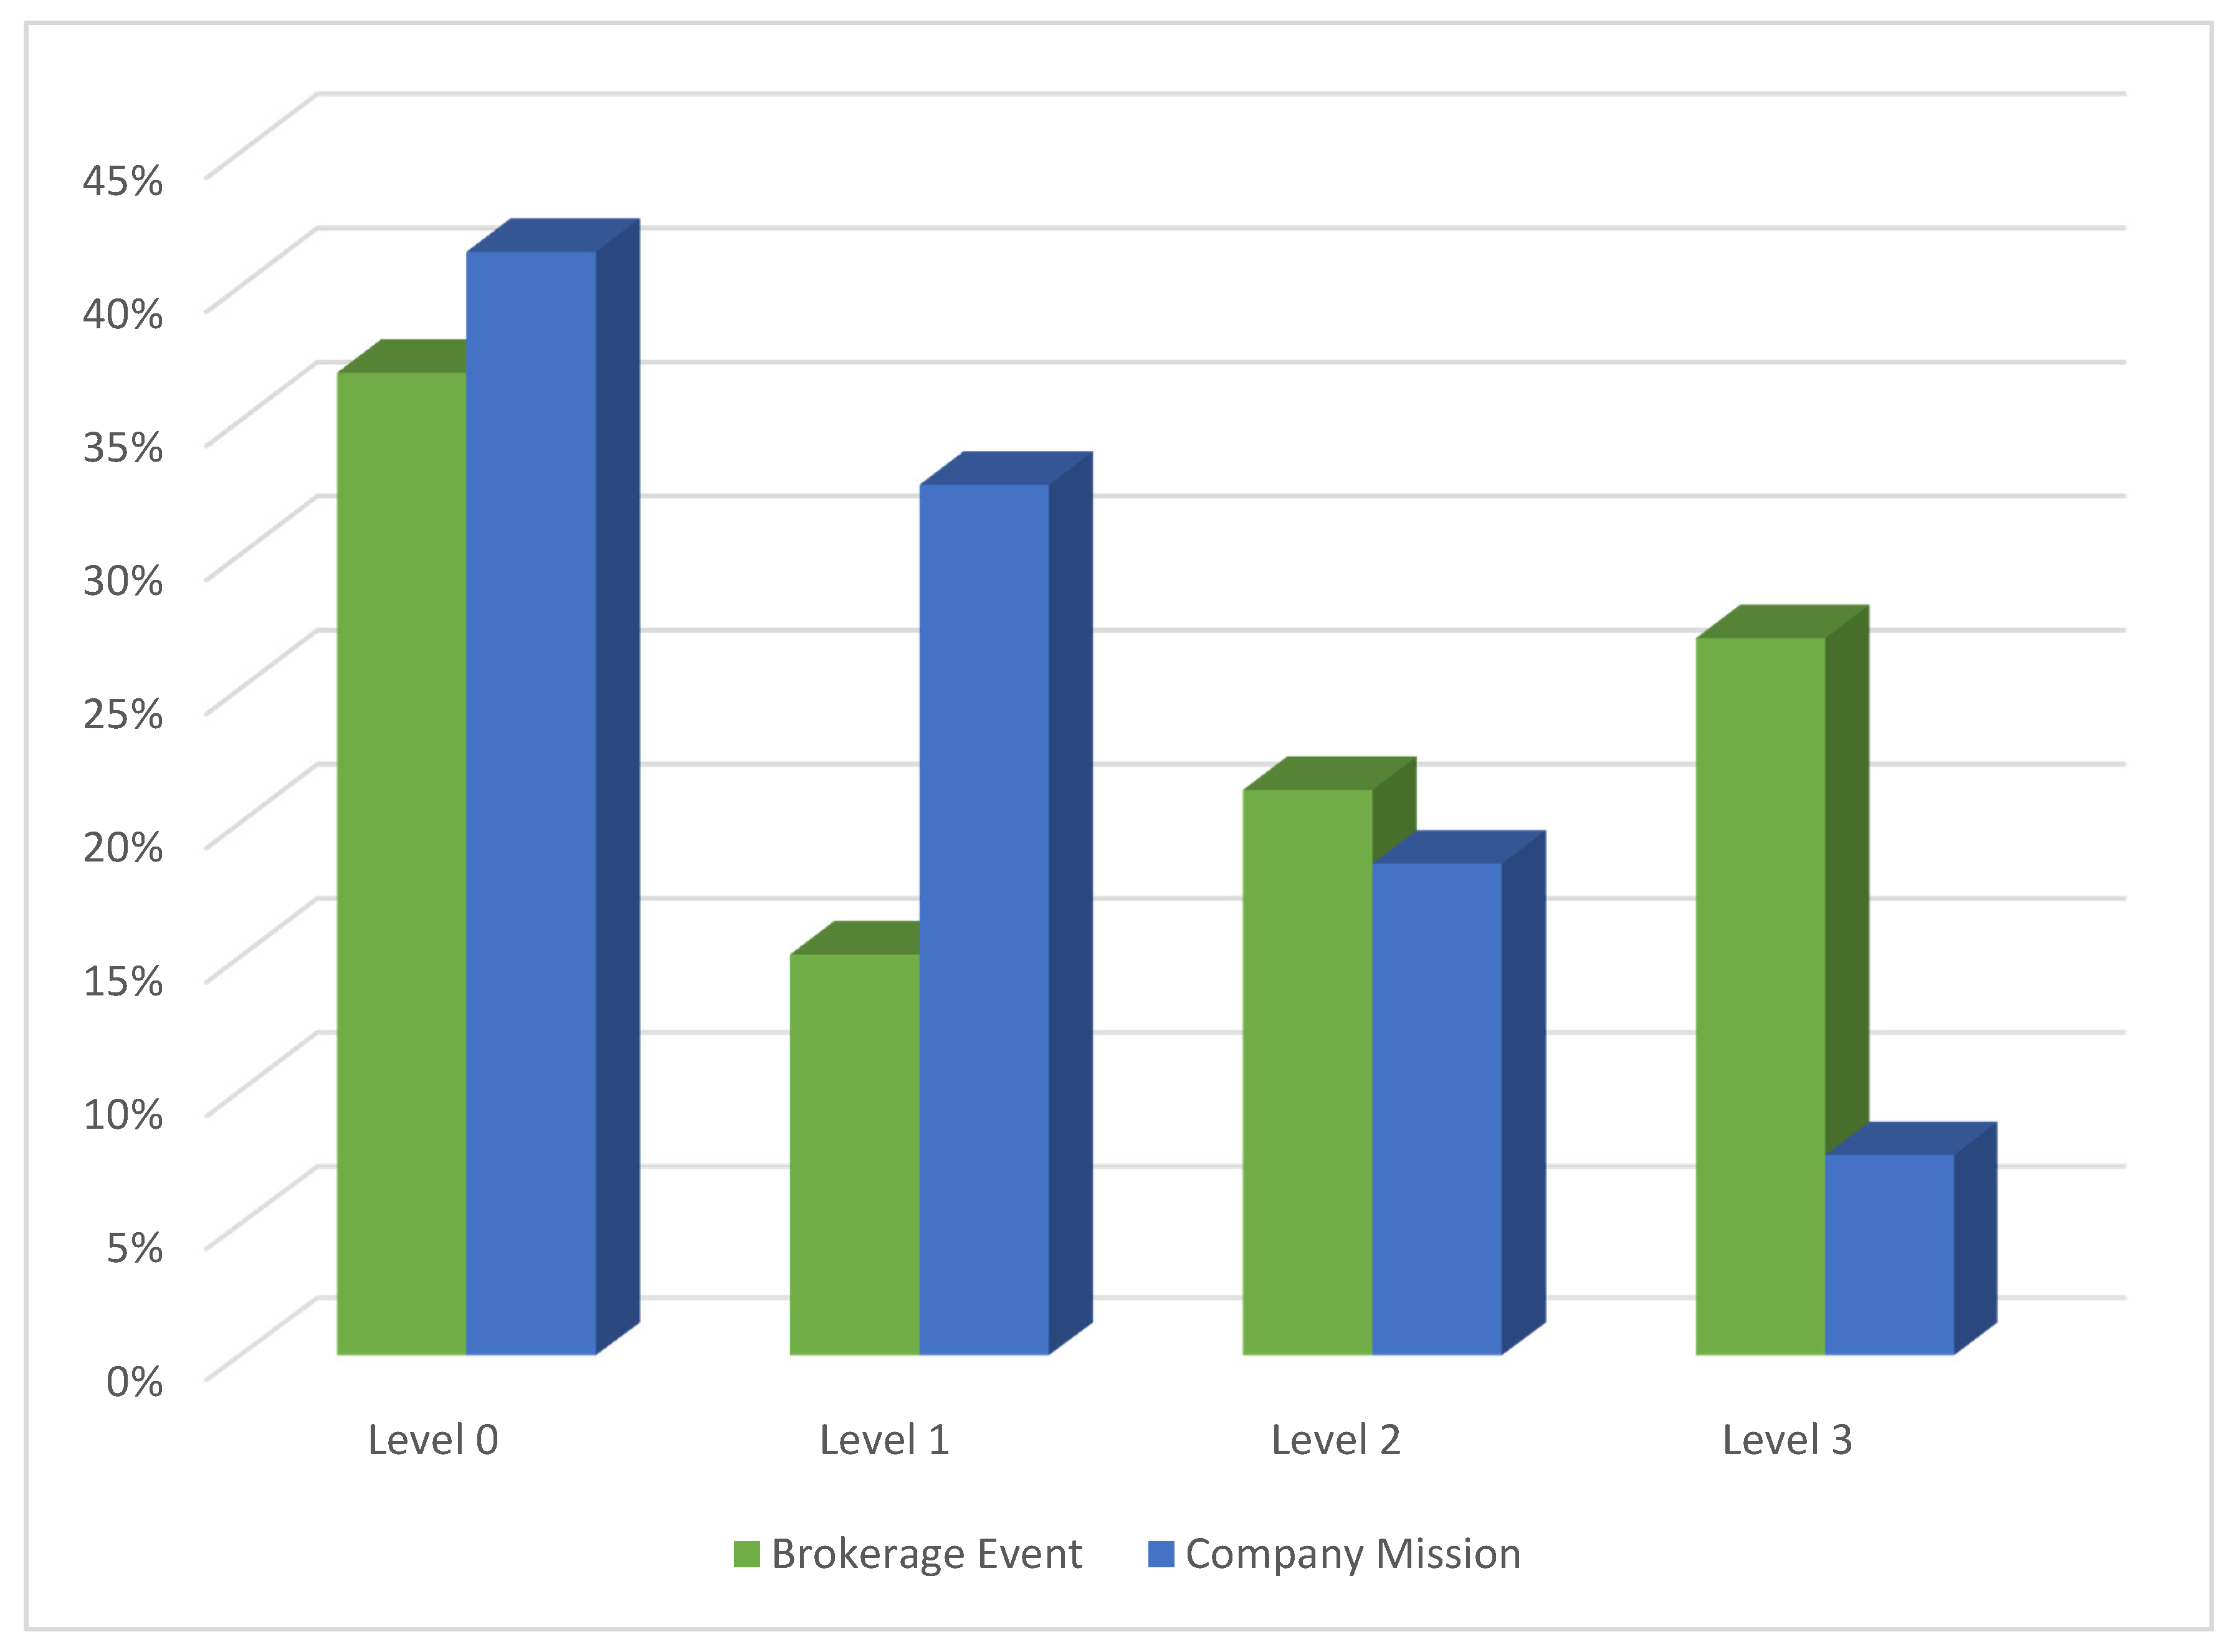
4.2. Impact of the Type of Promotional Event on the Number of Meetings and the Number of Partnerships Established

The next part of the article analyzes the impact of the type of event on the level of the analyzed values, i.e., the number of meetings and the number of partnerships.
Figure 5 presents a bar chart that compares the structure of the number of meetings within individual events according to the adopted division into levels.
Based on only a preliminary analysis of the above chart, it can be concluded that there was a variation in the distribution of the number of meetings held as part of BEs and CMs. Admittedly, the percentage of events during which no meetings took place and that in which the number of meetings was at the average level were similar for both types of meetings and amounted to approximately 25% and 22%, respectively. However, there were significant differences in the number of meetings at the low and high levels. In the case of CE, the low number of meetings accounted for over 45% of all the meetings of this type. For BEs, the number of meetings was low only in slightly more than 13% of the events. On the other hand, a high number of meetings occurred in 32.6% of BE events and only in 5.4% of CM meetings. The above analysis clearly shows that between BEs and CMs, there was a variation in the number of meetings. This fact is confirmed by the results of the chi-square test, for which the p-value is below 0.05.
The above analysis also leads to the conclusion that a much larger number of meetings were held during BE-type promotional events.
In order to confirm this, some basic statistics were determined for the number of matches in each type of event. The results presented in Table 3 confirm the previous conclusions.
The average number of meetings held as part of BEs was over 177, and by comparison, the value was approx. 45 meetings per event in the case of CM events. Due to the large variation in the number of meetings, the median is a more appropriate measure for the aspect of location. Additionally, in the case of this statistic, its value is much higher for BE matches. To confirm the significance of the indicated median difference (since the assumptions could not be met, it was not possible to perform Student’s t-test in examining the significance of the difference between the means), the Mann–Whitney test was performed, for which the p-value was approx. 0.0001. This means significance in the differentiation between the medians for BEs and CMs. There was a large variation in both studied groups (the coefficient of variation is over 100%).
Based on a detailed analysis, it can be concluded that a much larger number of meetings were held during BE-type events than during CMs. However, there was also a considerable variation in the number of recorded meetings within the same types of events.
A similar analysis was carried out for the data on partnerships. Figure 6 presents a bar chart showing the differences in the percentage distribution of events according to the adopted criterion for the number of partnerships.
The conclusions drawn from the analysis of the above figure are very similar to those obtained for the number of meetings. A clear difference between BEs and CMs is noticeable at level 1 and level 3; i.e., for almost 27% of BEs, the number of cooperative actions undertaken was at a high level. In the case of CMs, there were fewer than 8% of events that generated a large number of partnerships. On the other hand, there were approx. 33% of events that resulted in few partnerships in the CM group, and in the BE-type meetings, slightly over 15%. The observed differentiation turned out to be statistically significant because the value of the test probability in the independence test was 0.0001.
The above analysis is complemented by the determination of the basic measures of location and dispersion for the number of partnerships in the individual types of events. These data are presented in Table 4. It can be observed that the average value of the number of partnerships for BEs was much higher than for CMs. The difference is over 30. Additionally, the median value was much higher for BEs than for CMs. Thus, the conclusions of the analysis based on Figure 6 confirm that BE-type events result in more partnerships than CM events. In the indicated differentiation, significance was confirmed by the Mann–Whitney test, for which the test probability value was approx. 0.003 (lower than the set level of 0.05).
In conclusion, from this part of the analysis, it should be stated that the hypothesis H2 regarding the significant impact of the type of event on the number of meetings and the number of established partnerships was confirmed.

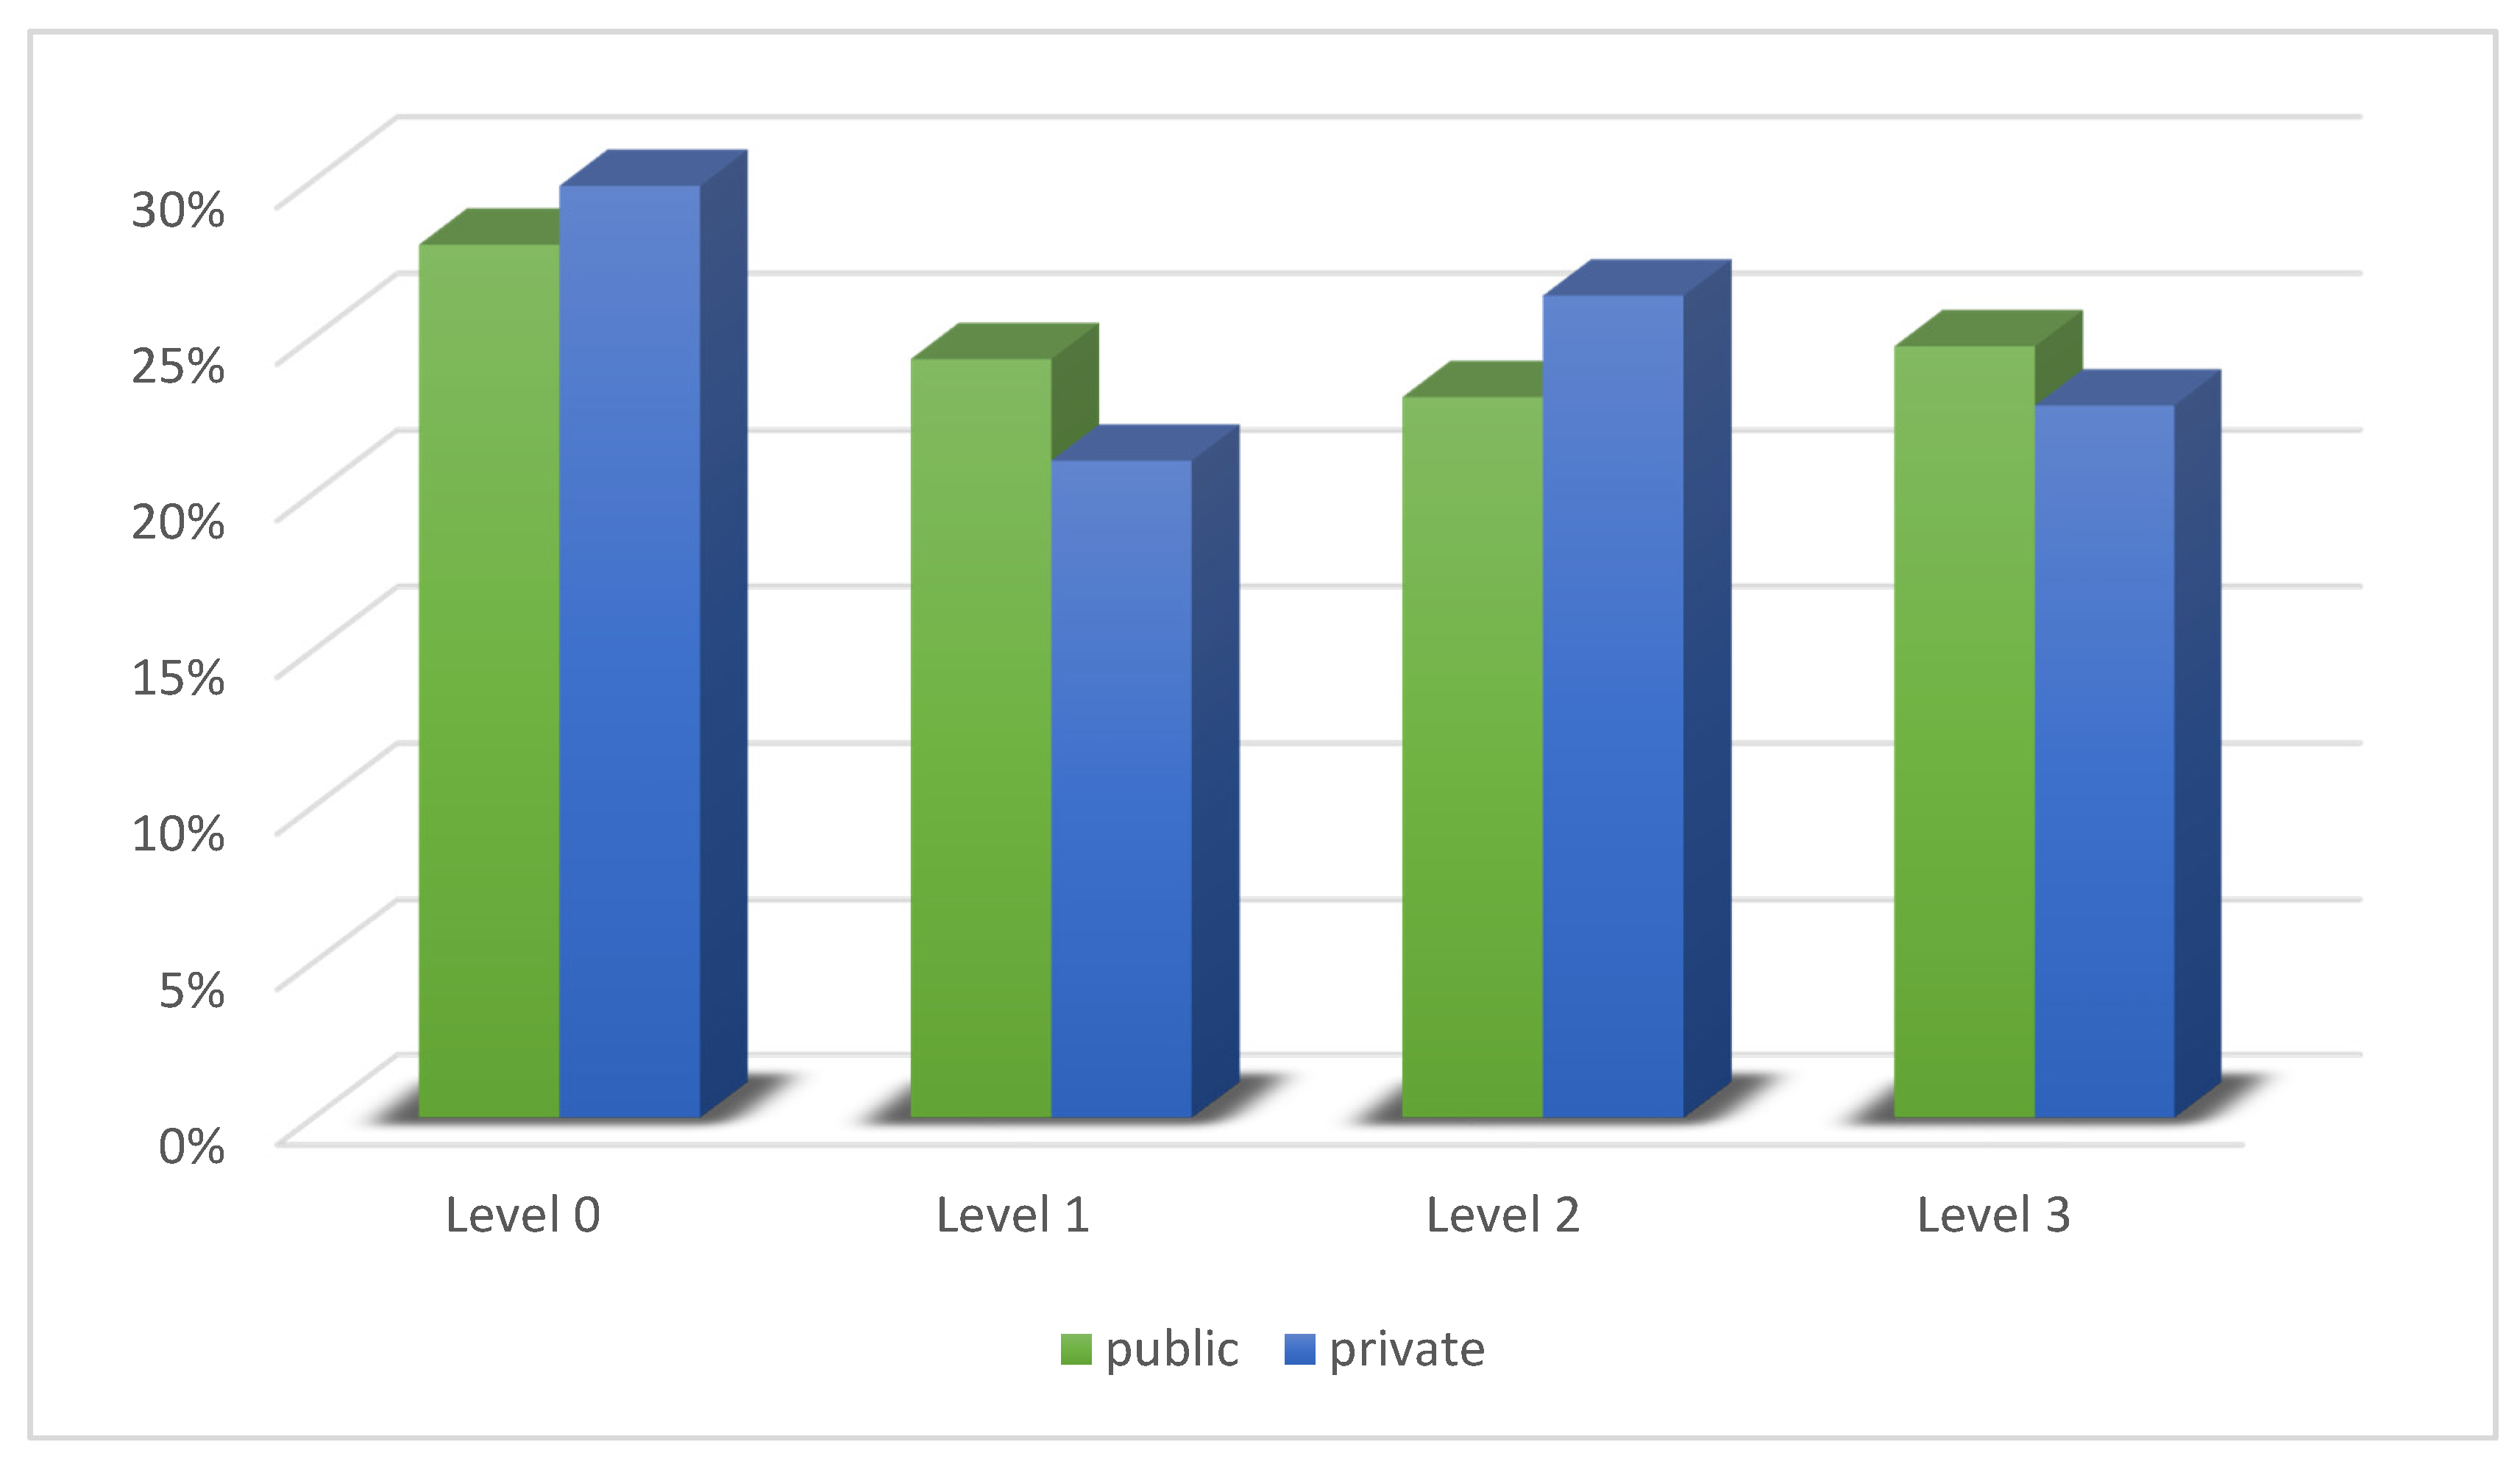
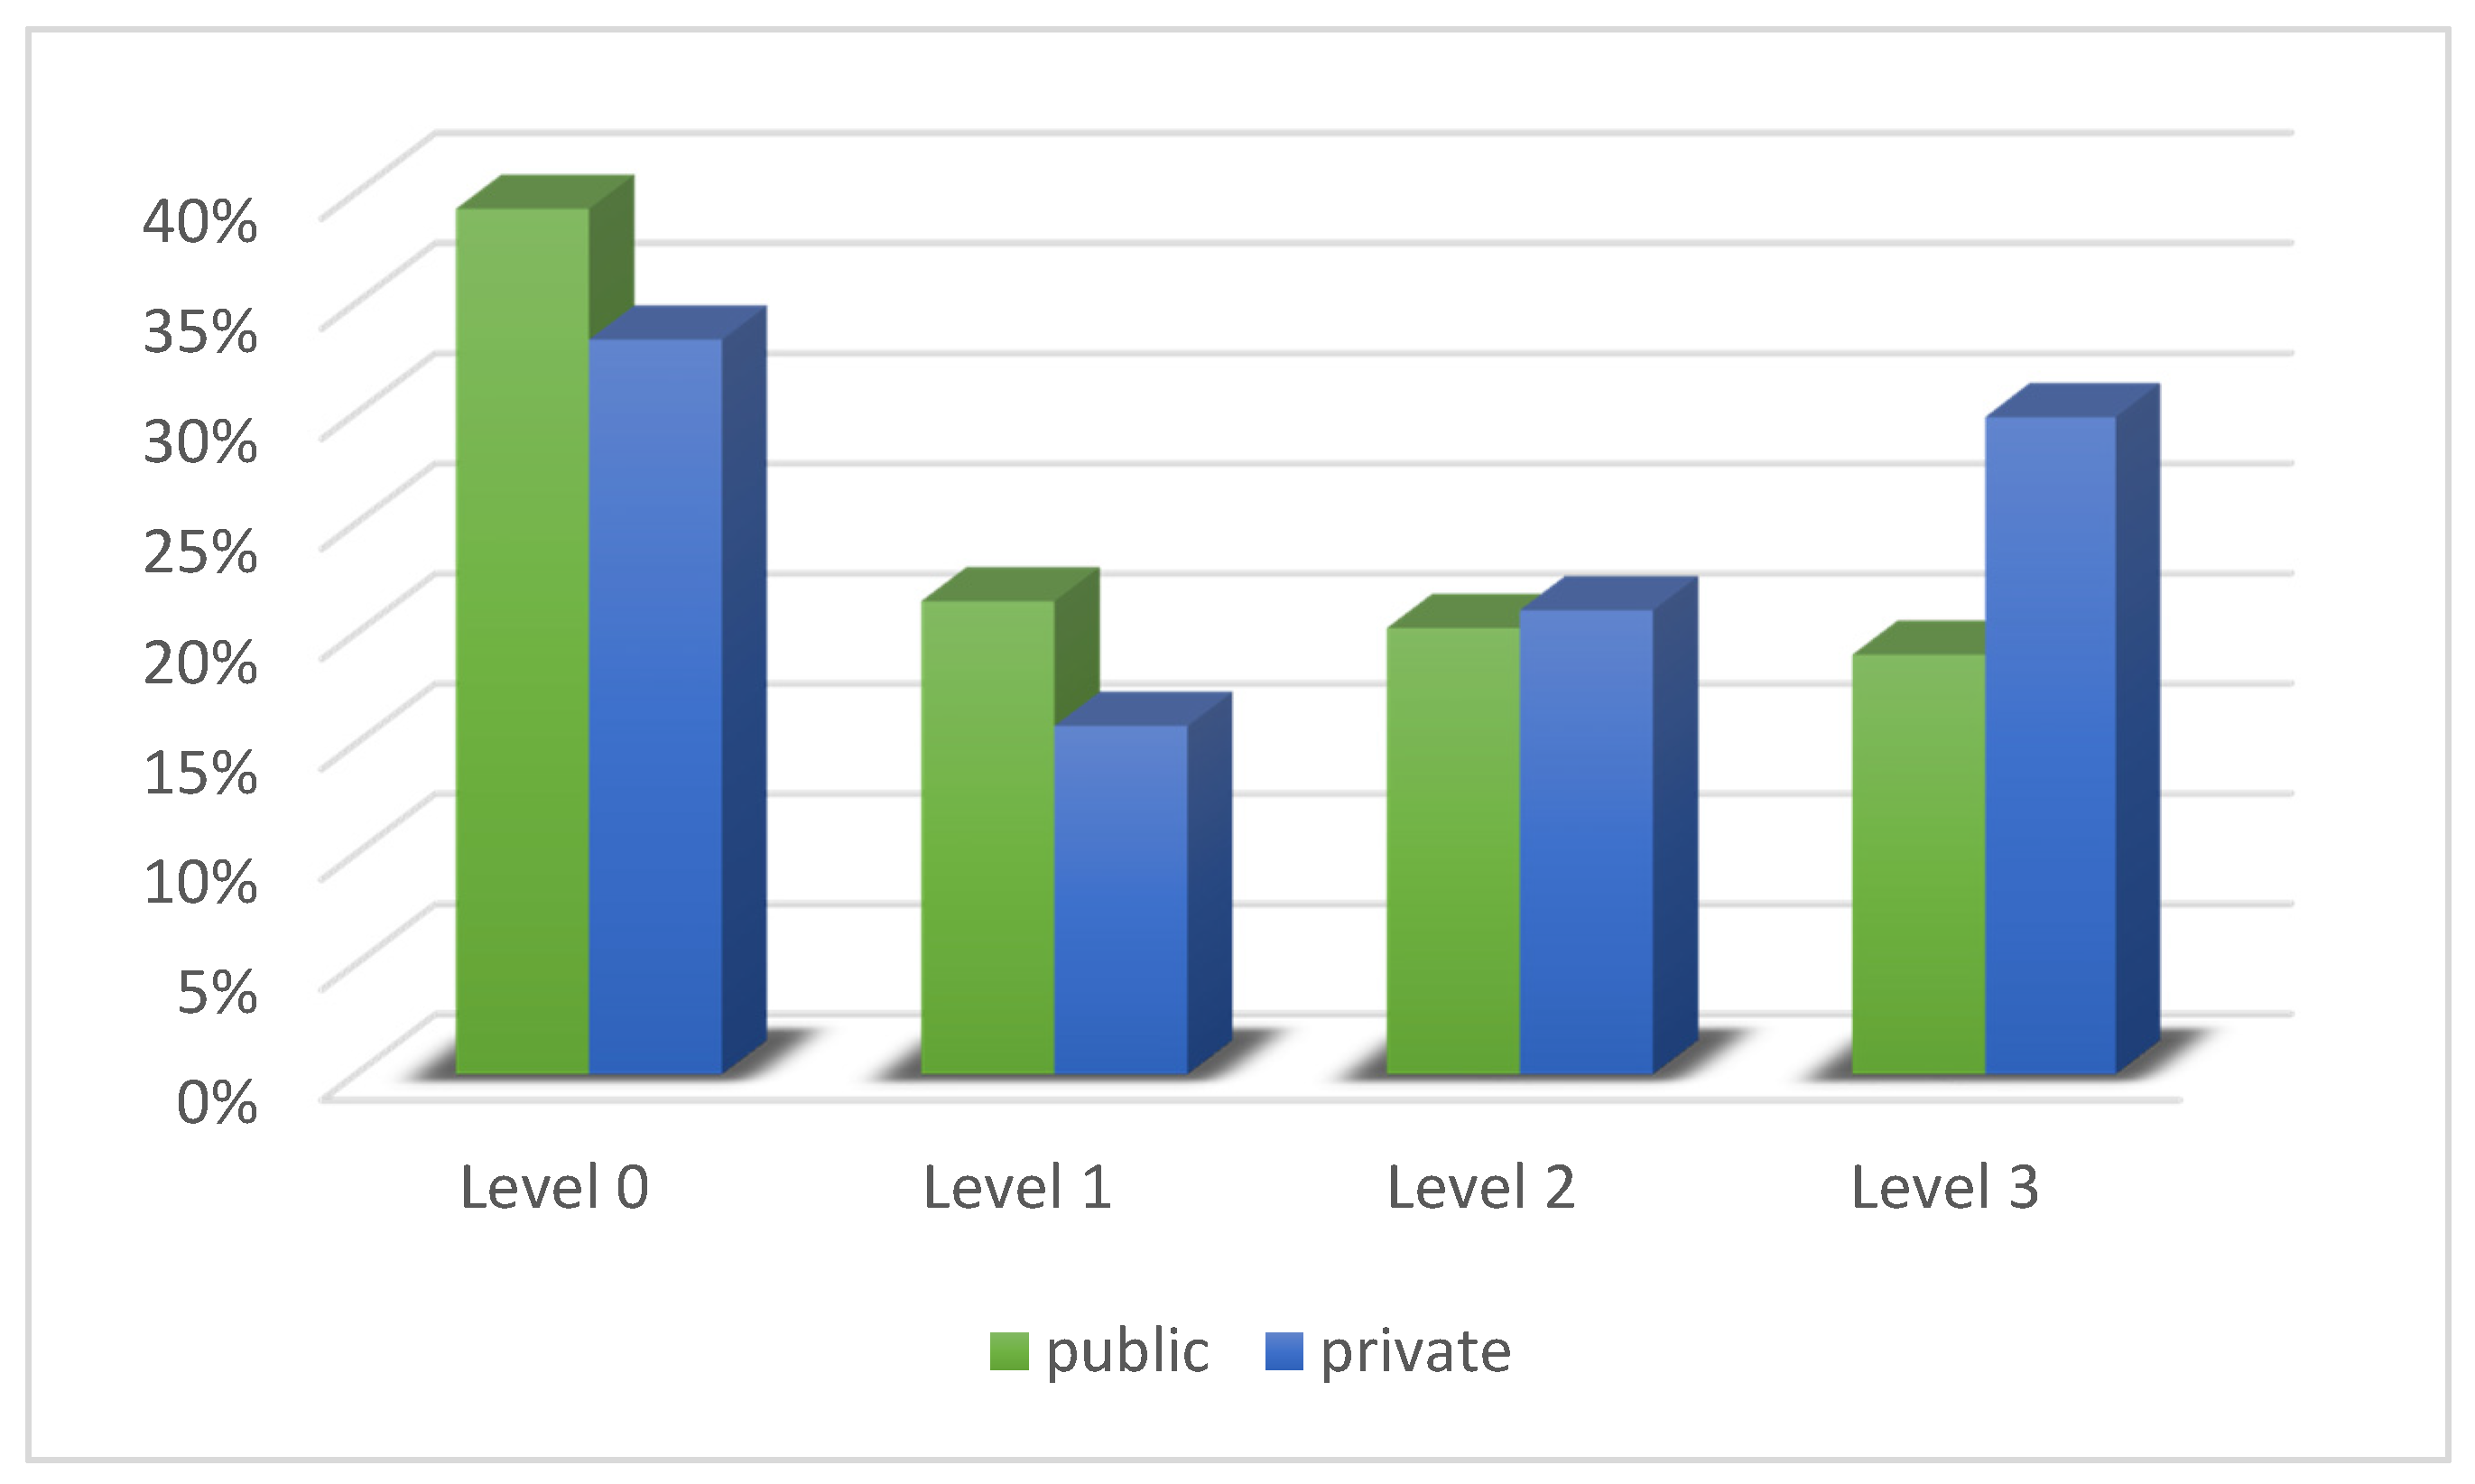
4.3. Impact of the Type of Lead Partner Supporting a Promotional Event on the Number of Meetings and the Number of Partnerships Established

This part of the work presents the results of the analysis related to the impact of the supporting partner type on the number of meetings held at a given event and the number of participants undertaking cooperation.
Figure 7 shows the structure of the number of meetings within individual events according to the adopted division into appropriate classes related to the percentage of recorded meetings.
The analysis of the above bar chart leads to the conclusion that there was no significant variation in the distribution of the number of meetings depending on the supporting partner. The differences in the individual classes were not greater than 3.2 percentage points. Therefore, it can be concluded that the type of partner does not differentiate the distribution of the number of meetings into particular levels. This is confirmed by the results of the chi-square test, for which the p-value = 0.9108.
In the further part of this analysis, basic statistics for the number of meetings in individual events were determined, broken down by the supporting partner selected by the organizer. The determined measures are presented in Table 5.
Among 247 events in which a public organization was invited to cooperate, the average number of meetings held was approximately eight times higher than in events in which a private partner was present. However, the value of the median for the number of meetings was higher for promotional events in which the supporting partner was a private organization. The indicated differences, however, did not turn out to be statistically significant, as the test probability values for the tests comparing the means and medians are much higher than the adopted significance level of 0.05. Additionally, the differentiation in both groups turned out to be similar, as the value of the coefficient of variation was approx. 175% in both cases.
In conclusion, from this part of the analysis, it can be stated that the choice of partner had no significant impact on the number of meetings that took place as part of the organized event. Therefore, the H3 hypothesis in the part relating to the number of meetings was not confirmed.
The next analysis was dedicated to the impact of the supporting partner type on the number of partnerships. Figure 8 shows a breakdown of the number of cooperation-ready entities into individual levels, depending on the type of partner supporting a given event.
This time, some differences in the schedules for events can be observed depending on the chosen supporting partner. Firstly, in the case of events supported by a public organization, a higher percentage of events recorded no partnerships or a number of partnerships at a low level. In both cases, the difference was approx. 6 percentage points. On the other hand, a difference of over 10 percentage points was recorded for a high level of undertaken cooperation (a significant number of entities willing to cooperate) for events supported by a private organization, compared to events supported by a public organization. However, following the independence test, it turns out that the observed differentiation is not statistically significant. The test probability value in this case is 0.2914, which is higher than the adopted level of 0.05. Therefore, despite the differences, we reject the hypothesis regarding the impact of the supporting partner on the distribution of the partnership size in the analyzed events.
In order to verify the conclusions, Table 6 presents the values of the basic statistics for the number of partnerships, for events organized with public and private partners, respectively.
Upon analyzing the position measures presented in Table 6, it can be concluded that, however, the type of partner impacted the effectiveness of the event, as expressed by the number of partnerships. The average value for the group of events with a private partner was over 15 times higher than the average for events with a public partner. Additionally, the median value for events supported by a private partner was higher than the median number of partnerships for promotional events with a public partner.
However, also in this case, the indicated differences in the values of measures for location did not turn out to be statistically significant. The test probability value for the Student’s t-test was greater than 0.05. This analysis therefore confirmed the previous results. Thus, the H3 hypothesis that the type of partner supporting the event significantly influenced the number of partnerships was not confirmed.

5. Theoretical Implications and Discussion

The study’s results indicate the role of inter-organizational cooperation in the RES market. One of the findings shows that (1) the structure of the distribution of events across the adopted levels of the number of meetings was diversified, depending on the region; (2) there was a significant variation in the number of meetings within organized events in individual regions of Europe; and (3) there was a significant variation in the number of partnerships for one event in individual European countries. Specifically, the number of meetings and partnerships initiated in association with these events varied in particular countries and regions. This finding confirms and augments the observation reported in the previous study, namely, the national and regional diversity of the types of promotional events organized by the EEN in the RES market in Europe [14]. The authors observed that an event’s effectiveness differed depending on the event’s location, in line with Cohen [44], Isenberg [50], and Feld [45], who posit the impact of the local business environment on business activity, as well as with researchers who observed the impact of the ecosystem on innovation activity [51]; in particular, on national [52] and regional levels [53].
Our second finding indicates that the type of event (BE versus CM) had a significant impact on the number of meetings and the number of entities willing to cooperate. There were many more meetings during BE meetings than in the case of CMs. This observation supports previous findings that public programs (within innovation ecosystems) promote cooperation with knowledge providers [54]; based on our findings, we can recommend using brokerage events to enhance cooperation. This is a valuable indication, as we know that network cohesion and organization have an impact on network-related success factors [55]. In this context, promotional events (including BEs and CMs) are elements of a network’s infrastructure that have the potential to strengthen partnerships within networks and access to diverse information (which results in an increase in innovation) [56]. In general, our findings are in line with Rosson and Seringhaus [57], who posited that events such as trade shows are potential networking forums for their participants. In a similar vein, Evers and Knight [58] observed that trade shows make an important contribution to the establishment and enhancement of a network infrastructure that enables firms to grow and expand internationally. In the broader context, the evidenced varying impact of an event’s type corresponds with the concept of social capital [29] by indicating the role of the structure of an event’s participants (specific for the examined types of events) for the effectiveness of the event. Additionally, the observed dependence on an event’s type corresponds with the concept of the network theory of competitive advantage [59] and should help to build this advantage through the utilization of proper types of events. Finally, we observed that the choice of a partner did not have a significant impact on the number of meetings that took place as part of the organized event. We reject the hypothesis regarding the influence of the supporting partner on the distribution of the size of cooperation in the analyzed events. This suggests that the differences between private and public partners [14] are taken into account by event organizers and adjusted to the local character, so as to ensure high effectiveness for the events. This observation offers some solutions important for supporting the RES sectoral innovation system. This approach is in line with Bresci and Malerba [41] and their observation regarding the need to adjust an innovation system to a sector’s specifics.

6. Limitations of Analysis and Future Research

When interpreting the results, it is necessary to take into account certain limitations related to the variables, as well as the method and the research sample. In our research model, we included only five variables. The effectiveness of the events in terms of supporting cooperation was measured by two parameters: the number of meetings held during the events and the number of partnerships initiated as a result of meetings held during the events. The adoption of these parameters was related to the availability of data; however, taking into account other parameters would help to better reflect the effectiveness of the meetings. The study considered the potential impact of three variables: the event location, event type, and lead event partner type. Meanwhile, the effectiveness of events in the context of supporting cooperation may also be influenced by other factors. It should also be noted that our analysis included events organized by only one of the business networks, i.e., the Enterprise Europe Network, and the behavior of its participants. In the analyzed sample, only one event was reported in several countries (while the maximum number of events for a country was 43); however, we explored the countries where at least three events within the EEN network were recorded. To overcome this insufficiency, we additionally analyzed the number of meetings and partnerships in the studied promotional events in terms of the European region in which the event took place. Thus, our research sample did not represent the entire population of the potential determinants of efficiency and the use of statistical methods that would allow operating on the European RES market. The analyzed data enabled us to examine only two types of events (namely, brokerage events and company missions), while other types took place as well. The aforementioned limitations suggest proposals for further research directions. In future research, it would be advisable to take into account a wider spectrum of variables, in particular, an assessment of the relationship between the variables and possible moderating effects. Their definition would be useful for improving the effectiveness of activities supporting cooperation and the development of partner networks, as well as the development of the RES market. This, in turn, is important from the perspective of disseminating RES technologies and achieving ambitious goals in the field of energy policy. Additionally, the inclusion of other types of events (such as workshops, seminars, trade shows, exhibitions, and fairs) is recommended, as they may also support cooperation in the RES market. The incorporation of additional variables (such as the number of participants or the characteristics of an audience (e.g., national versus international)) would enable us to deepen our knowledge about the mechanism behind initiating partnerships through RES promotional events.

7. Conclusions

Our study offers meaningful implications and recommendations for enterprises, business networks, and event managers operating in RES markets. The key message for practitioners is that BEs are more effective in terms of supporting inter-organizational cooperation than CMs. In particular, BE meetings take place in a much greater number than CM meetings; the number of meetings is one of the determinants of effectiveness. These observations are valuable for both events’ organizers (how to profile their event to maximize its efficiency) and events’ participants (what event to choose to increase their chance of finding a new partner and initiating a new partnership).
This study contributes to RES market development and inter-organizational relations theory. The findings of this paper explain the role of business networks and the events organized within these networks in strengthening inter-organizational cooperation. In particular, this study shows ways to increase the effectiveness of the instruments used in the RES market, and it indicates their diversity in terms of locations and types. With these findings, the study contributes to the concept of the sectoral innovation system, indicating several specifics of the RES innovation system.

Author Contributions

Conceptualization, Z.G.-S., M.S., and R.K.; methodology, Z.G.-S., M.S., and R.K.; validation, J.S. and M.N.; formal analysis, Z.G.-S., M.S., and R.K.; investigation, Z.G.-S., M.S., R.K., J.S., and M.N.; resources, Z.G.-S., M.S., and R.K.; data curation, J.S. and M.N.; writing—original draft preparation, Z.G.-S., M.S., and R.K.; writing—Z.G.-S., M.S., and R.K.; visualization M.S. and Z.G.-S.; supervision, J.S. and M.N. All authors have read and agreed to the published version of the manuscript.

Funding

This publication was financed by a subsidy granted to the Cracow University of Economics. The publication was financed by a subsidy for the Faculty of Management of AGH University for the maintenance and development of research potential.

Conflicts of Interest

The authors declare no conflict of interest.

References

  1. Sieg, J.H.; Wallin, M.W.; von Krogh, G. Managerial challenges in open innovation: A study of innovation intermediation in the chemical industry. R D Manag. 2010, 40, 281–291. [Google Scholar] [CrossRef]
  2. Smedlund, A. The roles of intermediaries in regional knowledge systems. J. Intellect. Cap. 2006, 7, 204–222. [Google Scholar] [CrossRef] [Green Version]
  3. Knockaert, M.; Spithoven, A.; Clarysse, B. The impact of technology intermediaries on firm cognitive capacity additionality. Technol. Forecast. Soc. Chang. 2014, 81, 376–387. [Google Scholar] [CrossRef] [Green Version]
  4. Lin, H.; Zeng, S.; Liu, H.; Li, C. How do intermediaries drive corporate innovation? A moderated examination. J. Bus. Res. 2016, 69, 4831–4836. [Google Scholar] [CrossRef]
  5. Howells, J. Intermediation and the role of intermediaries in innovation. Res. Policy 2006, 35, 715–728. [Google Scholar] [CrossRef]
  6. Klerkx, L.; Leeuwis, C. Matching demand and supply in the agricultural knowledge infrastructure: Experiences with innovation intermediaries. Food Policy 2008, 33, 260–276. [Google Scholar] [CrossRef]
  7. Gródek-Szostak, Z.; Szeląg-Sikora, A.; Sikora, J.; Korenko, M. Prerequisites for the cooperation between enterprises and business support institutions for technological development. In Business and Non-profit Organizations Facing Increased Competition and Growing Customers’ Demand; Wyższa Szkoła Biznesu, National–Louis University: Nowy Sącz, Poland, 2017; Volume 16, pp. 427–439. [Google Scholar]
  8. Gródek-Szostak, Z.; Luc, M.; Szeląg-Sikora, A.; Sikora, J.; Niemiec, M.; Ochoa Siguencia, L.; Velinov, E. Promotion of RES in a Technology Transfer Network. Case Study of the Enterprise Europe Network. Energies 2020, 13, 3445. [Google Scholar] [CrossRef]
  9. Szeląg-Sikora, A.; Sikora, J.; Niemiec, M.; Gródek-Szostak, Z.; Kapusta-Duch, J.; Kuboń, M.; Komorowska, M.; Karcz, J. Impact of Integrated and Conventional Plant Production on Selected Soil Parameters in Carrot Production. Sustainability 2019, 11, 5612. [Google Scholar] [CrossRef] [Green Version]
  10. Niemiec, M.; Chowaniak, M.; Sikora, J.; Szeląg-Sikora, A.; Gródek-Szostak, Z.; Komorowska, M. Selected Properties of Soils for Long-Term Use in Organic Farming. Sustainability 2020, 12, 2509. [Google Scholar] [CrossRef] [Green Version]
  11. Velinov, E.; Petrenko, Y.; Vechkinzova, E.; Denisov, I.; Ochoa Siguencia, L.; Gródek-Szostak, Z. “Leaky Bucket” of Kazakhstan’s Power Grid: Losses and Inefficient Distribution of Electric Power. Energies 2020, 13, 2947. [Google Scholar] [CrossRef]
  12. Sikora, J.; Niemiec, M.; Szeląg-Sikora, A.; Gródek-Szostak, Z.; Kuboń, M.; Komorowska, M. The Impact of a Controlled-Release Fertilizer on Greenhouse Gas Emissions and the Efficiency of the Production of Chinese Cabbage. Energies 2020, 13, 2063. [Google Scholar] [CrossRef] [Green Version]
  13. REN21. Renewables 2019 Global Status Report; REN21 Secretariat: Paris, France, 2019; Available online: http://www.ren21.net/gsr-2019/ (accessed on 4 November 2020).
  14. Gródek-Szostak, Z.; Suder, M.; Kusa, R.; Szeląg-Sikora, A.; Duda, J.; Niemiec, M. Renewable Energy Promotion Instruments Used by Innovation Brokers in a Technology Transfer Network. Case Study of the Enterprise Europe Network. Energies 2020, 13, 5752. [Google Scholar] [CrossRef]
  15. Sanderink, L.; Nasiritousi, N. How institutional interactions can strengthen effectiveness: The case of multi-stakeholder partnerships for renewable energy. Energy Policy 2020, 141, 111447. [Google Scholar] [CrossRef]
  16. Erickson, J.D.; Chapman, D. Technologia fotowoltaiczna: Rynki, ekonomia i rozwój obszarów wiejskich. World Dev. 1995, 23, 1129–1141. [Google Scholar] [CrossRef]
  17. Dwyer, F.R.; Schurr, P.H.; Oh, S. Developing buyer–supplier relationships. J. Mark. 1987, 51, 11–27. [Google Scholar] [CrossRef]
  18. Von Hippel, E. Cooperation between rivals: Informal know-how trading. Res. Policy 1987, 16, 291–302. [Google Scholar] [CrossRef]
  19. Wood, D.; Gray, B. Toward a Comprehensive Theory of Collaboration. J. Appl. Behav. Sci. 1991, 27, 139–162. [Google Scholar] [CrossRef]
  20. Dyer, J.H.; Singh, H. The Relational View: Cooperative Strategy and Sources of Interorganizational Competitive Advantage. Acad. Manag. Rev. 1998, 23, 660–679. [Google Scholar] [CrossRef] [Green Version]
  21. Yue-Ming, S. Inter-organizational Network and Firm Performance: The Case of the Bicycle Industry in Taiwan. Asian Bus. Manag. 2005, 4, 67–91. [Google Scholar] [CrossRef]
  22. Fawcett, S.E.; Magnan, G.M.; McCarter, M.W. A Three-Stage Implementation Model for Supply Chain Collaboration. J. Bus. Logist. 2008, 29, 93–112. [Google Scholar] [CrossRef]
  23. Venugopalan, M.; Gyanendra, S.; Rajeevkumar, P. Business relational capital and firm performance: An insight from Indian textile industry. Int. J. Learn. Intell. Cap. 2018, 15, 341–362. [Google Scholar] [CrossRef]
  24. Welbourne, T.M.; Pardo-del-Val, M. Relational Capital: Strategic Advantage for Small and Medium-Size Enterprises (SMEs) Through Negotiation and Collaboration. Group Decis. Negot. 2009, 18, 483–497. [Google Scholar] [CrossRef]
  25. Alexiev, A.S.; Volberda, H.W.; Van den Bosch, F.A.J. Interorganizational collaboration and firm innovativeness: Unpacking the role of the organizational environment. J. Bus. Res. 2016, 69, 974–984. [Google Scholar] [CrossRef]
  26. Kusa, R.; Palacios Marques, D.; Ribeiro Navarrete, B. External cooperation and entrepreneurial orientation in industrial clusters. Entrep. Reg. Dev. 2019, 31, 119–132. [Google Scholar] [CrossRef]
  27. Coleman, J.S. Foundations of Social Theory; Harvard University Press: Cambridge, MA, USA, 1990. [Google Scholar]
  28. Strobl, A.; Peters, M.; Raich, M. Entrepreneurial Networks: Exploring the Role of Social Capital. Int. Rev. Entrep. 2014, 12, 103–132. [Google Scholar]
  29. Nahapiet, J.; Ghoshal, S. Social capital, intellectual capital, and the organizational advantage. Acad. Manag. Rev. 1998, 23, 242–266. [Google Scholar] [CrossRef]
  30. Presutti, M.; Odorici, V. Linking entrepreneurial and market orientation to the SME’s performance growth: The moderating role of entrepreneurial experience and networks. Int. Entrep. Manag. J. 2019, 15, 697–720. [Google Scholar] [CrossRef]
  31. Goes, J.B.; Park, S.H. Interorganizational links and innovation: The case of hospital services. Acad. Manag. J. 1997, 40, 673–696. [Google Scholar]
  32. Kraatz, M.S. Learning by association? Interorganizational networks and adaptation to environmental change. Acad. Manag. J. 1998, 41, 621–643. [Google Scholar]
  33. Barringer, B.R.; Ireland, R.D. Entrepreneurship: Successfully Launching New Ventures, 5th ed.; Prentice Hall: Upper Saddle River, NJ, USA, 2016. [Google Scholar]
  34. Li, J.J.; Zhou, K.Z. How foreign firms achieve competitive advantage in the Chinese emerging economy: Managerial ties and market orientation. J. Bus. Res. 2010, 63, 856–862. [Google Scholar] [CrossRef] [Green Version]
  35. Jost, P. Endogenous formation of entrepreneurial networks. Small Bus. Econ. 2019. [Google Scholar] [CrossRef]
  36. Schoonjans, B.; Van Cauwenberge, P.; Vander Bauwhede, H. Formal business networking and SME growth. Small Bus. Econ. 2013, 41, 169–181. [Google Scholar] [CrossRef]
  37. Xu, Z.; Lin, J.; Lin, D. Networking and innovation in SMEs: Evidence from Guangdong Province, China. J. Small Bus. Enterp. Dev. 2008, 15, 788–801. [Google Scholar] [CrossRef]
  38. Gulati, R. Network location and learning: The influence of network resources and firm capabilities on alliance formation. Strateg. Manag. J. 1999, 20, 397–420. [Google Scholar] [CrossRef]
  39. Czakon, W. Network Strategies Logic. Problemy Zarządzania 2016, 14, 17–30. [Google Scholar]
  40. Uzzi, B. The Sources and Consequences of Embeddedness for the Economic Performance of Organizations: The Network Effect. Am. Sociol. Rev. 1996, 61, 674–698. [Google Scholar] [CrossRef]
  41. Breschi, S.; Malerba, F. Sectoral innovation systems: Technological regimes, Schumpeterian dynamics, and spatial boundaries. In Systems of Innovation: Technologies, Institutions and Organizations; Edquist, C., Ed.; Routledge: London, UK, 1997; pp. 130–156. [Google Scholar]
  42. Leick, B.; Gretzinger, S. Business networking in organisationally thin regions: A case study on network brokers, SMEs and knowledge-sharing. J. Small Bus. Enterp. Dev. 2020, 27, 839–861. [Google Scholar] [CrossRef]
  43. Cisi, M.; Devicienti, F.; Manello, A.; Vannoni, D. The advantages of formalizing networks: New evidence from Italian SMEs. Small Bus. Econ. 2020, 54, 1183–1200. [Google Scholar] [CrossRef]
  44. Cohen, B. Sustainable valley entrepreneurial ecosystems. Bus. Strategy Environ. 2006, 15, 1–14. [Google Scholar] [CrossRef]
  45. Feld, B. Startup Communities: Building an Entrepreneurial Ecosystem in Your City; John Wiley & Sons: Hoboken, NJ, USA, 2012. [Google Scholar]
  46. Stam, F.C.; Spigel, B. Entrepreneurial Ecosystems; USE Discussion Paper Series; Utrecht School of Economics: Utrecht, The Netherlands, 2016; Volume 16. [Google Scholar]
  47. Cochran, W.G. The χ2 test of goodness of fit. Ann. Math. Stat. 1952, 25, 315–345. [Google Scholar] [CrossRef]
  48. Montgomery, D.C. Introduction to Statistical Quality Control, 3rd ed.; John Wiley & Sons, Inc.: Hoboken, NJ, USA, 1997. [Google Scholar]
  49. Lehmann, E.L. NONPARAMETRICS: Statistical Methods Based on Ranks; Springer: Nowy Jork, NY, USA, 1975. [Google Scholar]
  50. Isenberg, D.J. How to start an entrepreneurial revolution. Harv. Bus. Rev. 2010, 88, 40–50. [Google Scholar]
  51. Edquist, C. Systems of innovation approaches: Their emergence and characteristics. In Systems of Innovation: Technologies, Institutions and Organizations; Edquist, C., Ed.; Routledge: London, UK, 1997; pp. 1–35. [Google Scholar]
  52. Lundvall, B.-A. (Ed.) National Systems of Innovation: Towards a Theory of Innovation and Interactive Learning; Pinter Publishers: London, UK, 1992. [Google Scholar]
  53. Asheim, B.T.; Gertler, M.S. The geography of innovation: Regional innovation systems. In The Oxford Handbook of Innovation; Fagerberg, J., Mowery, D., Nelson, R., Eds.; Oxford University Press: Oxford, UK, 2005; pp. 291–317. [Google Scholar]
  54. Radicic, D.; Pugh, G.; Douglas, D. Promoting cooperation in innovation ecosystems: Evidence from European traditional manufacturing SMEs. Small Bus Econ 2020, 54, 257–283. [Google Scholar] [CrossRef] [Green Version]
  55. Rese, A.; Baier, D. Success factors for innovation management in networks of small and medium enterprises. R D Manag. 2011, 41, 138–155. [Google Scholar] [CrossRef]
  56. Phelps, C.C. A Longitudinal Study of the Influence of Alliance Network Structure and Composition on Firm Exploratory Innovation. Acad. Manag. J. 2010, 53, 890–913. [Google Scholar] [CrossRef] [Green Version]
  57. Rosson, P.; Seringhaus, F.H.R. Visitor and exhibitor interaction at industrial trade shows. J. Bus. Res. 1995, 32, 81–90. [Google Scholar] [CrossRef]
  58. Evers, N.; Knight, J. Role of international trade shows in small firm internationalization: A network perspective. Int. Mark. Rev. 2008, 25, 544–562. [Google Scholar] [CrossRef]
  59. Coombs, R.; Metcalfe, J.S. Organizing for innovation: Co-ordinating distributed innovation capabilities. In Competence, Governance and Entrepreneurship; Foss, N., Ed.; Oxford University Press: Oxford, UK, 2000; pp. 209–231. [Google Scholar]
Figure 1. Results of statistical analysis for the number of meetings in the studied promotional events, depending on the country in which the event took place. Source: own study.
Energies 13 06443 g001
Figure 2. Results of statistical analysis for the number of meetings in the studied promotional events, depending on the European region in which the event took place. Source: own study.
Energies 13 06443 g002
Figure 3. Results of statistical analysis for the number of partnerships in the studied promotional events, depending on the country in which the event took place. Source: own study.
Energies 13 06443 g003
Figure 4. Results of statistical analysis for the number of partnerships in the studied promotional events, depending on the European region in which the event took place. Source: own study.
Energies 13 06443 g004
Figure 5. The percentage distribution of the analyzed events across specific levels as per the number of meetings, depending on the type of event. Source: own study.
Energies 13 06443 g005
Figure 6. The percentage distribution of the analyzed events across specific levels as per the number of partnerships, depending on the type of event. Source: own study.
Energies 13 06443 g006
Figure 7. The percentage distribution of the analyzed events across specific levels as per the number of meetings, depending on the type of supporting partner. Source: own study.
Energies 13 06443 g007
Figure 8. The percentage distribution of the analyzed events across specific levels as per the number of partnerships, depending on the type of supporting partner. Source: own study.
Energies 13 06443 g008
Table 1. Basic descriptive statistics for the number of meetings during the analyzed promotional events.
CountAverageMedianStandard DeviationCoeff. of VariationMin.Max.
304136.755.5241.9177%01446
Source: own study.
Table 2. Basic descriptive statistics for the number of partnerships during the analyzed promotional events.
CountAverageMedianStandard DeviationCoeff. of VariationMin.Max.
30432.6585.3263.7%0776
Source: own study.
Table 3. Basic descriptive statistics for the number of meetings, depending on the type of promotional event.
Type of EventCountAverageMedianStandard DeviationCoeff. of VariationMin.Max.
BE212177.777.5277.4156.1%01446
CM9245.52459.4130.7%0387
Source: own study.
Table 4. Basic descriptive statistics for the number of partnerships, depending on the type of promotional event.
Type of EventCountAverageMedianStandard DeviationCoeff. of VariationMin.Max.
BE21241.6899.7239.8%0776
CM9211.1323.6212.4%0131
Source: own study.
Table 5. Basic descriptive statistics for the number of meetings, depending on the type of supporting partner.
Type of PartnerCountAverageMedianStandard DeviationCoeff. of VariationMin.Max.
public247139.255245.1176.1%01446
private57131.161227.6173.6%0974
Source: own study.
Table 6. Basic descriptive statistics for the number of partnerships, depending on the type of supporting partner.
Type of PartnerCountAverageMedianStandard DeviationCoeff. of VariationMin.Max.
public24729.3481.3278.0%0776
private5745.811100.5219.7%0595
Publisher’s Note: MDPI stays neutral with regard to jurisdictional claims in published maps and institutional affiliations.

