Techno-Economic Assessment of Waste Heat Recovery Technologies for the Food Processing Industry †


Abstract
1. Introduction
2. Methodology
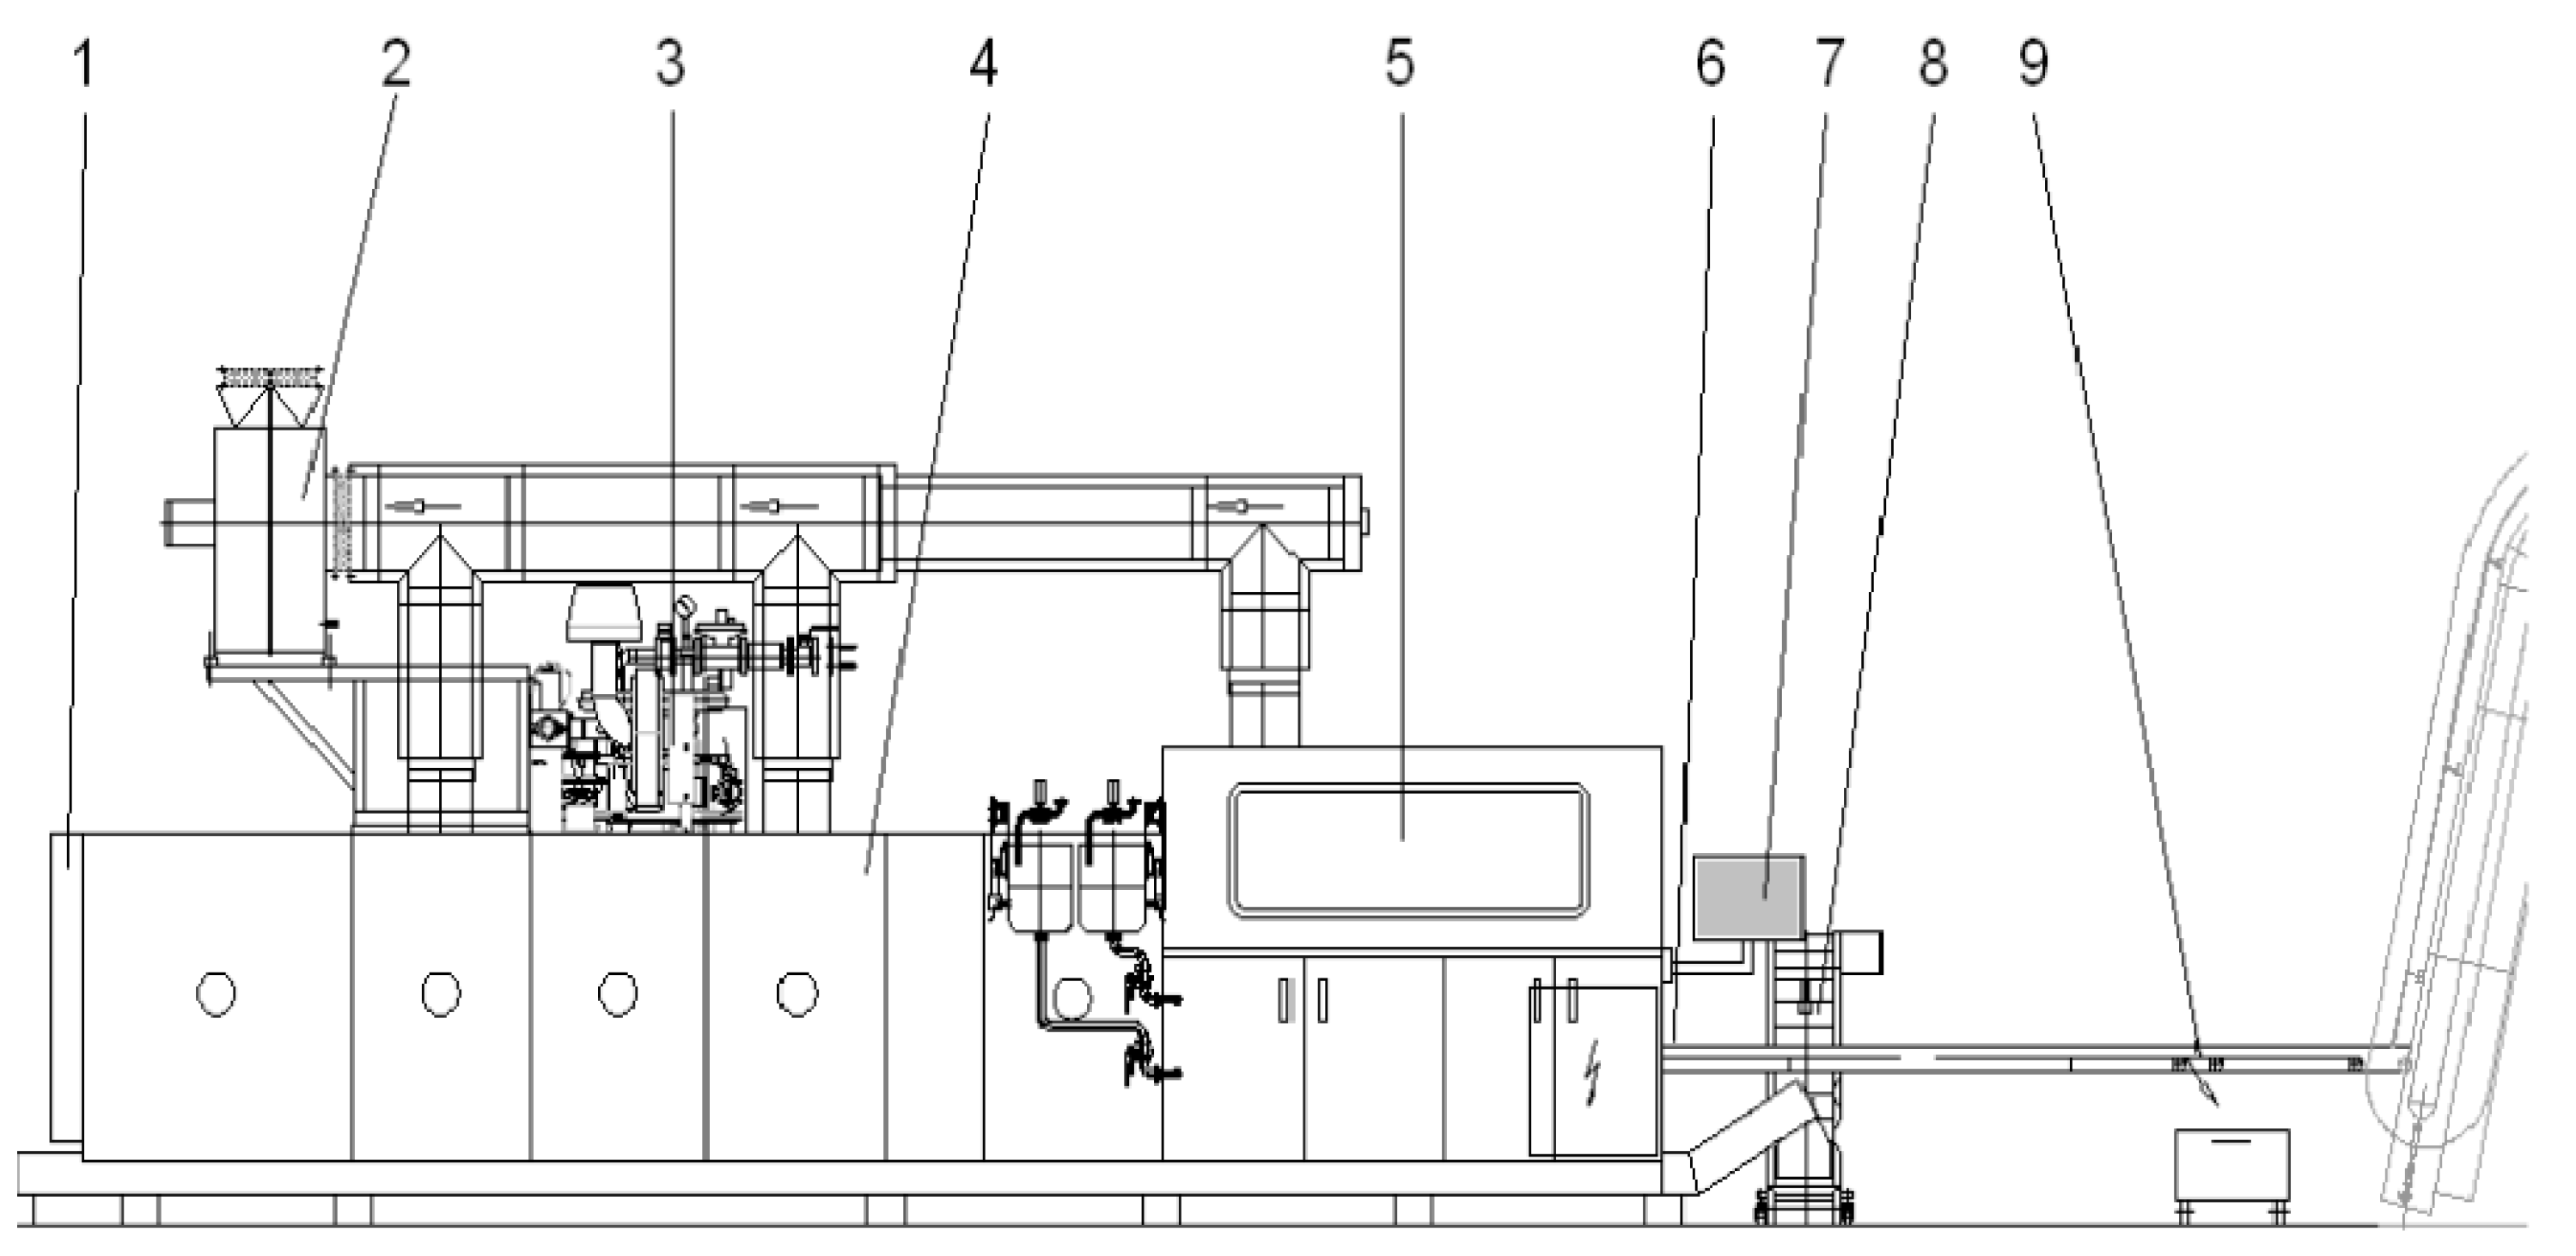
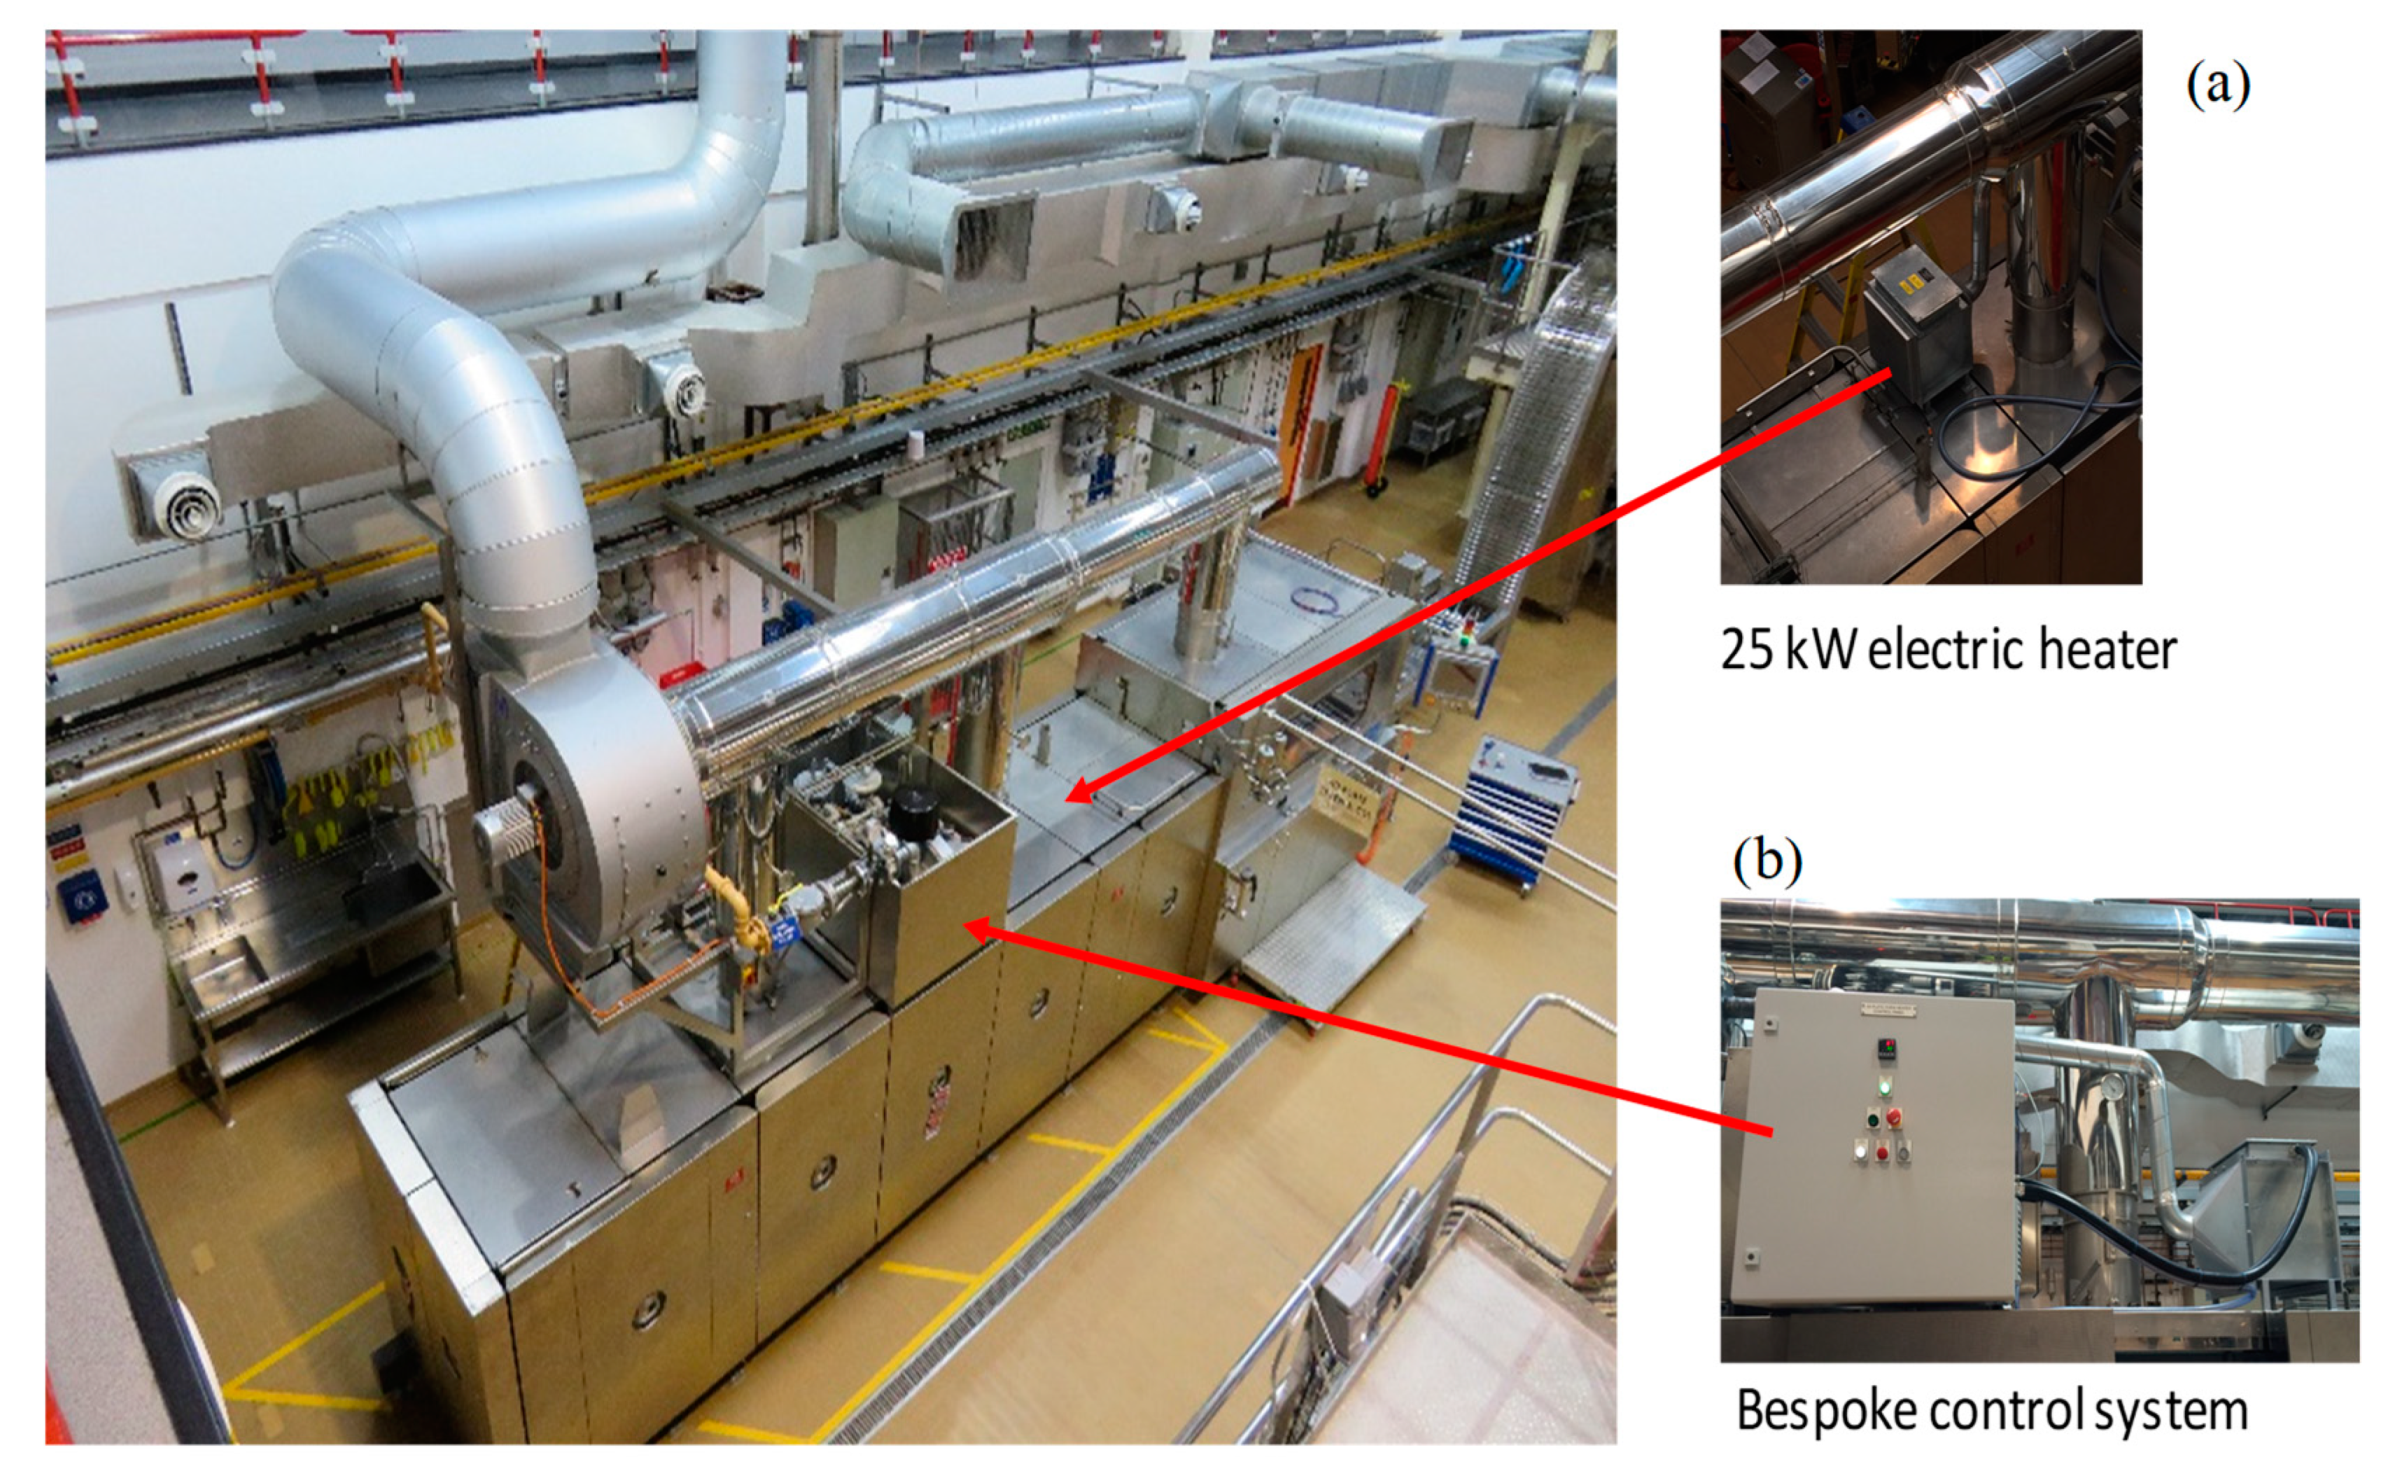
2.1. Baking Oven
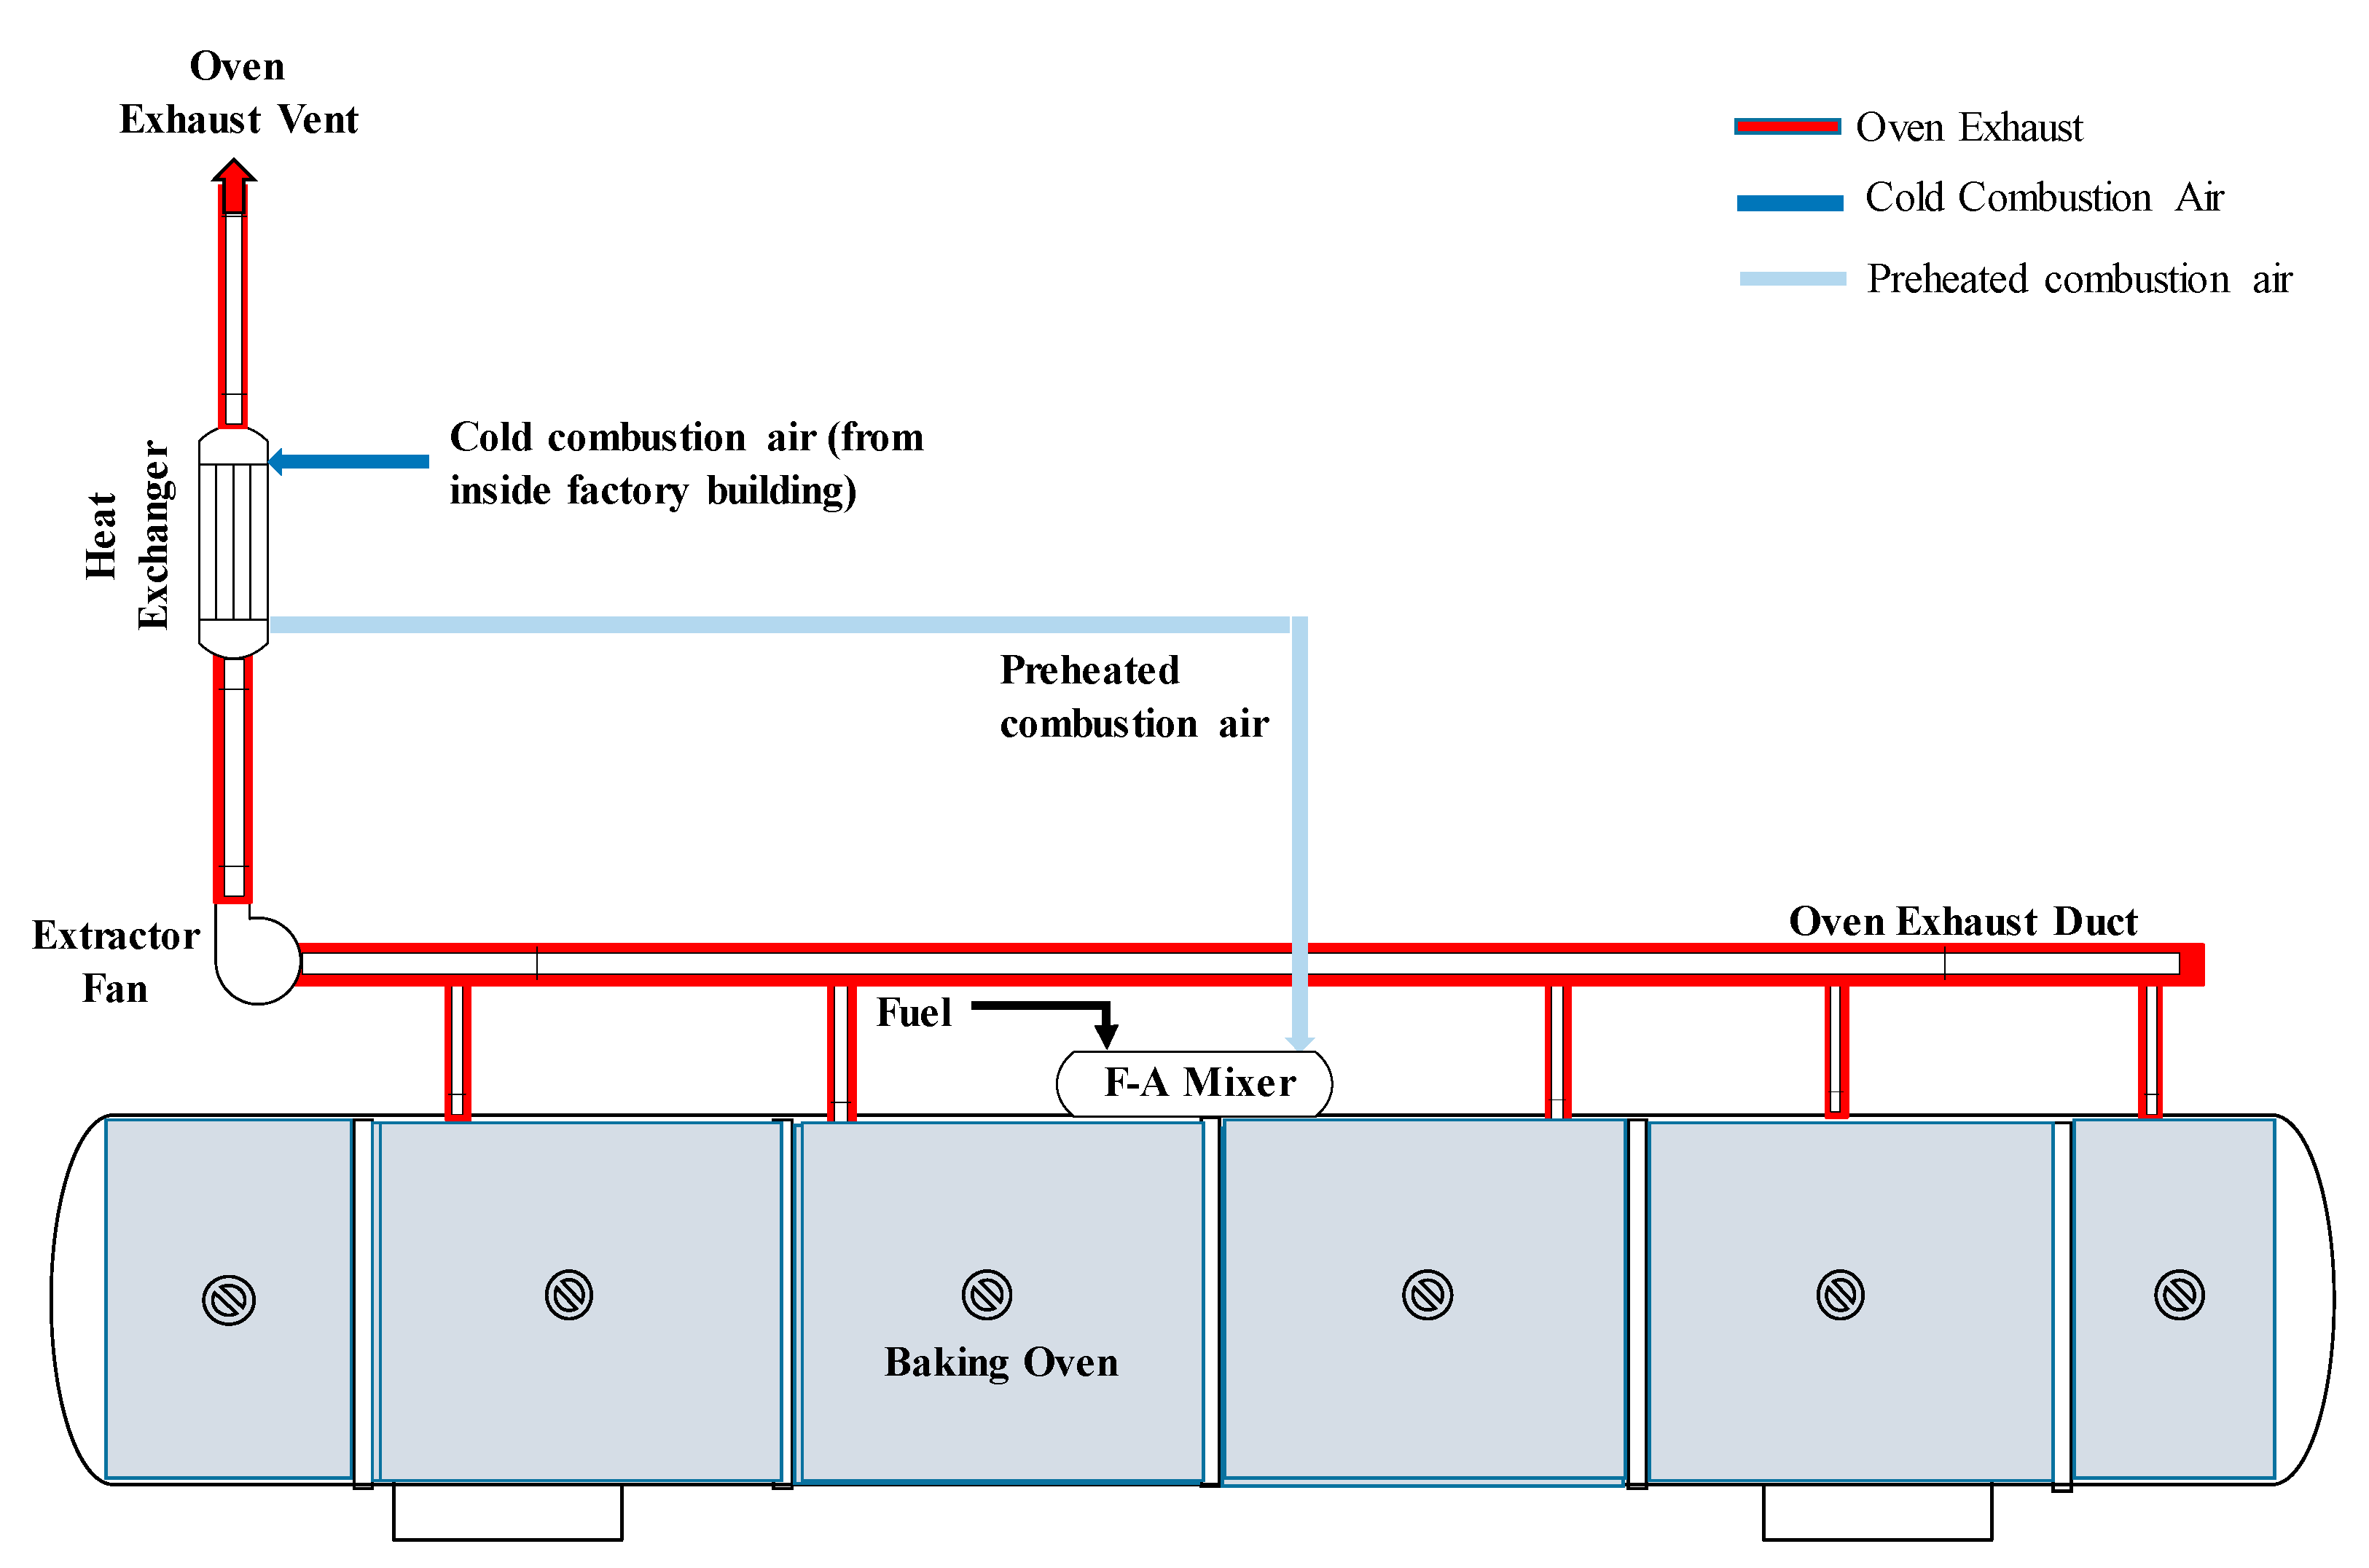
2.2. Combustion Air Preheating Experiments
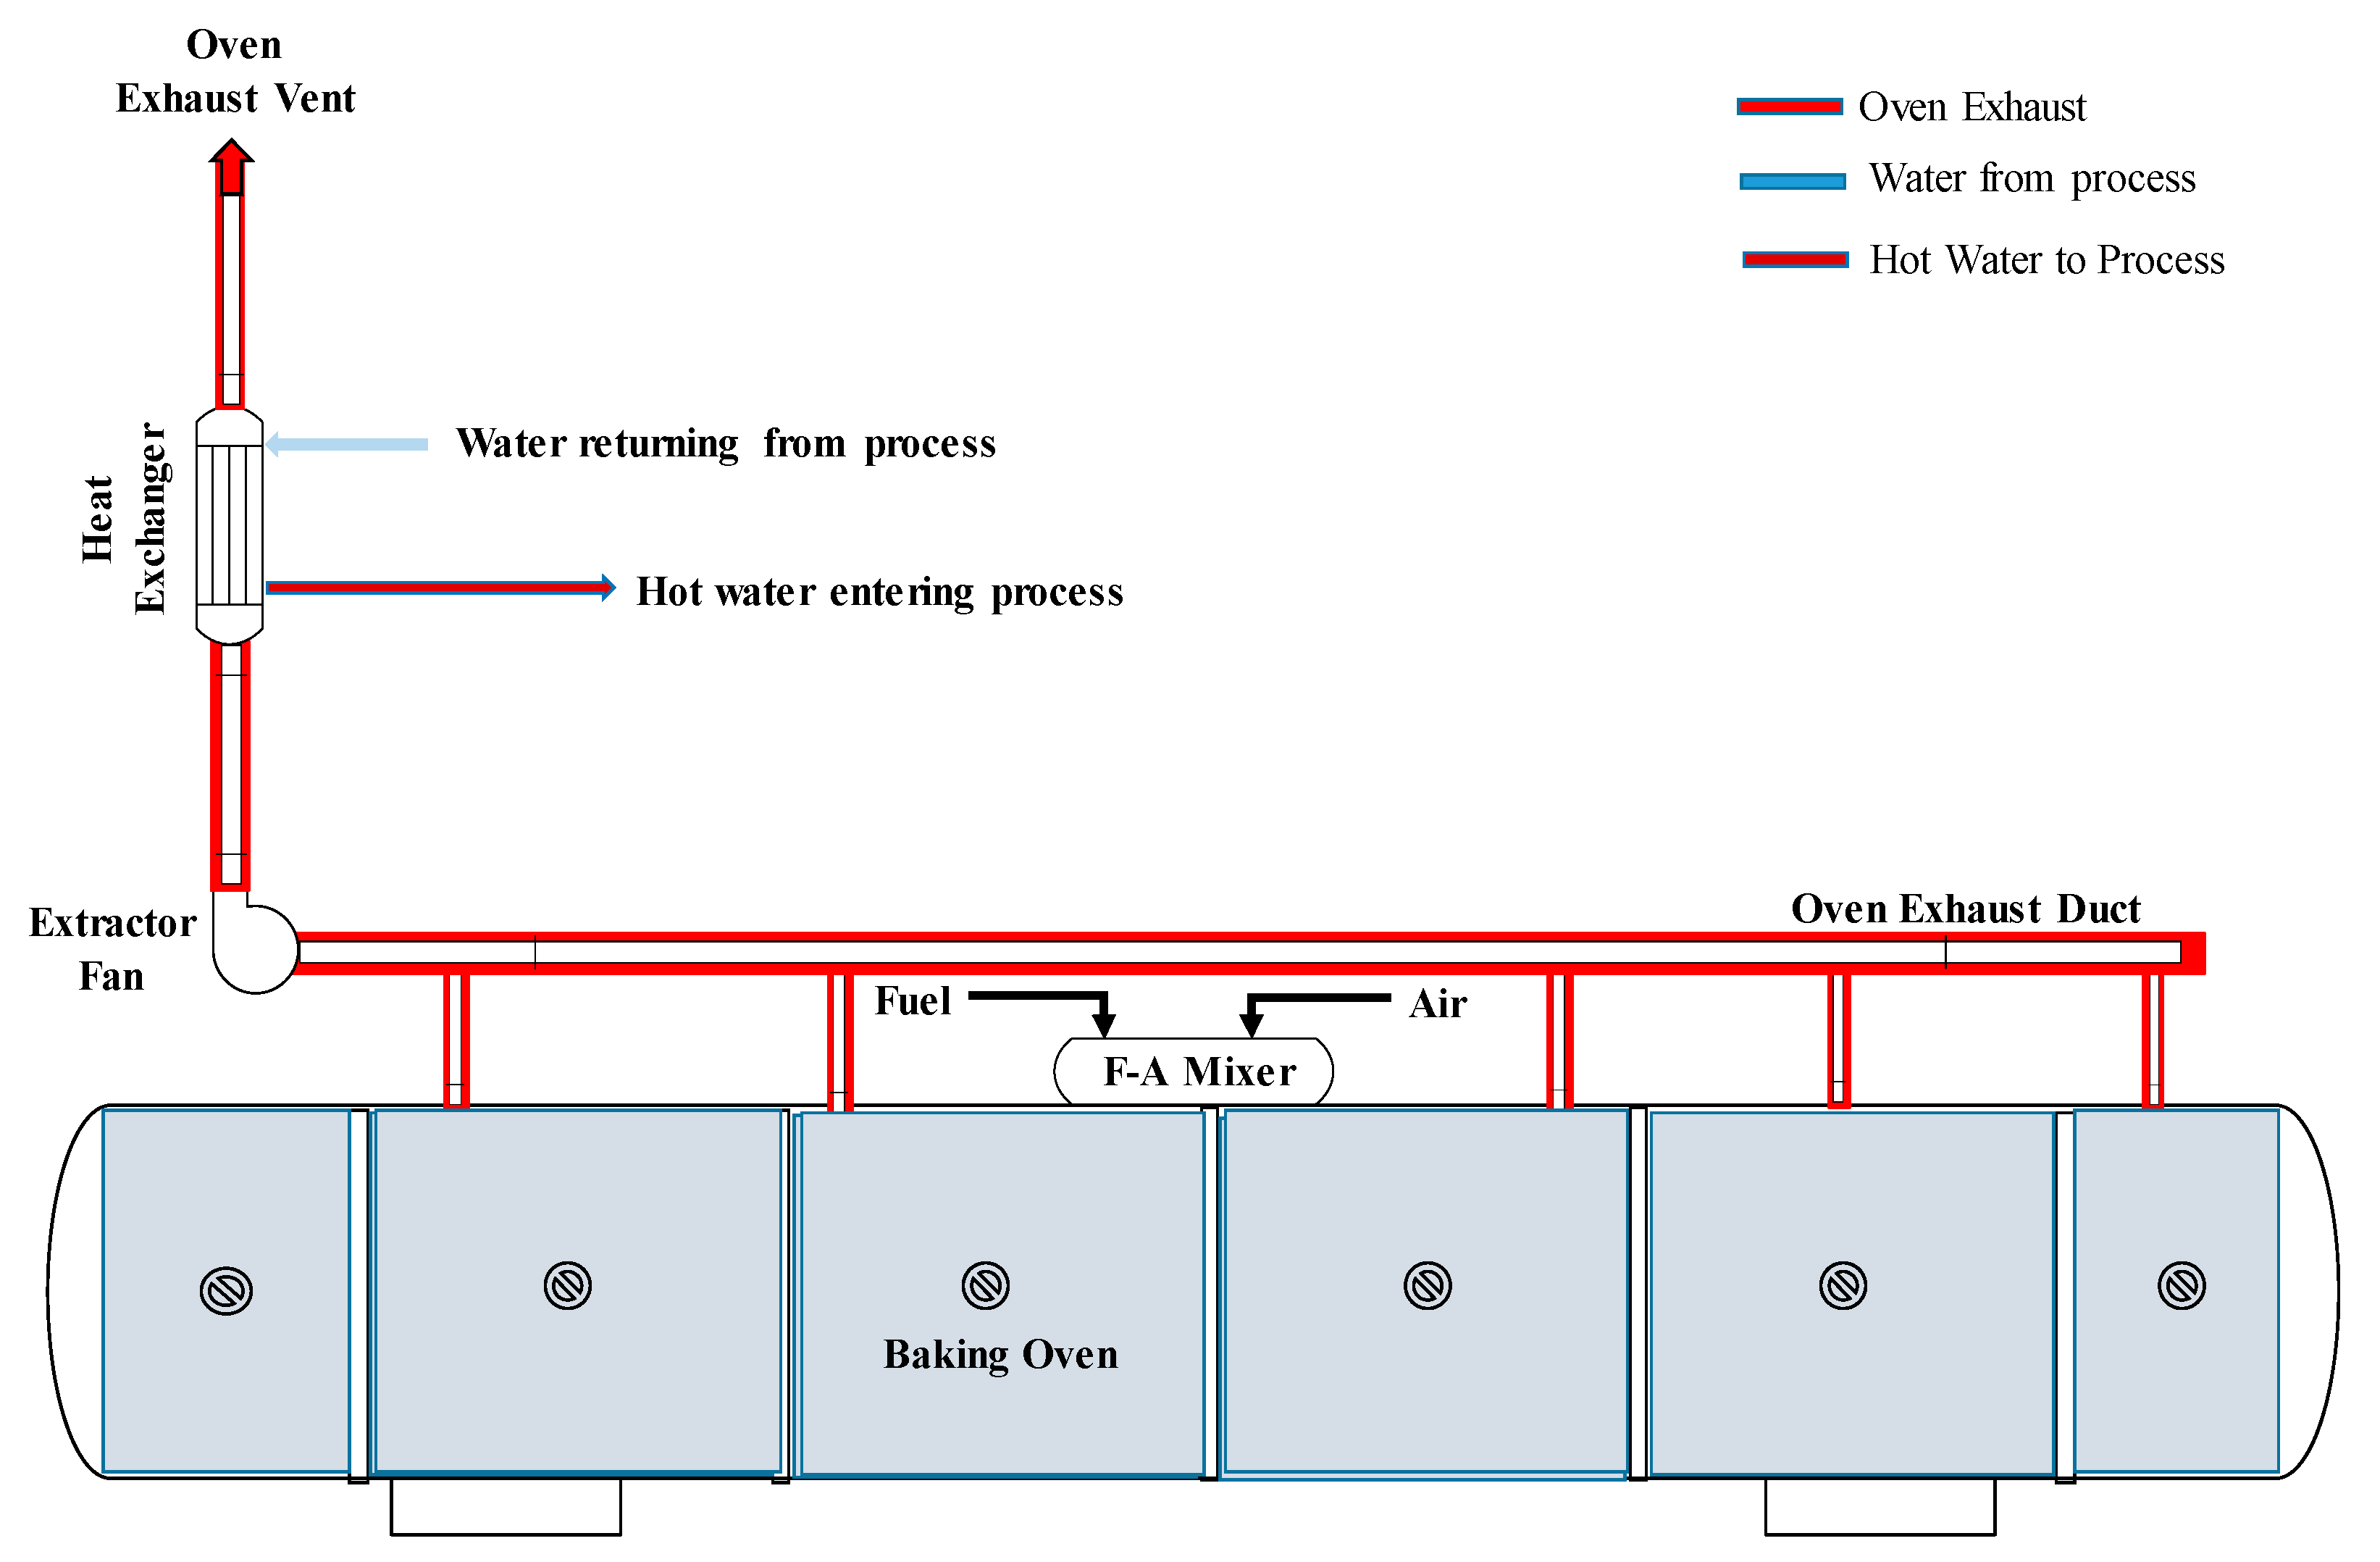
2.3. Hot Water Production System
2.4. Organic Rankine Cycle (ORC) Model
2.5. Vapour Absorption Refrigeration (VAR) System Model
2.6. Parameters for Economic Assessment
3. Results and Discussions
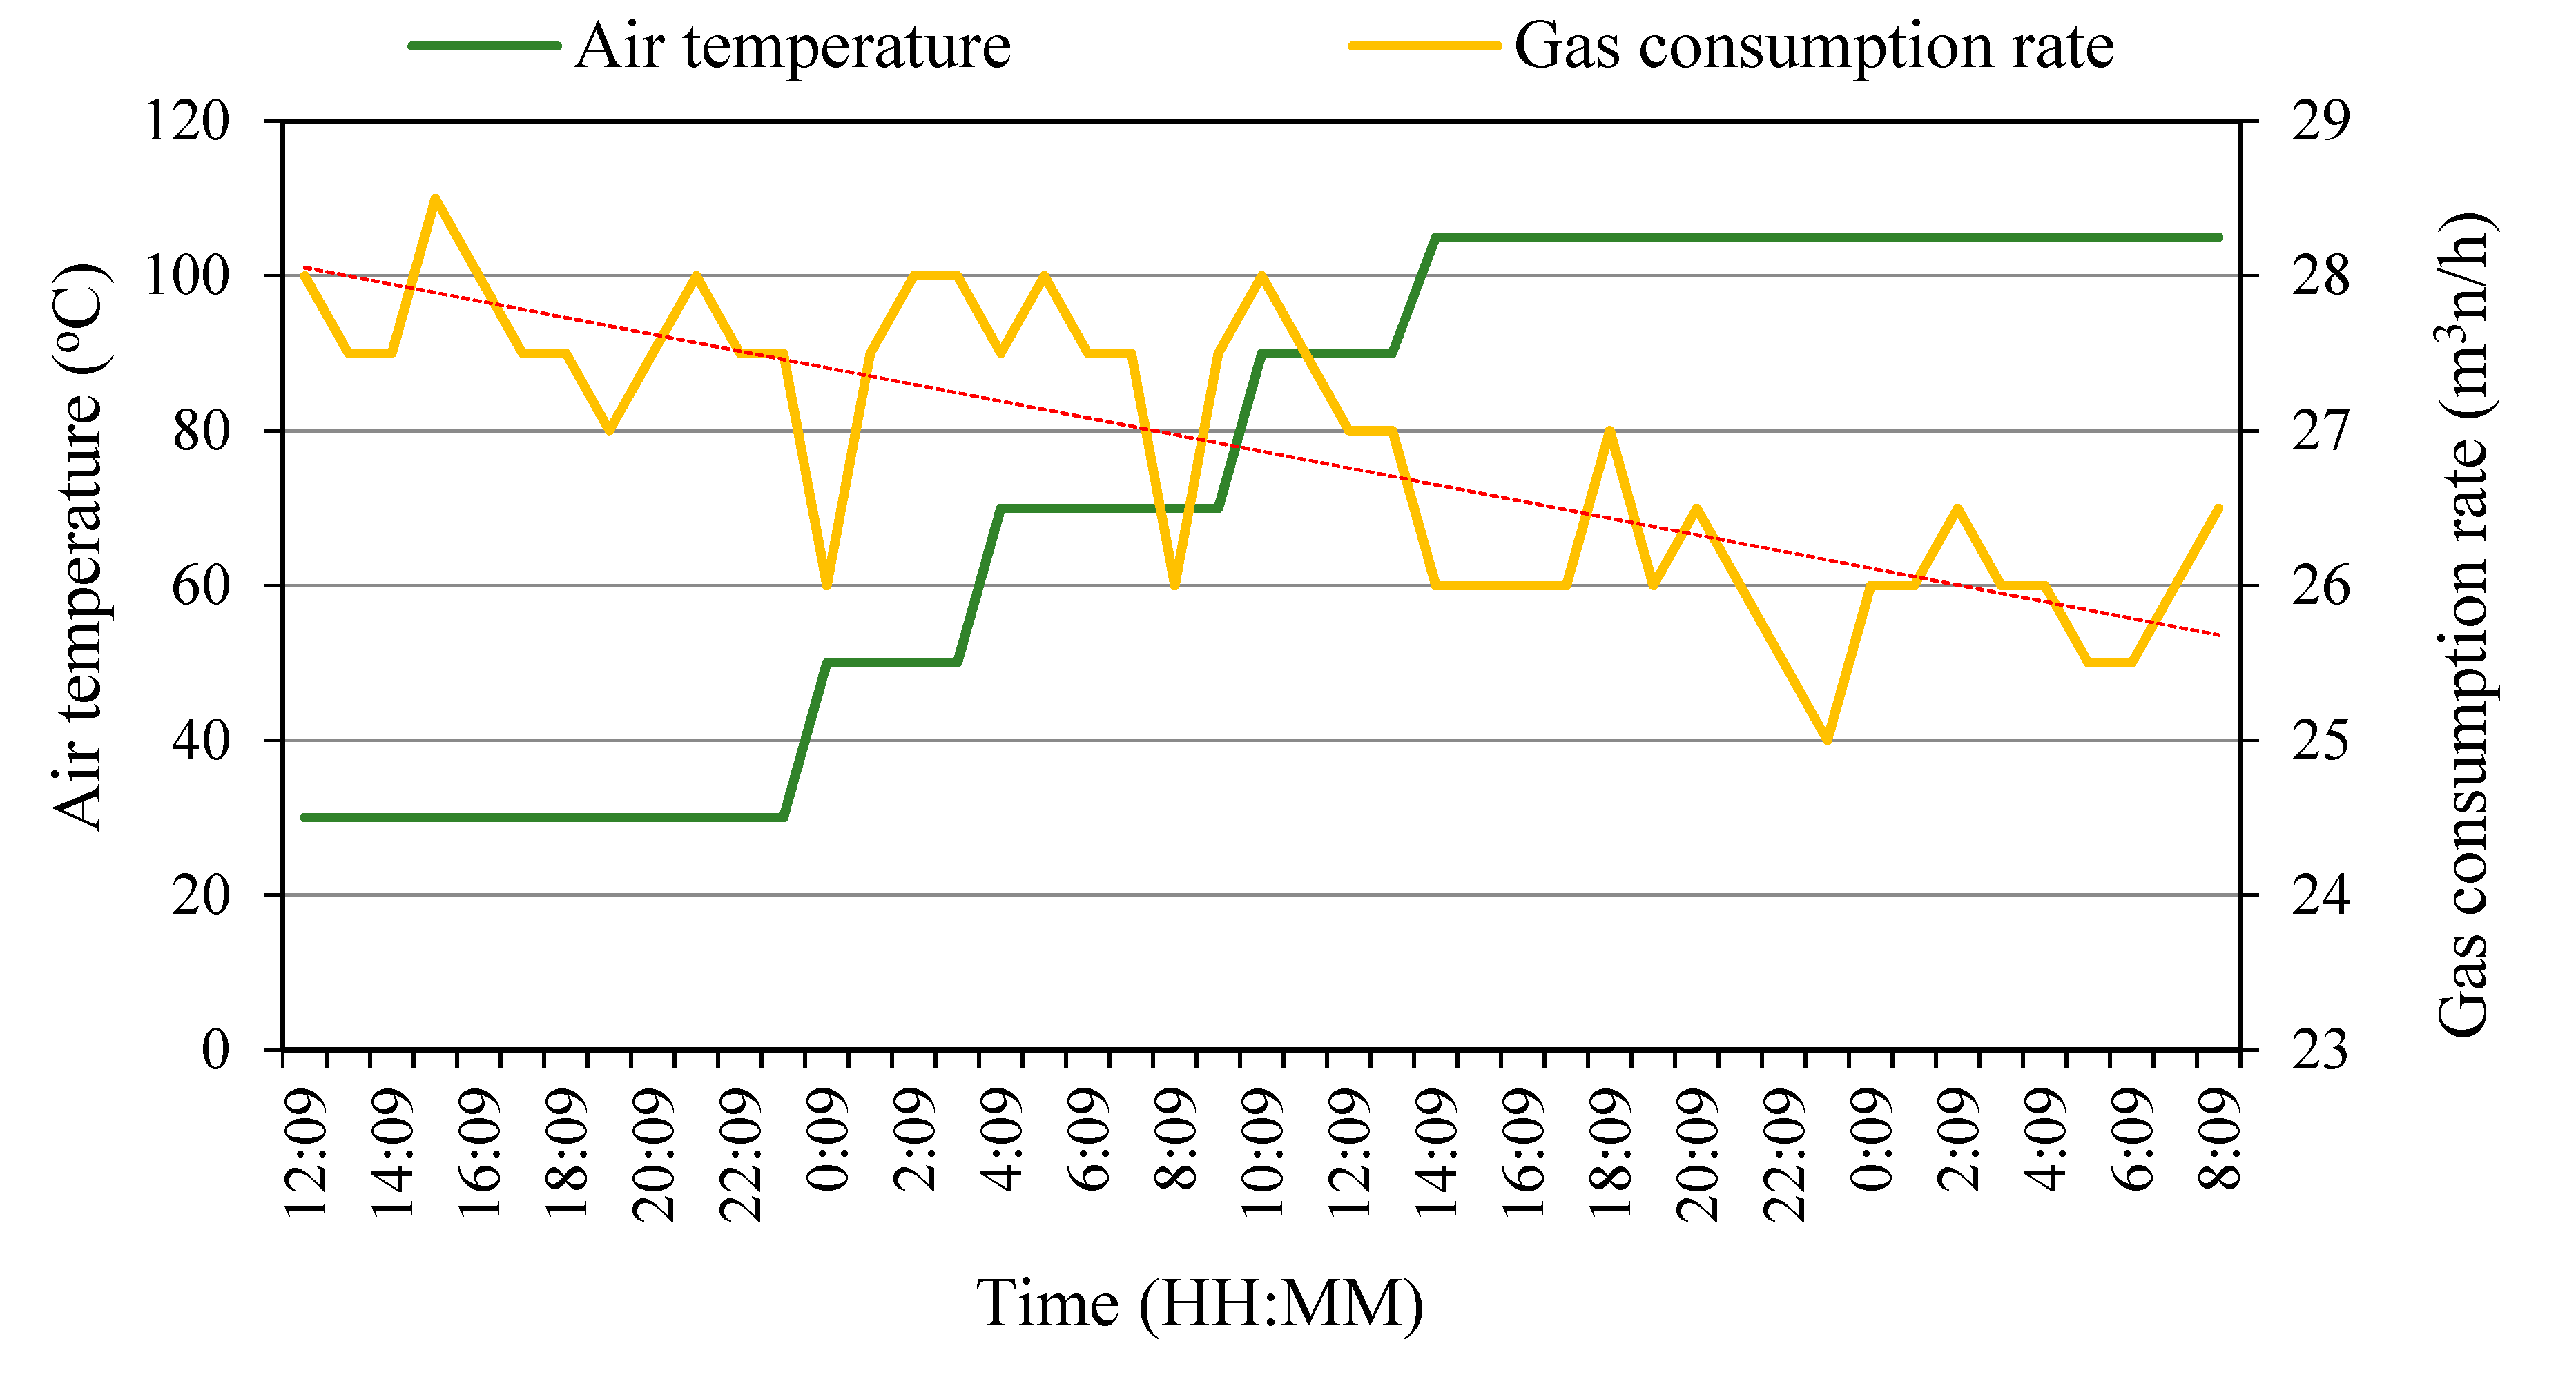
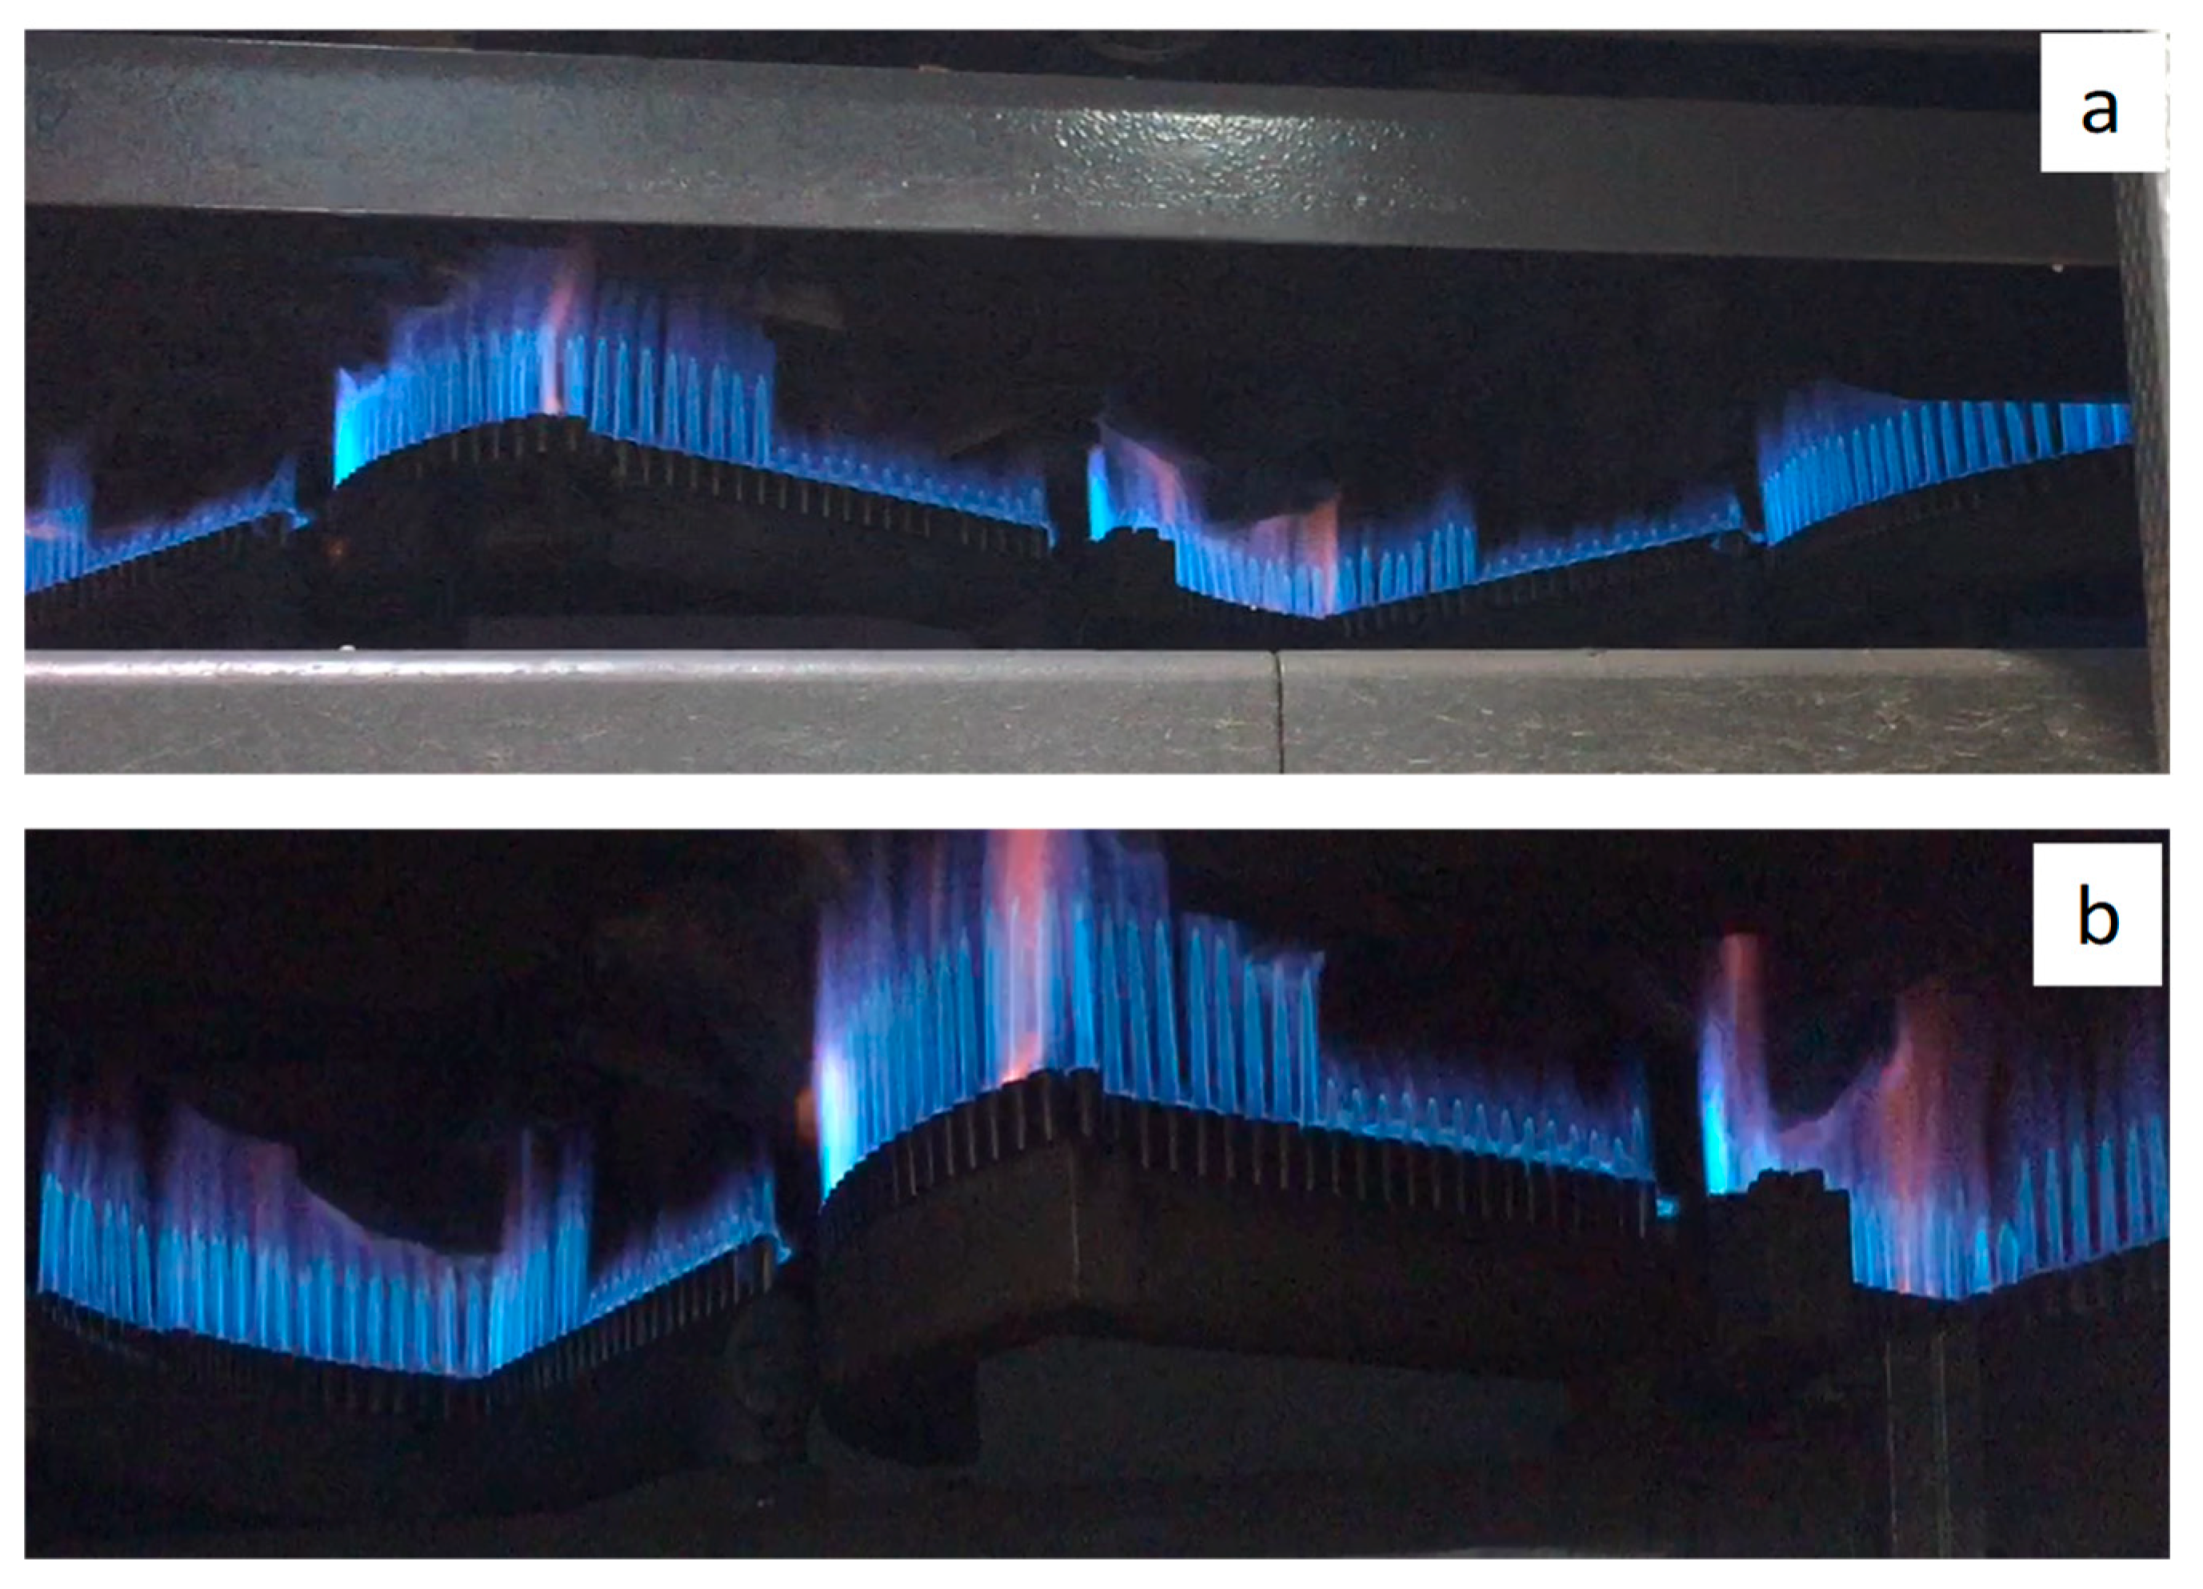
3.1. Pilot-Scale Combustion Air Preheating Experiments
3.2. Savings for an Industrial-Scale Baking Oven
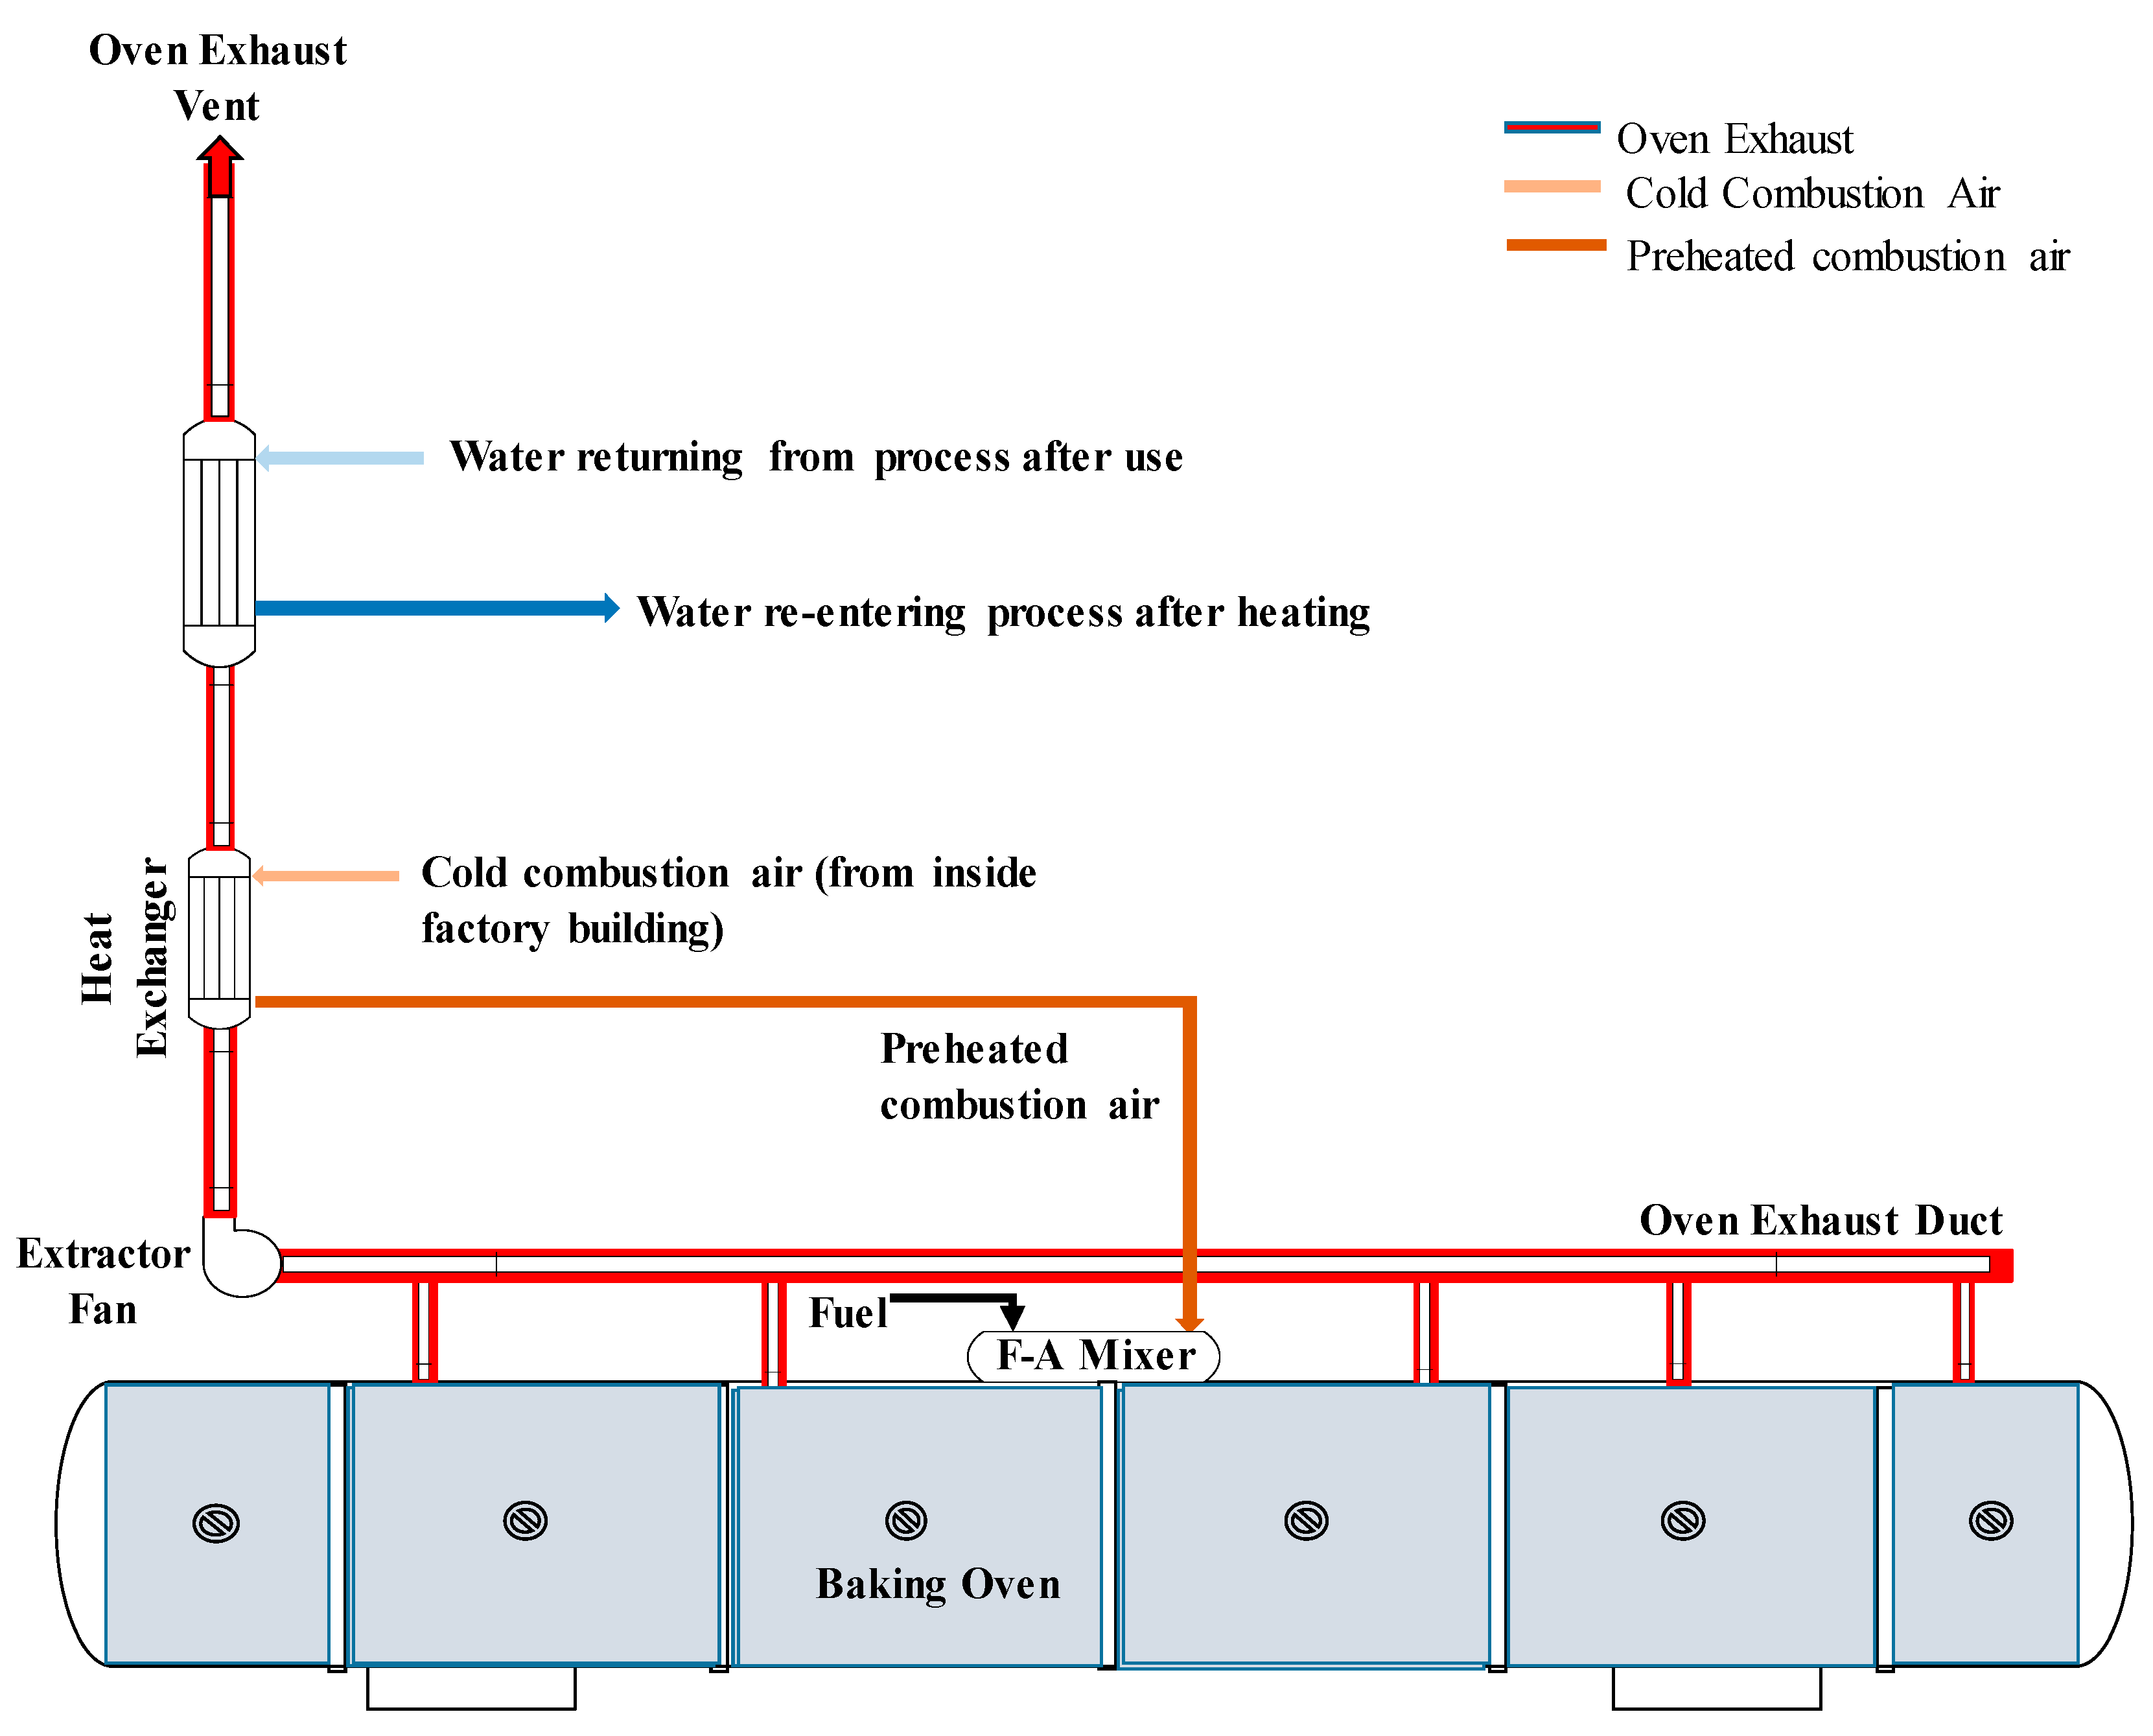
3.3. Heat Recovery for Hot Water Production
3.4. Preheating Combustion Air and Reheating Process Water
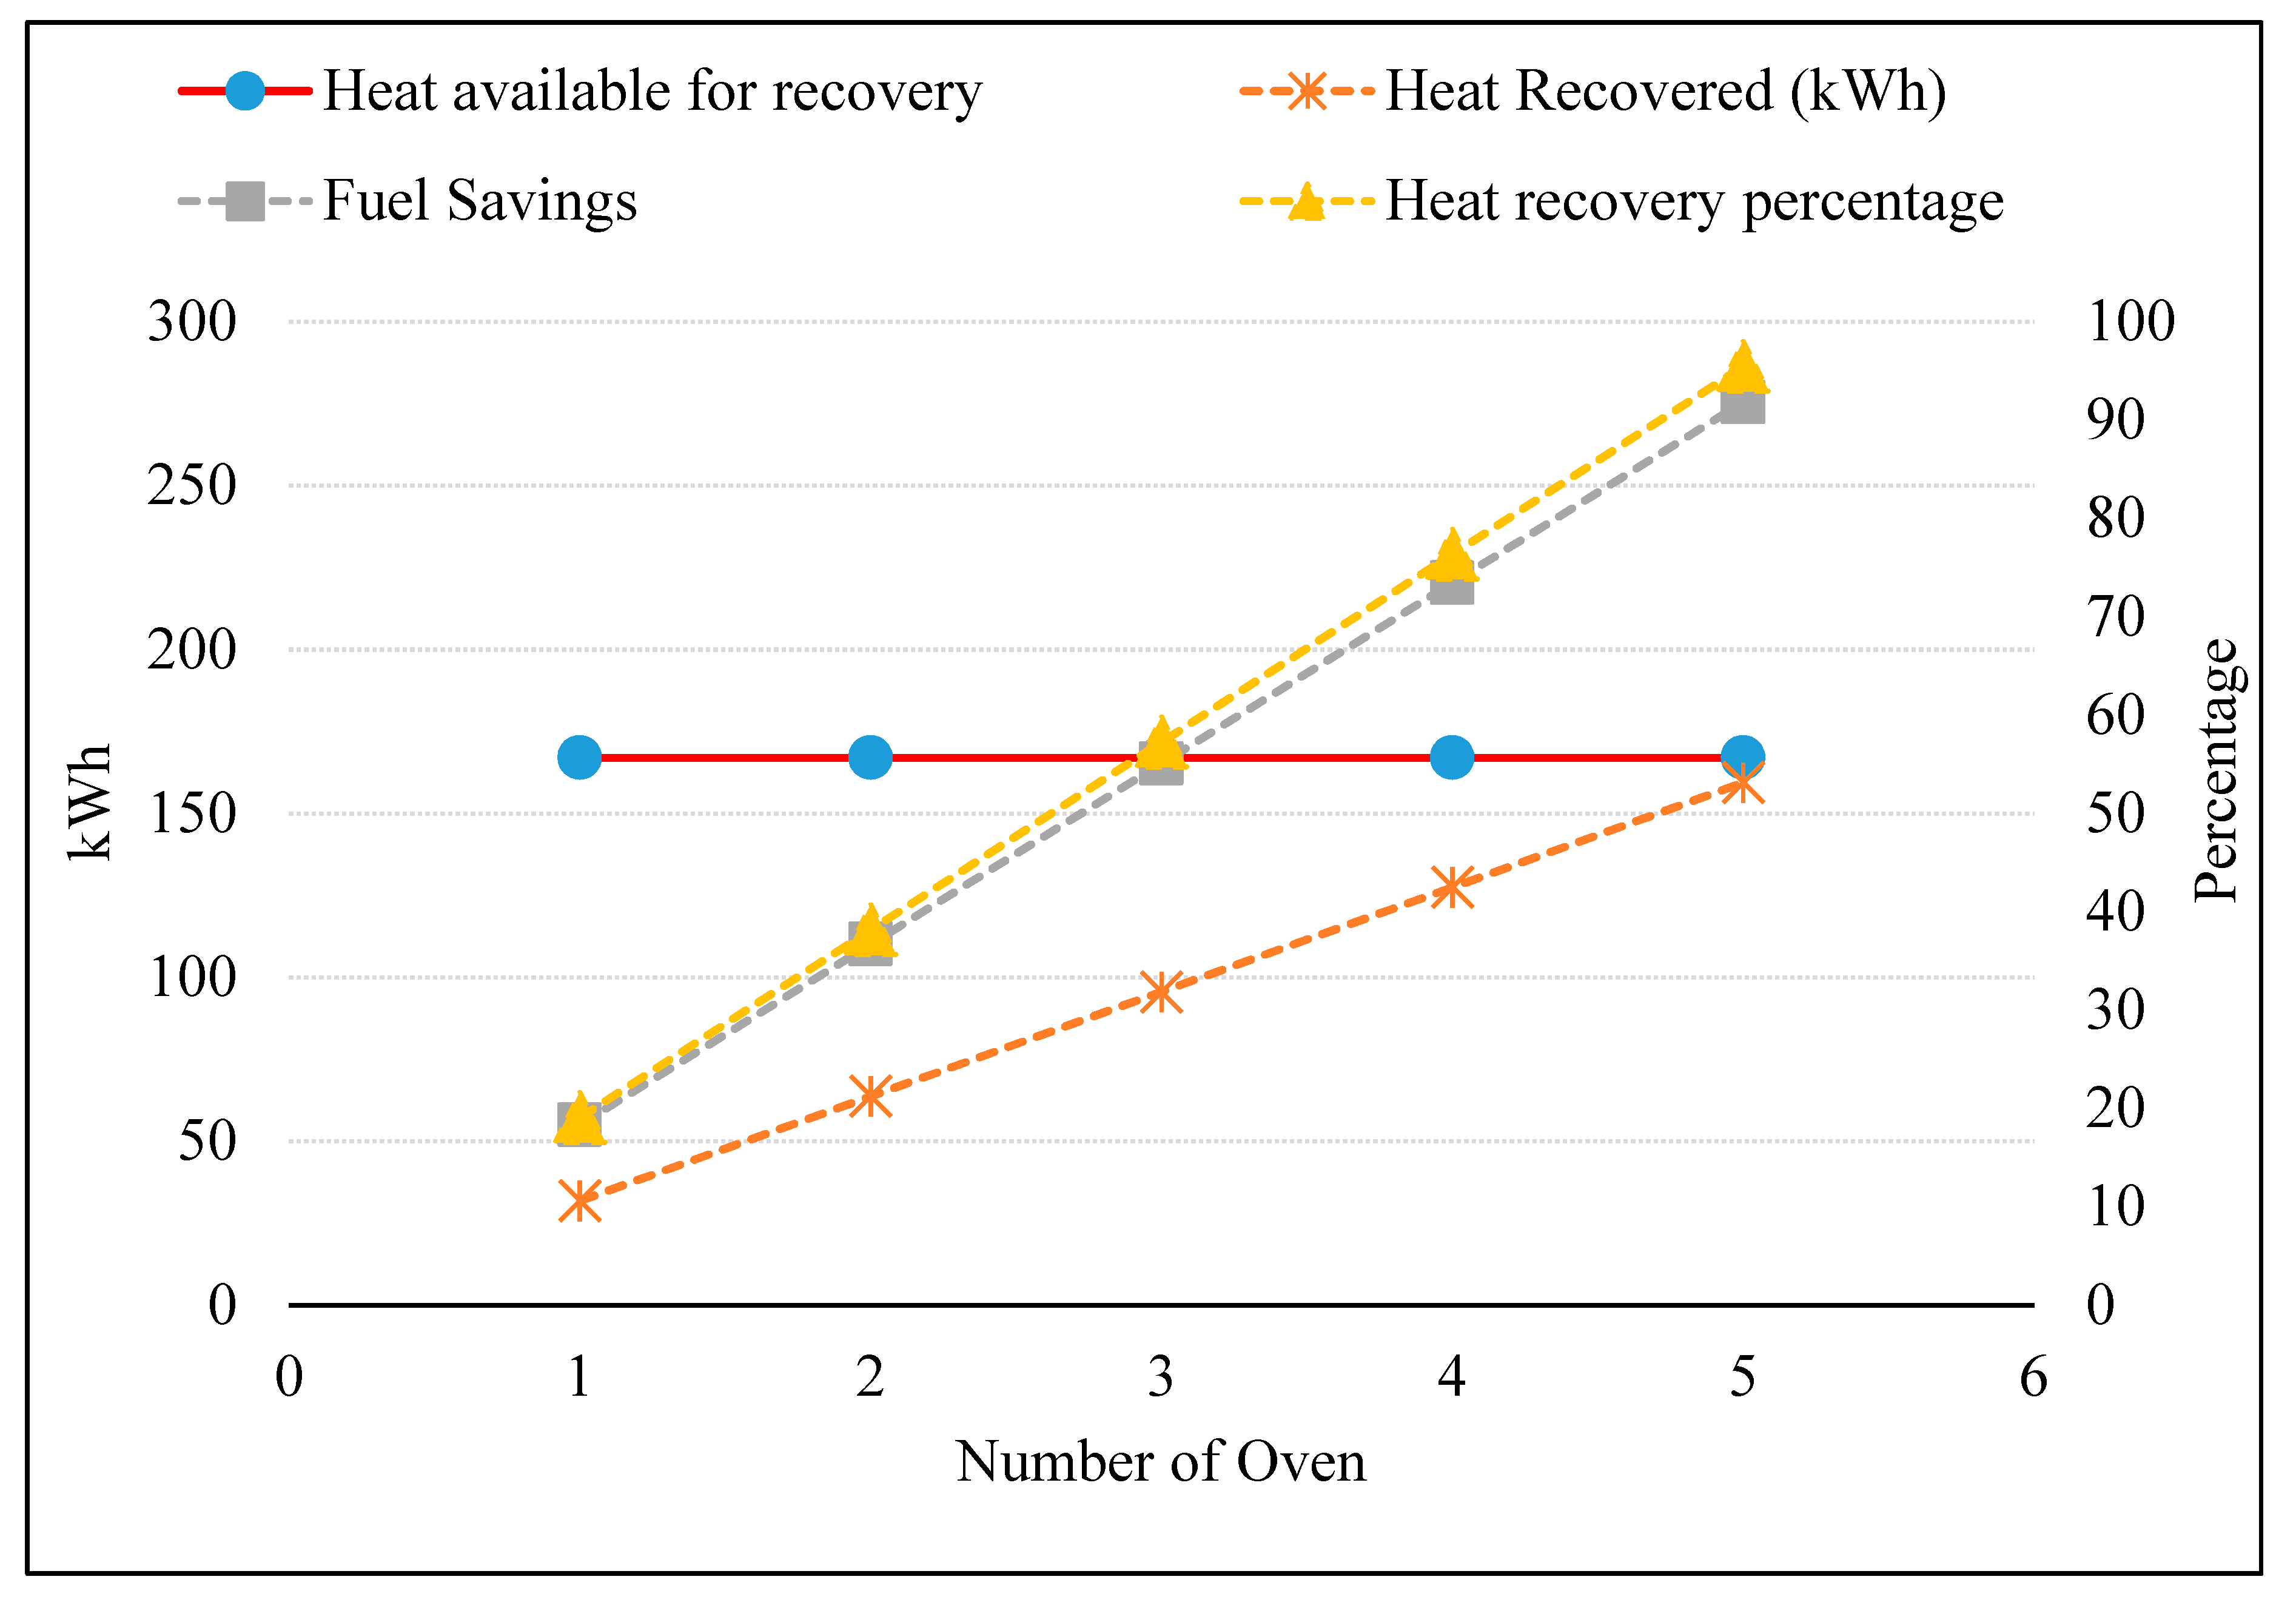
3.5. Preheating Combustion Air of Multiple Ovens
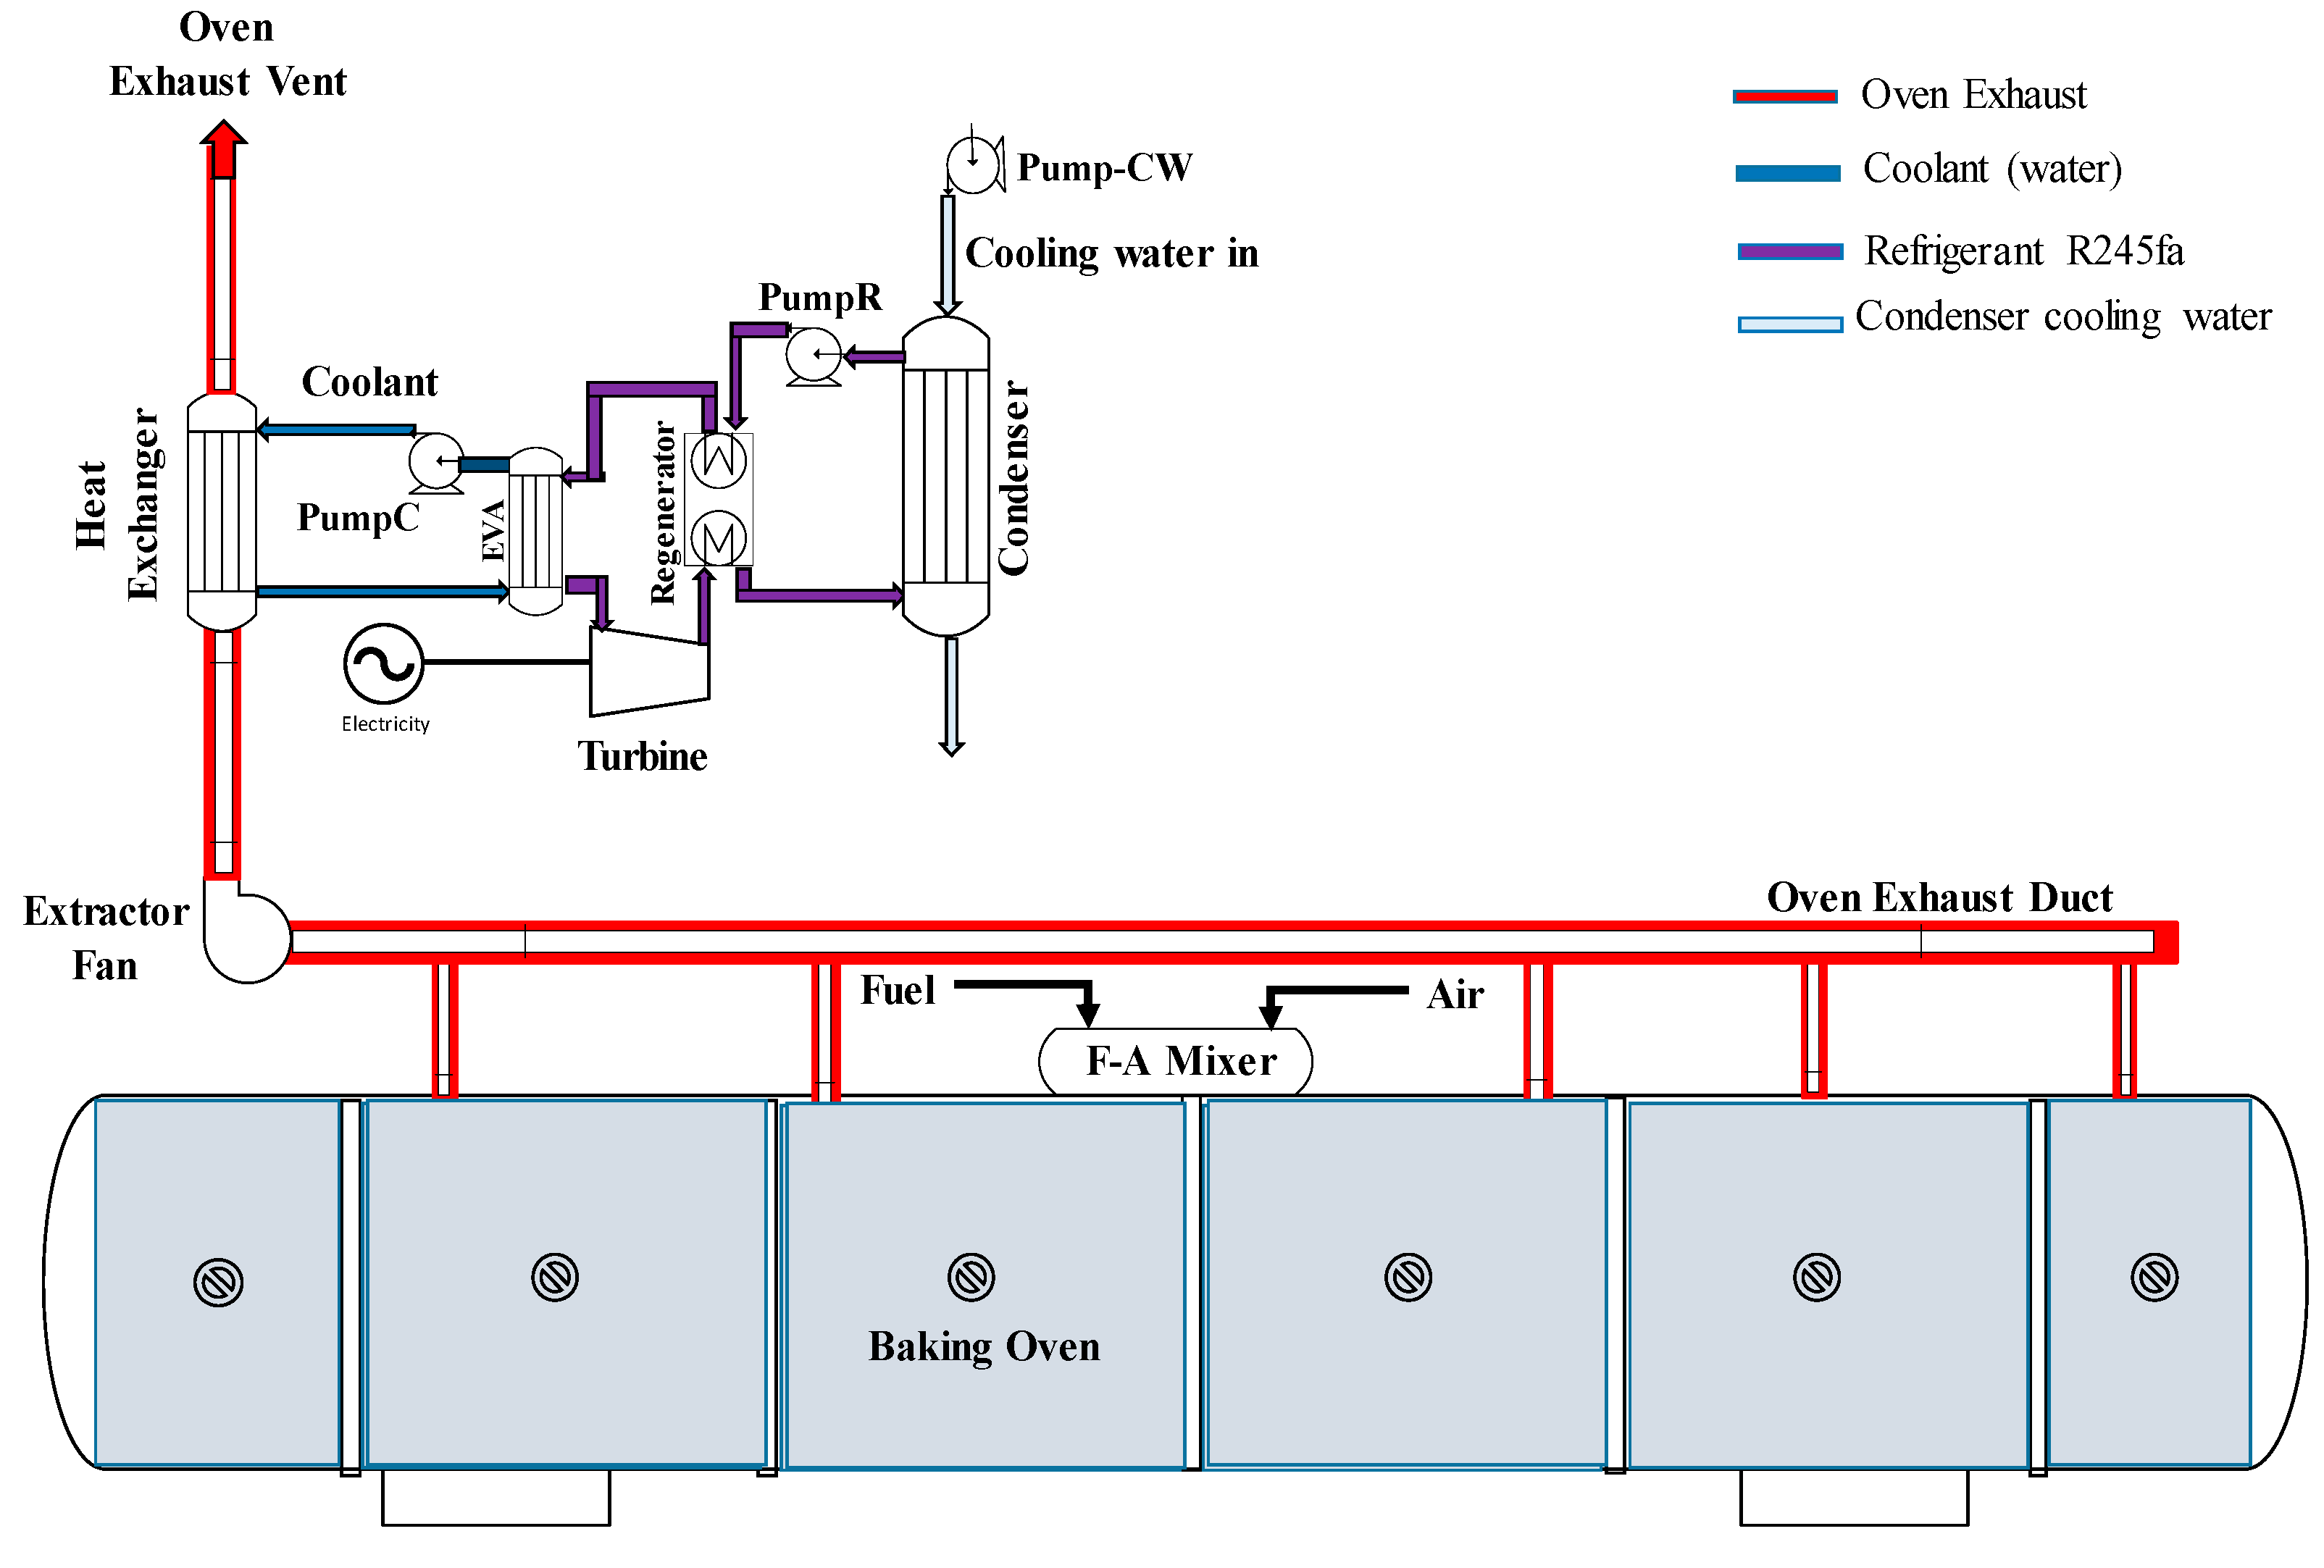
3.6. RORC for Oven Heat Recovery
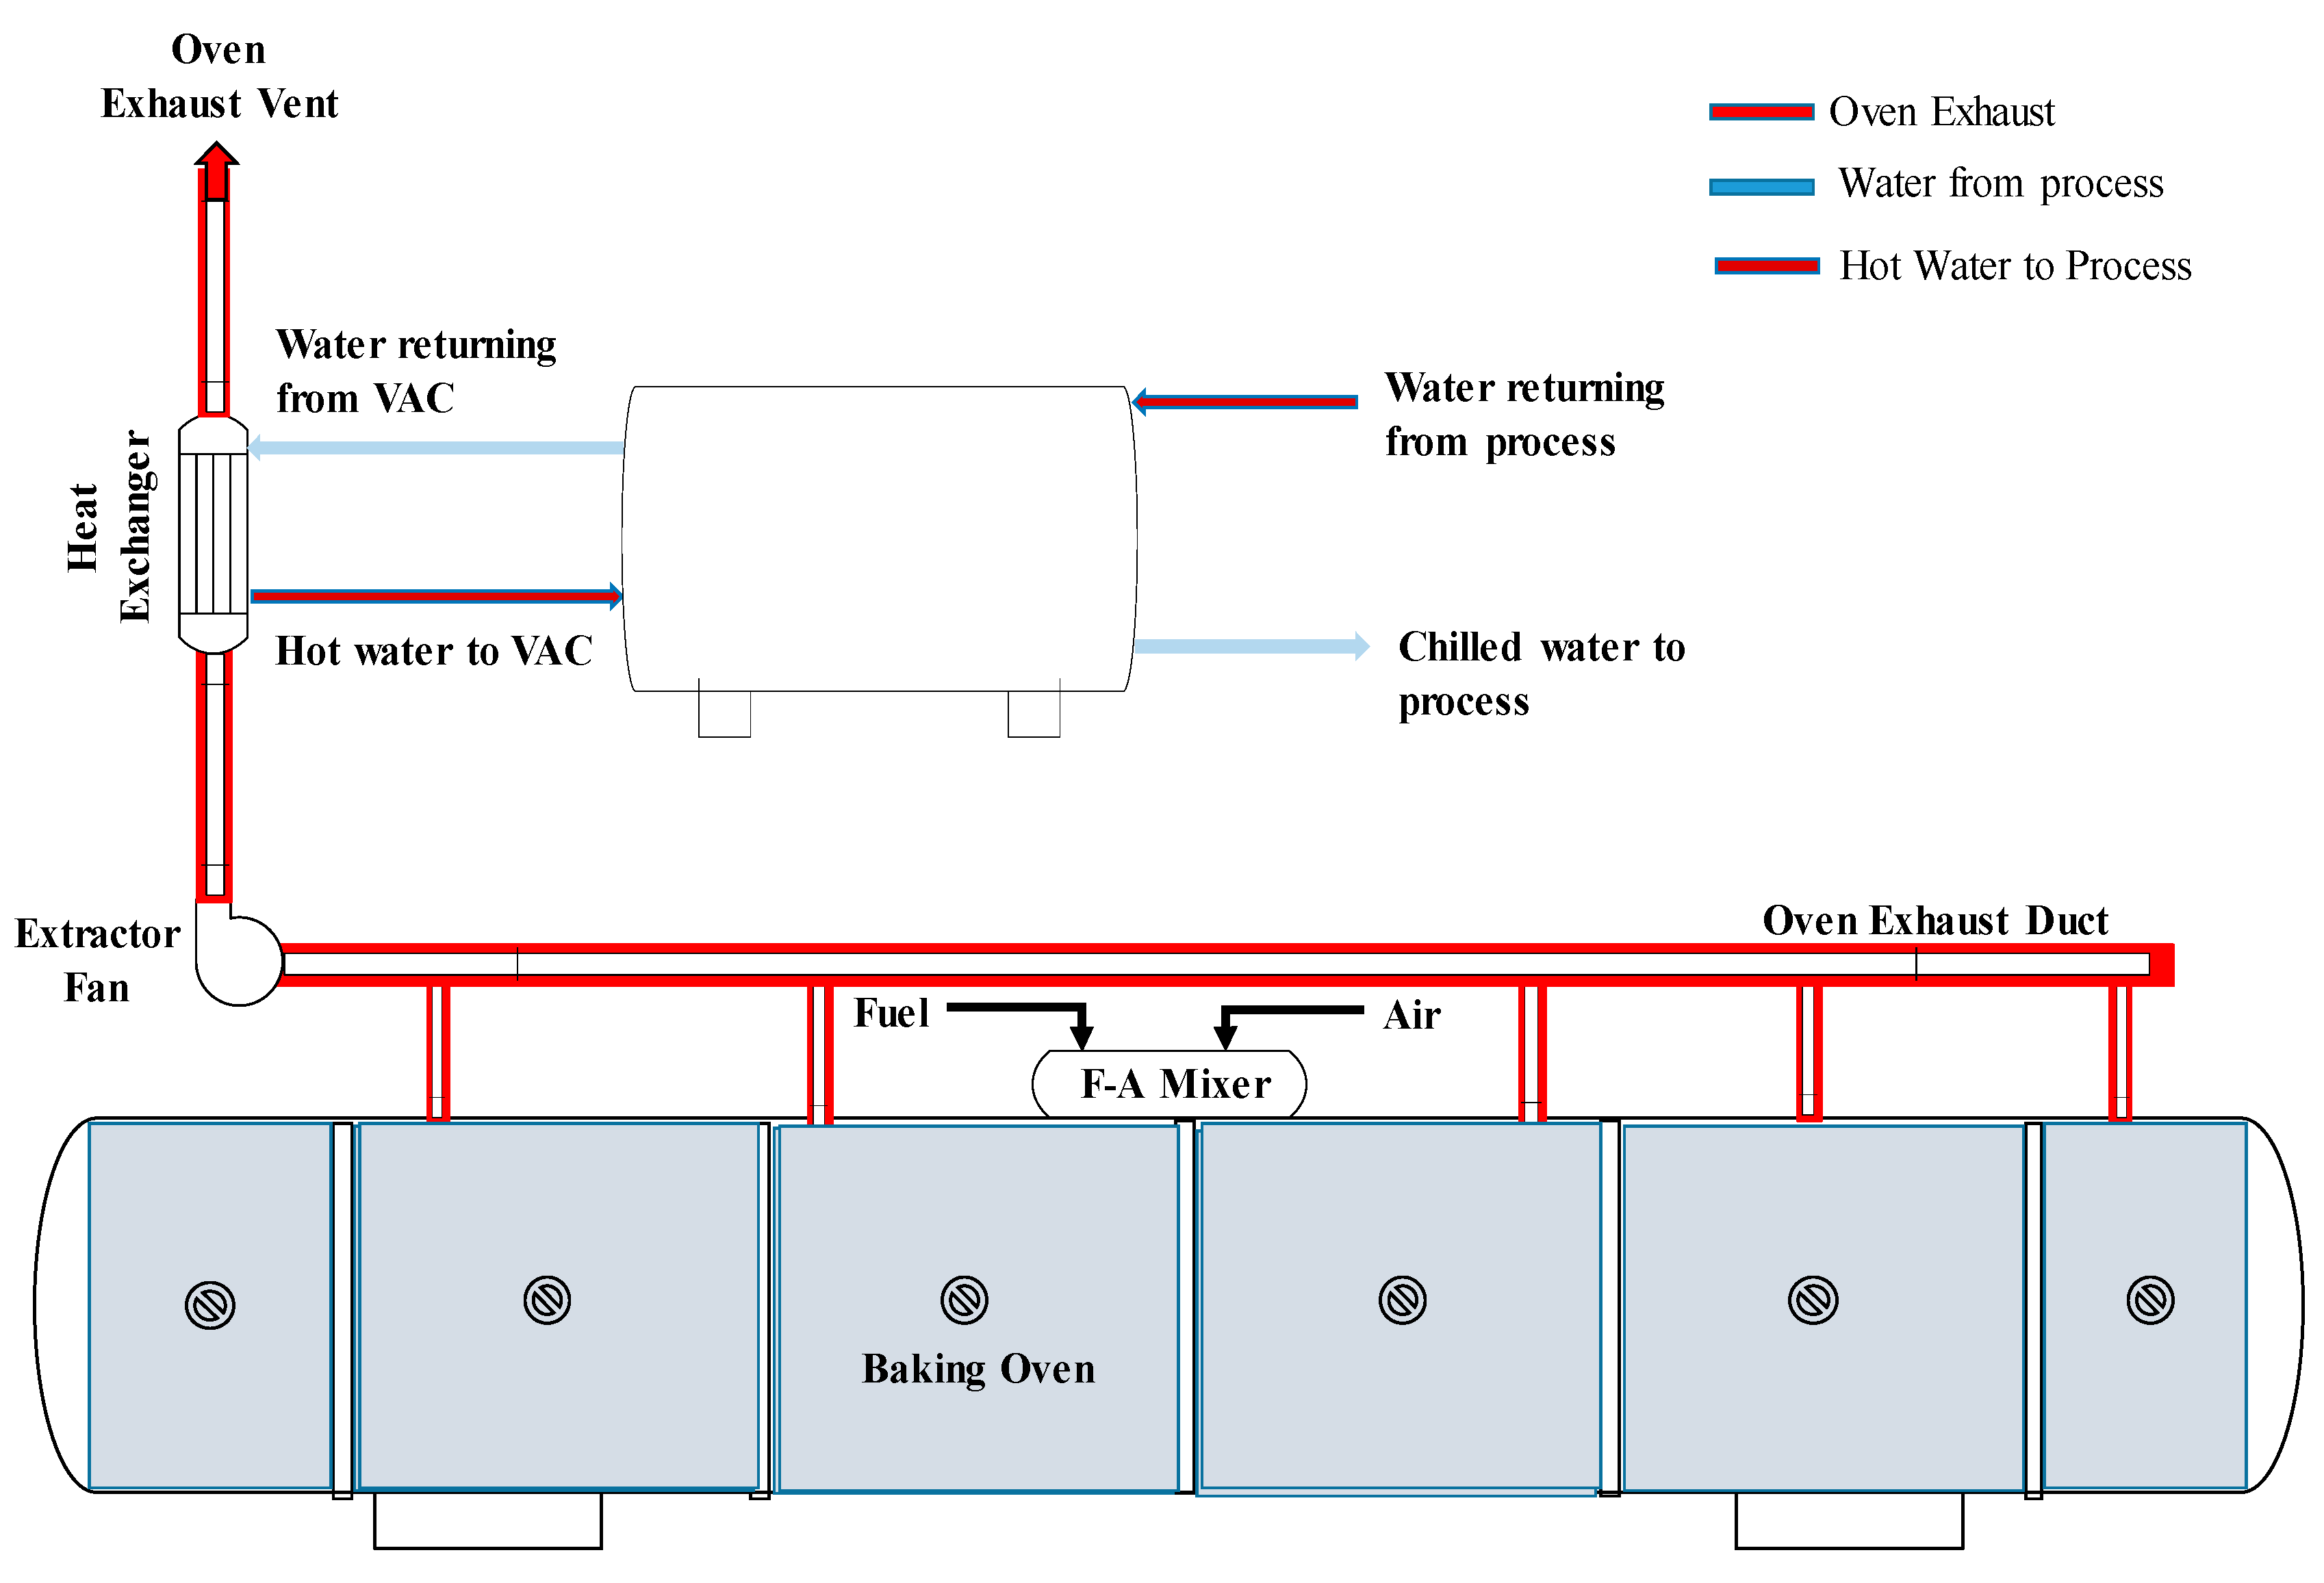
3.7. VARC for Oven Heat Recovery
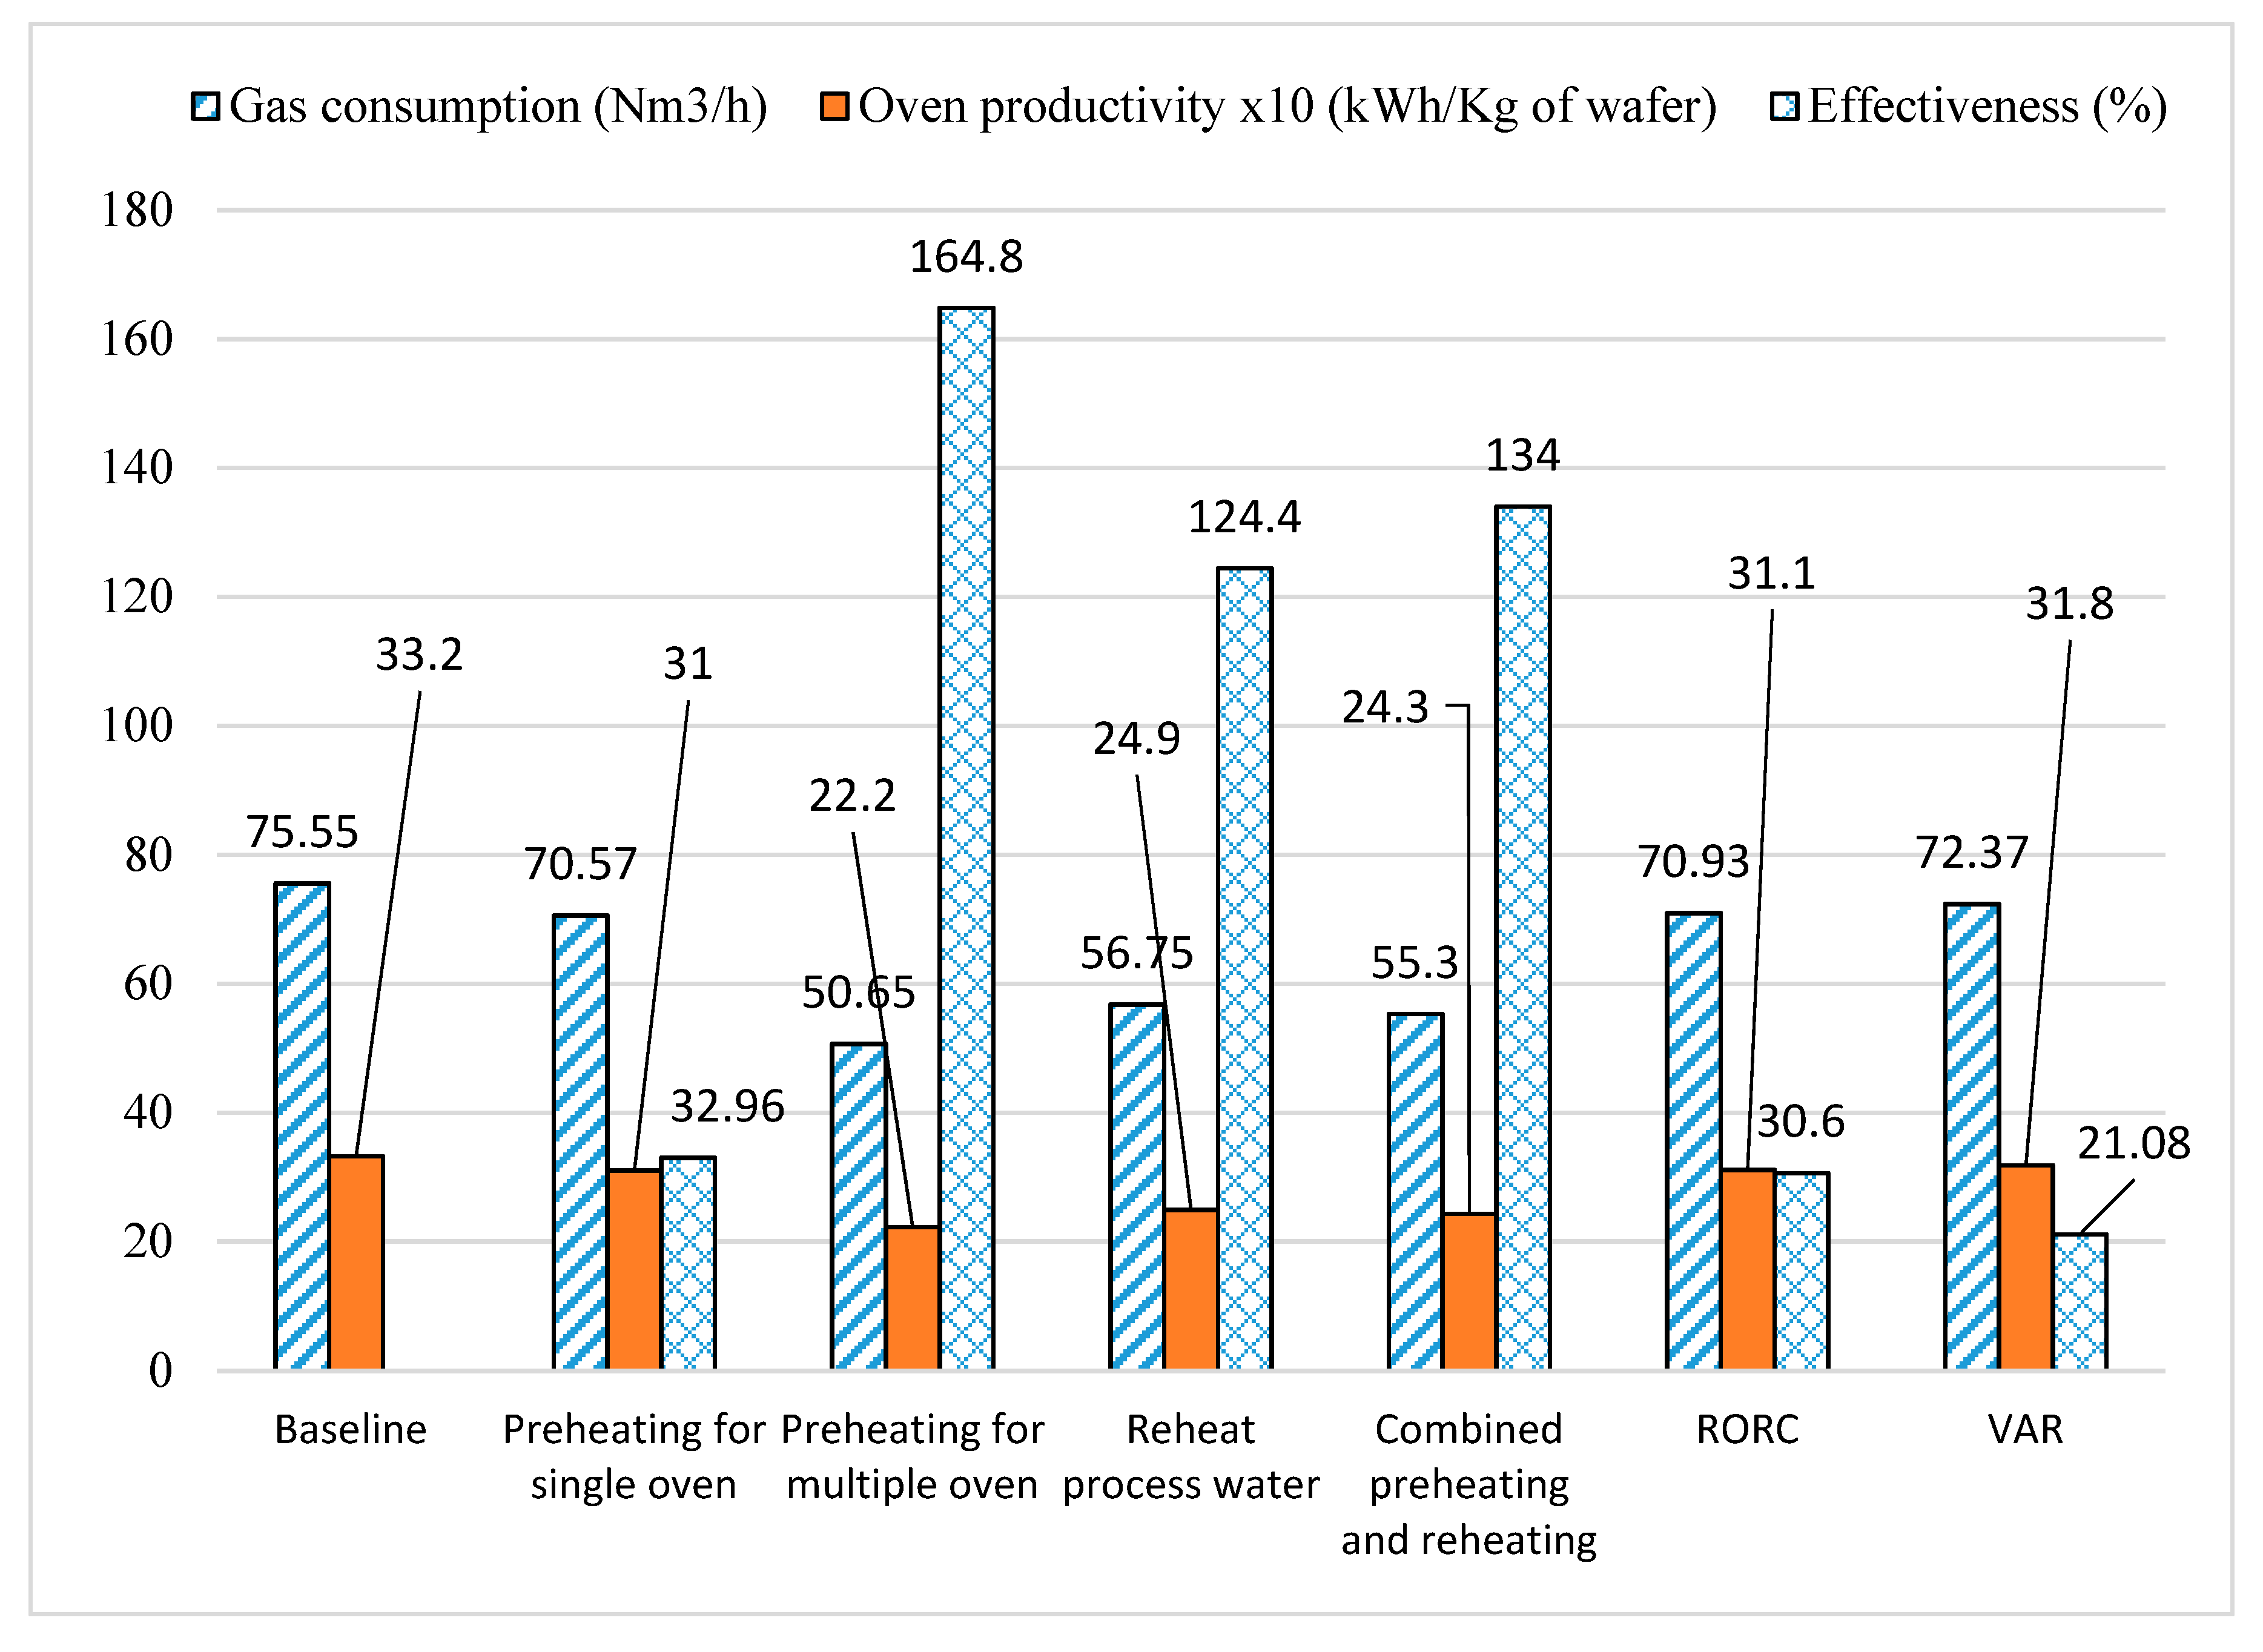
3.8. Comparison of Heat Recovery Technologies
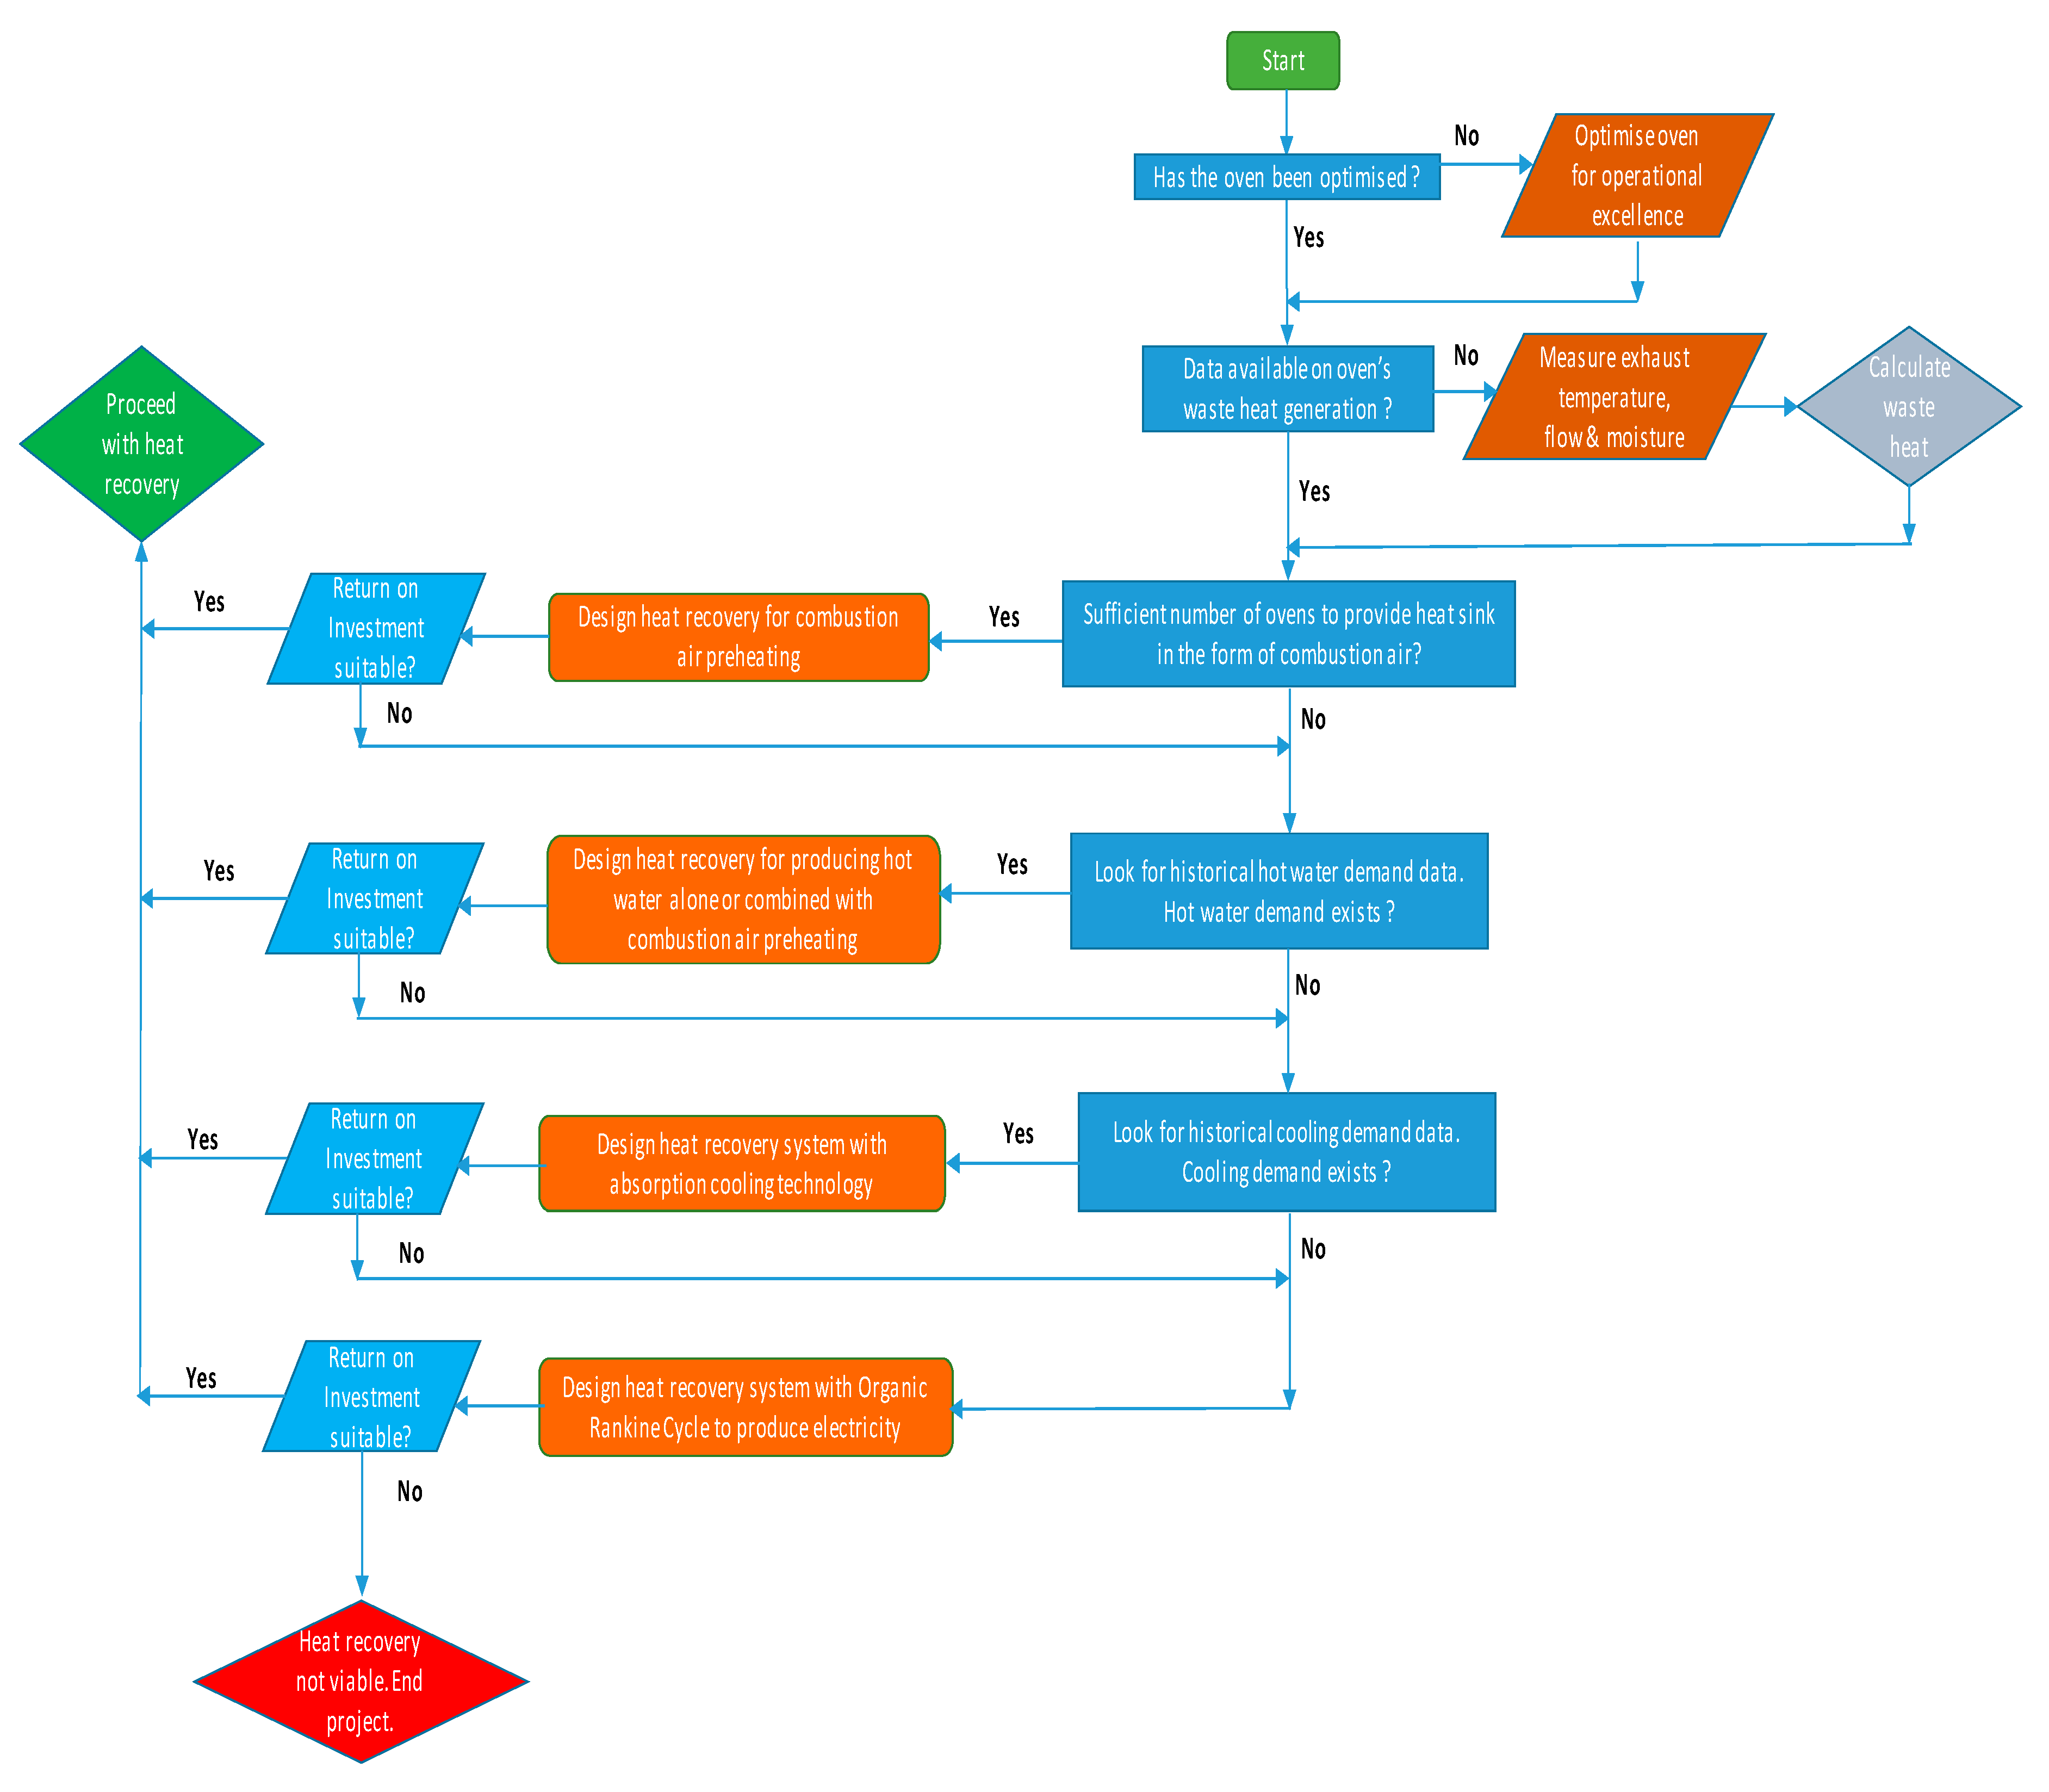
3.9. Route to Election of Heat Recovery Technology
4. Conclusions
Author Contributions
Funding
Acknowledgments
Conflicts of Interest
References
- Verma, M. Energy Use in Global Food Production; Springer: Adelaide, Australia, 2015. [Google Scholar]
- Mujumdar, A.S. Energy in Food Processing. Dry. Technol. 1989, 7, 839–840. [Google Scholar] [CrossRef]
- Parker, R.W.R.; Blanchard, J.L.; Gardner, C.; Green, B.S.; Hartmann, K.; Tyedmers, P.H.; Watson, R.A. Fuel use and greenhouse gas emissions of world fisheries. Nat. Clim. Chang. 2018, 8, 333–337. [Google Scholar] [CrossRef]
- Compton, M.; Willis, S.; Rezaie, B.; Humes, K. Food processing industry energy and water consumption in the Pacific Northwest. Innov. Food Sci. Emerg. Technol. 2018, 47, 371–383. [Google Scholar] [CrossRef]
- Monforti-Ferrorio, F.; Dallemand, J.F.; Pascua, P.I.; Motola, V.; Banja, M.; Scarlat, N.; Medarac, H.; Castellazzi, L.; Labanca, N.; Bertoldi, P.; et al. Energy Use in the Eu Food Sector: State of Play and Opportunities for Improvement; Publications Office of the European Union: Luxembourg, 2015. [Google Scholar]
- Azzam, A. Energy consumption in the U.S. food system. Cornhusker Econ. 2012, 1–4. Available online: https://digitalcommons.unl.edu/agecon_cornhusker/598 (accessed on 20 October 2020).
- Zhang, J.; Qu, X.; Sangaiah, A.K. A Study of Green Development Mode and Total Factor Productivity of the Food Industry Based on the Industrial Internet of Things. IEEE Commun. Mag. 2018, 56, 72–78. [Google Scholar] [CrossRef]
- Conijn, J.G.; Bindraban, P.S.; Schröder, J.J.; Jongschaap, R.E.E. Can our global food system meet food demand within planetary boundaries? Agric. Ecosyst. Environ. 2018, 251, 244–256. [Google Scholar] [CrossRef]
- FRS, J.B.; House, K. Food, energy, water and the climate: A perfect storm of global events? Chief Scientific Adviser to HM Government; UK Government Office for Science: London, UK, 2009; Available online: https://www.bl.uk/collection-items/food-energy-water-and-the-climate-a-perfect-storm-of-global-events (accessed on 23 August 2020).
- D'Odorico, P.; Davis, K.F.; Rosa, L.; Carr, J.A.; Chiarelli, D.; Dell’Angelo, J.; Gephart, J.; MacDonald, G.K.; Seekell, D.A.; Suweis, S.; et al. The Global Food-Energy-Water Nexus. Rev. Geophys. 2018, 56, 456–531. [Google Scholar] [CrossRef]
- Dutilh, C.E.; Kramer, K.J. Energy Consumption in the Food Chain: Comparing alternative options in food production and consumption. Ambio 2000, 29, 98–101. [Google Scholar] [CrossRef]
- Tassou, S.; Kolokotroni, M.; Gowreesunker, L.; Stojceska, V.; Azapagic, A.; Fryer, P.; Bakalis, S. Energy demand and reduction opportunities in the UK food chain. Proc. Inst. Civ. Eng. Energy 2014, 167, 162–170. [Google Scholar] [CrossRef]
- Law, R.; Harvey, A.; Reay, D. Opportunities for low-grade heat recovery in the UK food processing industry. Appl. Therm. Eng. 2013, 53, 188–196. [Google Scholar] [CrossRef]
- BEIS Industrial Heat Recovery Support Programme (IHRS). Available online: https://www.gov.uk/guidance/industrial-heat-recovery-support-programme-how-to-apply#about-the-programme (accessed on 19 November 2020).
- BEIS Industrial Energy Transformation Fund (IETF). Available online: https://www.gov.uk/government/publications/industrial-energy-transformation-fund-ietf-phase-1-how-to-apply (accessed on 19 November 2020).
- Oluleye, G.; Jobson, M.; Smith, R.; Perry, S.J. Evaluating the potential of process sites for waste heat recovery. Appl. Energy 2016, 161, 627–646. [Google Scholar] [CrossRef]
- Tassou, S.A.; Lewis, J.S.; Ge, Y.T.; Hadawey, A.; Chaer, I. A review of emerging technologies for food refrigeration applications. Appl. Therm. Eng. 2010, 30, 263–276. [Google Scholar] [CrossRef]
- Tchanche, B.F.; Pétrissans, M.; Papadakis, G. Heat resources and organic Rankine cycle machines. Renew. Sustain. Energy Rev. 2014, 39, 1185–1199. [Google Scholar] [CrossRef]
- Donnellan, P.; Cronin, K.; Byrne, E. Recycling waste heat energy using vapour absorption heat transformers: A review. Renew. Sustain. Energy Rev. 2015, 42, 1290–1304. [Google Scholar] [CrossRef]
- Liu, B.-T.; Chien, K.-H.; Wang, C.-C. Effect of working fluids on organic Rankine cycle for waste heat recovery. Energy 2004, 29, 1207–1217. [Google Scholar] [CrossRef]
- Bao, J.; Zhao, L. A review of working fluid and expander selections for organic Rankine cycle. Renew. Sustain. Energy Rev. 2013, 24, 325–342. [Google Scholar] [CrossRef]
- Srikhirin, P.; Aphornratana, S.; Chungpaibulpatana, S. A review of absorption refrigeration technologies. Renew. Sustain. Energy Rev. 2001, 5, 343–372. [Google Scholar] [CrossRef]
- Kalinowski, P.; Hwang, Y.; Radermacher, R.; al Hashimi, S.; Rodgers, P. Application of waste heat powered absorption refrigeration system to the LNG recovery process. Int. J. Refrig. 2009, 32, 687–694. [Google Scholar] [CrossRef]
- Pantaleo, A.M.; Fordham, J.; Oyewunmi, O.A.; de Palma, P.; Markides, C.N. Integrating cogeneration and intermittent waste-heat recovery in food processing: Microturbines vs. ORC systems in the coffee roasting industry. Appl. Energy 2018, 225, 782–796. [Google Scholar] [CrossRef]
- Aneke, M.; Agnew, B.; Underwood, C.; Wu, H.; Masheiti, S. Power generation from waste heat in a food processing application. Appl. Therm. Eng. 2012, 36, 171–180. [Google Scholar] [CrossRef]
- Landelle, A.; Tauveron, N.; Haberschill, P.; Revellin, R.; Colasson, S. Organic Rankine cycle design and performance comparison based on experimental database. Appl. Energy 2017, 204, 1172–1187. [Google Scholar] [CrossRef]
- Wu, W.; Wang, B.; Shi, W.; Li, X. Absorption heating technologies: A review and perspective. Appl. Energy 2014, 130, 51–71. [Google Scholar] [CrossRef]
- Yang, S.; Wang, Y.; Gao, J.; Zhang, Z.; Liu, Z.; Olabi, A.G. Performance Analysis of a Novel Cascade Absorption Refrigeration for Low-Grade Waste Heat Recovery. ACS Sustain. Chem. Eng. 2018, 6, 8350–8363. [Google Scholar] [CrossRef]
- Wang, M.; Wang, Y.; Feng, X.; Deng, C.; Lan, X. Energy Performance Comparison between Power and Absorption Refrigeration Cycles for Low Grade Waste Heat Recovery. ACS Sustain. Chem. Eng. 2018, 6, 4614–4624. [Google Scholar] [CrossRef]
- Tchanche, B.F.; Lambrinos, G.; Frangoudakis, A.; Papadakis, G. Low-grade heat conversion into power using organic Rankine cycles—A review of various applications. Renew. Sustain. Energy Rev. 2011, 15, 3963–3979. [Google Scholar] [CrossRef]
- Garcia, S.I.; Garcia, R.F.; Carril, J.C.; Garcia, D.I. A review of thermodynamic cycles used in low temperature recovery systems over the last two years. Renew. Sustain. Energy Rev. 2018, 81, 760–767. [Google Scholar] [CrossRef]
- Milanese, M.; Torresi, M.; Colangelo, G.; Saponaro, A.; de Risi, A. Numerical Analysis of a Solar Air Preheating Coal Combustion System for Power Generation. J. Energy Eng. 2018, 144, 4018038. [Google Scholar] [CrossRef]
- Sorrentino, G.; Sabia, P.; de Joannon, M.; Bozza, P.; Ragucci, R. Influence of preheating and thermal power on cyclonic burner characteristics under mild combustion. Fuel 2018, 233, 207–214. [Google Scholar] [CrossRef]
- Zenga, M.; Dua, L.X.; Liaoa, D.; Chua, W.X.; Wanga, Q.W.; Luob, Y.; Sunb, Y. Investigation on pressure drop and heat transfer performances of plate-fin iron air preheater unit with experimental and Genetic Algorithm methods. Appl. Energy 2012, 92, 725–732. [Google Scholar] [CrossRef]
- Kick, T.; Kathrotia, T.; Braun-Unkhoff, M.; Riedel, U. An experimental and modeling study of laminar flame speeds of alternative aviation fuels. In Proceedings of the ASME 2011 Turbo Expo: Turbine Technical Conference and Exposition, Vancouver, BC, Canada, 6–10 June 2011; pp. 579–589. [Google Scholar]
- Rivero, R. Application of the exergy concept in the petroleum refining and petrochemical industry. Energy Convers. Manag. 2002, 43, 1199–1220. [Google Scholar] [CrossRef]
- Mukherjee, S.; Asthana, A.; Howarth, M.; McNeil, R. Waste heat recovery from industrial baking ovens. Energy Procedia 2017, 123, 321–328. [Google Scholar] [CrossRef]
- Mukherjee, S.; Asthana, A.; Howarth, M.; McNeil, R.; Frisby, B. Achieving operational excellence for industrial baking ovens. Energy Procedia 2019, 161, 395–402. [Google Scholar] [CrossRef]
- Hung, T.C.; Shai, T.Y.; Wang, S.K. A review of organic rankine cycles (ORCs) for the recovery of low-grade waste heat. Energy 1997, 22, 661–667. [Google Scholar] [CrossRef]
- Zhai, H.; An, Q.; Shi, L.; Lemort, V.; Quoilin, S. Categorization and analysis of heat sources for organic Rankine cycle systems. Renew. Sustain. Energy Rev. 2016, 64, 790–805. [Google Scholar] [CrossRef]
- Lecompte, S.; Huisseune, H.; van den Broek, M.; Vanslambrouck, B.; de Paepe, M. Review of organic Rankine cycle (ORC) architectures for waste heat recovery. Renew. Sustain. Energy Rev. 2015, 47, 448–461. [Google Scholar] [CrossRef]
- Tocci, L.; Pal, T.; Pesmazoglou, I.; Franchetti, B. Small Scale Organic Rankine Cycle (ORC): A Techno-Economic Review. Energies 2017, 10, 413. [Google Scholar] [CrossRef]
- Chen, H.; Goswami, D.Y.; Stefanakos, E.K. A review of thermodynamic cycles and working fluids for the conversion of low-grade heat. Renew. Sustain. Energy Rev. 2010, 14, 3059–3067. [Google Scholar] [CrossRef]
- Lion, S.; Michos, C.N.; Vlaskos, I.; Rouaud, C.; Taccani, R. A review of waste heat recovery and Organic Rankine Cycles (ORC) in on-off highway vehicle Heavy Duty Diesel Engine applications. Renew. Sustain. Energy Rev. 2017, 79, 691–708. [Google Scholar] [CrossRef]
- Imran, M.; Haglind, F.; Asim, M.; Alvi, J.Z. Recent research trends in organic Rankine cycle technology: A bibliometric approach. Renew. Sustain. Energy Rev. 2018, 81, 552–562. [Google Scholar] [CrossRef]
- Muhammad, U.; Imran, M.; Lee, D.H.; Park, B.S. Design and experimental investigation of a 1 kW organic Rankine cycle system using R245fa as working fluid for low-grade waste heat recovery from steam. Energy Convers. Manag. 2015, 103, 1089–1100. [Google Scholar] [CrossRef]
- Imran, M.; Park, B.S.; Kim, H.J.; Lee, D.H.; Usman, M.; Heo, M. Thermo-economic optimization of Regenerative Organic Rankine Cycle for waste heat recovery applications. Energy Convers. Manag. 2014, 87, 107–118. [Google Scholar] [CrossRef]
- Mago, P.J.; Chamra, L.M.; Srinivasan, K.; Somayaji, C. An examination of regenerative organic Rankine cycles using dry fluids. Appl. Therm. Eng. 2008, 28, 998–1007. [Google Scholar] [CrossRef]
- Maraver, D.; Uche, J.; Royo, J. Assessment of high temperature organic Rankine cycle engine for polygeneration with MED desalination: A preliminary approach. Energy Convers. Manag. 2012, 53, 108–117. [Google Scholar] [CrossRef]
- Cho, S.-Y.; Cho, C.-H.; Ahn, K.-Y.; Lee, Y.D. A study of the optimal operating conditions in the organic Rankine cycle using a turbo-expander for fluctuations of the available thermal energy. Energy 2014, 64, 900–911. [Google Scholar] [CrossRef]
- Bruno, J.C.; López-Villada, J.; Letelier, E.; Romera, S.; Coronas, A. Modelling and optimisation of solar organic rankine cycle engines for reverse osmosis desalination. Appl. Therm. Eng. 2008, 28, 2212–2226. [Google Scholar] [CrossRef]
- Quoilin, S.; Declaye, S.; Tchanche, B.F.; Lemort, V. Thermo-economic optimization of waste heat recovery Organic Rankine Cycles. Appl. Therm. Eng. 2011, 31, 2885–2893. [Google Scholar] [CrossRef]
- Quoilin, S.; van den Broek, M.; Declaye, S.; Dewallef, P.; Lemort, V. Techno-economic survey of Organic Rankine Cycle (ORC) systems. Renew. Sustain. Energy Rev. 2013, 22, 168–186. [Google Scholar] [CrossRef]
- Meinel, D.; Wieland, C.; Spliethoff, H. Effect and comparison of different working fluids on a two-stage organic rankine cycle (ORC) concept. Appl. Therm. Eng. 2014, 63, 246–253. [Google Scholar] [CrossRef]
- Yu, G.; Shu, G.; Tian, H.; Wei, H.; Liu, L. Simulation and thermodynamic analysis of a bottoming Organic Rankine Cycle (ORC) of diesel engine (DE). Energy 2013, 51, 281–290. [Google Scholar] [CrossRef]
- Schuster, A.; Karellas, S.; Kakaras, E.; Spliethoff, H. Energetic and economic investigation of Organic Rankine Cycle applications. Appl. Therm. Eng. 2009, 29, 1809–1817. [Google Scholar] [CrossRef]
- Wei, D.; Lu, X.; Lu, Z.; Gu, J. Performance analysis and optimization of organic Rankine cycle (ORC) for waste heat recovery. Energy Convers. Manag. 2007, 48, 1113–1119. [Google Scholar] [CrossRef]
- Haoushui, Y.; Gundersen, T.; Feng, X. Process integration of organic Rankine cycle (ORC) and heat pump for low temperature waste heat recovery. Energy 2018, 160, 330–340. [Google Scholar]
- Sun, J.; Fu, L.; Zhang, S. A review of working fluids of absorption cycles. Renew. Sustain. Energy Rev. 2012, 16, 1899–1906. [Google Scholar] [CrossRef]
- Somers, C.; Mortazavi, A.; Hwang, Y.; Radermacher, R.; Rodgers, P.; Al-Hashimi, S. Modeling water/lithium bromide absorption chillers in ASPEN Plus. Appl. Energy 2011, 88, 4197–4205. [Google Scholar] [CrossRef]
- Mansouri, R.; Boukholda, I.; Bourouis, M.; Bellagi, A. Modelling and testing the performance of a commercial ammonia/water absorption chiller using Aspen-Plus platform. Energy 2015, 93, 2374–2383. [Google Scholar] [CrossRef]
- Turton, R.; Bailie, R.C.; Whiting, W.B.; Shaeiwitz, J.A.; Bhattacharyya, D. Analysis, Synthesis and Design of Chemical Processes, 4th ed.; Prentice Hall: Upper Saddle River, NJ, USA, 2012. [Google Scholar]
- Toffolo, A.; Lazzaretto, A.; Manente, G.; Paci, M. A multi-criteria approach for the optimal selection of working fluid and design parameters in Organic Rankine Cycle systems. Appl. Energy 2014, 121, 219–232. [Google Scholar] [CrossRef]
- Wang, M.; Jing, R.; Zhang, H.; Meng, C.; Li, N.; Zhao, Y. An innovative Organic Rankine Cycle (ORC) based Ocean Thermal Energy Conversion (OTEC) system with performance simulation and multi-objective optimization. Appl. Therm. Eng. 2018, 145, 743–754. [Google Scholar] [CrossRef]
- CEPCI. CEPCI Updates: January 2018 (Prelim.) and December 2017 (Final) 2018. Available online: https://www.chemengonline.com/cepci-updates-january-2018-prelim-and-december-2017-final/ (accessed on 15 October 2019).
- Qu, M.; Abdelaziz, O.; Yin, H. New configurations of a heat recovery absorption heat pump integrated with a natural gas boiler for boiler efficiency improvement. Energy Convers. Manag. 2014, 87, 175–184. [Google Scholar] [CrossRef]
- Lee, S.; Kum, S.-M.; Lee, C.-E. Performances of a heat exchanger and pilot boiler for the development of a condensing gas boiler. Energy 2011, 36, 3945–3951. [Google Scholar] [CrossRef]
- Osagie, E.; Biliyok, C.; di Lorenzo, G.; Hanak, D.P.; Manovic, V. Techno-economic evaluation of the 2-amino-2-methyl-1-propanol (AMP) process for CO2 capture from natural gas combined cycle power plant. Int. J. Greenh. Gas Control 2018, 70, 45–56. [Google Scholar] [CrossRef]
- Arora, A.; Kaushik, S.C. Theoretical analysis of a vapour compression refrigeration system with R502, R404A and R507A. Int. J. Refrig. 2008, 31, 998–1005. [Google Scholar] [CrossRef]
- Srithar, K.; Rajaseenivasan, T.; Arulmani, M.; Gnanavel, R.; Vivar, M.; Fuentes, M. Energy recovery from a vapour compression refrigeration system using humidification dehumidification desalination. Desalination 2018, 439, 155–161. [Google Scholar] [CrossRef]


| Parameters | Unit | Value |
|---|---|---|
| Fuel (natural gas) consumption | Nm3/hr | 27 |
| Primary air flow | m3/s | 0.14 |
| Maximum temperature increase from ambient | °C | 105 |
| Combustion air connection duct diameter | mm | 90 |
| Parameters | Unit | Value |
|---|---|---|
| Industrial Processes | °C | 70–95 |
| Domestic or Industrial Space Heating | °C | 55–65 |
| Dish washing and Laundry | °C | 40–60 |
| Shower and Hand Wash | °C | 40 |
| Surgical Scrubbing | °C | 43 |
| Parameter | Unit | Value |
|---|---|---|
| Oven exhaust temperature | °C | 165 |
| Evaporator pressure | bar | 1.1 |
| Condenser pressure | bar | 10 |
| Oven exhaust volumetric flow rate | m3/s | 3.72 |
| Oven exhaust gas outlet temperature (after heat transfer) | °C | 110 |
| Refrigerant flow rate | L/min | 30.9 |
| Coolant flow rate | L/min | 233.2 |
| Turbine efficiency | % | 85 |
| Pump efficiency | % | 80 |
| Parameter | Unit | Value |
|---|---|---|
| Evaporator pressure | bar | 2.75 |
| Generator pressure | bar | 10 |
| Turbine efficiency | % | 85 |
| Pump efficiency | % | 80 |
| Generator efficiency | % | 98 |
| Exhaust gas inlet temperature | °C | 165 |
| Minimum exhaust gas outlet temperature | °C | 110 |
| Exhaust gas volumetric flow rate | m3/s | 3.72 |
| Components | Investment Model * | Coefficient Values * |
|---|---|---|
| Pump (Centrifugal) | 1.6 for carbon steel construction | |
| Heat exchanger (Double pipe and spiral tube) | for pressure < 40 barg for pressure < 150 barg 1 | |
| Turbine (Radial) | 3.5 for carbon steel construction | |
| Process vessels | Horizontal vessels, carbon steel; 3.5565, 0.3776 0.0905 for vessel thickness t < 6.3 mm 1.49 1.52 1 |
| Parameter | Units | Value |
|---|---|---|
| Gas consumption per hour | Nm3/h | 27.69 |
| Calorific value of gas | kWh/m3 | 11.0556 |
| Load | kW | 306.12 |
| Combustion air inlet temperature | °C | 30 |
| Exhaust temperature | °C | 133 |
| Exhaust flowrate | m3/s | 2.82 |
| Oven productivity | kWh/kg of wafer | 3.40 |
| Parameter | Units | Baseline | After Heat Recovery |
|---|---|---|---|
| Gas usage | Nm3/h | 75.55 | 70.57 |
| Load | kW | 835 | 780 |
| Exhaust temperature | °C | 165 | 165 |
| Combustion air inlet temperature | °C | 30 | 155 |
| Effectiveness of heat recovery system | % | - | 32.96 |
| Oven productivity | kWh/kg of wafer | 3.32 | 3.10 |
| Parameter | Units | Baseline | After Heat Recovery |
|---|---|---|---|
| Gas usage | Nm3/h | 75.55 | 56.75 |
| Load | kW | 835.25 | 627.40 |
| Effectiveness of heat recovery system | % | - | 124.4 |
| Oven productivity | kWh/kg of wafer | 3.32 | 2.49 |
| Parameter | Units | Baseline | Savings/Preheating Air | Savings/Reheating | Combined Savings |
|---|---|---|---|---|---|
| Gas usage | Nm3/h | 75.55 | 70.57 | 60.29 | 55.3 |
| Load | kW | 835.25 | 780.19 | 666.54 | 611.37 |
| Effectiveness of heat recovery unit | % | - | 32.96 | 101 | 134 |
| Oven productivity | kWh/kg of wafer | 3.32 | 3.10 | 2.65 | 2.43 |
| Parameter | Units | Baseline | After Heat Recovery |
|---|---|---|---|
| Gas usage | Nm3/h | 75.55 | 50.65 |
| Load | kW | 835.25 | 559.96 |
| Effectiveness of heat recovery system | % | - | 164.8 |
| Oven productivity | kWh/kg of wafer | 3.32 | 2.22 |
| Parameter | Units | Value |
|---|---|---|
| Heat available in the exhaust | kW | 167 |
| Gross electricity generated by the turbine | kW | 23.99 |
| Parasitic electrical power consumption | kW | 0.97 |
| Net electrical output | kW | 23.02 |
| RORC system efficiency (electrical) | % | 13.78 |
| Parameter | Units | Baseline | After Heat Recovery |
|---|---|---|---|
| Gas usage | Nm3/h | 75.55 | 70.93 |
| Load | kW | 835.25 | 784.17 |
| Effectiveness of heat recovery system | % | - | 30.6 |
| Oven productivity | kWh/kg of wafer | 3.32 | 3.11 |
| Parameter | Units | Value |
|---|---|---|
| Heat available in the exhaust | kW | 167 |
| Cooling produced by the system | kW | 55.5 |
| Cooling efficiency | % | 33.2 |
| Parasitic power consumption | kW | 1.03 |
| Net electricity saved | kW | 15.85 |
| Electrical efficiency of VAR | % | 9.49 |
| Parameter | Units | Baseline | After Heat Recovery |
|---|---|---|---|
| Gas usage | Nm3/h | 75.55 | 72.37 |
| Load | kW | 835.25 | 800.09 |
| Effectiveness of heat recovery system | % | - | 21.08 |
| Oven productivity | kWh/kg of wafer | 3.32 | 3.18 |
| Parameters | Fuel Saved | Energy Savings (MWh/yr) | Operational Cost Savings (£/yr) | CO2 Emissions Reduction (t/yr) | |
|---|---|---|---|---|---|
| Recovery Technology | |||||
| Preheating for single oven | Gas | 385 | 6938 | 71 | |
| Preheating for multiple oven | Gas | 1927 | 34,687 | 356 | |
| Reheating process water | Gas | 1455 | 26,189 | 269 | |
| Combined preheating and reheating process water | Gas | 1567 | 28,209 | 290 | |
| RORC * | Electricity | 161 # | 9668 | 41 | |
| VAR | Electricity | 111 # | 6657 | 28 | |
| Components | Component | Parameters Value | Cost of Investment (£) | Fuel/Electricity Saving (£/Year) | Payback Period (Years) |
|---|---|---|---|---|---|
| Preheating for single oven | One heat exchanger | , | 35,616 | 6938 | 5.13 |
| Preheating for multiple oven | One heat exchanger | , | 54,557 | 34,687 | 1.57 |
| Reheating process water | One heat exchanger, one pump | , | 59,346 | 26,189 | 2.26 |
| Combined preheating and reheating process water | Two heat exchangers, one pump | , , , | 92,914 | 28,209 | 3.25 |
| RORC | Four heat exchangers, three pumps, one turbine | , , , , , , , , , , , | 152,335 | 9668 | 15.75 |
| VARC | Three pumps, five heat exchangers (including two air coolers with fans), two process vessels (generator and absorber) | , , , , , , , , , , , , , , , | 217,824 | 6657 | 32.72 |
Publisher’s Note: MDPI stays neutral with regard to jurisdictional claims in published maps and institutional affiliations. |
© 2020 by the authors. Licensee MDPI, Basel, Switzerland. This article is an open access article distributed under the terms and conditions of the Creative Commons Attribution (CC BY) license (http://creativecommons.org/licenses/by/4.0/).
Share and Cite
Mukherjee, S.; Asthana, A.; Howarth, M.; Chowdhury, J.I. Techno-Economic Assessment of Waste Heat Recovery Technologies for the Food Processing Industry. Energies 2020, 13, 6446. https://doi.org/10.3390/en13236446
Mukherjee S, Asthana A, Howarth M, Chowdhury JI. Techno-Economic Assessment of Waste Heat Recovery Technologies for the Food Processing Industry. Energies. 2020; 13(23):6446. https://doi.org/10.3390/en13236446
Chicago/Turabian StyleMukherjee, Sanjay, Abhishek Asthana, Martin Howarth, and Jahedul Islam Chowdhury. 2020. "Techno-Economic Assessment of Waste Heat Recovery Technologies for the Food Processing Industry" Energies 13, no. 23: 6446. https://doi.org/10.3390/en13236446
APA StyleMukherjee, S., Asthana, A., Howarth, M., & Chowdhury, J. I. (2020). Techno-Economic Assessment of Waste Heat Recovery Technologies for the Food Processing Industry. Energies, 13(23), 6446. https://doi.org/10.3390/en13236446