1. Introduction
Maintenance is undoubtedly an important sector for the achievement of companies’ organizational objectives. Evidence shows that poor maintenance can result in process failures, putting people, the environment, and assets at risk, generating a revenue loss, and making operations unfeasible [
1]. In its turn, Maintenance Strategy is a systematic approach to keep the facilities and equipment operating in a given industrial plant. It involves many activities and is concerned with formulating the best plan for each piece of equipment of the plant. It describes what type of maintenance actions are suitable for the critical pieces of equipment whose failure may jeopardize plant production and safety. Thus, selecting the most appropriate maintenance strategy depends on several factors such as the goals of maintenance, the nature of the facility or the equipment to be maintained, and the work environment. In addition, the selection of critical equipment is very important to successfully implement a maintenance strategy [
2].
The twentieth century brought about, as one of the consequences of an unprecedented evolution of science and technology, a considerable change both in maintenance thought, and practice. Two industries, electronics and airline, by pointing out the decisive role of reliability engineering, were particularly responsible for that. Within such industries, it soon became clear that it would be possible to use more accurate methods in maintenance instead of relying on experience and judgment alone.
An important initiative was the creation of the airline industry task force in 1960 to investigate the capabilities of preventive maintenance. Later in 1974, the US Department of Defense commissioned United Airlines to write a report on the processes used so far in the civil aviation industry. The objective of such a study was the development of maintenance programs for aircraft [
3]. This report, entitled Reliability-Centered Maintenance (RCM), has become a basic reference for all subsequent RCM approaches to this day. From these niche beginnings, as it were, RCM and its variations gained widespread acceptance among maintenance practitioners as well as researchers for its ability to bring savings, efficiency, reliability, and focus on what really matters when applied properly in an organization. [
4,
5,
6,
7,
8,
9,
10].
RCM is a qualitative approach used to determine the maintenance requirements of any physical asset in its operational context, associating criticality to the effect of equipment failure on plant performance [
11]. The main goal is to keep plant performance during mission time. RCM focuses on predictive maintenance and Condition Based Maintenance (CBM) as the most suitable maintenance practices for critical equipment given their present degradation failure modes when subject to monitoring during mission time [
12]. In addition, CBM is considered the most cost-effective maintenance strategy [
13]. The implementation of maintenance routines, such as inspections, lubrication, and small adjustments, for fault diagnosis in conjunction with predictive maintenance techniques, can lead to a significant reduction in repair costs and production losses [
14].
Figure 1 presents a conceptual graph correlating the maintenance costs and maintenance commitment.
Considered by many authors [
4,
15,
16,
17,
18,
19] as one of the most important phases in the implementation of RCM, Maintenance Significant Items (MSI) selection is essentially a screening phase in which the number of items for analysis can be reduced [
15,
16,
17,
18,
19]. However, even today, there are few systematic and convenient methods for such identification [
4,
15]. There is no consensus among authors on how such a selection should be made [
20]. Furthermore, although Nowlan and Heap [
11] define a “significant item” as “the item whose failure could affect the safety or have major economic consequences”, indicating a simple and conservative approach to MSI identification, some studies follow more structured approaches based on ranking methodologies and even standards to define MSI [
18,
21].
From this perspective, failure’s direct and indirect impacts, such as loss of availability; loss of revenue; contractual fines; maintenance costs; difficulties to repair; availability of spare parts, proper equipment, tools, and trained teams to maintenance execution; environmental issues; personnel safety issues; criticality of the function lost upon failure; failure rate; and failure detection likelihood, among others, can be considered as ranking criteria [
20]. However, it is important to have in mind that the choice of such criteria will have a direct impact on the methodology results and the MSI selection.
It is observed that in most of the works found in the literature regarding this subject, the criteria used to MSI identification are generally based on concepts that consider the occurrence of the failure, and not the possibility of preventing or anticipating it, seeking to use monitoring data according to Industry 4.0 concepts [
22], in the face of a higher demand for productivity and maintenance efficiency. Thus, to fill this gap, the objective of this work is to present a novel approach to defining MSI. It is based on techniques and tools that allow to analyze the criticality of components regarding failure modes’ development, allowing a more focused look at predictive maintenance and the prioritization of maintenance actions for improved continuous equipment operation, avoiding unnecessary machine stops and breakdowns. The proposed method aims at eliciting expert opinion regarding factors that may affect the degradation of the performance of a system. To control those factors, the method proposes the selection of maintenance practices. The method is a collection of techniques available in the literature but they are arranged in an innovative way to increase the possibility of reducing the uncertainty associated with maintenance planning decision-making.
These tools and techniques are borrowed from several fields of knowledge, such as Functional Tree (FT), SysML Internal Block Diagrams (IBD), Hazard and Operability Study (HAZOP), and Failure Mode Symptoms Analysis (FMSA). In addition, an innovative Operation & Maintenance Tree Analysis (OMCTA) devised by the authors [
23] is introduced in the criticality determination process. Finally, the method also uses a multi-criteria decision method, the Analytic Hierarchy Process (AHP), for ranking the most critical components [
24]. Besides, to illustrate the proposed method, a case study considering a 150 MW Kaplan hydro generator from a hydroelectric power plant located in Brazil is presented.
2. Literature Review
Despite being considered by many authors to be one of the key steps that anticipate the implementation of RCM, defining a control volume for the analysis and reducing the number of items to be analyzed, few studies address the selection of a system’s MSI in a structured, systematic, and convenient operational way. Tang et al. [
9], i.e., define MSI through three stages of screening. In the first two qualitative stages, the non-MSI are defined by applying 2nd and 5th order risk matrices and Failure Mode and Effects Analysis (FMEA). Then, a quantitative analysis is carried out to rank the MSI based on assessment indexes (influence on personnel safety, on environment safety, on system functions, average failure rate, maintenance costs, downtime loss, failure monitoring availability, downtime, and complexity of maintenance) and the application of the AHP and Fuzzy Borda Count (FBC) mathematical methods.
Gupta and Mishra [
6] also consider identifying and prioritizing critical components for implementing maintenance as an important task in industry. In this work, the authors tried to find out the key factors associated with the criticality of components, in which five major criteria (cost, functional dependency, complexity, maintainability, and safety impact) were suggested for criticality analysis. In addition, to identify the critical components, a hierarchical network was proposed based on the Analytic Network Process (ANP).
Melani et al. [
7] aim to present a thoroughness and soundness method that identifies the most critical components of a system, contributing to maintenance actions prioritization. The method uses reliability and Risk Analysis (RA) techniques, such as HAZOP, Fault Tree Analysis (FTA), and Failure Modes and Effects Criticality Analysis (FMECA). The considered criteria to define MSI were severity, occurrence, and detection (from FMECA), MTTR, FTA cut set order, repair cost (related to maintenance), and environmental, generation, and patrimonial impacts. The work also considers the ANP, a multi-criteria decision method for ranking the most critical components.
Silva et al. [
21] propose a novel framework for the determination of the MSI based on ISO 55000 standard aspects and using AHP. After studying the system and building its FT and FMEA, nine criteria (safety impact, history of security events, environmental impact, history of environmental events, reliability, maintainability, health assessment capacity, maintenance compliance, and impact on availability) and their respective scales were defined according to the asset criticality in the ISO 55000 standard. The authors expected that the work results could contribute to maintenance and asset management research and the diffusion of multicriteria prioritization methods, aiming to increase reliability and optimize maintenance planning.
Yuan et al. [
4] employ a two-level analysis method for MSI identification. At first, a discernibility matrix is constructed for a pre-screening. In the second level, FMEA and RA were employed for MSI selection. Moreover, the prioritization of MSI was determined by a quantitative analysis based on AHP and Monte Carlo Simulation (MCS). The method is applied for a train control system, aiming to improve maintenance management and reduce its cost.
Santos et al. [
5] developed and applied a practical and structured method of equipment classification criticality based on its importance for the production process. The method culminated in the equipment classification into three levels considering several criteria (effect of the asset’s failure on the quality of the products developed, the effect of equipment failures on the production process, analysis of potential risks to people and the environment, cost and technological complexity of repairing equipment failures).
Hartini, Dibyo, and Pujirta [
25] have presented a proposal to prioritize the reliability of systems and equipment for safety systems using System & Equipment Reliability Prioritization (SERP). During the process, the identification MSI is performed through a combination of quantitative and qualitative analysis. Filtering of the non-MSI items is performed through the first screening that defines the system boundary, system hierarchy, and RA of the risk matrix. The determination of component criticality level on reliability management was based on category rankings of frequency data and duration of interference with certain criteria as well as system aspects, safety, quality, and cost.
Summing up, the following aspects can certainly be implied from this work:
There are two fundamental phases to identify the MSI of a system in a systematic and structured way: the first phase is based on the system study and analysis, where the criteria and scales are established for further evaluation; and the second, in which the criticality evaluation is performed, defining the ranking of the system’s MSI;
Several methods, with different approaches, can be used to establish the criteria that are used in the evaluation phase, with FMEA and risk analysis matrices being the most usual;
Despite this diversity of methods, the criteria end up converging to the same fundamental criteria: safety impact, system availability impact, reliability, costs, failure detection likelihood, and maintainability;
Generally, a multicriteria decision method is used to rank the most critical items, with AHP being the most used among the reviewed articles.
Table 1 presents a summary of this bibliographic review, highlighting the methods and criteria considered in each analyzed article, as well as ones considered in the approach proposed in this work. The table is divided into three parts: the first part relating to the methods used to define the criteria, the second part to the fundamental criteria, and the third part to the decision methods used for the ranking of MSI.
The present method not only incorporates a greater number of methods but also diversifies the foundations of the analysis by including criteria that have not been explored in other works. Concerning the multicriteria decision method used to rank the MSI, the authors sought a more traditional approach with AHP.
3. The Proposed Method
The objective of the proposed method is to identify the MSI of a system to prioritize maintenance and improvement actions. The method is divided into two phases, the system study and the MSI definition, and represents a complex engineering approach, drawing methods and techniques from a broad spectrum of scientific fields.
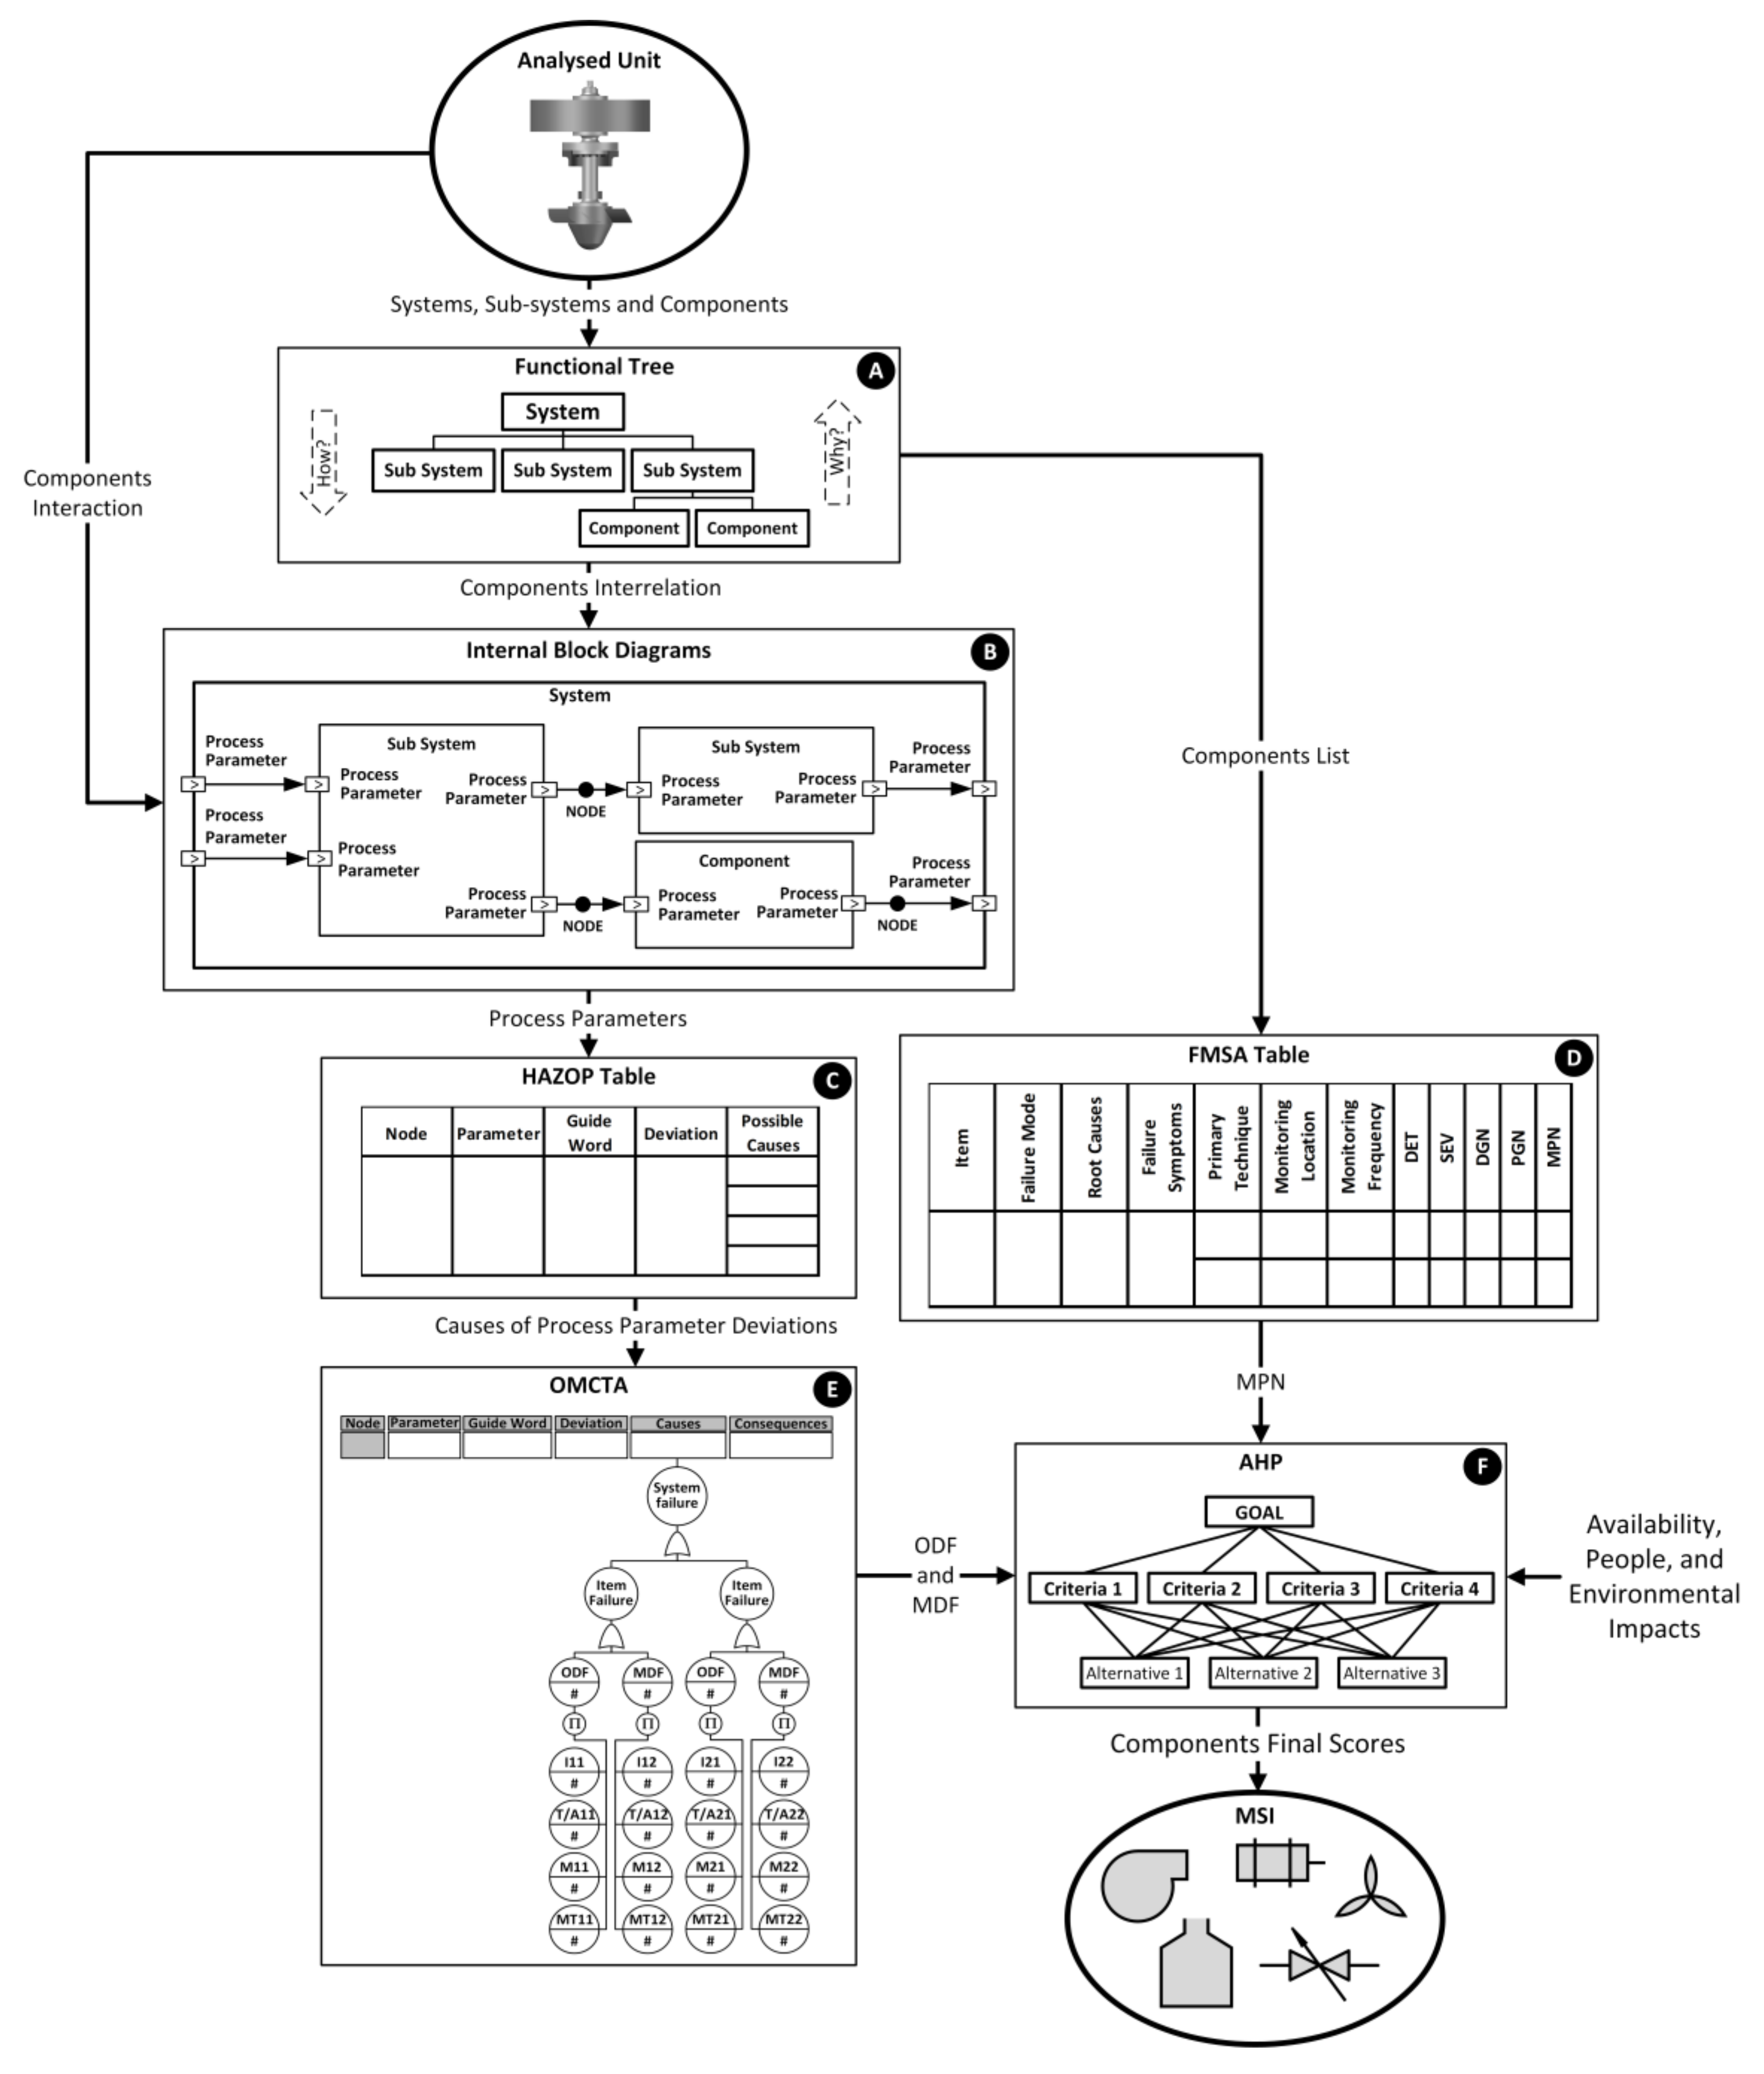
Figure 2 shows the method illustrated flowchart, highlighting the information flow between the applied methods and techniques. The novelty of the method is the integration of techniques and not the techniques themselves. Besides, the developed approach is focused on predictive maintenance aspects, since techniques that consider aspects related to the origin and progression of the analyzed system’s failure modes are incorporated into the method. The next sections of this chapter will describe each step of the method, highlighting its purpose.
3.1. System Study
The main objective of the system study is to identify all the information necessary to define significant maintenance items. Such a phase consists of five steps: FT, IBD, HAZOP, FMSA, and OMCTA (presented in
Figure 2).
3.1.1. Functional Tree (FT)
The first step of the system study consists of describing the plant’s system and sub-systems using FT, a well-known and established technique designed to show both the interrelation of a system’s components and the individual description of each component’s functions. [
18].
3.1.2. SysML Internal Block Diagrams (IBD)
Although very useful for the system’s description, FT diagrams do not show the interactions and interfaces between system components. So, in the second step of the system study, the SysML IBD [
26,
27], a technique borrowed from Systems Engineering, is used to expand knowledge of how the system works and enable the use of HAZOP in step three since the IBD highlights the process parameters and their relation with the operating condition of the system under analysis.
3.1.3. Hazard and Operability Analysis (HAZOP)
HAZOP [
28,
29] is a detailed hazard analysis of a system to determine what would happen if any component were to operate outside its normal intended mode. In the present work, HAZOP is the third step of the system study. The nodes presented in the HAZOP table are those identified in the SysML IBD’s.
3.1.4. Failure Mode Symptoms Analysis (FMSA)
FMSA [
30,
31,
32] is a relatively new and still not widespread variation of FMECA, a popular technique among reliability, safety, and quality engineers. FMECA is generally used when criticality analysis is required, being an extension of the well-known FMEA, whereas FMSA focuses on the symptoms produced by each considered failure mode and in the selection of the most appropriate techniques and strategies for detection and monitoring, seeking to maximize the level of confidence in diagnosis and prognosis for maintenance planning.
In the FMSA worksheet, each column represents different information in the evaluation process. The considered items must have at least one specified failure mode associated with a single effect and one or more possible root causes, which in turn can have several symptoms, which can be detected by more than one technique associated with a monitoring location and frequency. Then, grades are assigned to the likelihood of detection (DET), severity (SEV), and confidence levels of diagnoses (DGN) and prognoses (PGN) for each resulting row from the combination of failure modes, root causes, symptoms, and detection methods. The outcome is the Monitoring Priority Number (MPN) obtained by the multiplication of each of the previously mentioned factors. The lower the MPN, the most critical is the analyzed case.
3.1.5. Operation & Maintenance Causal Tree Analysis (OMCTA)
OMCTA [
23] results from the introduction of “OR gates” while retaining the basic characteristics of a Causal Tree Analysis (CTA), which is the breaking down of activities, as well as some aspects of an FTA in that the failure of a system is decomposed in its constituents’ failures. However, operation and the maintenance of individual constituents are considered as distinct activities, each subdivided into four components: individual (I), task (T), material (M), and work medium (MT).
The ranking figures for each constituent’s components in the OMCTA diagram may then be multiplied to supply Severity Figures relating separately to both operation and maintenance aspects. This discrimination capability is a very important and useful feature of this new technique. The tree branches created with OMCTA analysis represent the failure modes that cause deviations for each node analyzed in HAZOP. The association of the ODF and MDF scores present in these branches with each component is made considering the worst-case scenario found in all analyses, i.e., the failure mode that results in the lowest ODF and MDF values for that component. This approach penalizes the component as only the worst condition is considered. However, this conservative posture was adopted considering the importance of choosing MSI for maintenance planning.
3.2. Defining Maintenance Significant Items through AHP
AHP, developed by Saaty [
33], is a multicriteria decision method that relies on experts’ judgment to obtain priority scales through pairwise comparisons of both criteria and alternatives. In this paper, AHP is used to rank the MSI of the analyzed system. To implement AHP, it is first necessary to define the components to be ranked (i.e., which system items will be considered most critical to maintenance), as well as the criteria used for ranking. The components, therefore, are defined through the FT and the criteria (and the justification for each choice) are presented in the following subsections. Once the components and criteria are defined, AHP can be implemented through five steps, as described by Silva et al. [
21].
where
k is the total number of criteria considered and
represents the relative importance of criterion
i on criterion
j, according to the relative importance level scale, in
Table 2. Thus,
is the reciprocal of
.
where
and
. The priority vector provides a weight
,
for each considered criterion. In this work, the considered prioritization method is the Row Geometric Mean Method (RGMM), as presented by Dong et al. [
35].
developed by Crawford and Williams [
36] for the RGMM method.
Aguarón and Moreno-Jiménez [
37] provided the thresholds for GICL: e.g., when
for
, that is, more than 4 criteria, it is considered that the judgment matrix has acceptable consistency.
where
is the normalized score given to the component for each criterion, based on the previously presented scales.
3.2.1. Monitoring Priority Number (MPN)
Murad et al. [
32] present the MPN four criteria evaluation in detail, being the range of DET, DGN, and PGN from 1 to 5 and the SEV scale from 1 to 4. In all criteria, the lowest number represents the worst-case scenario and the highest number the best-case scenario. Therefore, the MPN range can vary between 1 and 500, with 1 being the worst case and 500 being the best-case scenario. It should be noted that the MPN scale is reversed vis-à-vis the generally found pattern, i.e., usually the lowest criterion value is associated with the less critical scenario, while the scale higher value is associated with the worst-case scenario. Thus, to match the MPN scale with the scales of the other criteria, the results obtained from the FMSA must be applied, resulting in the new MPN*.
Since the maximum MPN scale value is 500, in practice, to find the new MPN* value, just subtract the measured MPN value from 501. Thus, the MPN* scale continues to range from 1 to 500, with 1 for the least critical case and 500 for the most critical case. As mentioned earlier, for the same component more than one resulting MPN can be obtained. Thus, in this application, the worst case will be considered as input in AHP, i.e., the highest MPN* value will be considered.
3.2.2. Operation and Maintenance Derived Figures
Both ODF and MDF are figures derived through OMCTA and both, as mentioned before, are product results of four criteria: I, T, M, and WM. The choice of using OMCTA in this work also stems from a more predictive design, since in this case items are ranked considering the likelihood of system failures that would be originated by either operational or maintenance actions [
23].
Both the likelihood of predicting and preventing failure are considered, including the FMSA and OMCTA results as AHP criteria. The grades of each activity component (I, T, M, and WM) are given according to the ranking criteria presented in Murad et al. [
23]. Considering the range of values for each of the four criteria that constitute both ODF and MDF, they can vary between 1 and 625, with 1 being the best case and 625 being the worst-case scenario.
3.2.3. System Availability Impact (SAI)
The system availability impact represents the reduction or interruption in the generation of electric energy caused by a certain failure. The unavailability of a hydro generator in the Brazilian electricity system generates, besides possible direct revenue losses, severe contractual fines. Thus, the costs of an unscheduled shutdown become much higher than that of simply repairing the hydro generator, requiring better planning of maintenance actions and greater anticipation of any event that could cause equipment failure. The values assigned to this criterion are set on a scale of 1 to 10, as shown in
Table 3.
3.2.4. Mean Time to Repair
The Mean Time to Repair (MTTR) represents the average time consumed for the repair of a certain piece of equipment, having a direct impact on equipment availability [
18], as shown in
Table 4.
3.2.5. Mean Time Between Failures
The Mean Time Between Failures (MTBF) represents the average time elapsed between consecutive failures of a certain piece of equipment, and also has a direct impact on equipment availability, as shown in
Table 5.
3.2.6. Impact on People
The Impact on People (IoP) represents the detrimental effects of failures on human well-being, health, and life. Scores of this criterion are assigned according to
Table 6.
3.2.7. Environmental Impact
Environmental Impact (EI) represents the detrimental effects of failures on the environment. Its scores are assigned on a scale according to
Table 7.
4. Case Study: A Hydroelectric Power Plant
According to the British Petroleum Statistical Review of World Energy [
38], hydroelectricity ranks third in the share of global electricity generation by fuel. In Brazil, the share of hydroelectricity in the national energy matrix is even greater than the world average: almost 70% of the electricity consumed in Brazil comes from hydropower plants [
39]. Accordingly, the proposed method was developed for application in a study carried out for a run-of-river baseload hydroelectric power plant located in northern Brazil. The plant has three identical Kaplan turbine generating units with an installed capacity of approximately 450 MW. Following the model proposed in this work, the present example is subdivided into two phases: the study of the system and the definition of the MSI.
4.1. Studying the System
The first step consisted of developing a detailed functional description of one of the hydro generators of the aforementioned power plant. FT’s were used to identify the several components and then specify their main functions, as in
Figure 3 example, with a breakdown of the shaft system and several subsystems presented with some components (numbered sequentially and logically) of the considered hydro generator in this work.
Once all the functional trees had been carefully established, it was possible to proceed to the second step. IBD’s could be developed to provide a representation of the interfaces between the previously defined components and display the kind of information they exchange with each other, as presented in
Figure 4 for the hydro generator shaft, previously presented in the FT second level. The nodes presented in several parameter flows in the IBD, represented sequentially by numbers and letters, are the basis of the HAZOP analysis developed next.
HAZOP identifies monitoring points in the system, in addition to the parameters to be monitored, for the detection of component failures, allowing for predictive maintenance actions to be taken. It also highlights the consequences of these failures. Beyond the usual listing of causes of an observed deviation in the HAZOP diagram, as presented in
Table 8 (considering the shaft IBD diagram, previously presented in
Figure 4), these causes are considered in the proposed method using OMCTA diagrams, as shown in
Figure 5 (considering node 3.I, presented in
Table 8).
Parallel to the combined use of HAZOP and OMCTA, the FMSA technique was applied to determine the MPN for each failure mode of components.
Table 9 shows the FMSA worksheet with the information needed to conduct the analysis process, considering in this example the turbine and generator shafts from the case study FT.
Once the results of OMCTA and FMSA have been obtained (ODF, MDF, and MPN*) and the value of their respective resulting criteria are known, it is necessary to define the values of the other criteria considered (SAI, MTTR, MTBF, IoP, and EI) for all analyzed components. A total of 206 subsystems and components were initially considered in the system study phase, resulting in 161 evaluated items on the second phase, since in this phase only FT leaves (components that are not subdivided) are considered in the analysis.
4.2. Defining Maintenance Significant Items
Once all components have been defined and scores for the eight criteria considered have been established, AHP can be implemented. The scores for all considered components in this work can be found in
Table S1 of the supplementary material. The scores chosen for each criterion were acquired via brainstorming with system experts. The judgment matrix, built from pairwise comparisons between the criteria (step 1), is presented in
Table 10, which also shows the computed priority vector. To check the consistency of the judgment matrix, a Geometric Individual Consistency Level (GICL) of 0.0745 was computed. Since its value is lower than 0.37, it can be concluded that the judgment matrix has acceptable consistency.
The next step is to calculate the final score for all 161 components. These results can be found in
Table S2 of the supplementary material. The ten most critical maintenance items, as presented in
Table 11, are Control Gate, Air/Oil Accumulator, Thrust Bearing Collar, Thrust Bearing Pad, Thrust Bearing Leveling Link, Trash Rack, Turbine Guide Bearing Pivot, Turbine Guide Bearing Pad, Turbine Guide Bearing Housing, and Turbine Blades.
Note that such a criticality assessment is consistent with the fundamental functional issues of the generating unit. The Control Gate and the Trash Rack, e.g., are the two adduction components that are most subject to wear-and-tear as well as maintenance or operation errors. The Air/Oil Accumulator, in turn, can be considered the “heart” of the speed governor, essential to sustaining the hydro generator synchronization. Finally, the Thrust and the Turbine Guide Bearings can be considered the most critical bearings, as they have, respectively, the functions of sustaining the entire generating unit and maintaining turbine shaft alignment, which constantly suffers from disturbances from the water flow through the turbine blades.
5. Uncertainty Analysis
To verify the robustness of the presented method, an uncertainty analysis was performed considering all the grades given by the experts for each of the considered criteria. As the MPN*, ODF, and MDF criteria scores are not given directly by the experts but obtained from the product of other criteria, the uncertainty analysis extended to the latter. Thus, the uncertainties of 17 criteria were considered: DET, SEV, DGN, and PGN (related to MPN), I, T, M, and WM (related to ODF), I, T, M, and WM (related to MDF), SAI, MTTR, MTBF, IoP, and EI. Since all grades are represented by integers, a variation of one point above or below the original scores (besides the original grade) was considered for the first 12 criteria and up to two points above or below the original scores (also besides the original grade) for the last five criteria. This difference is due to the grade range of each criterion, being a variation of approximately 20% of the maximum scale value considered for all cases.
A total of 10,000,000 combinations were simulated, ensuring convergence by the mean for all analyzed parameters (mode, mean, standard deviation, maximum position, and minimum position). For each simulation, a list of MSI was created, with the items sorted from AHP results. For each considered item in this paper, its position in every generated list was evaluated. In addition, a measurement of distance (or error) between the original rank position and the mode of each item was obtained.
Table 12 presents the first twenty-five results for this analysis. The table was sorted in increasing order considering the original value obtained for the rank of each item. The complete list with the result of this analysis is available in
Table S3 of the supplementary material.
Analyzing the table, it can be noted that for the first five items there was an excellent consistency in the results. The difference between the mode and the original rank reached zero for the first two items, with a small measure of dispersion (standard deviation) as well. From the fifth to the tenth listed item, the results can also be considered very good, and between the tenth and the twentieth item, despite some variations, there is still consistency in the results. Summarizing, the overall result is extremely satisfactory since the position in the table of originally considered most significant items tends not to change significantly, despite the uncertainties considered.
6. Conclusions
This paper presented a new method for defining the MSI of a system. The method is based on several techniques, in a complex engineering approach. Although most inputs are knowledge-based, the method response is obtained in a solid and structured manner from an analytical process, the AHP, allowing decision-making to be made from qualitative and quantitative data, eliciting the opinion of experts regarding the factors that can affect the degradation of the performance of a system.
It is noteworthy that the knowledge of the experts about the analyzed system is crucial for the success of the method, especially considering the various ways to describe such a system, as well as the knowledge about the various techniques used in the method. For example, the FT’s level of detail regarding both the number of analyzed levels and which systems and subsystems would be detailed is a decision of the experts involved in the process. Such a decision will eventually have a bearing on the whole process and accordingly on the result. Thus, it can be said that good initial planning is the key point for the best use of the method. In this case, a pre-screening process for the prior considered items could be added to the method to systematize this phase in future works.
On the other hand, it is noted that the method is robust since the uncertainty’s propagation related to the criteria grades is small for the items classified as most significant from its application. Nevertheless, due to the qualitative nature of many of the applied techniques, the method is susceptible to epistemic uncertainties. Thus, the assessment of the method’s sensitivity to such uncertainty, as well as techniques that could be incorporated into the method to mitigate the effect of these uncertainties may be the subjects of future work.
Another advantage regarding the proposed method is the fact that by using AHP, the method can be easily automated and replicated to many systems, which is very interesting for its application in Maintenance 4.0. Likewise, when techniques such as FMSA and OMCTA are applied, criteria that assess the failure in advance of its occurrence, such as the likelihood of the failure due to human errors and the level of confidence in the diagnosis and prognosis of each failure the method response, will be useful for applications that require a higher level of reliability and availability of the analyzed system.
The method was applied to a hydro generator unit of a Brazilian plant and the obtained result was quite satisfactory. Due to the choice of decision criteria applied to AHP, it is noted that the method response is clearly directed to the analyzed systems’ functionality, i.e., aligned with RCM, CBM, and other modern maintenance techniques. Considering its application in hydropower plants, RCM and CBM practices can extend the duration between maintenance routines, improve unit availability, and eliminate some forced outages. However, despite these benefits, justifying the required initial investment to change from traditional maintenance practices, and the higher budgets required for these preventive efforts, can be a challenge. Thus, knowing the MSI becomes essential to direct the efforts and investments required to develop maintenance under these conditions, showing a great application potential for the developed method.
Besides, for future work, it may be considered interesting to apply the method to other complex systems to confirm its viability and ability to define MSI. In addition, it would be desirable to analyze the method sensitivity to each criterion considered and the uncertainties related not only to the scores of such criteria, but also the uncertainties related to the judgment matrix and the pairwise comparisons between the criteria.
Supplementary Materials
The following materials are available online at
https://www.mdpi.com/1996-1073/13/23/6273/s1, Table S1: Items, IDs and AHP Scores.pdf, Table S2: MSI Ranking Matrix.pdf, Table S3: Statistical results of uncertainty analysis.pdf.
Author Contributions
Conceptualization, A.C.N., A.H.d.A.M., C.A.M., M.A.d.C.M., and G.F.M.d.S.; data curation, A.C.N., A.H.d.A.M., C.A.M., M.A.d.C.M., and G.F.M.d.S.; visualization, A.C.N., A.H.d.A.M., C.A.M., M.A.d.C.M., and G.F.M.d.S.; methodology, A.C.N., A.H.d.A.M., C.A.M., M.A.d.C.M., and G.F.M.d.S.; validation, A.C.N., A.H.d.A.M., C.A.M., M.A.d.C.M., and G.F.M.d.S.; formal analysis, A.C.N., A.H.d.A.M., C.A.M., M.A.d.C.M., and G.F.M.d.S.; investigation, A.C.N., A.H.d.A.M., C.A.M., M.A.d.C.M., and G.F.M.d.S.; writing—original Draft, A.C.N., A.H.d.A.M., C.A.M., M.A.d.C.M., and G.F.M.S; writing—review and editing, A.C.N., A.H.d.A.M., C.A.M., M.A.d.C.M., G.F.M.d.S. and S.I.N.; supervision, G.F.M.d.S. and S.I.N.; project administration, G.F.M.d.S. and S.I.N.; funding acquisition, G.F.M.d.S. and S.I.N.; resources, G.F.M.d.S. and S.I.N. All authors have read and agreed to the published version of the manuscript.
Funding
This work was supported in part by Fundação para o Desenvolvimento Tecnológico da Engenharia (FDTE), Coordenação de Aperfeiçoamento de Pessoal de Nível Superior (CAPES), Conselho Nacional de Desenvolvimento Científico e Tecnológico (CNPq), and Energia de Portugal (EDP) through an ANEEL R&D project.
Conflicts of Interest
The authors declare no conflict of interest.
References
- Da Silva, R.F.; de Andrade Melani, A.H.; de Carvalho Michalski, M.A.; de Souza, G.F.; Nabeta, S.I.; Hamaji, F.H. Defining Maintenance Performance Indicators for Asset Management Based on ISO 55000 and Balanced Scorecard: A Hydropower Plant Case Study. In Proceedings of the 30th European Safety and Reliability Conference and the 15th Probabilistic Safety Assessment and Management Conference, Venice, Italy, 1–5 November 2020; Baraldi, P., Maio, F., Di Zio, E., Eds.; Research Publishing: Singapore; Venice, Italy, 2020; p. 8. [Google Scholar]
- Velmurugan, R.S.; Dhingra, T. Maintenance strategy selection and its impact in maintenance function: A conceptual framework. Int. J. Oper. Prod. Manag. 2015, 35, 1622–1661. [Google Scholar] [CrossRef]
- Rose, A. Reliability Centered Maintenance; Technical Bulletin 014; Cadick Corporation: Garland, TX, USA, 2002. [Google Scholar]
- Tang, Y.; Liu, Q.; Jing, J.; Yang, Y.; Zou, Z. A framework for identification of maintenance significant items in reliability centered maintenance. Energy 2017, 118, 1295–1303. [Google Scholar] [CrossRef]
- Gupta, G.; Mishra, R.P. A SWOT analysis of reliability centered maintenance framework. J. Qual. Maint. Eng. 2016, 22, 130–145. [Google Scholar] [CrossRef]
- Yssaad, B.; Khiat, M.; Chaker, A. Reliability centered maintenance optimization for power distribution systems. Int. J. Electr. Power Energy Syst. 2014, 55, 108–115. [Google Scholar] [CrossRef]
- Sainz, J.A.; Sebastián, M.A. Methodology for the maintenance centered on the reliability on facilities of low accessibility. Procedia Eng. 2013, 63, 852–860. [Google Scholar] [CrossRef]
- Igba, J.; Alemzadeh, K.; Anyanwu-Ebo, I.; Gibbons, P.; Friis, J. A Systems Approach Towards Reliability-Centred Maintenance (RCM) of Wind Turbines. Procedia Comput. Sci. 2013, 16, 814–823. [Google Scholar] [CrossRef]
- Cheng, Z.; Jia, X.; Gao, P.; Wu, S.; Wang, J. A framework for intelligent reliability centered maintenance analysis. Reliab. Eng. Syst. Saf. 2008, 93, 806–814. [Google Scholar] [CrossRef]
- Legutko, S. Trendy rozwoju utrzymania ruchu urządzeń i maszyn. Eksploat. Niezawodn. Maint. Reliab. 2009, nr 2, 8–16. [Google Scholar]
- Nowlan, F.S.; Heap, H.F. Reliability-Centered-Maintenance; Dolby Access Press: San Francisco, CA, USA, 1978. [Google Scholar]
- Niu, G.; Yang, B.-S.; Pecht, M. Development of an optimized condition-based maintenance system by data fusion and reliability-centered maintenance. Reliab. Eng. Syst. Saf. 2010, 95, 786–796. [Google Scholar] [CrossRef]
- Arno, R.; Dowling, N.; Schuerger, R. Equipment Failure Characteristics and RCM for Optimizing Maintenance Cost. IEEE Trans. Ind. Appl. 2016, 52, 1257–1264. [Google Scholar]
- Eti, M.C.; Ogaji, S.O.T.; Probert, S.D. Reducing the cost of preventive maintenance (PM) through adopting a proactive reliability-focused culture. Appl. Energy 2006, 83, 1235–1248. [Google Scholar] [CrossRef]
- Yuan, Y.; Wang, J.; ShangGuan, W.; Cai, B.; Song, H. Research on Identification of Maintenance Significant Items in Reliability Centered Maintenance for Train Control System. In Proceedings of the 2019 IEEE Intelligent Transportation Systems Conference (ITSC), Auckland, New Zealand, 27–30 October 2019; pp. 2817–2822. [Google Scholar]
- Santos, T.; Silva, F.J.G.; Ramos, S.F.; Campilho, R.D.S.G.; Ferreira, L.P. Asset Priority Setting for Maintenance Management in the Food Industry. Procedia Manuf. 2019, 38, 1623–1633. [Google Scholar] [CrossRef]
- Gupta, G.; Mishra, R.P. Identification of Critical Components Using ANP for Implementation of Reliability Centered Maintenance. Procedia CIRP 2018, 69, 905–909. [Google Scholar] [CrossRef]
- Melani, A.H.A.; Murad, C.A.; Caminada Netto, A.; de Souza, G.F.M.; Nabeta, S.I. Criticality-based maintenance of a coal-fired power plant. Energy 2018, 147, 767–781. [Google Scholar] [CrossRef]
- Gonçalves, F.C.C.; Trabasso, L.G. Aircraft preventive maintenance data evaluation applied in integrated product development process. J. Aerosp. Technol. Manag. 2018, 10, 1–15. [Google Scholar] [CrossRef]
- Ahmadi, A.; Söderholm, P.; Kumar, U. On aircraft scheduled maintenance program development. J. Qual. Maint. Eng. 2010, 16, 229–255. [Google Scholar] [CrossRef]
- da Silva, R.F.; de Andrade Melani, A.H.; de Carvalho Michalski, M.A.; de Martha Souza, G.F.; Nabeta, S.I. Defining Maintenance Significant Items Based on ISO 55000 and AHP: A Hydropower Plant Case Study. In Proceedings of the 29th European Safety and Reliability Conference (ESREL), Hannover, Germany, 22–26 September 2019; Research Publishing Services: Singapore, 2019; pp. 3437–3444. [Google Scholar]
- Zhong, R.Y.; Xu, X.; Klotz, E.; Newman, S.T. Intelligent Manufacturing in the Context of Industry 4.0: A Review. Engineering 2017, 3, 616–630. [Google Scholar] [CrossRef]
- Murad, C.A.; Melani, A.H.A.; Caminada Netto, A.; Michalski, M.A.C.; Souza, G.F.M.; Nabeta, S.I. OMCTA: A novel knowledge-based technique to evaluate the influence of O&M actions on maintenance management. Int. J. Ind. Eng. Manag. 2020, 11, 91–92. [Google Scholar]
- Dehghanian, P.; Fotuhi-Firuzabad, M.; Bagheri-Shouraki, S.; Razi Kazemi, A.A. Critical component identification in reliability centered asset management of power distribution systems via fuzzy AHP. IEEE Syst. J. 2012, 6, 593–602. [Google Scholar] [CrossRef]
- Hartini, E.; Dibyo, S.; Pujiarta, S. Determination of Maintenance Priority Index (MPI) for Components on RSG-Gas Safety System. J. Teknol. Reakt. Nukl. Tri Dasa Mega 2020, 20, 77–88. [Google Scholar] [CrossRef]
- Delligatti, L. SysML Distilled: A Brief Guide to the Systems Modeling Language, 1st ed.; Pearson Education: Saddle River, NJ, USA, 2013; ISBN 978-0321927866. [Google Scholar]
- Melani, A.H.A.; Souza, G.F.M. Mapping SysML Diagrams into Bayesian Networks: A Systems Engineering Approach for Fault Diagnosis. ASCE-ASME J. Risk Uncertain. Eng. Syst. Part B Mech. Eng. 2020, 6, 20. [Google Scholar] [CrossRef]
- IEC. 61882: 2016 Hazard and Operability Studies (HAZOP Studies)—Application Guide; International Electrotechnical Commission: Geneva, Switzerland, 2016. [Google Scholar]
- Baybutt, P. Design intent for hazard and operability studies. Process Saf. Prog. 2016, 35, 36–40. [Google Scholar] [CrossRef]
- Vogl, G.W.; Weiss, B.A.; Donmez, M.A. Standards for prognostics and health management (PHM) techniques within manufacturing operations. In Proceedings of the Annual Conference of the Prognostics and Health Management Society 2014, Fort Worth, TX, USA, 29 September–2 October 2014; Volume 1, pp. 576–588. [Google Scholar]
- ISO 13379-1:2012(E) Condition Monitoring and Diagnostics of Machines—Data Interpretation and Diagnostics Techniques—Part 1: General Guidelines; ISO: Geneva, Switzerland, 2012.
- Murad, C.; Melani, A.H.A.; Michalski, M.A.C.; Caminada Netto, A.; de Souza, G.; Nabeta, S.I. Fuzzy-FMSA: Evaluating Fault Monitoring and Detection Strategies Based on Failure Mode and Symptom Analysis and Fuzzy Logic. ASCE-ASME J. Risk Uncert Engrg Sys. Part B Mech. Engrg 2020, 6, 12. [Google Scholar] [CrossRef]
- Saaty, T.L. How to make a decision: The analytic hierarchy process. Eur. J. Oper. Res. 1990, 48, 9–26. [Google Scholar] [CrossRef]
- Saaty, T.L. Decision making with the analytic hierarchy process. Int. J. Serv. Sci. 2008, 1, 83–98. [Google Scholar] [CrossRef]
- Dong, Y.; Zhang, G.; Hong, W.-C.; Xu, Y. Consensus models for AHP group decision making under row geometric mean prioritization method. Decis. Support Syst. 2010, 49, 281–289. [Google Scholar] [CrossRef]
- Crawford, G.; Williams, C. A note on the analysis of subjective judgment matrices. J. Math. Psychol. 1985, 29, 387–405. [Google Scholar] [CrossRef]
- Aguarón, J.; Moreno-Jiménez, J.M. The geometric consistency index: Approximated thresholds. Eur. J. Oper. Res. 2003, 147, 137–145. [Google Scholar] [CrossRef]
- British Petroleum. BP Statistical Review of World Energy; British Petroleum: London, UK, 2018. [Google Scholar]
- MME. Balanço Energético Nacional 2018; Ministério de Minas e Energia: Brasília, Brazil, 2018.
| Publisher’s Note: MDPI stays neutral with regard to jurisdictional claims in published maps and institutional affiliations. |
© 2020 by the authors. Licensee MDPI, Basel, Switzerland. This article is an open access article distributed under the terms and conditions of the Creative Commons Attribution (CC BY) license (http://creativecommons.org/licenses/by/4.0/).

 ,
, 


