Improvement of Power Capacity of Electric-Assisted Bicycles Using Fuel Cells with Metal Hydride

Abstract
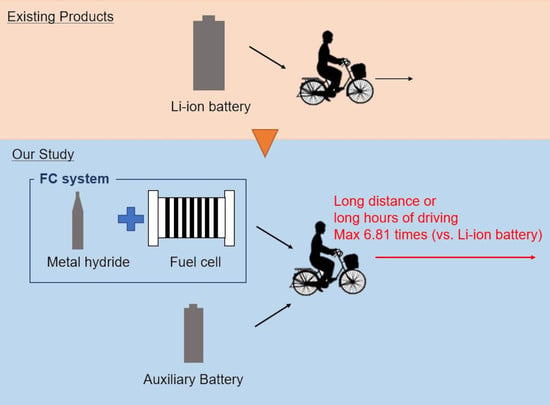
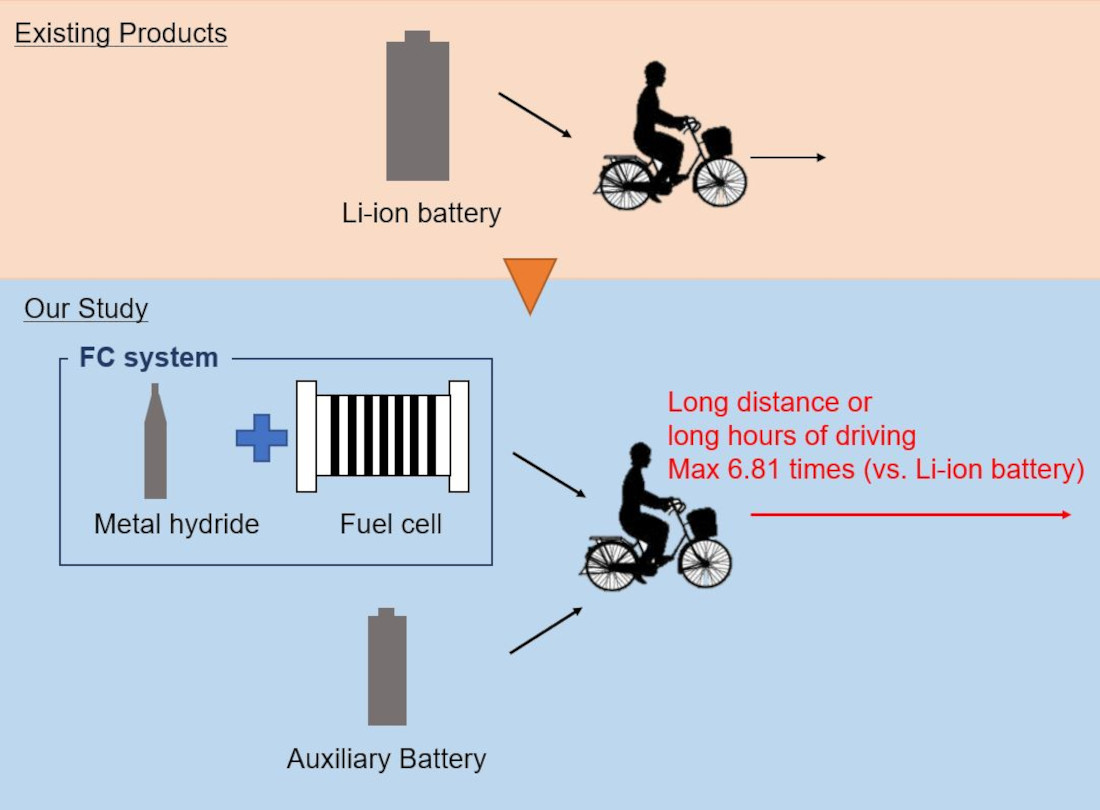
1. Introduction
2. Materials and Methods
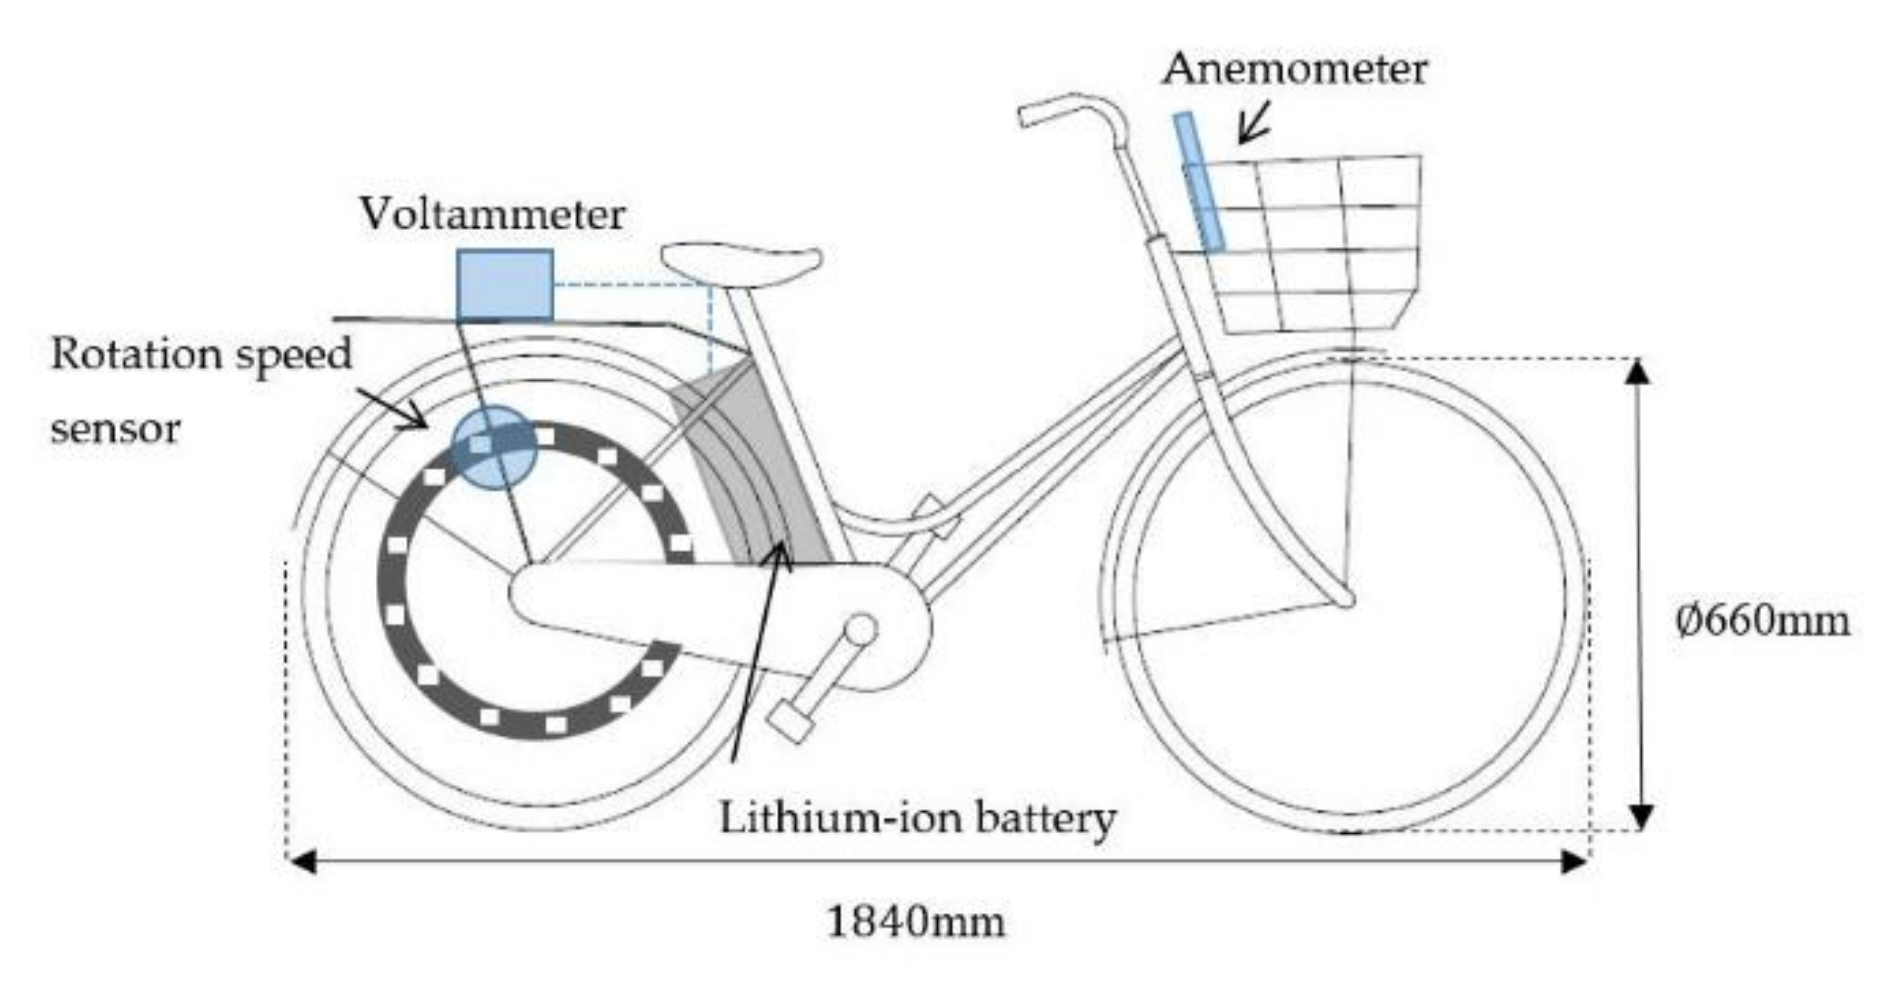
2.1. Experiment on Power Demand for e-Bike
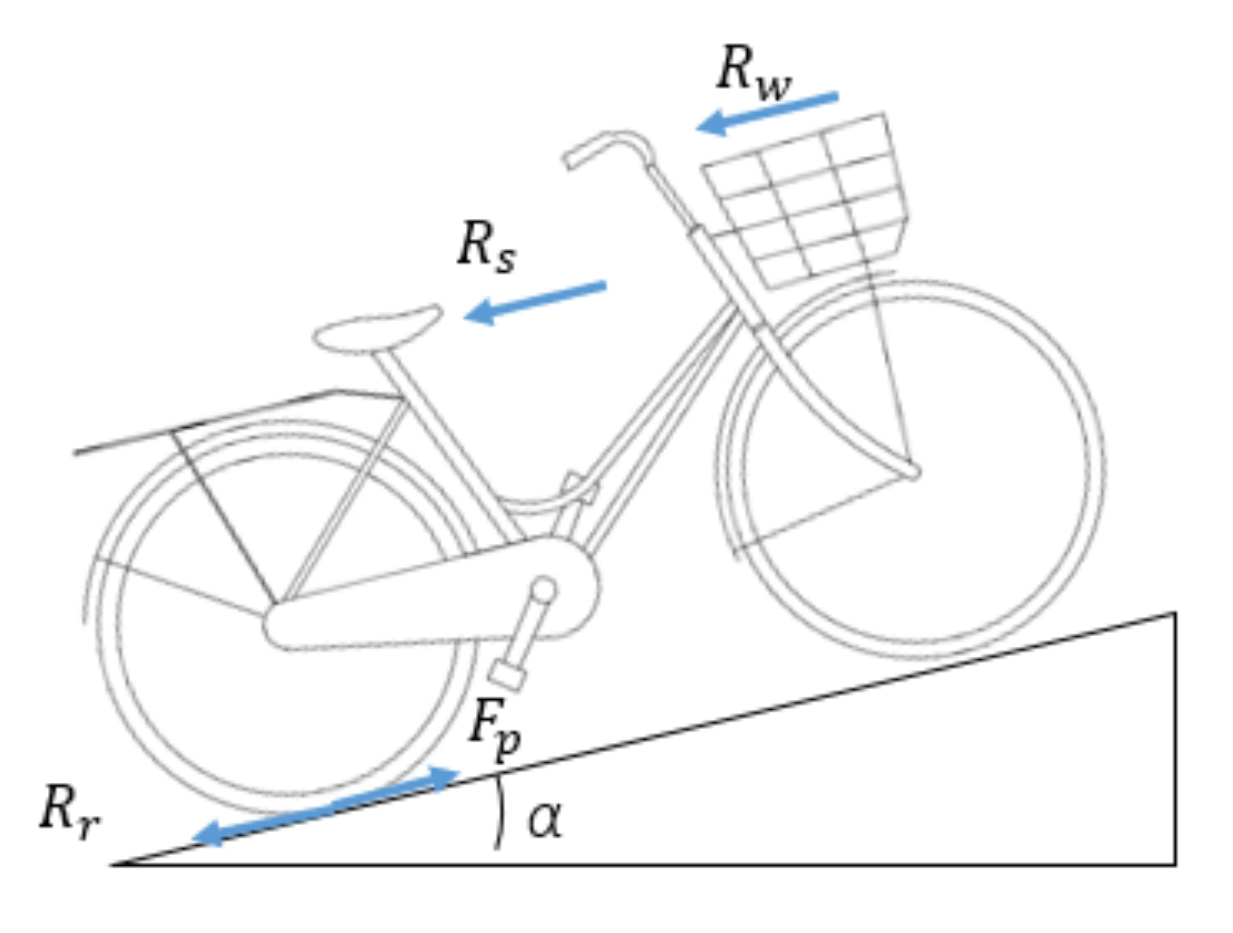
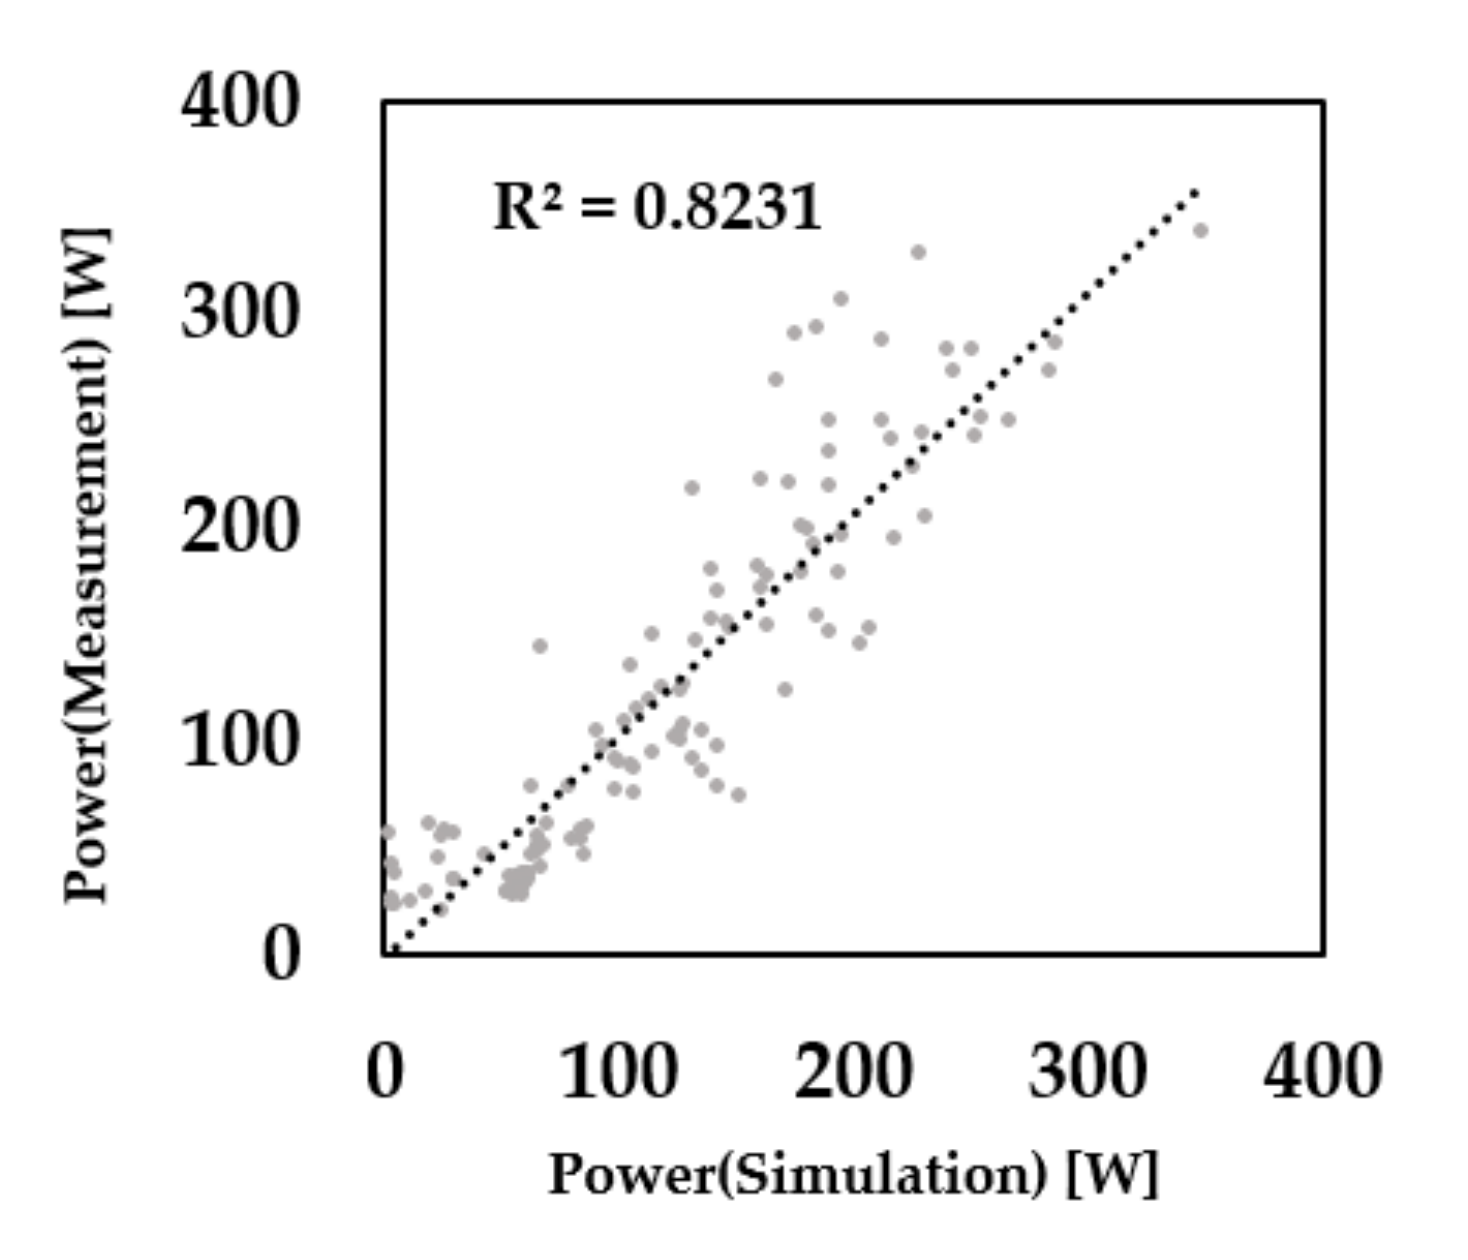
2.2. Dynamic Model for Bicycles
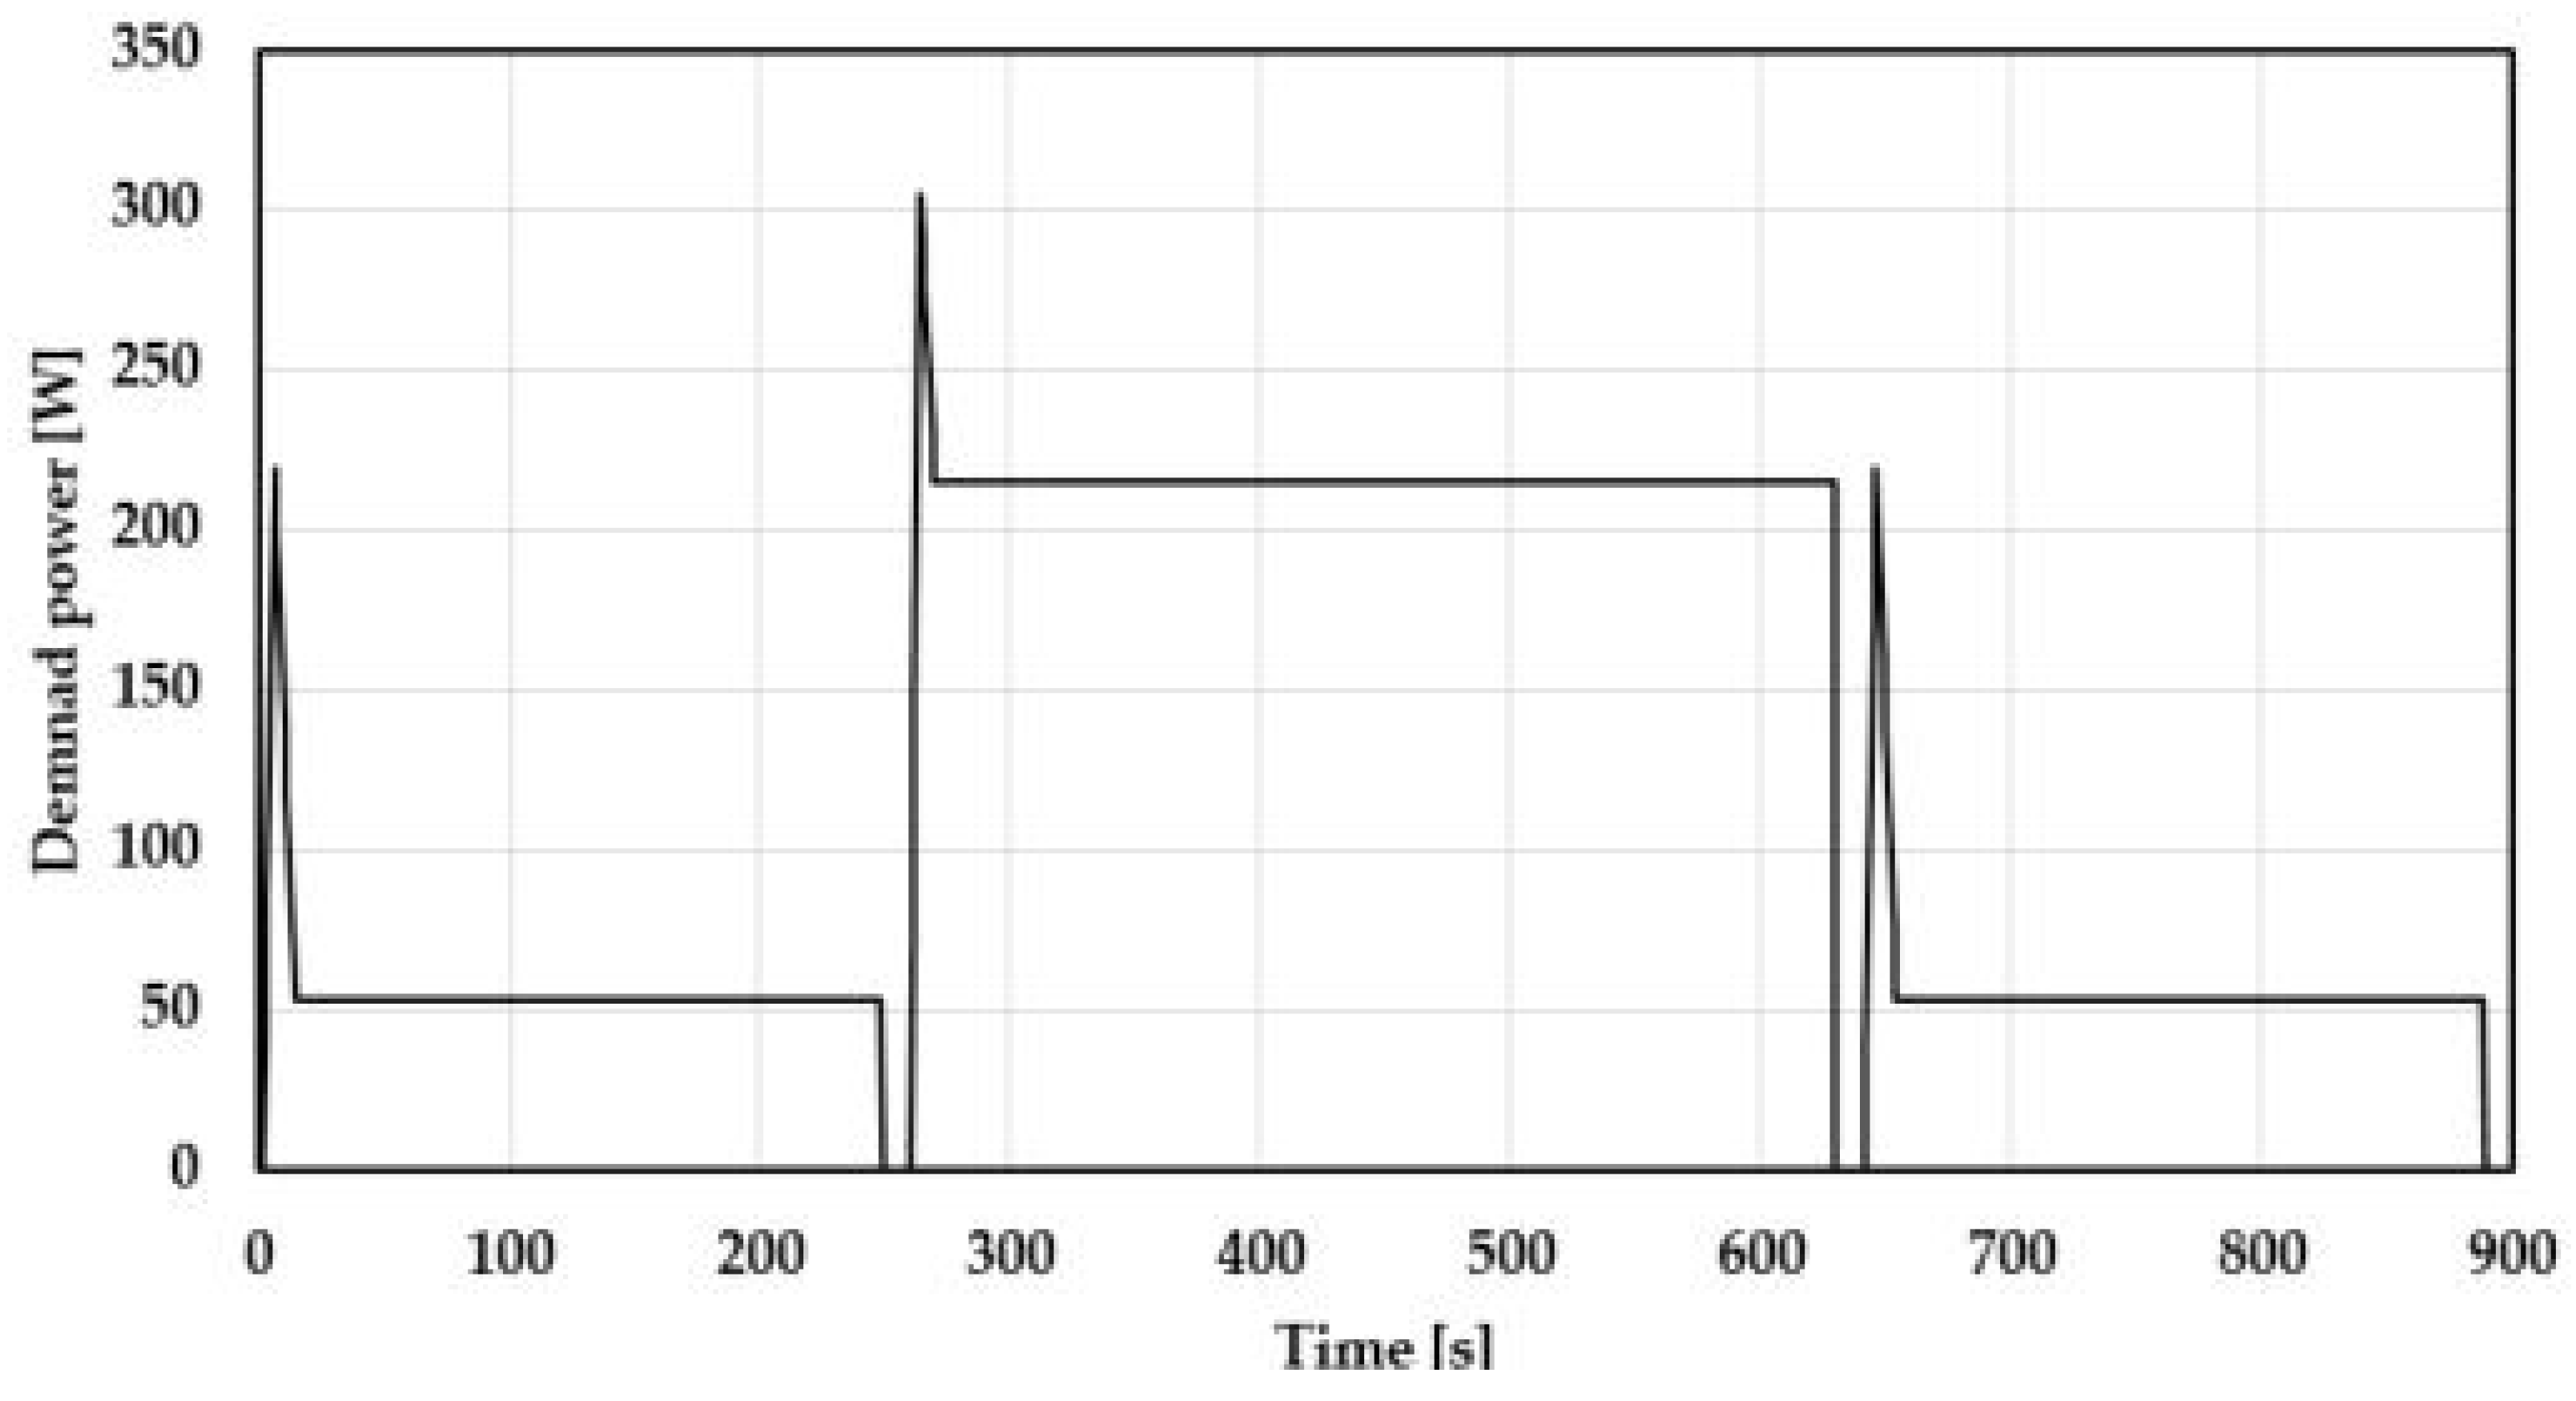
2.3. Predicting Power Demand for Running Schedule
2.4. Evaluation of Power-Source Scale for the h-Bike
2.5. Discharge Experiment of MH
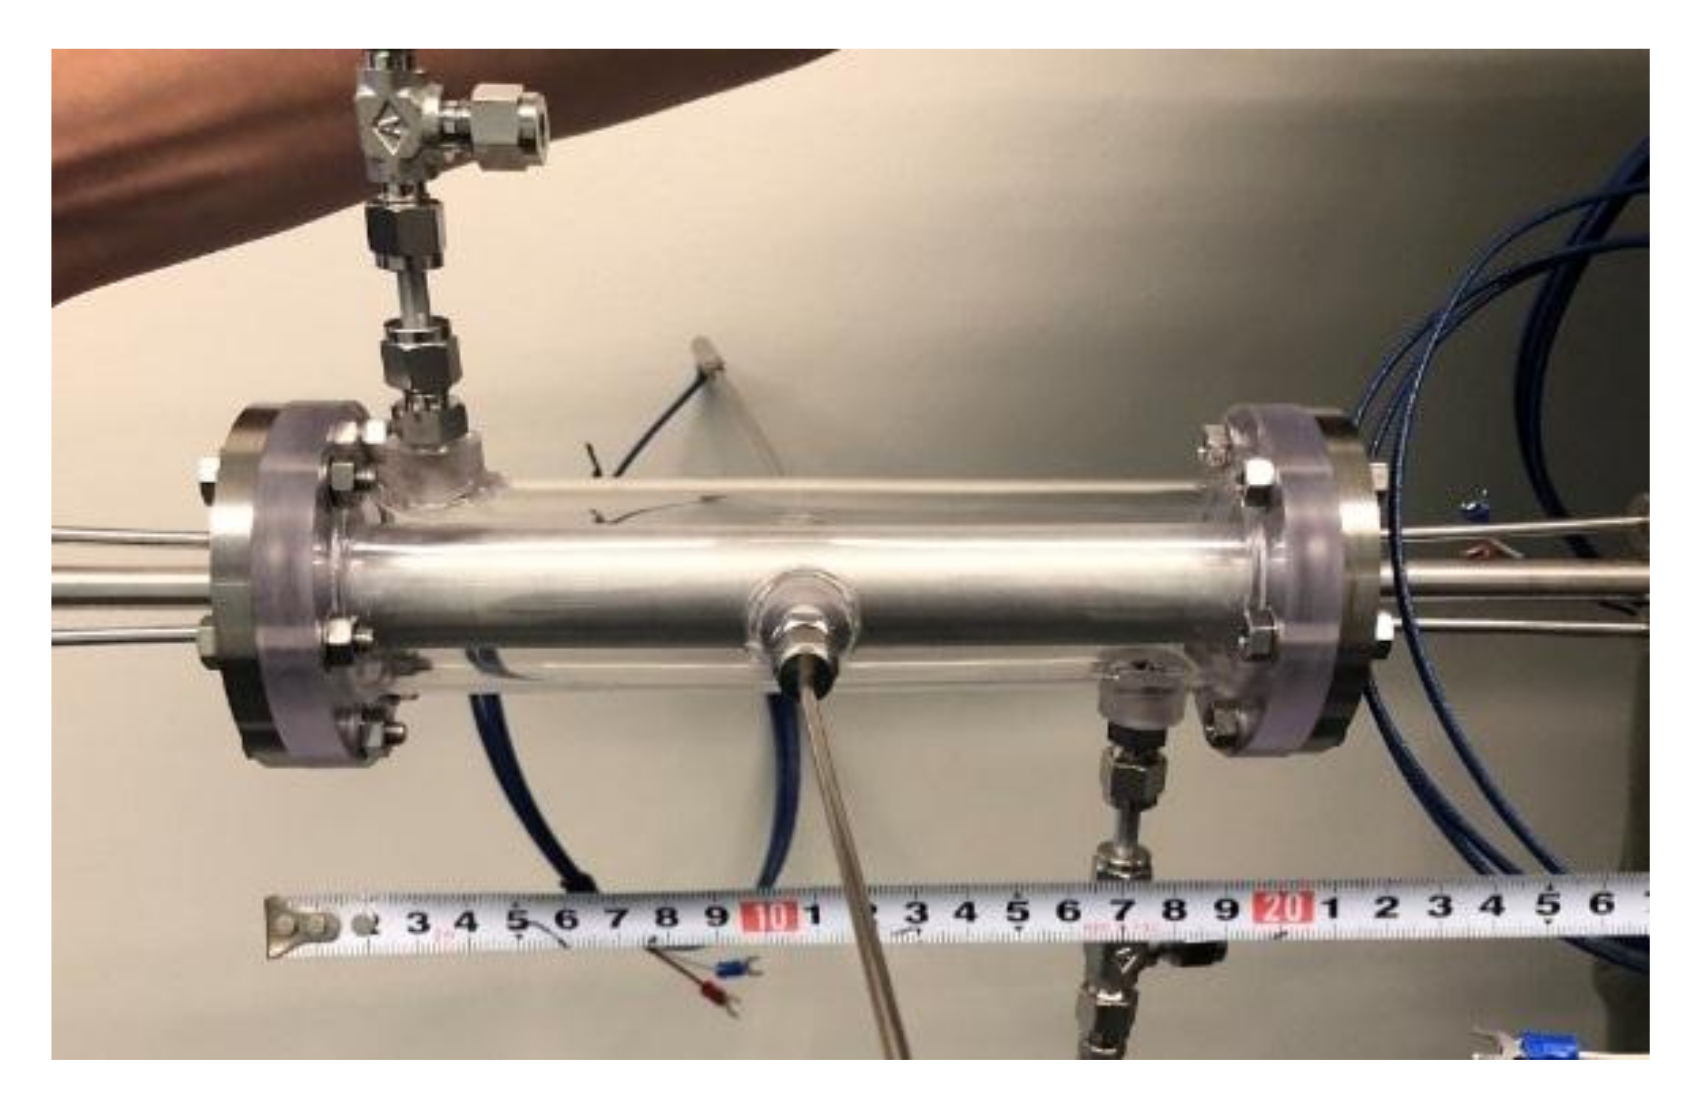
2.5.1. Design of Tank
2.5.2. Experimental Apparatus and Procedures
3. Results and Discussion
3.1. Electric Power Demand for e-Bikes
3.2. Projection of the Assisted Demand
3.3. Performance Estimation of e-Bike
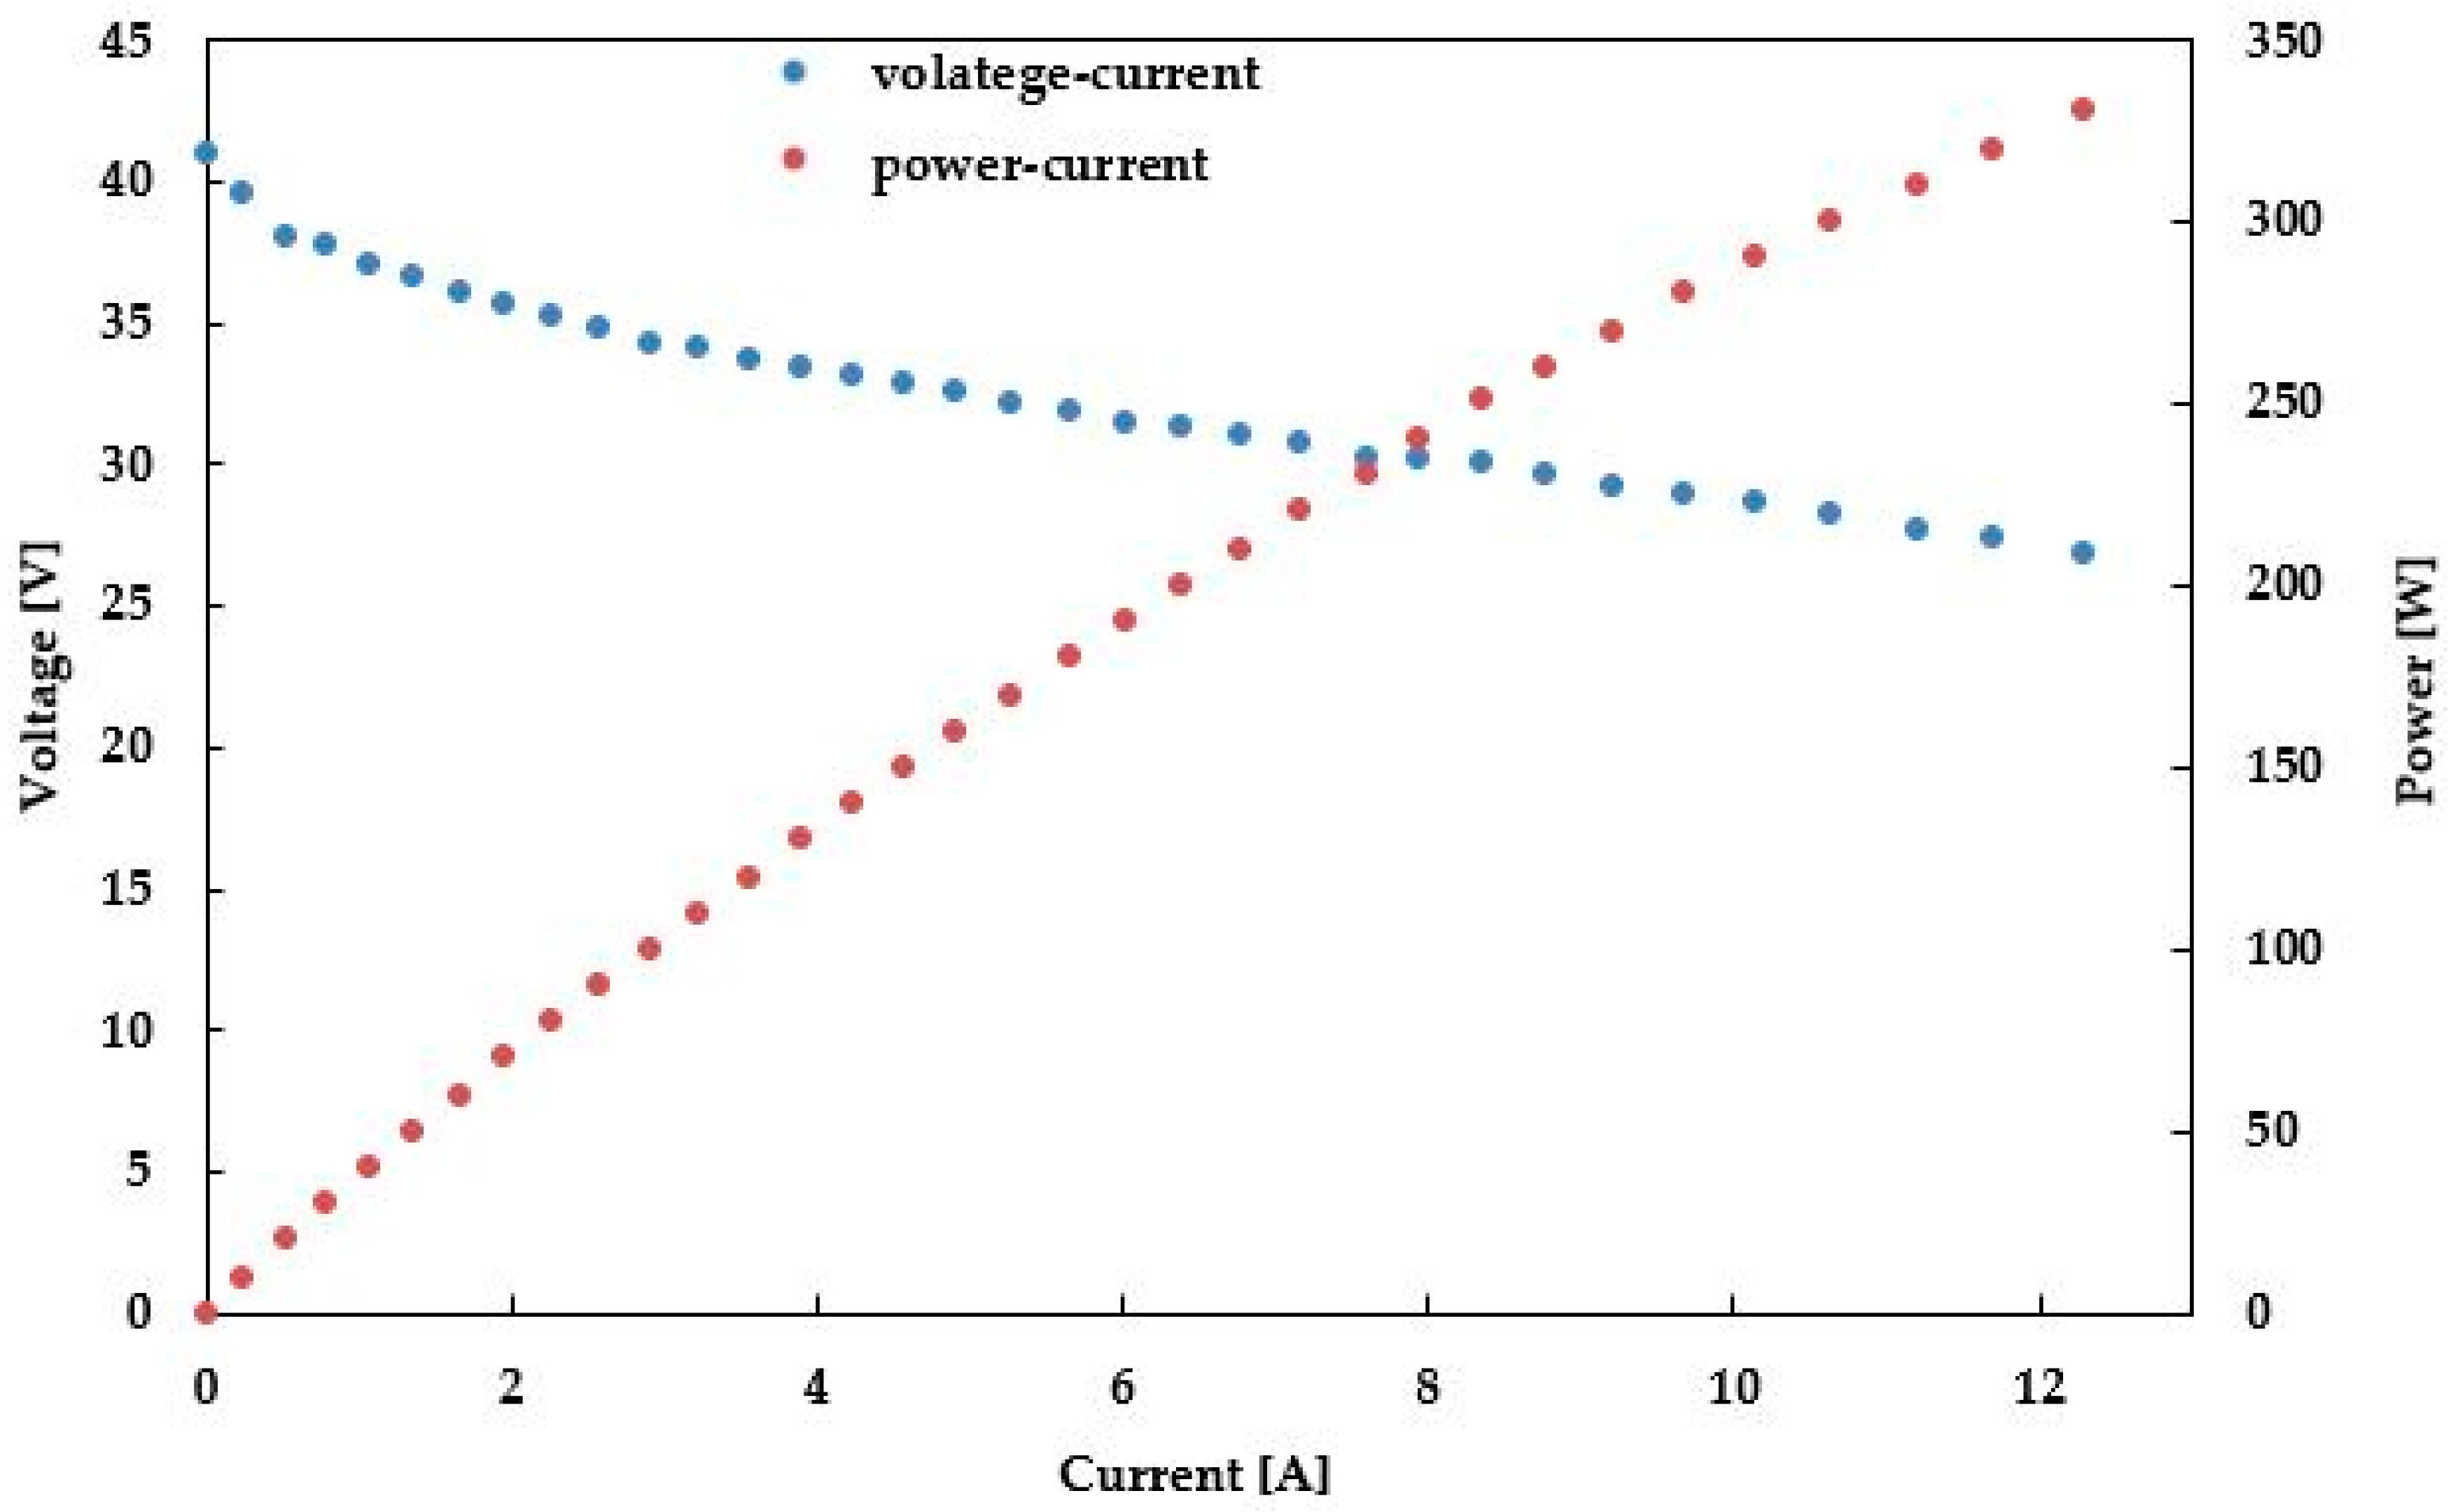
3.4. Performance Estimation of h-Bike
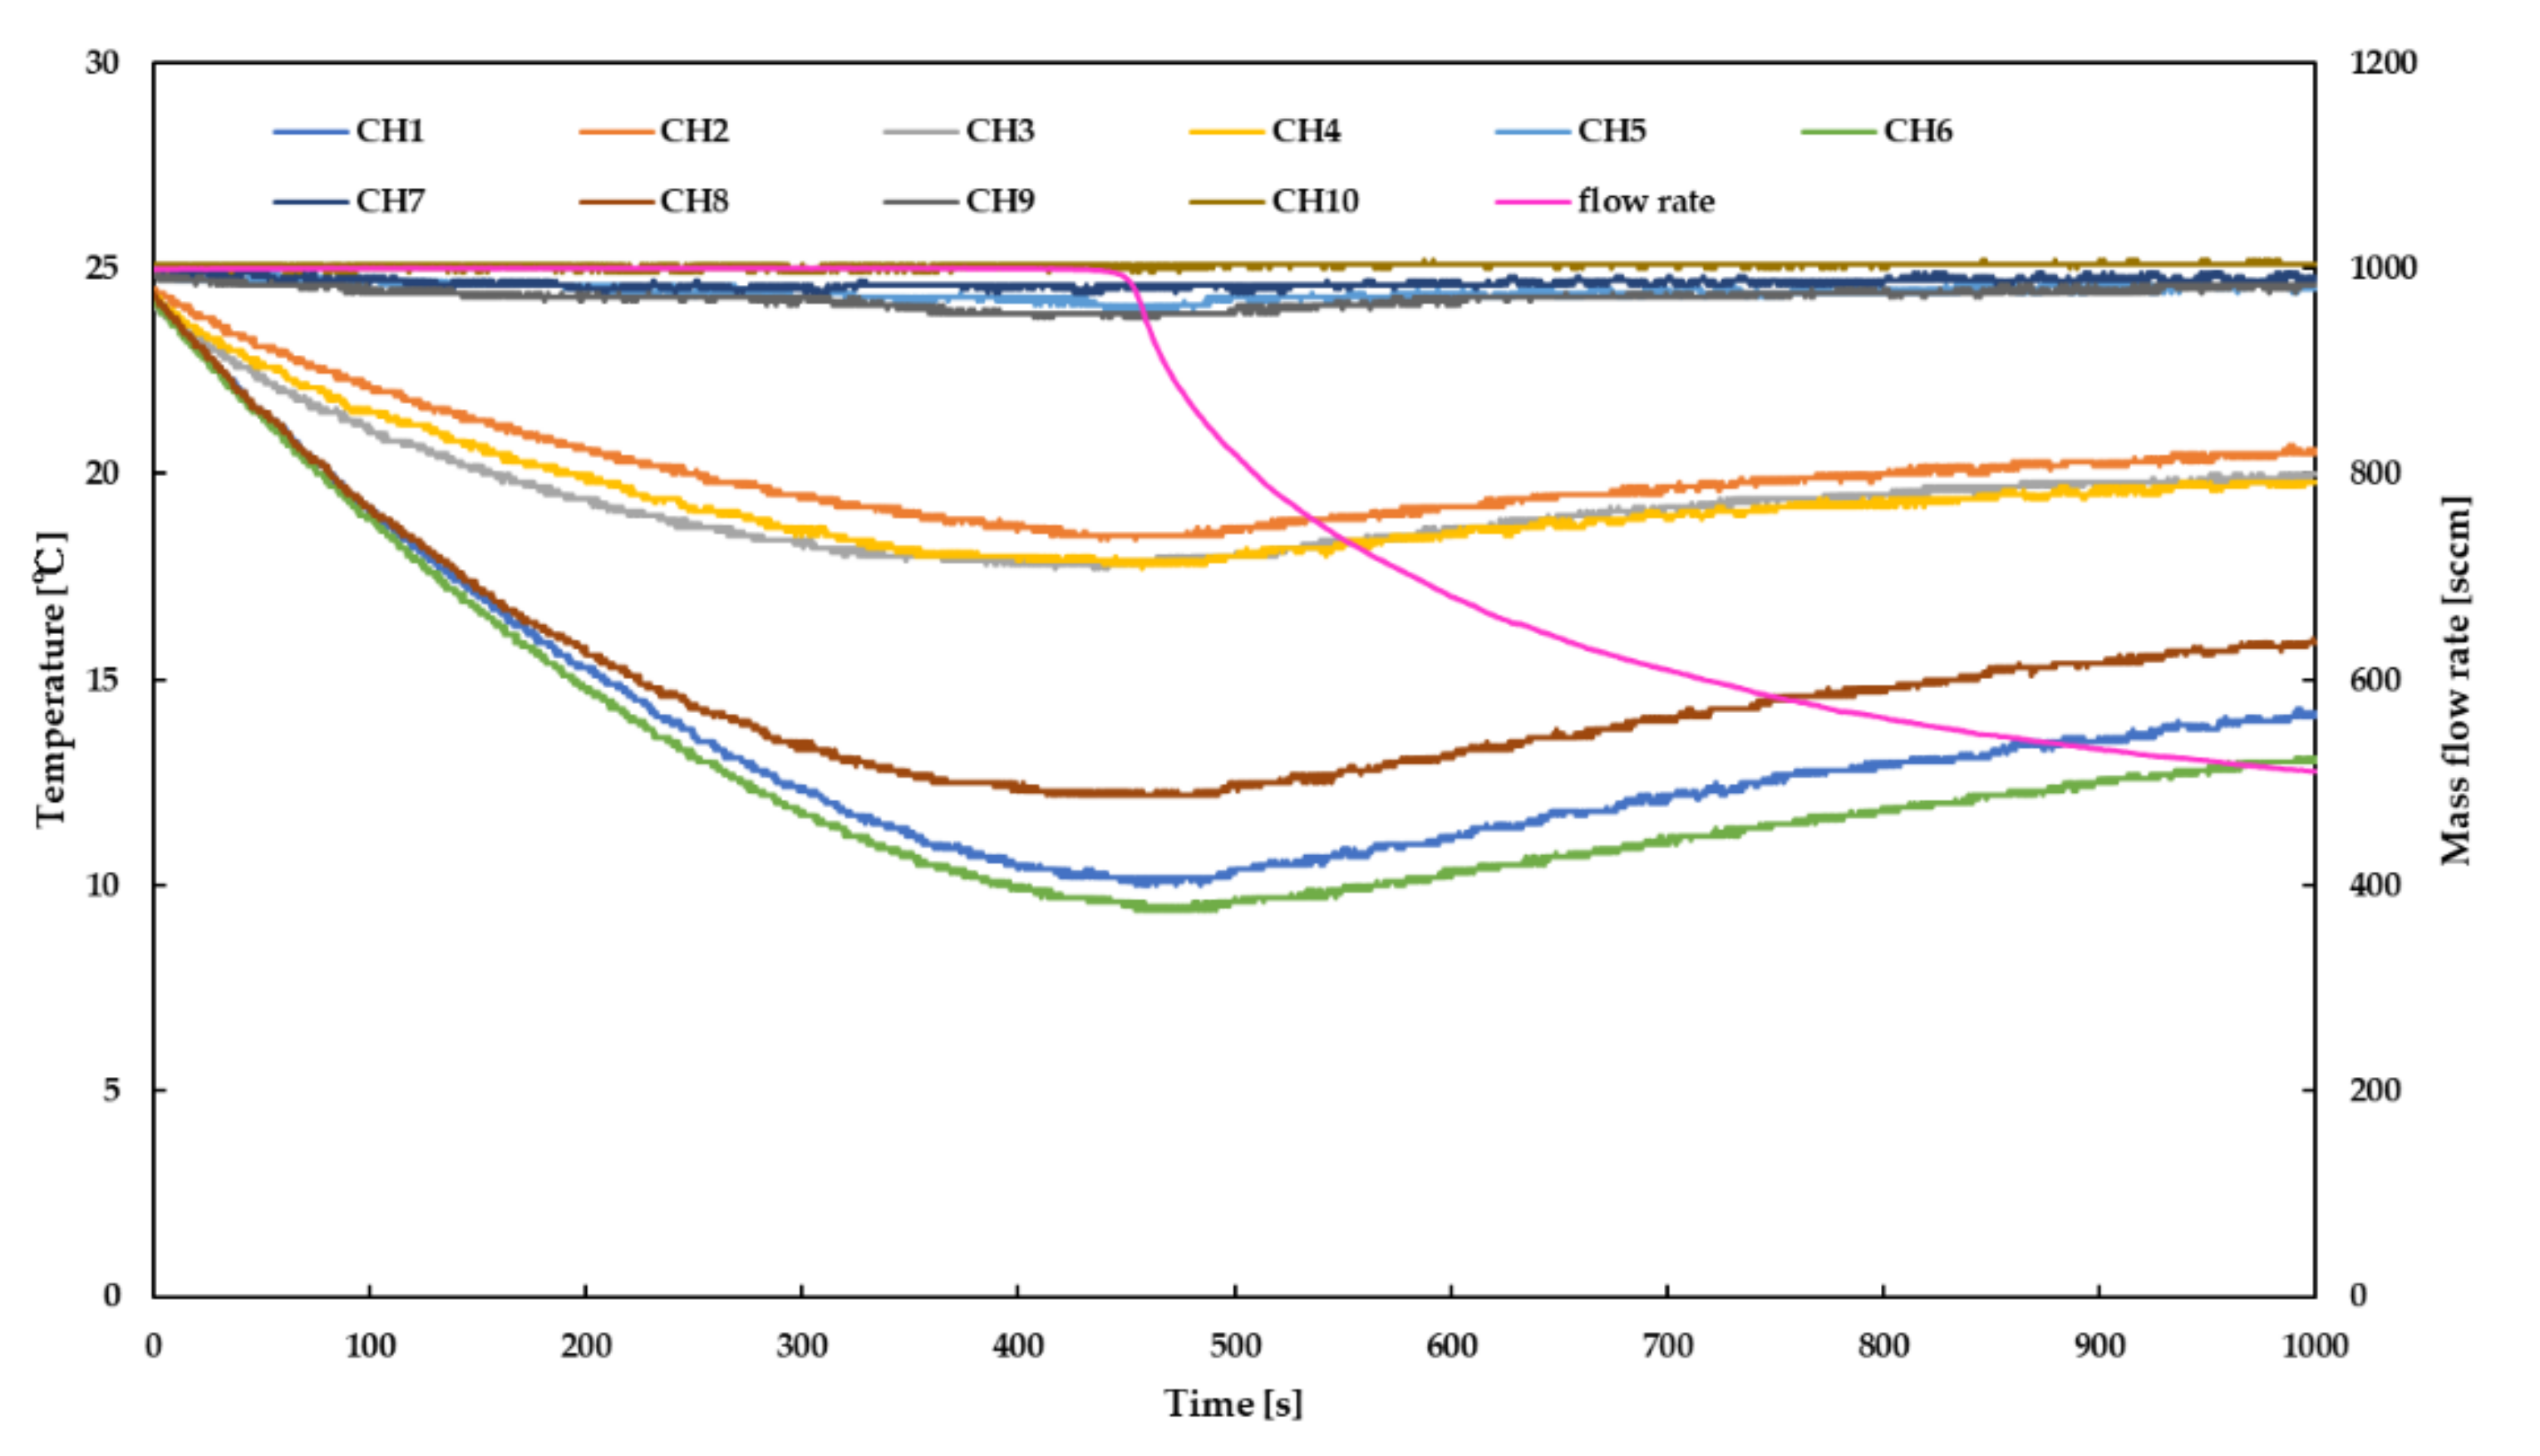
3.5. Experimental Result of Desorption
4. Conclusions
5. Future Work
Author Contributions
Funding
Conflicts of Interest
References
- Daud, W.R.W.; Rosli, R.; Majlan, E.; Hamid, S.; Mohamed, R.; Husaini, T. PEM fuel cell system control: A review. Renew. Energy 2017, 113, 620–638. [Google Scholar] [CrossRef]
- Shigeru, K.; Li, Y. Demand and Supply Potential of Hydrogen Energy in East Asia; ERIA Research Project Report; Economic Research Institute for ASEAN and East Asia: Jakarta, Indonesia, 2018. [Google Scholar]
- Dunn, S. Hydrogen futures: Toward a sustainable energy system. Int. J. Hydrogen Energy 2002, 27, 235–264. [Google Scholar] [CrossRef]
- Tso, C.; Chang, S.Y. A viable niche market—Fuel cell scooters in Taiwan. Int. J. Hydrogen Energy 2003, 28, 757–762. [Google Scholar] [CrossRef]
- Cardinali, L.; Santomassimo, S.; Stefanoni, M. Design and realization of a 300 W fuel cell generator on an electric bicycle. J. Power Sources 2002, 106, 384–387. [Google Scholar] [CrossRef]
- Formulation of a New Strategic Roadmap for Hydrogen and Fuel Cells. Available online: https://www.meti.go.jp/english/press/2019/pdf/0312_002a.pdf (accessed on 5 October 2020).
- Toyota Considers Hydrogen-based Mobility Partnership between Railways and Automobiles. Available online: https://global.toyota/en/newsroom/corporate/24687658.html (accessed on 5 October 2020).
- Toyota Develops Fuel Cell System for Maritime Applications. Available online: https://global.toyota/en/newsroom/corporate/31321325.html (accessed on 5 October 2020).
- Weinert, J.X.; Ma, C.; Yang, X.; Cherry, C.R. Electric two-wheelers in China: Effect on travel behavior, mode shift, and user safety perceptions in a medium-sized city. Transp. Res. Rec. 2007, 2038, 62–68. [Google Scholar] [CrossRef]
- Maruyama, N.; Hara, S.; Torregrosa, M.M.; Okamoto, M.; Kidaite, Y.; Hirota, M. Environmental Evaluation and Effectiveness of Electric-assist Bicycle for a Local Transportation. In Proceedings of the 10th International Energy Conversion Engineering Conference, Atlanta, GA, USA, 30 July–1 August 2012; p. 3864. [Google Scholar]
- Campisi, T.; Acampa, G.; Marino, G.; Tesoriere, G. Cycling Master Plans in Italy: The I-BIM Feasibility Tool for Cost and Safety Assessments. Sustainability 2020, 12, 4723. [Google Scholar] [CrossRef]
- Renčelj, M.; Campisi, T.; Canale, A.; Tesoriere, G. The Developing Benefits of the Advance Space Line (ASL) Systems for Planning Safer Traffic Light Intersections. In AIP Conference Proceedings 2019; AIP Publishing LLC: Melville, NY, USA, 2019; p. 160007. [Google Scholar]
- Nikiforiadis, A.; Basbas, S. Can pedestrians and cyclists share the same space? The case of a city with low cycling levels and experience. Sustain. Cities Soc. 2019, 46, 101453. [Google Scholar] [CrossRef]
- Ministry of Land, Transport and Tourism. Bicycle Utilization Promotion Plan; Ministry of Land, Transport and Tourism: Tokyo, Japan, 2018.
- Bike Share Service. Available online: https://docomo-cycle.jp/ (accessed on 28 January 2020).
- Hosobuchi, E.; Misaki, C.; Katayama, N.; Long, Y.; Dowaki, K. Environmental impacts of fuel cell assisted bicycles in a sharing scheme. J. Jpn. Inst. Energy 2019, in press. [Google Scholar]
- Nagase, Y. Community Cycles in Taipei—The State of YouBike. Available online: https://www.itej.or.jp/assets/seika/jijyou/jijyou_2016_03.pdf (accessed on 6 October 2020).
- Mellino, S.; Petrillo, A.; Cigolotti, V.; Autorino, C.; Jannelli, E.; Ulgiati, S. A Life Cycle Assessment of lithium battery and hydrogen-FC powered electric bicycles: Searching for cleaner solutions to urban mobility. Int. J. Hydrogen Energy 2017, 42, 1830–1840. [Google Scholar] [CrossRef]
- Sopian, K.; Daud, W.R.W. Challenges and future developments in proton exchange membrane fuel cells. Renew. Energy 2006, 31, 719–727. [Google Scholar] [CrossRef]
- Hwang, J.; Wang, D.; Shih, N.; Lai, D.; Chen, C.O.K. Development of fuel-cell-powered electric bicycle. J. Power Sources 2004, 133, 223–228. [Google Scholar] [CrossRef]
- Folkesson, A.; Andersson, C.; Alvfors, P.; Alaküla, M.; Overgaard, L. Real life testing of a hybrid PEM fuel cell bus. J. Power Sources 2003, 118, 349–357. [Google Scholar] [CrossRef]
- Dowaki, K.; Katayama, N.; Nagaishi, T.; Kuroda, S.; Kameyama, M. A system analysis of storage alloy for Bio-H2 in consideration of the purification performance. J. Jpn. Inst. Energy 2017, 96, 266–272. [Google Scholar] [CrossRef]
- Eberle, U.; Felderhoff, M.; Schueth, F. Chemical and physical solutions for hydrogen storage. Angew. Chem. Int. Ed. 2009, 48, 6608–6630. [Google Scholar] [CrossRef] [PubMed]
- Wee, J.H. Applications of proton exchange membrane fuel cell systems. Renew. Sustain. Energy Rev. 2007, 11, 1720–1738. [Google Scholar] [CrossRef]
- Lototskyy, M.V.; Tolj, I.; Pickering, L.; Sita, C.; Barbir, F.; Yartys, V. The use of metal hydrides in fuel cell applications. Prog. Nat. Sci. Mater. Int. 2017, 27, 3–20. [Google Scholar] [CrossRef]
- Thomas, C. Fuel cell and battery electric vehicles compared. Int. J. Hydrogen Energy 2009, 34, 6005–6020. [Google Scholar] [CrossRef]
- Züttel, A. Materials for hydrogen storage. Mater. Today 2003, 6, 24–33. [Google Scholar] [CrossRef]
- Hara, D.; Misaki, C.; Sugihara, H.; Kako, S.; Katayama, N.; Dowaki, K. Exergy and Environmental Analysis of a Bio-Hydrogen Supply Chain Using Data Envelope Analysis. In EcoDesign and Sustainability II; Springer: Singapore, 2020; Chapter 35; ISBN 978-981-15-6774-2. in press. [Google Scholar]
- Kendall, K.; Pollet, B. 4.12-Hydrogen and Fuel Cells in Transport. Compr. Renew. Energy 2012, 4, 301. [Google Scholar]
- Kheirandish, A.; Kazemi, M.S.; Dahari, M. Dynamic performance assessment of the efficiency of fuel cell-powered bicycle: An experimental approach. Int. J. Hydrogen Energy 2014, 39, 13276–13284. [Google Scholar] [CrossRef]
- Ji, S.; Cherry, C.R.; Han, L.D.; Jordan, D.A. Electric bike sharing: Simulation of user demand and system availability. J. Clean. Prod. 2014, 85, 250–257. [Google Scholar] [CrossRef]
- Yamate, S.; Fujiwara, Y.; Tadokoro, H.; Katayama, N.; Seo, Y.; Kameyama, M.; Dowaki, K. System Analysis of the Drone with FC Battery Fueled by Bio-hydrogen. J. Jpn. Inst. Energy 2018, 97, 336–341. [Google Scholar] [CrossRef]
- Muetze, A.; Tan, Y.C. Electric bicycles—A performance evaluation. IEEE Ind. Appl. Mag. 2007, 13, 12–21. [Google Scholar] [CrossRef]
- Abagnale, C.; Cardone, M.; Iodice, P.; Strano, S.; Terzo, M.; Vorraro, G. A dynamic model for the performance and environmental analysis of an innovative e-bike. Energy Procedia 2015, 81, 618–627. [Google Scholar] [CrossRef]
- Technical Specification for Sealed Ni-MH Cylindrical Battery. Available online: http://akizukidenshi.com/download/ds/goldenpower/MR2100AA.pdf (accessed on 15 July 2020).
- Christen, T.; Carlen, M.W. Theory of Ragone plots. J. Power Sources 2000, 91, 210–216. [Google Scholar] [CrossRef]
- Zhu, W.H.; Zhu, Y.; Davis, Z.; Tatarchuk, B.J. Energy efficiency and capacity retention of Ni–MH batteries for storage applications. Appl. Energy 2013, 106, 307–313. [Google Scholar] [CrossRef]
- Larminie, J.; Dicks, A.; McDonald, M.S. Fuel Cell Systems Explained; Wiley: Chichester, UK, 2003; Volume 3. [Google Scholar]
- Shabani, B. Solar-Hydrogen Combined Heat and Power Systems for Remote Area Power Supply. Ph.D. Thesis, RMIT University, Melbourne, Australia, 2010. [Google Scholar]
- Shanghai Re-Fire TechnologyCo. Fuel Cell Stack Specifications; Shanghai Re-Fire TechnologyCo.: Shanghai, China, 2018. [Google Scholar]
- Chung, C.; Yang, S.W.; Yang, C.Y.; Hsu, C.W.; Chiu, P.Y. Experimental study on the hydrogen charge and discharge rates of metal hydride tanks using heat pipes to enhance heat transfer. Appl. Energy 2013, 103, 581–587. [Google Scholar] [CrossRef]


| Load Weight [kg] | Slope Angle [°] | Relative Wind Speed (Average) [m/s] | Bike Speed (Average) [m/s] |
|---|---|---|---|
| 0.0 | 0.00–5.71 | 0.833–3.69 | 0.600–4.52 |
| 3.0 | 0 | 2.06–4.73 | 3.98–4.12 |
| 5.0 | 0 | 3.98–4.12 | 3.98–4.19 |
| 8.0 | 0.00–5.71 | 0.733–5.00 | 1.16–4.27 |
| Model Parameter | Value |
|---|---|
| A [m2] | 0.4 [33] |
| (air) [kg/m3] | 1.225 [34] |
| 1.0 [33] | |
| 0.014 [33] |
| Road Condition | Distance [km] | Speed [km/h] | Gradient [°] | Wind Speed [m/s] | Rider Weight [kg] |
|---|---|---|---|---|---|
| Flat road | 1 | 15 | 0 | 0 | 55 |
| Gradient road | 1 | 10 | 4 | 0 | 55 |
| Flat road | 1 | 15 | 0 | 0 | 55 |
| Gradient road | 1 | 20 | −4 | 0 | 55 |
| Mass Flow Meter | Temperature Logger |
|---|---|
| Sampling interval: 0.1 s | Sampling interval: 0.1 s |
| Measurement range: 0.06–3.0 NL/min | Measurement range: −200~1370 °C |
| Accuracy: 1.0% Setpoint. | Reliability: 0.05% of display value |
| Road Condition | Hydrogen Flow Rate [NL/min] | Heat Generation [W] | Efficiency | |
|---|---|---|---|---|
| Flat road | 57.80 | 0.397 | 9.81 | 0.855 |
| Gradient road | 215 | 1.89 | 107 | 0.666 |
| Scenario | Bike | Bicycle (w/o Battery) [kg] | Battery [kg] | Rider [kg] | Gain Allowance [kg] | Total Weight [kg] |
|---|---|---|---|---|---|---|
| 1 (allowance: 4.0 kg) | e-bike | 25.54 | 2.16 (li-ion) | 55 | 4.0 | 86.7 |
| h-bike | 25.54 | 0.824 (FC) | 55 | - | 86.7 | |
| 5.05 (MH/cartridge) | ||||||
| 0.285 (aux. battery) | ||||||
| 2 (allowance: 8.0 kg) | e-bike | 25.54 | 2.16 (li-ion) | 55 | 8.0 | 90.7 |
| h-bike | 25.54 | 0.824 (FC) | 55 | - | 90.7 | |
| 9.05 (MH/cartridge) | ||||||
| 0.285 (aux. battery) |
Publisher’s Note: MDPI stays neutral with regard to jurisdictional claims in published maps and institutional affiliations. |
© 2020 by the authors. Licensee MDPI, Basel, Switzerland. This article is an open access article distributed under the terms and conditions of the Creative Commons Attribution (CC BY) license (http://creativecommons.org/licenses/by/4.0/).
Share and Cite
Misaki, C.; Hara, D.; Katayama, N.; Dowaki, K. Improvement of Power Capacity of Electric-Assisted Bicycles Using Fuel Cells with Metal Hydride. Energies 2020, 13, 6272. https://doi.org/10.3390/en13236272
Misaki C, Hara D, Katayama N, Dowaki K. Improvement of Power Capacity of Electric-Assisted Bicycles Using Fuel Cells with Metal Hydride. Energies. 2020; 13(23):6272. https://doi.org/10.3390/en13236272
Chicago/Turabian StyleMisaki, Chiharu, Daisuke Hara, Noboru Katayama, and Kiyoshi Dowaki. 2020. "Improvement of Power Capacity of Electric-Assisted Bicycles Using Fuel Cells with Metal Hydride" Energies 13, no. 23: 6272. https://doi.org/10.3390/en13236272
APA StyleMisaki, C., Hara, D., Katayama, N., & Dowaki, K. (2020). Improvement of Power Capacity of Electric-Assisted Bicycles Using Fuel Cells with Metal Hydride. Energies, 13(23), 6272. https://doi.org/10.3390/en13236272