Article

Estimation of Energy Efficiency Class Limits for Multi-Family Residential Buildings in Poland

by
Jerzy Kwiatkowski
1,* and
Joanna Rucińska
2
1
District Heating and Natural Gas Systems Division, Faculty of Building Services, Hydro and Environmental Engineering, Warsaw University of Technology, Nowowiejska 20, 00-653 Warsaw, Poland
2
Division of Air Conditioning and Heating, Faculty of Building Services, Hydro and Environmental Engineering, Warsaw University of Technology, Nowowiejska 20, 00-653 Warsaw, Poland
*
Author to whom correspondence should be addressed.
Energies 2020, 13(23), 6234; https://doi.org/10.3390/en13236234
Submission received: 30 October 2020 / Revised: 17 November 2020 / Accepted: 23 November 2020 / Published: 26 November 2020
(This article belongs to the Special Issue Energy Policy and Policy Implications 2020)

Abstract

:
The need to achieve energy consumption and greenhouse gas emission decreases within the building sector requires the implementation of a supportive legal framework. To fulfil this requirement, a building certification system must be developed that is easily understandable for end users. In Poland, assessments of the energy performance of buildings are based on primary energy indicator verification. However, this parameter is difficult to understand for building owners or for tenants. Therefore, in this study, energy efficiency class limits and a heating indicator for energy needs indicator have been estimated for multi-family buildings in Poland. To achieve this purpose, a reference building was used and 180 calculation variants were developed, which considered the following variables: 3 types of climate data, 4 values of building shape ratios, 3 types of ventilation, 3 thermal transmittance standards and 3 windows area ratios to the external wall. The results showed that the greatest influences on the need for energy used for heating were the type of ventilation used and the local climate. This study shows that the methodology used is adequate for energy efficiency class limits estimations involving multi-family buildings in Poland.

1. Introduction

1.1. Energy Policy

Energy consumption in EU buildings is equal to about 40% of total EU energy consumption, which in turn makes up 35% of greenhouse gas (GHG) emissions worldwide [1]. In the EU Commission’s recommendations on building renovations, it is stated that 27% of EU energy consumption is related to the residential sector [2]. The associated GHG emissions increase by up to 65% if the whole building industry sector is included in this assessment [3]. Due to the constant population growth that is occurring, new buildings are needed. Thus, an easily understandable legal framework for new and renovation construction is needed for end-users.
Even though energy efficiency policy initiatives have been adopted at the European Union level for more than 50 years [4], the first directive on building energy performance—the Energy Performance of Building Directive (EPBD) [5]—was introduced by the European Parliament in 2002. Together with improvements to the EPBD in 2010 [6] and EU Commission’s recommendation on guidelines for the promotion of nearly zero-energy buildings [7] a framework has been developed for regulations on the energy efficiency of buildings in EU member states (MS).
The EPBD requires the MS to:
  • establish minimum energy performance standards for new and existing buildings under major renovation in their national building regulations,
  • introduce a system of energy performance certificates (EPCs) for their buildings,
  • ensure that all new buildings built from 31 December 2020 onwards will be nearly zero energy buildings (n-ZEB).
Although the European Commission has left the member states free to define their own requirements, the general framework for determining the energy performance of European buildings is enshrined in the European Commission’s Directive. According to EPBD, the energy performance of a building must include at least two indicators: the first describes the energy performance and the second shows the quantitative primary energy usage rates. Also, relevant reference values such as current legal standards and benchmarks must be included in the EPC. The goal of such content is to enable consumers to compare and assess the energy performance of different buildings, and to encourage owners and tenants to improve their own buildings. Energy performance can be expressed using an energy efficiency class or a continuous scale rating system.
In most European Union countries, energy efficiency classes appear on the energy performance certificate; these classes can also appear on a continuous scale, although this occurs much less often. Alternatively, the division into classes also occurs using several indicators or when the energy class for one indicator and a continuous scale for another indicator are available simultaneously. Table 1 shows the different ways of expressing energy performance in selected EU countries.
The primary energy demand indicator is the most common indicator displayed on the certificate that presents the energy performance of a building. In some countries, other indicators are also used, such as delivered energy, energy needs for heating, or CO2 emissions. The use of energy labels requires determination of the class levels quantity, which can vary: the Czech Republic and France have 8 classes (from A to G), while Belgium has 18 classes (from A++ to G). The crucial aspect of using energy labels to be able to determine a reference value that can be used to generate energy efficiency class limits.

1.2. Energy Labeling

The first energy labels used for the comparison of hot-water boilers were introduced in 1992 through the Directive on Hot Water Boilers (HWBD) 92/42/EEC [11]. During the same year, the Directive 92/75/EEC on labeling and standard product information of household appliances came into force [12]. In 1996, the Directive 96/57/EC on energy efficiency requirements for household electric refrigerators was adopted [13], followed by the Directive 2000/55/EC related to fluorescent lighting [14] in 2000. These directives only dealt with specific products / equipment and a wider scope of provisions had to be specified afterwards. Therefore, in 2005, the Directive 2005/32/EC [15] entered into force. This directive established a framework involving requirements and energy labels for energy-using products in general.
The use of energy labels can have a positive result by decreasing the energy consumption through influencing customer decisions. A report published by Ecofys [16] and London Economics [17] has provided evidence that labels encourage consumers to choose more energy efficient products. The report also showed that consumers understand energy efficiency scales on labels and see similarities between an A+++ to D scale and an A to G scale. The study carried out by Newell and Siikamäki [18] covering Energy Star and EnergyGudie label also showed the impact of certification on encouraging consumer choices involving higher energy efficiency. Research done by Jeong and Kim [19] on examples of refrigerator and laptop purchases showed that users are likely to choose labeled appliances and are willing to pay more to buy appliances characterized by having a higher energy efficiency level. This research also showed that for households, energy efficiency labels are more useful than other environmental labels. A similar study was carried out by Stadelmann and Schubert [20], where the influence of an energy label’s presence on consumer choices involving household appliances like freezers, vacuum cleaners, and tumble dryers was analyzed. It was shown that the volume of purchased products is larger when any energy label is used and displayed on these products.
According to a study completed by Casals [21], a building that is characterized by any type of energy rating (either a certificate or a label) can stand out among other buildings and thus can increase its market value. A study completed by Amecke [22] in Germany showed that the majority of building purchasers knew about energy performance certificates and used them during their search process, but EPCs had a limited impact on their final purchasing decisions. Similar results were obtained by Murphy [23] based on a survey conducted in the Netherlands. While most respondents were aware of EPC information on building energy performance, few of them used this information when selecting a property.
In contrast to Amecke and Murphy’s aforementioned studies, the research done by Brounen and Kok [24] showed a relationship between the score on the label and property prices. They suggested that buyers would spend a higher amount on residential dwellings that are characterized by a higher energy efficient class on their labels. Similar results were obtained by Fuerst et al. [25] for residential buildings in England, where the transaction prices for dwellings that are rated A or B are 5% higher compared to dwellings that are rated D. For dwellings that are rated E and F, a negative relationship between the energy performance rating and the sale price has been found. Also, an analysis of the Dutch office market [26] showed that for a building with a lower energy class (meaning it is energy-inefficient or non-green), its rental costs are 6 percent lower in comparison to the offices with higher energy classes.

1.3. Research Goal and Scope

The aforementioned literature indicates that energy labels can have a positive result on consumer understandings of energy efficiency and on purchasing decision processes. The simple and most understandable way of displaying energy efficiency on a label is to use an energy efficiency class. Thus, the aim of this paper is to define energy efficiency class limits for a residential multifamily building in Poland.
To achieve this aim, a calculation of energy needs for heating 180 building variants was carried out. The following variables were included: 3 types of climate data (warm, mild, and cold), 4 values of the building shape ratio (0.32, 0.35, 0.44, and 0.47), 3 types of ventilation (exhaust, exhaust with night reduction, and mechanical ventilation with heat recovery), 3 thermal transmittance standards (for n-ZEB, 25% lower than n-ZEB, and 25% higher than n-ZEB) and 3 ratios of window areas to the external wall (base case, 20% higher than the base case, 20% lower than the base case). For this calculation, a monthly method from standard EN ISO 52016-1 [27] was used with national parameters like a internal heat gain capacity or ventilation rates. The obtained results were used to determine a reference value of the energy needed for the heating indicator and finally to propose a limit values of energy efficiency classes.
The methodology and research assumptions are provided in Section 2. In Section 3 the buildings database is described, and the results with proposed energy efficiency classes are presented in Section 4.

2. Materials and Methods

2.1. Reference Energy Standard for Energy Classes

The methodology for the energy class determination is described in the standard EN ISO 52003-1 Energy performance of buildings—Indicators, requirements, ratings, and certificates—Part 1: General aspects and application to the overall energy performance [28]. The standard describes the relationship between the energy performance indicators of buildings and the energy performance requirements and their assessment. It discusses the methods used to determine reference values for some energy performance indicators. The standard also includes a methodology for assessing the energy performance of a building and its components against reference values, as well as examples of presenting this assessment in the form of energy efficiency classes.
Two reference values could be used for this assessment:
  • Rr—representing the requirements for new or modernized buildings. It is the main benchmark used to evaluate the energy performance of a building;
  • Rs—representing the average state of the building stock as a benchmark. It corresponds to an average energy efficiency of around 50% of the national or regional building stock (the median value). This value can, for example, refer to the energy demand, the thermal transmittance of partitions, or the total efficiency of technical systems and be determined for different types of buildings.
The limits values of energy efficiency classes based on the Rr and Rs reference values are presented in Table 2.
The Rr value represents the lower limit of the B class and the Rs value represents the lower limit of the D class. As there is a lack of information regarding the Polish national building stock, the aim of this research was to estimate the Rr value of energy needed for a heating indicator using the calculation method.

2.2. Assumptions and Simplifications

This article focuses on the energy needed for heating, which is a function of the thermal quality of the building’s envelopes and the ventilation system. According to the energy efficiency directive (EED) [29] and the definition of n-ZEB from the EPBD [6], the energy needs should first be reduced, and then energy-efficient technical systems and renewable energy sources should be used. The reference value for a primary energy indicator is already set under Polish building regulations, but in many cases, it is useless for the end-user in terms of building an energy performance understanding. Therefore, the energy needs for heating was considered in this study as being complementary to existing regulation.
Currently the calculation methodology used for the EPC is based on the monthly method. Also, n-ZEB requirements in low Polish buildings were set using this method. Therefore, for the purpose of this research, a monthly method from standard EN ISO 52016-1 [27] was used to calculate the energy needs for heating. The internal heat gains or ventilation flow rates used as input parameters were taken from a national EPC methodology or national standards.
Many studies have indicated that building shape factors can influence building energy needs [30,31]. Therefore, the analysis was carried out for a group of four multi-family residential buildings with different building shape A/V ratios (where A is the sum of the areas of partitions surrounding the heated volume and V is the heated building volume).
The next variable used in the calculation was the thermal transmittance of the building partitions. In the basic variant for all of the analyzed buildings, the Polish n-ZEB thermal requirements were applied. Those values were defined for the year 2021 under building regulations using the cost optimal method in accordance with EPBD, and therefore it was justified to use them as a base case. The maximum thermal transmittance of external partitions set in Polish construction regulations and used in relevant calculations are provided in Table 3.
In the calculations, the variants with 25% lower and higher values of thermal transmittances compared to the average level were considered.
The total heat losses from a building are a sum of heat losses from transmission and from ventilation. The first one is a function of the external partition area and its thermal properties, while the second is a function of the ventilation air flow rate and the possible heat recovery unit in a ventilation system. In new buildings, the contribution of ventilation heat losses to total heat losses can be significant [33,34]. Thus, three types of ventilation systems have been used for the losses calculation: exhaust, exhaust with night reduction, and mechanical ventilation with heat recovery. The following types of ventilation systems were analyzed: mechanical exhaust ventilation, exhaust ventilation with night reduction (a reduction of the air flow at night by 10% in the hours 22:00–6:00), and ventilation with heat recovery (with a maximum heat recovery efficiency rate of 73%).
Also, the effect of the window area on a building envelope involving energy needs for heating was checked in this study. A bigger window increases heat losses through transmission but at the same time increases solar gains. Three window area values were assumed for each building variant: a base case, 20% higher than the base case, and 20% lower than the base case.
The influence of weather data was also included in the calculation. In Poland, due to the country’s size and location (longitude and latitude), as well as its topography, the country’s climatic conditions can differ a lot. The weather data for energy calculation, especially for energy performance certification calculation was taken from the Polish national database. Based on the analysis for 61 meteorological stations, 3 locations that characterize warm, mild, and cold climates were selected. Characteristic parameters of each chosen climate data point are shown in Figure 1.
It can be noticed that the highest total solar irradiation is for the warmest climate and the colder the climate is, the lower the intensity of total solar radiation for that climate. A similar relationship can be seen for the average yearly temperature. What is interesting is that although the minimal hourly temperature at its lowest level for the colder climate, the maximal hourly temperature is almost at the same level for all data sets. In order to show the possible influence of temperature on energy needs for heating, a value of degree days was calculated for each type of climate, and the results were: warm climate4011 K·day, mild climate3547 K·day, and cold climate4967 K·day.
Finally using described variables, a total number of 180 different calculation variants was utilized.

3. Description of the Building Database

Four multi-family residential buildings were defined for the purpose of the calculations. They represent the typical multi-family residential buildings in Poland. The main parameter that distinguishes these buildings from each other is the building shape A/V ratio. The characteristic parameters of these types of buildings are summarized in Table 4.
Buildings B1 and B2 are high-rise buildings with heights over 33 m, while B3 and B4 are low-rise buildings with heights not exceeding 13 m. The lengths of building B1 and B3 are 2 times greater than B2 and B4, while B1 and B3 have 3 times more staircases than B2 and B4. In Figure 2, the view of the energy model of the analyzed buildings (northern and eastern facades of these buildings) is presented. It was assumed that all of the buildings are characterized by high thermal mass levels.
The designed ventilation air flow was estimated in accordance with the Polish standards on the requirements of ventilation systems in buildings [35] and meet the minimum hygienic air flow in accordance with standard PN EN 12831 [36]. In the case of mechanical ventilation with heat recovery, the maximum heat recovery efficiency was assumed to be 73%. The airtightness of the buildings has been assumed in accordance with minimal requirements of Polish building regulations at a level of n50 = 1.5 l/h. The usage of a single building’s internal average specific heat gains were found to be equal to 7.1 W/m2 for residential spaces and 1.0 W/m2 for staircases, and was assumed to be in line with the national methodology for EPC calculations.

4. Results and Analysis

4.1. Estimation of the Energy Needed for Heating Indicator

The building defined in Section 3 with the variables defined in Section 2 were used to create 180 calculation variants. Table 5 and Figure 3 show the results of the energy need for heating of all of the analyzed variants. The symbols next to the variant names indicate the percentage change of the thermal transmittance (U) and window area (W).
The presented results show that energy needs depend on the ventilation system in a building, the climate, building shape ratio, thermal transmittance of partitions, and window area. The value of energy needs for heating indicator values differ significantly and maximum value is almost 6 times larger than the minimum one. The mean value calculated based on all results is equal to 65.91 kWh/(m2year), with a minimum value of 21.23 kWh/(m2year) and a maximum value of 117.37 kWh/(m2year). The lowest value was obtained for the B1 building with a 25% lower value of the envelope thermal transmittance, a warm climate, and a mechanical ventilation with heat recovery. The highest value was obtained for the B4 building with a 25% higher value of envelope thermal transmittance, a cold climate, and a mechanical exhaust ventilation.
In the Figure 3 it can be noticed that for the variants with mechanical ventilation involving heat recovery, the energy needs for the heating indicator do not exceed 60 kWh/(m2 year). The highest values were obtained for variants in a cold climate with a mechanical exhaust or a mechanical exhaust with night reduction ventilation. Thus, it could be concluded that both the climate and the type of ventilation system are dominant variables influencing the results of energy needs for heating.

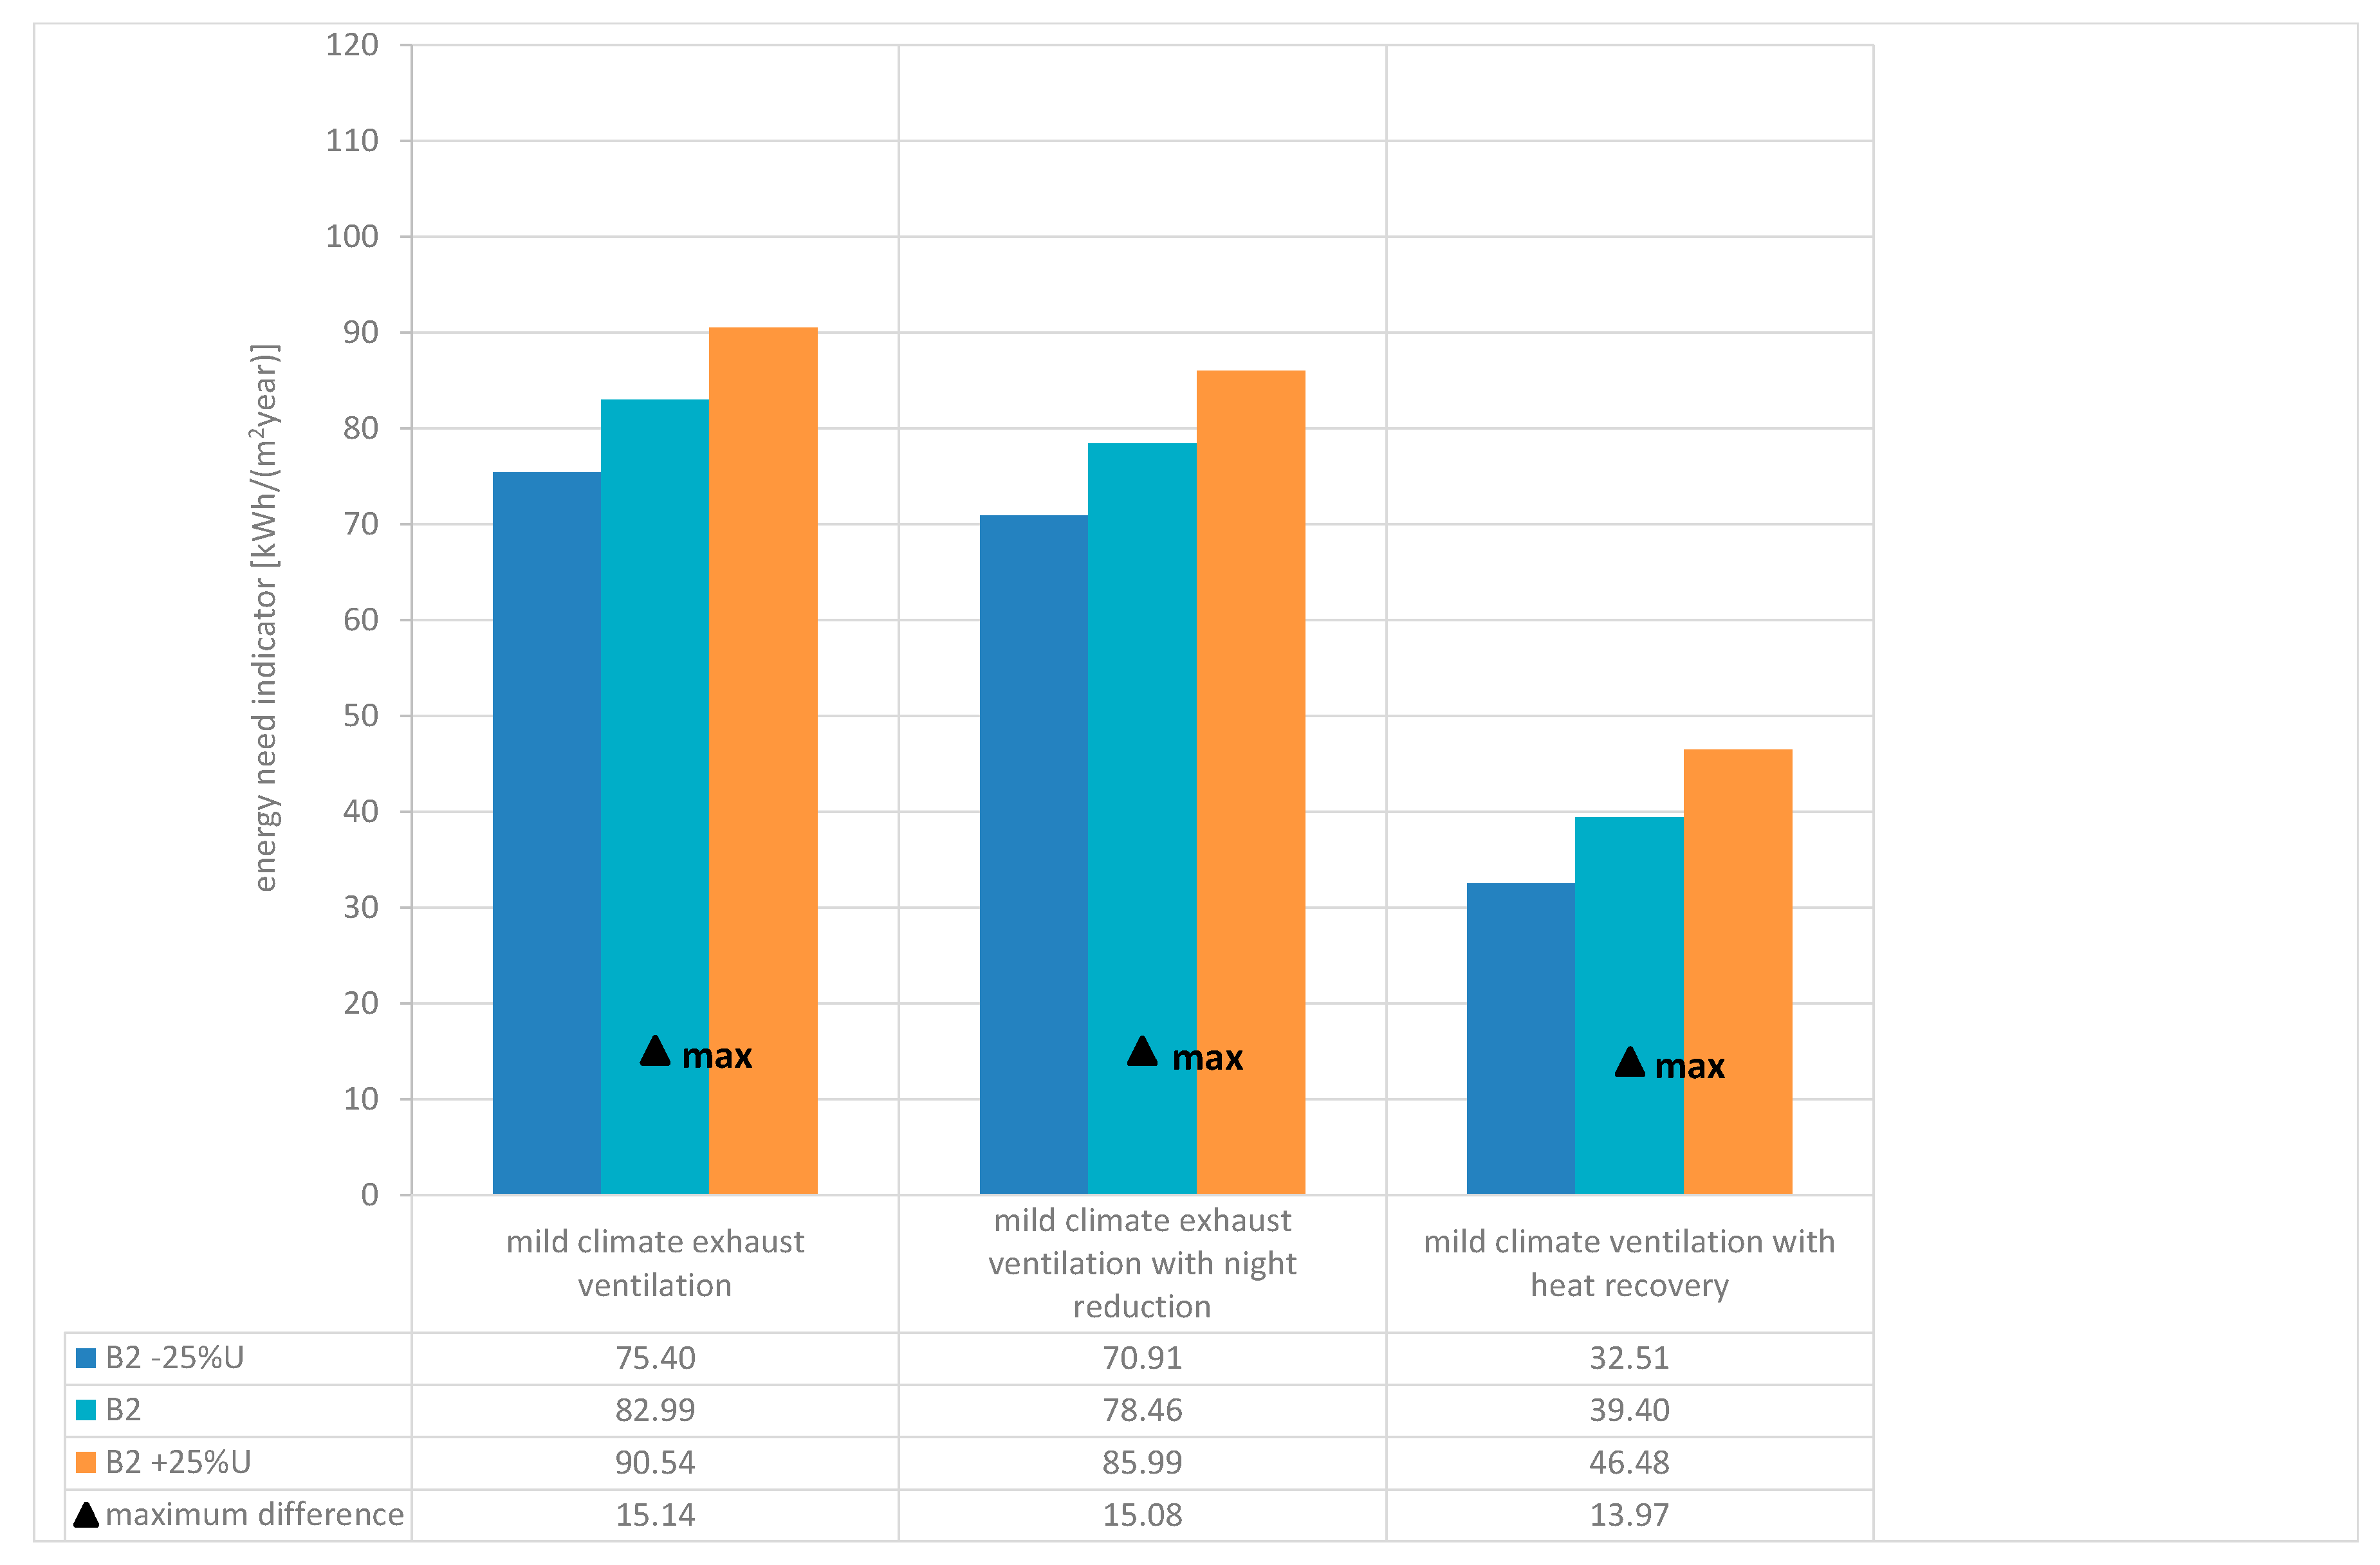
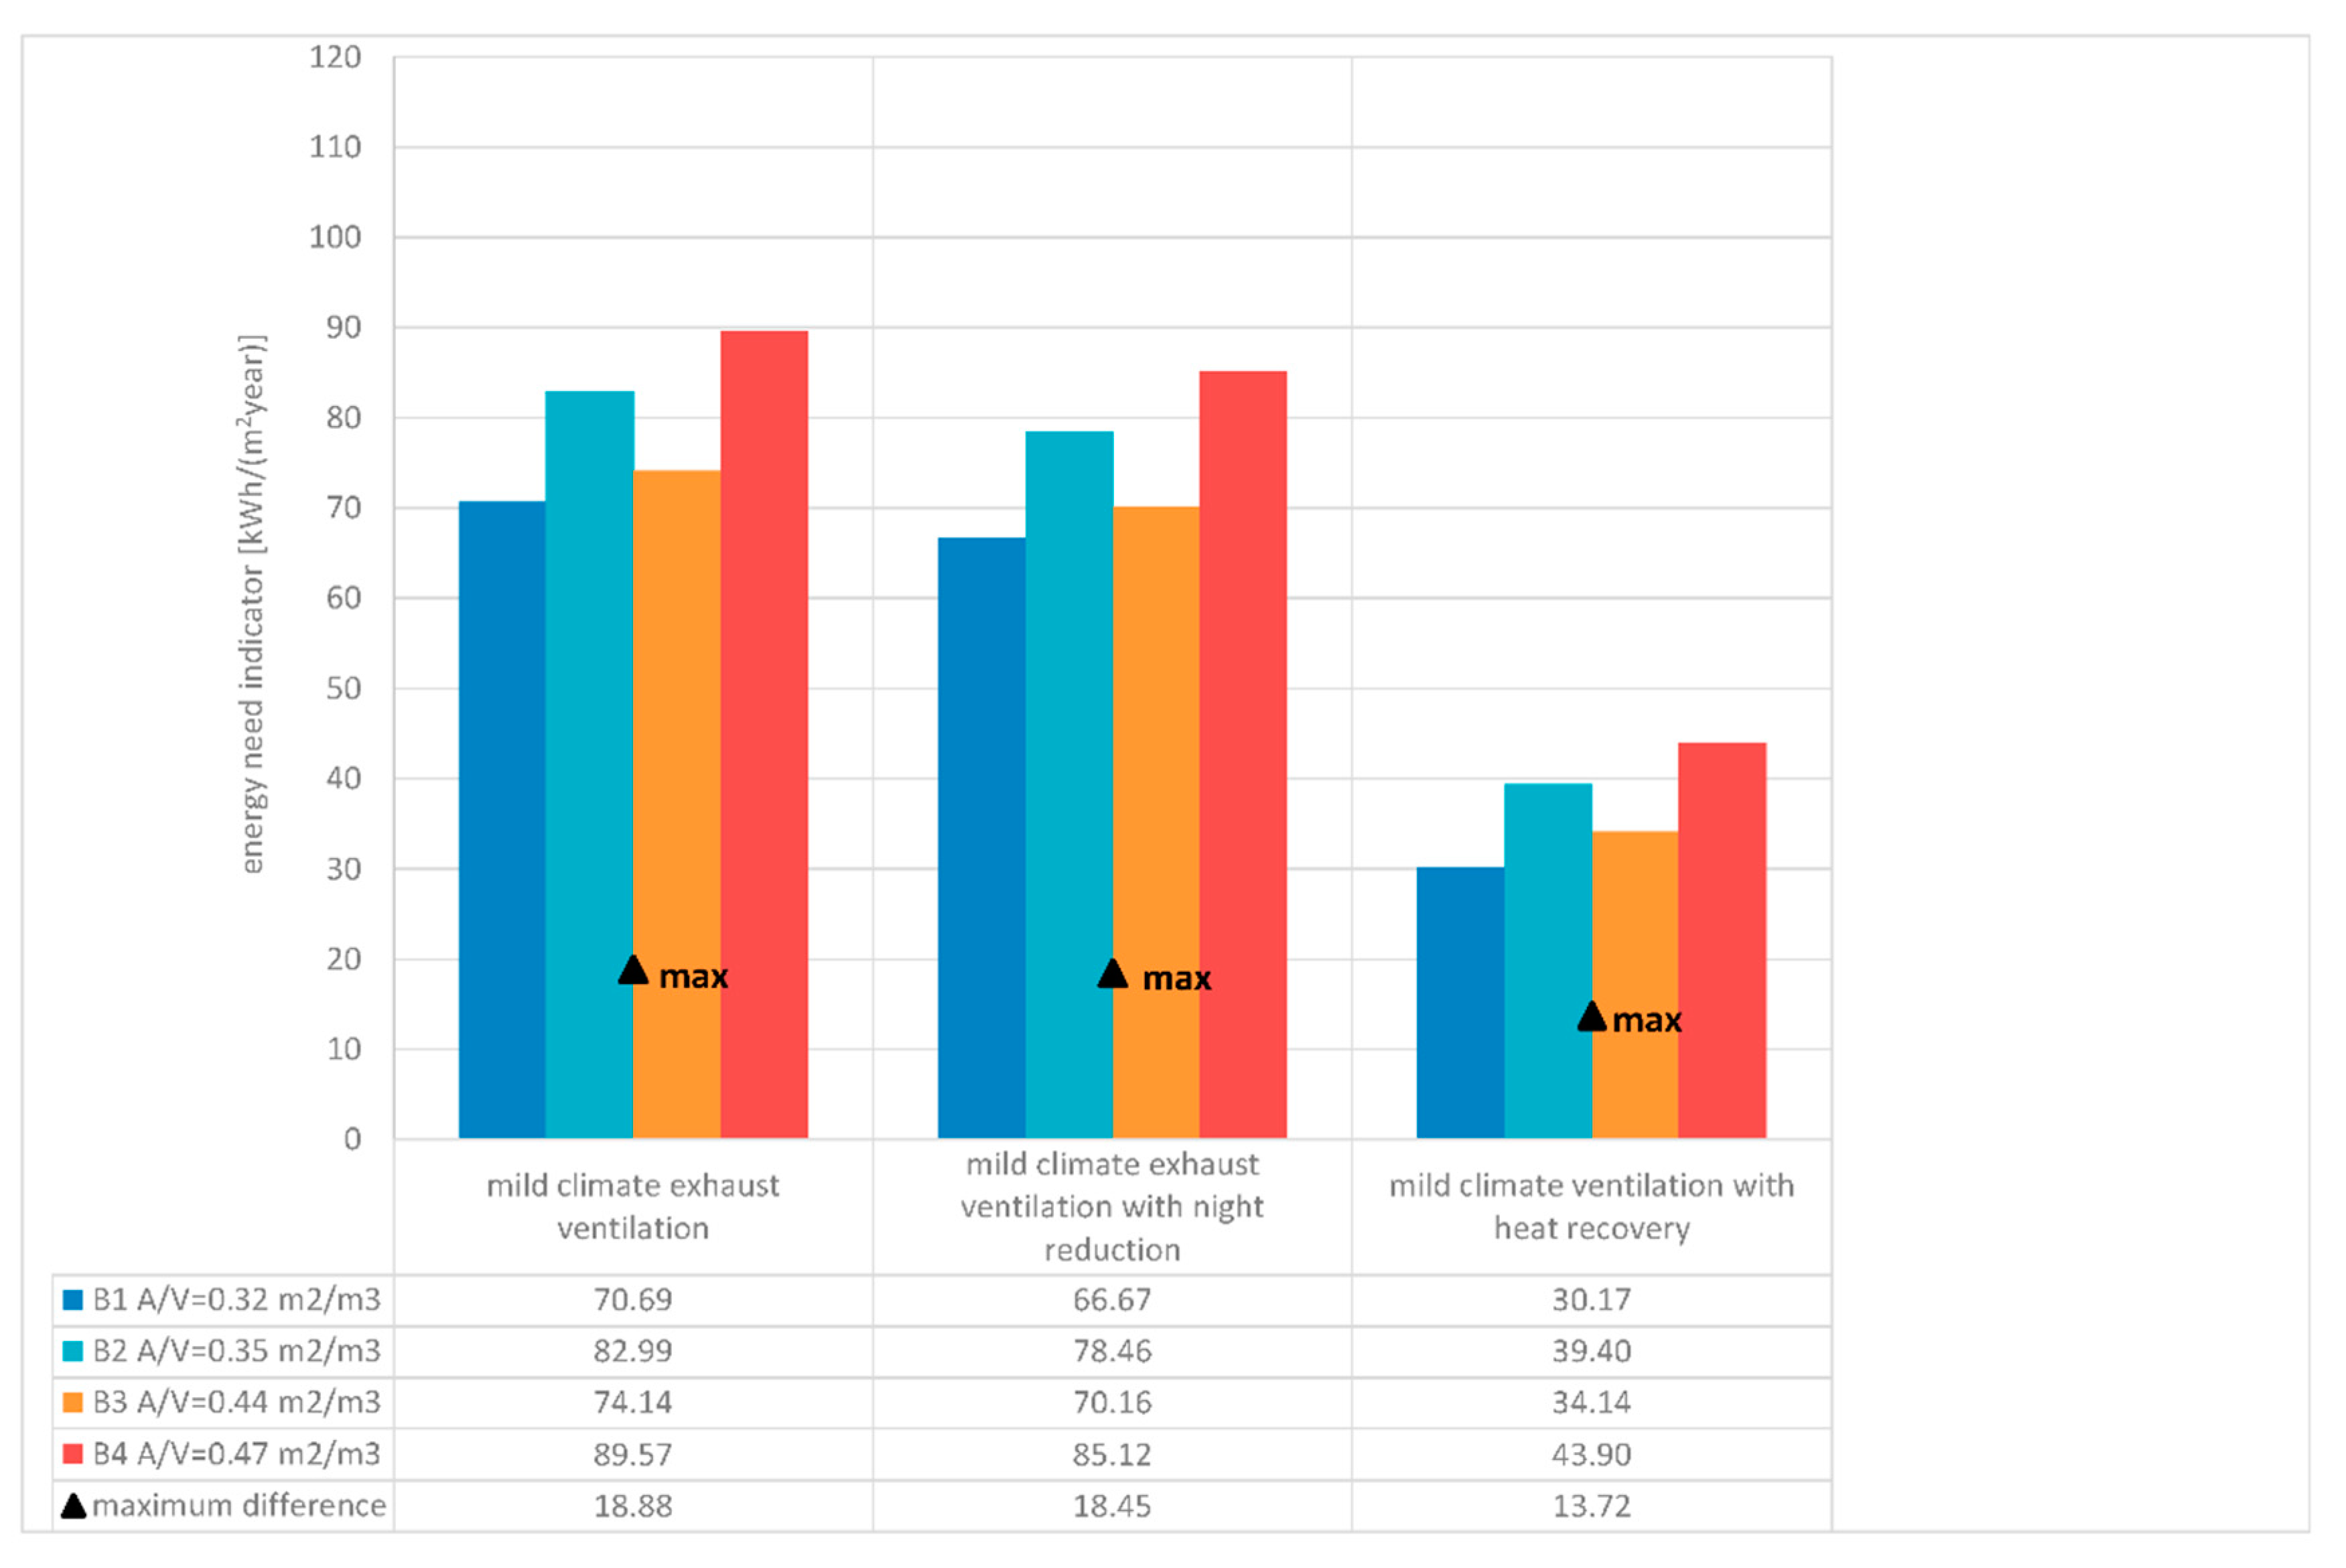
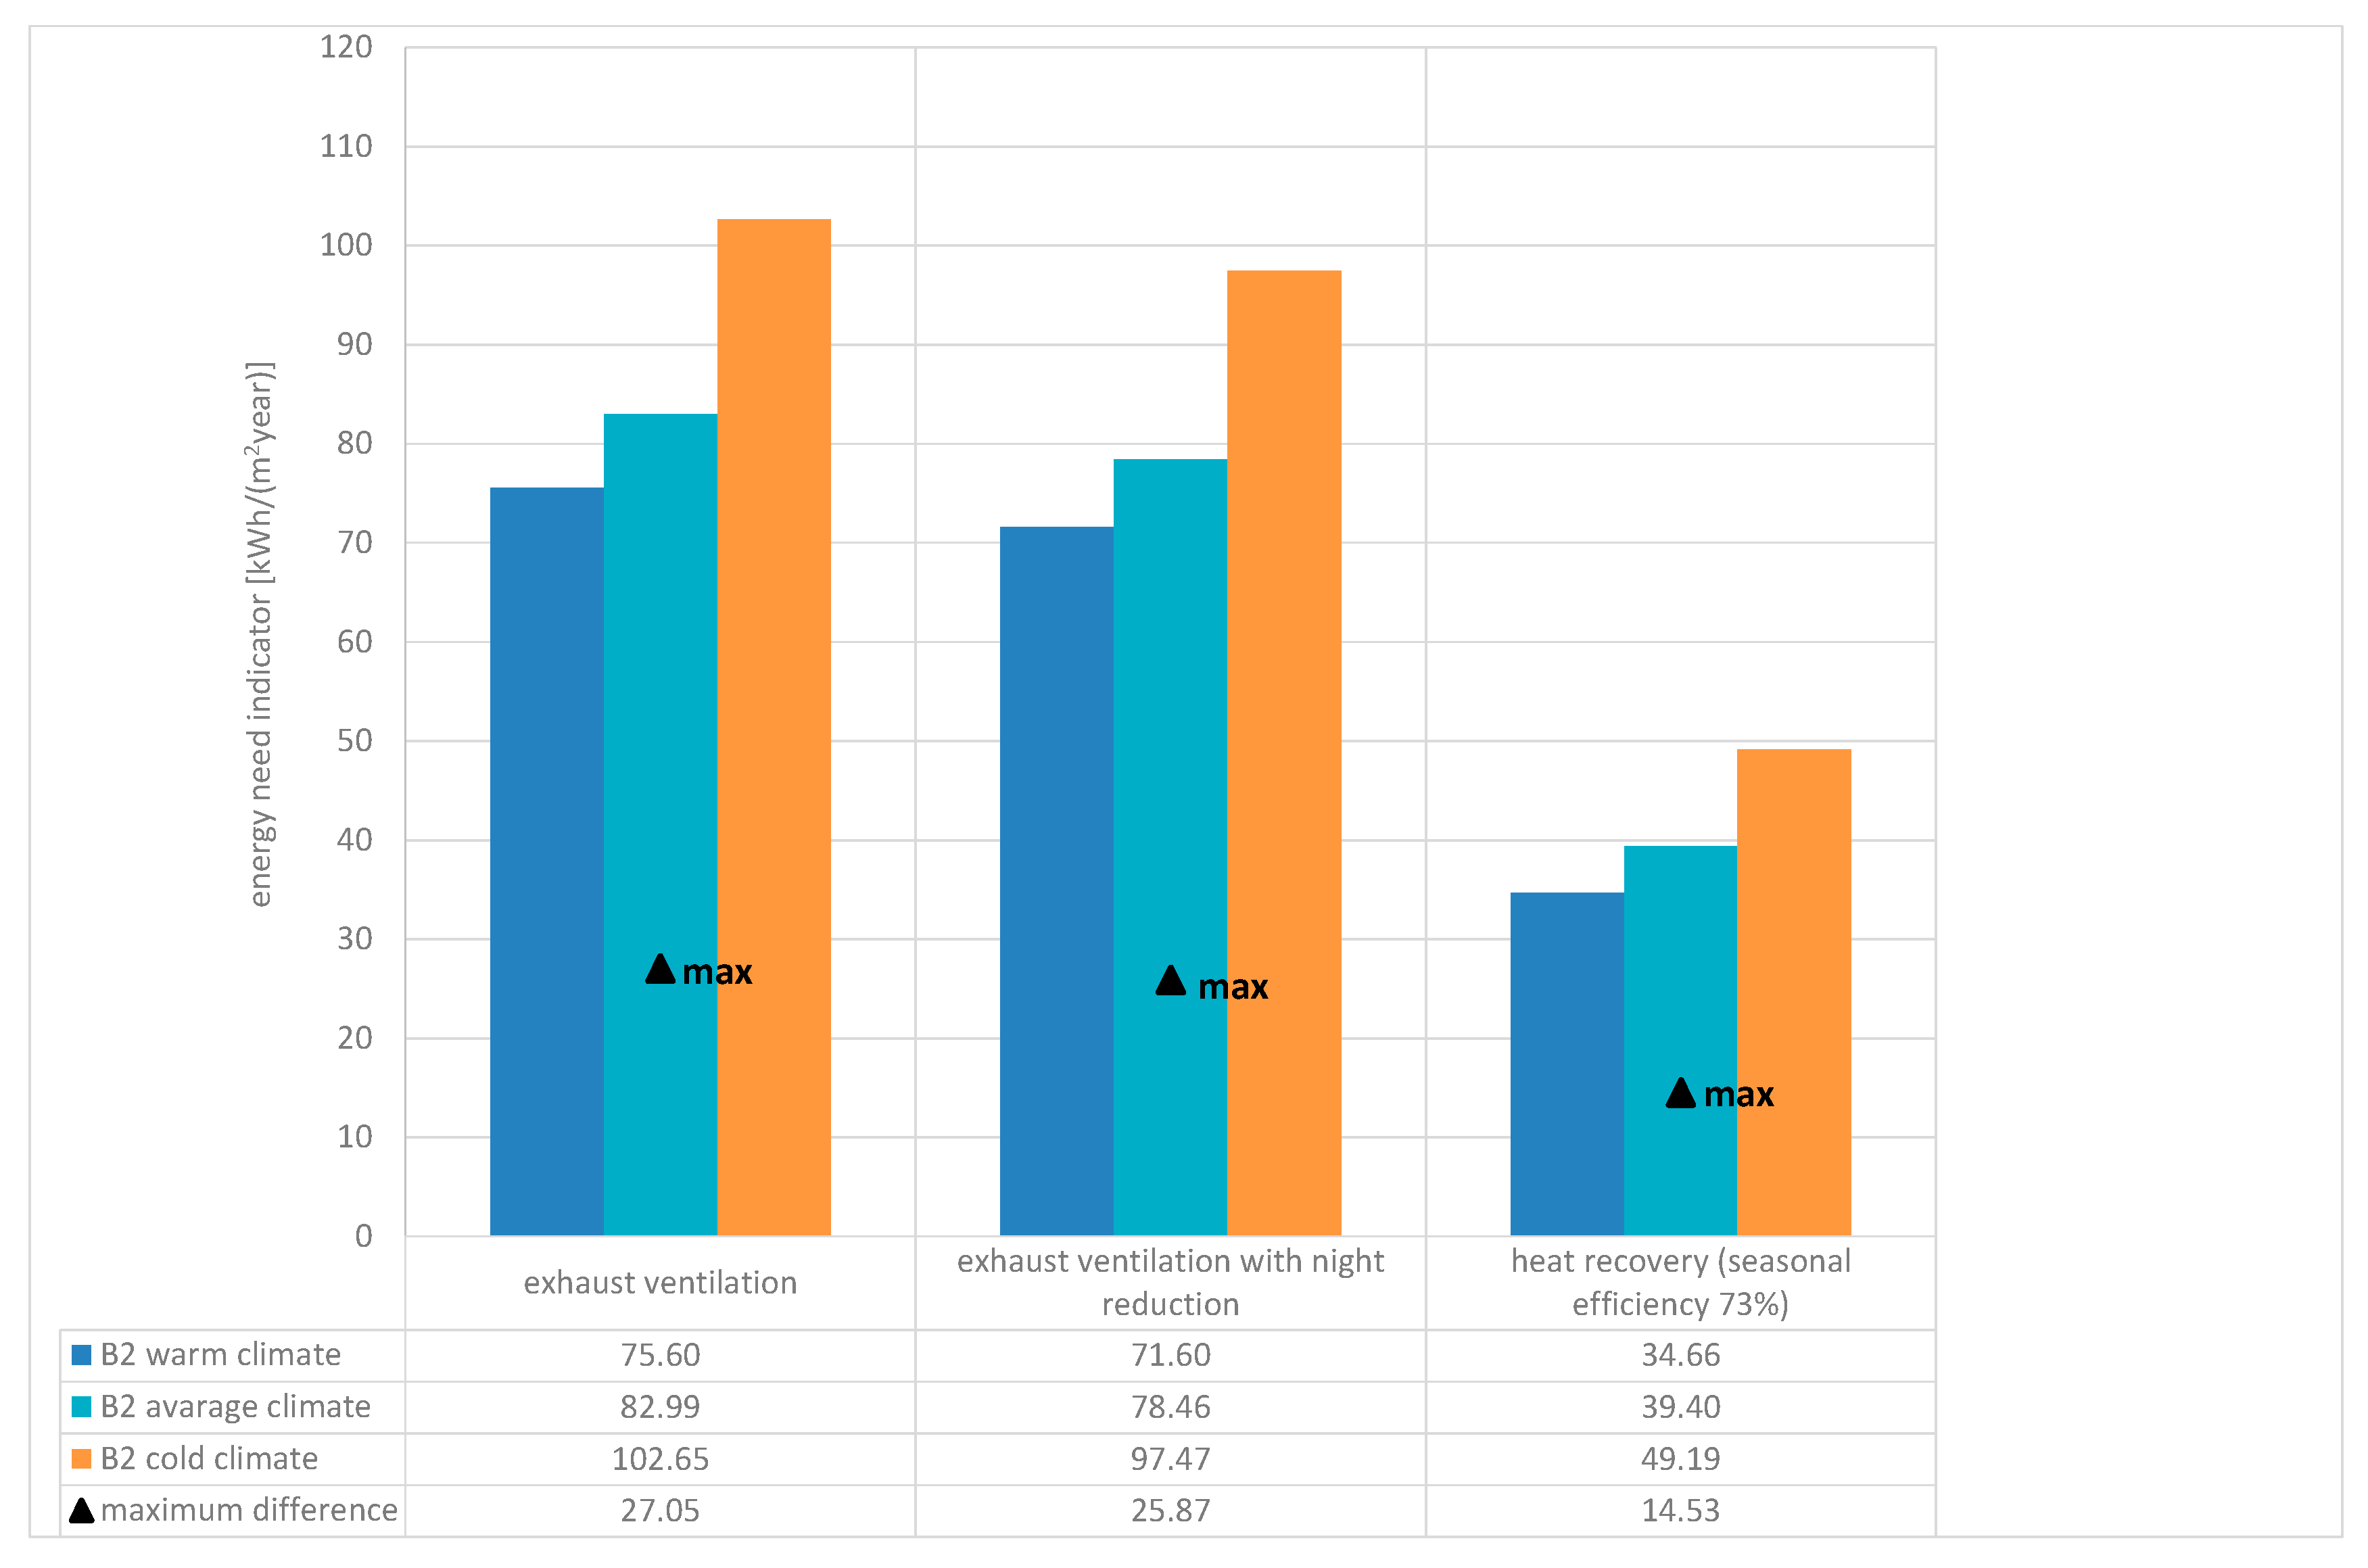
4.2. Influence of Variables on the Energy Needs Indicator

In the following section, the influence of adopted variables on the energy need for heating was analyzed. For most of the variables, the building B2 was chosen as being representative of the presentation of the results, as its usable area is close to the average value for all considered buildings. The influence of variables was presented as the maximum difference between the highest and lowest energy needed indicator for each calculation variant.
In Figure 4, the impact of building envelope thermal transmittance on the energy need for heating indicator is presented for a mild climate and different ventilation systems.
The influence of the building envelope thermal transmittance on the energy need for heating indicator in absolute values was found to be similar for all ventilation systems and was equal between 13.97 to 15.14 kWh/(m2year) but in relative values, the difference for exhaust and exhaust with night reduction ventilation system was equal to 17–21% and for ventilation with heat recovery, the difference was up to 43%.
Similar results but for a different ratio of the window area are presented in Figure 5.
It can be noticed that the window area hardly affects the energy needs for heating. The absolute and relative value for an exhaust and an exhaust with a night reduction ventilation system can be neglected and for ventilation with heat recovery, the absolute value was found to be equal to 1.77 kWh/(m2year), which provided around 4% of the relative value.
In Figure 6, the impact of the building shape ratio on the energy needs indicator for all buildings in a mild climate and with a different ventilation system is shown.
The influence of the building shape ratio on the energy need for heating indicator in absolute and relative values was similar for exhaust and exhaust with night reduction ventilation systems with maximal absolute values in the range of 18.45–18.88 kWh/(m2year) and relative values in the range of 21–28%. However, for the ventilation system with heat recovery, the maximum absolute value was lower, equal to 13.72 kWh/(m2 year), which resulted in a 45% relative value difference.
In Figure 7, the impact of climates on the energy need for heating indicator is presented.
The influence of climate on the energy need for heating indicator in absolute and relative values was found to be similar for exhaust and exhaust with night reduction ventilation systems with maximal absolute values in the range 25.87–27.05 kWh/(m2 year) and relative values in the range 26–36%. However, for the ventilation system with heat recovery, the maximum absolute value was lower, equal to 14.53 kWh/(m2 year), result in a 42% relative value difference.
In Figure 8, the impact of the type of ventilation system on the energy need for heating indicator is presented for all four buildings.
It can be noticed that the type of the ventilation system has a major influence on the amount of energy needed for heating. The absolute value of maximal difference was found to be 40.00 to 45.67 kWh/(m2year) and the relative values were 57%–117%. The highest absolute and relative values were obtained for mechanical ventilation with heat recovery, where the total energy need for heating is the lowest value.
Based on the conducted analysis on the influence of different variables on the energy need for heating indicator, it can be concluded that the parameter with the greatest impact is the type of ventilation system. The variable with the least influence on the calculation result is the area of the windows. This might be related to the fact that the energy balance of components such as the higher area of the windows leads to higher heat transmission losses, but at the same time also leads to higher solar heat gains.
The impact of the other parameters like the thermal transmittance of building partitions, climate type, and building shape ratios was found to be on a similar level.

4.3. Defining Energy Efficiency Class Limits

The obtained results of the energy need for heating calculation were used to develop limit values of energy efficiency classes. The mean value from all results of the energy need for heating indicator was used as the reference Rr value. Next on the basis of the scale shown in Table 2, the upper and lower limit of each class was calculated and presented in Table 6.
For clarity of the results, the limit values were rounded to a multiple of five, and thus the mean calculated value representing lower limit of B class was determined to be equal to 65 kWh/(m2year). It can be noticed that all of the calculated variants are included in the D class or a higher class. The highest number of variants could be classified to the C class 43% (78 variants), and almost 25% (44 variants) could be classified to the A class.
The estimated limit values of the energy need for heating indicator for energy efficiency classes can be implemented in the energy performance certificate system for residential buildings in Poland.

5. Discussion and Future Work

The goal of the certification scheme introduced by EPBD [5] was to increase the awareness on energy consumption in buildings. The building energy performance can be assessed by using different indictors relating to energy needs, energy usage, delivered energy, or primary energy. In this paper, a reference value of the indicator of the energy need for heating for residential multi-family buildings in Poland was calculated. The obtained value was later used for energy efficiency class limits estimations. The main aspect describing a nearly zero energy building (n-ZEB) as defined in reforms to the EPBD [6] is to have a very high energy performance. Thus, the energy needs indicator was used for this purpose. This study showed that many variables influence the amount of energy needed for heating: the climate, building shape ratio, quality of partition thermal properties, area of the windows, or type of a ventilation system, but the highest impact factors are the climate and the type of ventilation system.
The lower limit of the “A” energy efficiency class calculated on a basis of the estimated value of the reference energy need for heating indicator was found to be in line with the reference value for energy efficient buildings defined for the Polish National Fund of Environmental Protection and Water Management financial support program called “Efficient use of energy. Subsidies for loans for the construction of energy-efficient houses” [37]. According to this program, the maximum value of the energy needed for heating indicator for a low-energy building is equal to 40 kWh/(m2 year). However, in Austria such a value will be set in building technical regulations as a reference indicator from 1 January 2021 for new residential buildings [38]. This reference value in this case represents the lower limit of the B class, thereby indicating that the requirements in Austria are stricter than those proposed for Poland. The lower limit of the A class in Austria was set on 25 kWh/(m2year) and only 5 variants from the presented calculations fulfil this requirement.
The reference indicator of the energy needed for heating for passive houses is equal to 15 kWh/(m2 year) [39]. A similar value was set as a requirement for low-energy building in the “Efficient use of energy. Subsidies for loans for the construction of energy-efficient houses” program [37]. Therefore, it is possible to consider supplementing the energy classes specified in the article with an additional A + class representing buildings with even better thermal properties. Further work in estimating the limit values for such additional class could be done for Polish building stock.
It was shown by Lupato and Manzan [40] that there is noticeable difference in energy needs if outdated and recent weather data are used. The use of recent values results in lower energy needs for heating. This finding can be important in the context of the results presented in these research calculations. As the weather data used for calculation were determined on the basis of measurements from the period 1970–2000, the use of more recent data could decrease the value of the reference energy need for heating indicator calculated. This would affect the energy efficiency class limits. With the lower value of Rr, the class limits also would have lower values, which would consequently lead to more stringent requirements. Thus, future work in this area should include more recent weather data.
The presented research only considers residential multi-family buildings, while following the reform of the EPBD [6], other categories of buildings should be included for the purpose of the calculation: residential single-family buildings; offices; preschools, schools, and universities; health care buildings; hotels; sports facilities; commercial buildings and other types of energy-consuming buildings. Under current Polish building regulations [32], the requirements are set for 6 categories of a buildings. Therefore, a subsequent study on other building types should be carried out.

6. Conclusions

The main goal of this study was to define the energy efficiency class limits for multi-family residential buildings in Poland with the use of a reference value of the energy needs for heating indicator. Due to the lack of available data on existing building stock in Poland, the calculation method was chosen to determine the value of the reference indicator. Although only 4 buildings have been defined for the calculation, they represent the typical multi-family residential buildings in Poland. In order to diversify the crated building database, several variables were used: climate data, the building shape ratio, the type of ventilation system, thermal transmittance standard, and the windows area. As an outcome of this study, a proposition of energy efficiency classes for energy needs for heating was given.
The results show that average value of the reference energy need for heating indicator for all 180 calculation variants was equal to 65.91 kWh/(m2 year), however the value differed from 21.23 to 117.37 kWh/(m2 year). Such differences are related to the influence of the assumed variables. It has been shown that the choice of the ventilation system has the greatest impact. In contrast, changes to the window area have the least impact on the energy demand result. The influence of other parameters, such as thermal transmittance of building partitions, the type of climate, and building shape ratio, were found to be at a comparable level to each other.
The defined energy efficiency class limits corresponded to the currently used buildings standard, where the lower limit of the A class is in line with the low-energy buildings definition commonly used in Poland. The requirements of a passive house [39] are stricter than the A class limits, therefore an additional A+ class can be added in order to encourage faster transformation of buildings towards a better thermal standard.
The adoption of proposed energy efficiency classes for residential buildings in an energy performance certificate system will facilitate a fuller implementation of EPBD in Poland, especially in the context of end-users’ understandings of the EPC.

Author Contributions

J.R. and J.K. developed the concept; J.K. worked on the introduction; J.R. worked on the methodology; J.R. and J.K. carried out the calculations on the energy efficiency class proposition. All authors have read and agreed to the published version of the manuscript.

Funding

This paper was co-financed under the research grant of the Warsaw University of Technology supporting scientific activity in the discipline of Civil Engineering and Transport.

Conflicts of Interest

The authors declare no conflict of interest.

References

  1. BPIE. Renovation Strategies of Selected EU Countries; BPIE: Brussels, Belgium, 2014. [Google Scholar]
  2. The European Commission Recomendations on building renovation. Off. J. Eur. Union. 2019, 6, 34–79. Available online: https://eur-lex.europa.eu/legal-content/EN/TXT/?qid=1442476465850&uri=CELEX:32019H0786 (accessed on 23 September 2020).
  3. Janssens-Maenhout, G.; Crippa, M.; Guizzardi, D.; Muntean, M.; Schaaf, E.; Dentener, F.; Bergamaschi, P.; Pagliari, V.; Olivier, J.G.J.; Peters, J.A.H.W.; et al. Fossil CO2 & GHG Emissions of All World Countries; Publications Office of the European Union: Luxembourg, 2017. [Google Scholar]
  4. Economidou, M.; Todeschi, V.; Bertoldi, P.; D’Agostino, D.; Zangheri, P.; Castellazzi, L. Review of 50 years of EU energy efficiency policies for buildings. Energy Build. 2020, 225, 110322. [Google Scholar] [CrossRef]
  5. Directive 2002/91/EC. Directive 2002/91/EC Of The European Parliament And Of The Council 6 December 2002 on the Energy Performance of Buildings; OJ L 1, 4.1.2003; pp. 65–71. Available online: https://eur-lex.europa.eu/legal-content/EN/TXT/PDF/?uri=CELEX:32002L0091&from=EN (accessed on 23 September 2020).
  6. Directive 2010/31/EU. Directive 2010/31/EU of The European Parliament And Of The Council of 19 May 2010 on the Energy Performance of Buildings (Recast); OJ L 153, 18.6.2010; pp. 13–35. Available online: https://eur-lex.europa.eu/legal-content/EN/TXT/PDF/?uri=CELEX:32010L0031&from=EN (accessed on 23 September 2020).
  7. European Commission. Guidelines for Calculating Cost Optimal Levels for Buildings—Commision Recommendation (EU) 2016/1318; OJ L 208, 2.8.2016; European Commission: Brussels, Belgium, 2016; pp. 46–56. [Google Scholar]
  8. ADENE. 2016 Implementing the energy performance of Buildings Directive (EPBD). Lisbon. September 2015. Available online: https://www.buildup.eu/en/practices/publications/2016-implementing-epbd-featuring-country-reports-0 (accessed on 23 September 2020).
  9. Danish Energy Agency (DEA). 2018 Implementing the Energy Performance of Buildings Directive (EPBD) Country Reports; Copenhagen; August 2019; Available online: https://epbd-ca.eu/wp-content/uploads/2019/09/CA-EPBD-2018-BOOK-VOLUME-I.pdf (accessed on 23 September 2020).
  10. Gokarakonda, S.; Venjakob, M.; Thomas, S. D2.1 Report on Local EPC Situation and Cross-Country Comparison Matrix QualDeEPC H2020 Project; Wuppertal Institut: Wuppertal, Germany, 2020; Available online: https://qualdeepc.eu/wp-content/uploads/2020/04/QualDeEPC_D2.1_Final_V2.pdf (accessed on 23 September 2020).
  11. Directive 92/42/EEC. Efficiency requirements for new hot-water boilers fired with liquid or gaseous fuels. OJ L 167, 22.6.1992. pp. 1–15. Available online: https://eur-lex.europa.eu/legal-content/EN/TXT/PDF/?uri=CELEX:31992L0042&from=EN (accessed on 23 September 2020).
  12. European Commission Council. Directive 92/75/EEC on the indication by labeling and standard product information of the consumption of energy and other resources by household appliances. OJ L 297, 13.10.1992. pp. 16–19. Available online: http://eur-lex.europa.eu/legal-content/EN/ALL/?uri=CELEX:31992L0075 (accessed on 23 September 2020).
  13. European Commission. Directive 96/57/EC on Energy Efficiency Requirements for Household Electric Refrigerators, Freezers and combinations thereof. OJ L 236, 18.9.1996. pp. 36–43. Available online: https://eur-lex.europa.eu/legal-content/EN/TXT/PDF/?uri=CELEX:31996L0057&from=EN (accessed on 23 September 2020).
  14. European Parliament; Council of the European Union. Directive 2000/55/EC Of The European Parliament And Of The Council of 18 September 2000 on energy efficiency requirements for ballasts for fluorescent lighting. Off. J. Eur. Union 2000, 2000, 33–38. [Google Scholar]
  15. European Council. Directive 2005/32/EC Of The European Parliament And Of The Council of 6 July 2005 establishing a framework for the setting of ecodesign requirements for energy-using products and amending Council Directive 92/42/EEC and Directives 96/57/EC and 2000/55/EC. Off. J. Eur. Union 2005, 191, 1–30. [Google Scholar]
  16. Technologies, P.; Dong, P.; Liu, S.; Ridge, O.; Babu, S.; Innovations, Q.; Olson, G.; Debroy, T. Final Technical Report Evaluation of the Energy Labeling Directive and specific aspects of the Ecodesign Directive ENER/C3/2012-523; Ecofys: Utrecht, The Netherlands, 2005; pp. 1–38. [Google Scholar]
  17. IPSOS; London Economics. Study on the Impact of the Energy Label and Potential Changes to It—On Consumer Understanding and on Purchase Decisions; London Economics: London, UK, 2014; pp. 1–141. [Google Scholar]
  18. Newell, R.G.; Siikammki, J. Nudging Energy Efficiency Behavior: Role of Information Labels. SSRN Electron. J. 2014, 1. [Google Scholar] [CrossRef]
  19. Jeong, G.; Kim, Y. The effects of energy efficiency and environmental labels on appliance choice in South Korea. Energy Effic. 2015, 8, 559–576. [Google Scholar] [CrossRef]
  20. Stadelmann, M.; Schubert, R. How Do Different Designs of Energy Labels Influence Purchases of Household Appliances? A Field Study in Switzerland. Ecol. Econ. 2018, 144, 112–123. [Google Scholar] [CrossRef]
  21. Casals, X.G. Analysis of building energy regulation and certification in Europe: Their role, limitations and differences. Energy Build. 2006, 38, 381–392. [Google Scholar] [CrossRef]
  22. Amecke, H. The impact of energy performance certificates: A survey of German home owners. Energy Policy 2012, 46, 4–14. [Google Scholar] [CrossRef]
  23. Murphy, L. The influence of the energy performance certificate: The Dutch case. Energy Policy 2014, 67, 664–672. [Google Scholar] [CrossRef]
  24. Brounen, D.; Kok, N. On the economics of energy labels in the housing market. J. Environ. Econ. Manag. 2011, 62, 166–179. [Google Scholar] [CrossRef] [Green Version]
  25. Fuerst, F.; McAllister, P.; Nanda, A.; Wyatt, P. Does energy efficiency matter to home-buyers? An investigation of EPC ratings and transaction prices in England. Energy Econ. 2015, 48, 145–156. [Google Scholar] [CrossRef] [Green Version]
  26. Kok, N.; Jennen, M. The impact of energy labels and accessibility on office rents. Energy Policy 2012, 46, 489–497. [Google Scholar] [CrossRef]
  27. ISO 52016-1 Energy Performance of Buildings—Energy Needs for hEating and Cooling, Internal Temperatures and Sensible and Latent Head Loads—Part 1: Calculation Procedures; ISO: Geneva, Switzerland, 2017.
  28. European Committee for Standardization. EN ISO 52003-1 EPB—Indicators, Requirements, Ratings and Certificates—Part 1: General Aspects and Application to the Overall Energy Performance; ISO: Geneva, Switzerland, 2017. [Google Scholar]
  29. Directive 2012/27/EU of the European Parliament and of the Council of 25 October 2012 on energy efficiency, amending Directives 2009/125/EC and 2010/30/EU and repealing Directives 2004/8/EC and 2006/32/EC. OJ L 315, 14.11.2012. pp. 1–56. Available online: https://eur-lex.europa.eu/legal-content/EN/TXT/PDF/?uri=CELEX:32012L0027&from=EN (accessed on 23 September 2020).
  30. McKeen, P.; Fung, A.S. The effect of building aspect ratio on energy efficiency: A case study for multi-unit residential buildings in Canada. Buildings 2014, 4, 336–354. [Google Scholar] [CrossRef]
  31. Janakieska, M.M.; Zbašnik-senegačnik, M.; Gramatikov, K.; Kuzman, M.K. Marija Miloshevska Janakieska, Martina Zbašnik-Senegačnik, Kiril Gramatikov, Manja Kitek Kuzman: Arhitektovo dojemanje steklene fasade in bivalnega ugodja v poslovnih stavbah v Makedoniji ARCHITECT’S PERCEPTION OF GLASS FACADE AND LIVING COMFORT IN. IGRA Ustvarjalnosti 2018. [Google Scholar] [CrossRef]
  32. Minister of Investment and Development. Regulation on technical conditions to be met by buildings and their location of the Minister of Infrastructure of April 12, 2002. Poland; 2002. Available online: https://isap.sejm.gov.pl/isap.nsf/download.xsp/WDU20190001065/O/D20191065.pdf (accessed on 23 September 2020).
  33. La Fleur, L.; Moshfegh, B.; Rohdin, P. Measured and predicted energy use and indoor climate before and after a major renovation of an apartment building in Sweden. Energy Build. 2017, 146, 98–110. [Google Scholar] [CrossRef] [Green Version]
  34. Witkowska, A.; Krawczyk, D.A.; Rodero, A. Investment Costs of Heating in Poland and Spain—A Case Study. Proceedings 2019, 16, 40. [Google Scholar] [CrossRef] [Green Version]
  35. PN-B-03430:1983/Az3:2000 Ventilation in Residential, Common Living and Public Buildings-Requirements. Polish Normalization Committee. 2000. Available online: https://sklep.pkn.pl/pn-b-03430-1983-az3-2000p.html (accessed on 23 September 2020).
  36. EN 12831-3:2017 Energy performance of buildings—Method for calculating the design heat load. European Committee for Standardization. 2017. Available online: https://sklep.pkn.pl/pn-en-12831-3-2017-08e.html (accessed on 23 September 2020).
  37. National Fund for Environmental Protection and Water Management. Efficient Use of Energy. Subsidies for Loans for the Construction of Energy-Efficient Houses. Warsaw, Poland; 2015. Available online: http://nfosigw.gov.pl/oferta-finansowania/srodki-krajowe/programy-priorytetowe/doplaty-do--kredytow-na-domy-energooszczedne/informacje-o-programie/ (accessed on 23 September 2020).
  38. OIB-Austrian Institute of of Construction Engineering. OIB-Richtlinie 6 Energieeinsparung und Wärmeschutz; Österreichisches Institut für Bautechnik: Vienna, Austia, 2019. [Google Scholar]
  39. PHI. Criteria for the Passive House, EnerPHit and PHI Low Energy Building Standard; PHI: Darmstadt, Germany, 2016; pp. 1–27. Available online: https://passiv.de/downloads/03_building_criteria_en.pdf (accessed on 23 September 2020).
  40. Lupato, G.; Manzan, M. Italian TRYs: New weather data impact on building energy simulations. Energy Build. 2019, 185, 287–303. [Google Scholar] [CrossRef]
Figure 1. Characteristic parameters of the climate (ITH is the sum of total irradiation on a horizontal surface).
Energies 13 06234 g001
Figure 2. Buildings model visualization.
Energies 13 06234 g002aEnergies 13 06234 g002b
Figure 3. Energy needed for heating indicator for all analyzed variants.
Energies 13 06234 g003
Figure 4. The impact of the building envelope thermal transmittance on the energy need indicator.
Energies 13 06234 g004
Figure 5. The impact of the window area on the energy need indicator for building B2.
Energies 13 06234 g005
Figure 6. The impact of the building shape factor on the energy need indicator.
Energies 13 06234 g006
Figure 7. The impact of climate on the energy need indicator for building B2.
Energies 13 06234 g007
Figure 8. The impact of the type of ventilation system on the energy need indicator.
Energies 13 06234 g008
Table 1. Methods for presenting energy performance characteristics in selected EU countries [8,9,10].
CountryEnergy Performance Presentation Methods
AustriaClasses from A++ to G
(energy needs for heating, primary energy, CO2 emissions, an energy efficiency ratio)
Belgium (Flanders)Continuous scale
(primary energy)
Belgium (Wallonia, Brussels-Capital Region)Classes from A++ to G
(primary energy)
CroatiaClasses from A+ to G
(residential buildings - energy needs for heating; non-residential buildings - the ratio of energy needs for heating an assessed building to the reference value)
Czech RepublicClasses from A+ to G
(delivered energy, non-renewable primary energy)
DenmarkClasses from A to G
(primary energy)
FranceClasses from A to G
(primary energy, greenhouse gas emissions)
GermanyContinuous scale
(primary energy)
IrelandClasses from A+ to G
(primary energy)
Continuous scale
(CO2 emissions)
ItalyClasses from A+ to G
(primary energy)
Continuous scale
(primary energy for heating, cooling, and domestic hot water preparation)
MaltaContinuous scale
(delivered energy, CO2 emissions)
NorwayClasses from A to G
(delivered energy)
PolandContinuous scale
(primary energy)
RomaniaClasses from A to G
(delivered energy)
SlovakiaClasses from A0 to G
(primary energy, delivered energy)
Continuous scale
(CO2 emissions)
SloveniaClasses from A1 to G
(energy needs for heating)
Continuous scale
(primary energy, delivered energy, CO2 emissions)
Table 2. The limits value of energy efficiency classes [28].
Energy Efficiency ClassLimit Based on the RrLimit Based on the Rs
A<0.71 ∙ Rr<0.35 ∙ Rs
B<1.00 ∙ Rr<0.50 ∙ Rs
C<1.41 ∙ Rr<0.71 ∙ Rs
D<2.00 ∙ Rr<1.00 ∙ Rs
E<2.83 ∙ Rr<1.41 ∙ Rs
F<4.00 ∙ Rr<2.00 ∙ Rs
G≥4.00 ∙ Rr≥2.00 ∙ Rs
Table 3. Polish technical requirements involving thermal transmittance for multi-family buildings from 31 December 2020 [32].
Building PartitionThermal Transmittance [W/(m2K)]
external walls0.20
roof0.15
ceiling above an unheated basement0.25
windows0.90
Table 4. General multi-family residential building information.
Building B1B2B3B4
Usable aream25286.72627.31956.1966.5
Volume with controlledtemperaturem313,713.76581.74996.92404.8
Building shape ratio A/V-0.320.350.440.47
Ratio of windows area-0.230.200.180.16
Area of external partitionsExternal wallsm23355.02005.81590.2942.9
Windowsm2990.0490.0360.0178.2
External doorsm27.62.07.62.0
Roofm2607.3304.0607.3304.0
Floorm2503.0267.0503.0267.0
Quantity of storiesabove-ground-111144
unheated basement-1111
Quantity of apartmentsusable area less than 50 m2-3322128
usable area from
50 m2 to 100 m2
-66332412
Quantity of residents-33017612064
Air flowm3/h13,860759050402760
Table 5. Energy needed for heating indicator.
VariantExhaust VentilationExhaust Ventilation with Night ReductionVentilation with Heat Recovery
Warm ClimateMild ClimateCold ClimateWarm ClimateMild ClimateCold ClimateWarm ClimateMild ClimateCold Climate
B1 −25%U56.2563.7879.9552.7059.8275.3621.2323.8235.69
B2 −25%U68.9075.4093.8264.9570.9188.7028.6732.5141.14
B3 −25%U58.8066.6183.3955.2662.6778.8323.8727.3639.13
B4 -−25%U72.0281.4497.5868.0677.0292.4431.6836.1445.21
B1 −20%W62.2970.5187.1858.6466.4582.4925.6929.4341.63
B2 −20%W75.3082.95101.7271.2578.3896.4933.8938.5447.73
B3 −20%W48.7655.1168.1046.0552.1164.6321.7324.9134.17
B4 −20%W79.3489.27106.6775.2784.78101.4137.7543.1252.92
B162.4270.6988.0758.8266.6783.4326.4230.1743.16
B275.6082.99102.6571.6078.4697.4734.6639.4049.19
B365.5574.1492.2761.9670.1687.6629.7734.1447.32
B479.5389.57107.4275.5185.12102.2338.8543.9054.27
B1 +20%W62.6570.9989.0659.0967.0284.4627.1930.9844.74
B2 +20%W74.0682.97103.7072.0478.6298.5735.4740.3150.69
B3 +20%W65.7274.3993.1962.1770.4488.6230.4334.9048.80
B4 +20%W82.3989.01111.0578.3487.56105.8340.9146.2057.45
B1 +25%U68.7377.7396.3365.0873.6791.6531.9136.7350.87
B2 +25%U80.8390.54111.6476.7285.99106.4240.8546.4857.48
B3 +25%U72.4281.79101.2968.7977.7696.6335.9341.2055.73
B4 +25%U87.1495.73117.3783.0791.18112.1241.3647.2458.26
Table 6. EUH limit values for energy classes.
Energy Efficiency ClassLimit Values of the Energy Need for Heating Indicator EUH [kWh/m2 year]
A EUH45
B45< EUH65
C65< EUH95
D95< EUH130
E130< EUH185
F185< EUH265
G265< EUH
Publisher’s Note: MDPI stays neutral with regard to jurisdictional claims in published maps and institutional affiliations.

