Communication

Influence of Phenethyl Acetate and Naphthalene Addition before and after Pyrolysis on the Quantitative Analysis of Bio-Oil

1
Technology Center of China Tobacco Hubei Industry Limited-liability Company, Wuhan 430040, China
2
State Key Laboratory of Coal Combustion, School of Energy and Power Engineering, Huazhong University of Science and Technology, Wuhan 430074, China
*
Authors to whom correspondence should be addressed.
Energies 2020, 13(23), 6202; https://doi.org/10.3390/en13236202
Submission received: 9 October 2020 / Revised: 19 November 2020 / Accepted: 22 November 2020 / Published: 25 November 2020
(This article belongs to the Special Issue Thermal Analysis of Biomass Energy Production Process)

Abstract

:
The condensation-collection and quantitative analysis of bio-oil limit its component investigation and utilization. In order to find a convenient method for the analysis of bio-oil, the present study conducted an attempt for bio-oil quantitative analysis with the addition of internal standards before pyrolysis. Based on their good thermal stability, phenethyl acetate and naphthalene were selected as standards in the study and experiments were carried out to compare the effects of two added modes (adding into the biowaste before pyrolysis or adding into bio-oil after pyrolysis) on the bio-oil analysis. The results showed that both phenethyl acetate and naphthalene were mainly volatilized under testing conditions, which could be transferred into the oil with the volatile matters during biowaste pyrolysis. Through the co-pyrolysis experiments of the internal standards with lignin and cellulose, almost no interactions were found between the internal standards and such components. Furthermore, adding these standards before pyrolysis hardly affected the properties of noncondensable gas and biochar from the used biowaste samples (tobacco and sawdust waste). Compared with the bio-oil analysis results via traditional methods by adding standards into the bio-oil after pyrolysis, the results regarding the component distribution characteristics of the bio-oil were similar using the proposed method through the addition of standards before pyrolysis. Considering adequate mixing of the added standards (before pyrolysis) in the generated bio-oil, the proposed method could partly help to avoid inaccurate analysis of bio-oil components caused by incomplete collection of the pyrolytic volatiles.

1. Introduction

In recent years, pyrolysis has attracted widespread attention in the thermochemical conversion process, which could convert biowaste into polymorphic products such as biochar, bio-oil, and noncondensable gas [1]. Compared with biochar and noncondensable gas, the components of liquid products are quite complex and much more difficult to analyze, which greatly restrict the understanding of the pyrolysis process for better utilization of bio-oil [2,3,4].
A gas chromatography mass spectrometer (GCMS) is a commonly used piece of analytical equipment, which can be combined with the pyrolysis device to ensure online analysis of bio-oil composition such as pyrolysis-gas chromatography/mass spectrometry (py-GCMS) and thermogravimetry-gas chromatography/mass spectrometry (TG-GCMS) [5,6,7,8]. However, it is worth noting that bio-oil probably contains numerous components, as reported by Dinesh Mohan et al. that there are more than 5000 oligomers in the composition of bio-oil [9]. It is very difficult to study the production process of bio-oil due to complicated compounds and free radicals. Kim K H et al. condensed bio-oil produced from pyrolysis of cellulose, organosolv lignin, and corn stover, trying to quantify free radicals by EPR spectroscopy to investigate thermal behavior in condensed pyrolysis products [10]. Chen et al. adopted py-GC/MS to directly quantify biomass pyrolysis steam by screening internal standards according to the internal standards method (ISTD) [11]. In detail, biowaste pyrolysis is commonly conducted in laboratory or pilot platform reactors with cooling recovery devices for the collection and quantitative analysis of bio-oil. There is a big challenge for total collection of whole bio-oil compounds via the condensation and washing transfer process. In order to avoid missing components from the collection process, an online quantitative analysis method is necessary to achieve a more comprehensive understanding of the oil component characteristics under various thermal conditions.
On the other hand, the internal standard method was usually used in order to accurately analyze the content of each component in oil [12]. By adding quantitatively suitable internal standards into the oil for synchronous analysis, the contents of the oil compounds were calculated based on the ratios of their peak heights or peak areas (derived from GC-MS analysis) to those of the internal standards [13]. Accordingly, combining the abovementioned oil collection and analysis process, a strategy for convenient analysis of bio-oil was proposed that proper internal standard substances were selected and introduced into the biowaste samples before pyrolysis [14]. In this way, the internal standard substances might be uniformly mixed with the bio-oil derived from biowaste to enter the bio-oil collection and condensation devices, probably reducing the adverse effects of the condensation and collection process on oil quantitative analysis [15,16]. However, questions are raised that the added internal standard may be decomposed during the pyrolysis process, making it difficult for subsequent quantitative and qualitative analysis of bio-oil components.
In view of these points, the aim of this study was to carry out quantitative analysis of the full composition of bio-oil for better comprehension of the generation process of bio-oil by adopting the internal standards method (ISTD) before pyrolysis-analyzed production distribution. Two typical internal materials (namely, phenethyl acetate and naphthalene) were screened and used to explore the feasibility of adding these standards before pyrolysis for the optimized quantitative analysis of bio-oil. The experiments were firstly conducted to estimate the stability of the two screening standards under pyrolysis conditions through the thermogravimetric analyzer coupled with Fourier transform infrared spectrometer (TG-FTIR) analysis system. Furthermore, two biowaste samples (tobacco and sawdust waste) and typical biomass-components (lignin and cellulose) were used for pyrolysis with added internal standards and the generated bio-oil was analyzed based on the quantitative addition of the standards. Meanwhile, the traditional quantitative analysis of bio-oil from pyrolysis of the biowaste samples without adding standards was carried out, which was performed by adding standards into the collected bio-oil after pyrolysis. Comparing the bio-oil analyzed results through these two ways, the proposed method for bio-oil analysis via the addition of internal standards before pyrolysis was further estimated.

2. Materials and Methods

2.1. Materials

Phenethyl acetate (phe, Aladdin reagent, Shanghai, China) and naphthalene (nap, Aladdin reagent, Shanghai, China) were screened as the internal standards. Then cellulose (Cel, Aladdin reagent, Shanghai, China) and lignin (Lig, Aladdin reagent, Shanghai, China) were prepared for pyrolysis by mixing with the internal standards, and the average degree of polymerization (DP) of α-cellulose was around 10,000 with particle size distribution of 90 um. The selected tobacco waste (TW, Tobacco factory, Wuhan, China) and sawdust waste (SW, Timber mill, Wuhan, China) were crushed and sieved as subsequent experimental materials (with a particle size distribution of 0.125–0.25 mm). Dichloridemethane (analytical grade, Aladdin reagent, Shanghai, China) was used as solvent for bio-oil collection [17].

2.2. Experimental and Analysis Methods

TG-FTIR was used in analyzing the thermal stability of the internal standards and blends of the internal standards with biomass components (cellulose and lignin) under pyrolysis conditions. Specifically, the thermal analyzer (Netzsch Sta 449 F3) was used in heating the sample from room temperature to target temperature of 600 °C at a heating rate of 20 °C min−1 under nitrogen condition with a gas flow rate of 400 sccm. The thermal analyzer outlet was directly connected to the Fourier transform infrared spectrometer (Bruker Tensor 37) by the transmission line at 200 °C, of which the gas pool insulation temperature was maintained at 180 °C to avoid volatiles condensation. The scanning wavenumber was at 500–4000 cm−1 range by using a resolution of 1 cm−1.
Pyrolysis experiments were performed in a fixed bed quartz reactor heated by an electric tube furnace, as shown in Supplementary Materials Figure S1. For adding internal standards into the biowaste before pyrolysis, the selected biowaste samples (tobacco waste and sawdust waste) were thoroughly mixed with internal standards and placed in a quartz boat. The quartz boat was then pushed into the horizontal tube for pyrolysis under the atmosphere of nitrogen at the flow rate of 400 sccm from room temperature to the target temperature of 450 °C with a heating rate of 20 °C min−1. For the traditional method of adding internal standards into the bio-oil after pyrolysis, the biowaste samples were placed directly on the quartz boat for pyrolysis under the same pyrolysis conditions. Then, the internal standards were added to bio-oil quantitatively at the concentration of 10 ppm by micropipette, and the mixture was shaken well for detection. During the pyrolysis process, gaseous products were collected, and the chemical composition was determined via gas chromatography (Agilent 7890B). The liquid products were cooled in U-shaped tubes and washed by dichloromethane solvent for detection via GC-MS (Agilent 7890A/5975C). The identification of the surface functional groups of biochars was performed using Fourier Transform Infrared Spectrometer (Nicolet 6700) within a scanning range of 500–4000 cm−1 [8].

2.3. Data Evaluation

In order to further explore the effects of internal standards blending on thermal characteristics of cellulose or lignin, the following formula (Equation (1)) was used to calculate TG change of pure cellulose (or lignin) specifically by subtracting phenethyl acetate and naphthalene, respectively.
M n e w = M M x , 0 × w x 1 w x
Here, M n e w is the weight change of the new curve after calculation, M is the weight change of the blending of cellulose or lignin with internal standards before calculation, M x , 0 represents the weight change of pure phenethyl acetate or naphthalene, and w x represents the blending ratio of phenethyl acetate or naphthalene.
The calculation formula for the ratio of the peak area of each bio-oil component to that of the internal standard was shown as Equation (2).
P e a k   a r e a   r a t i o = A x A s c s
Here, A x is the peak area corresponding to the main quantitative component of bio-oil, A s is the peak area of the internal standards, and c s is the actual concentration of internal standard in bio-oil to be analyzed.

3. Results and Discussion

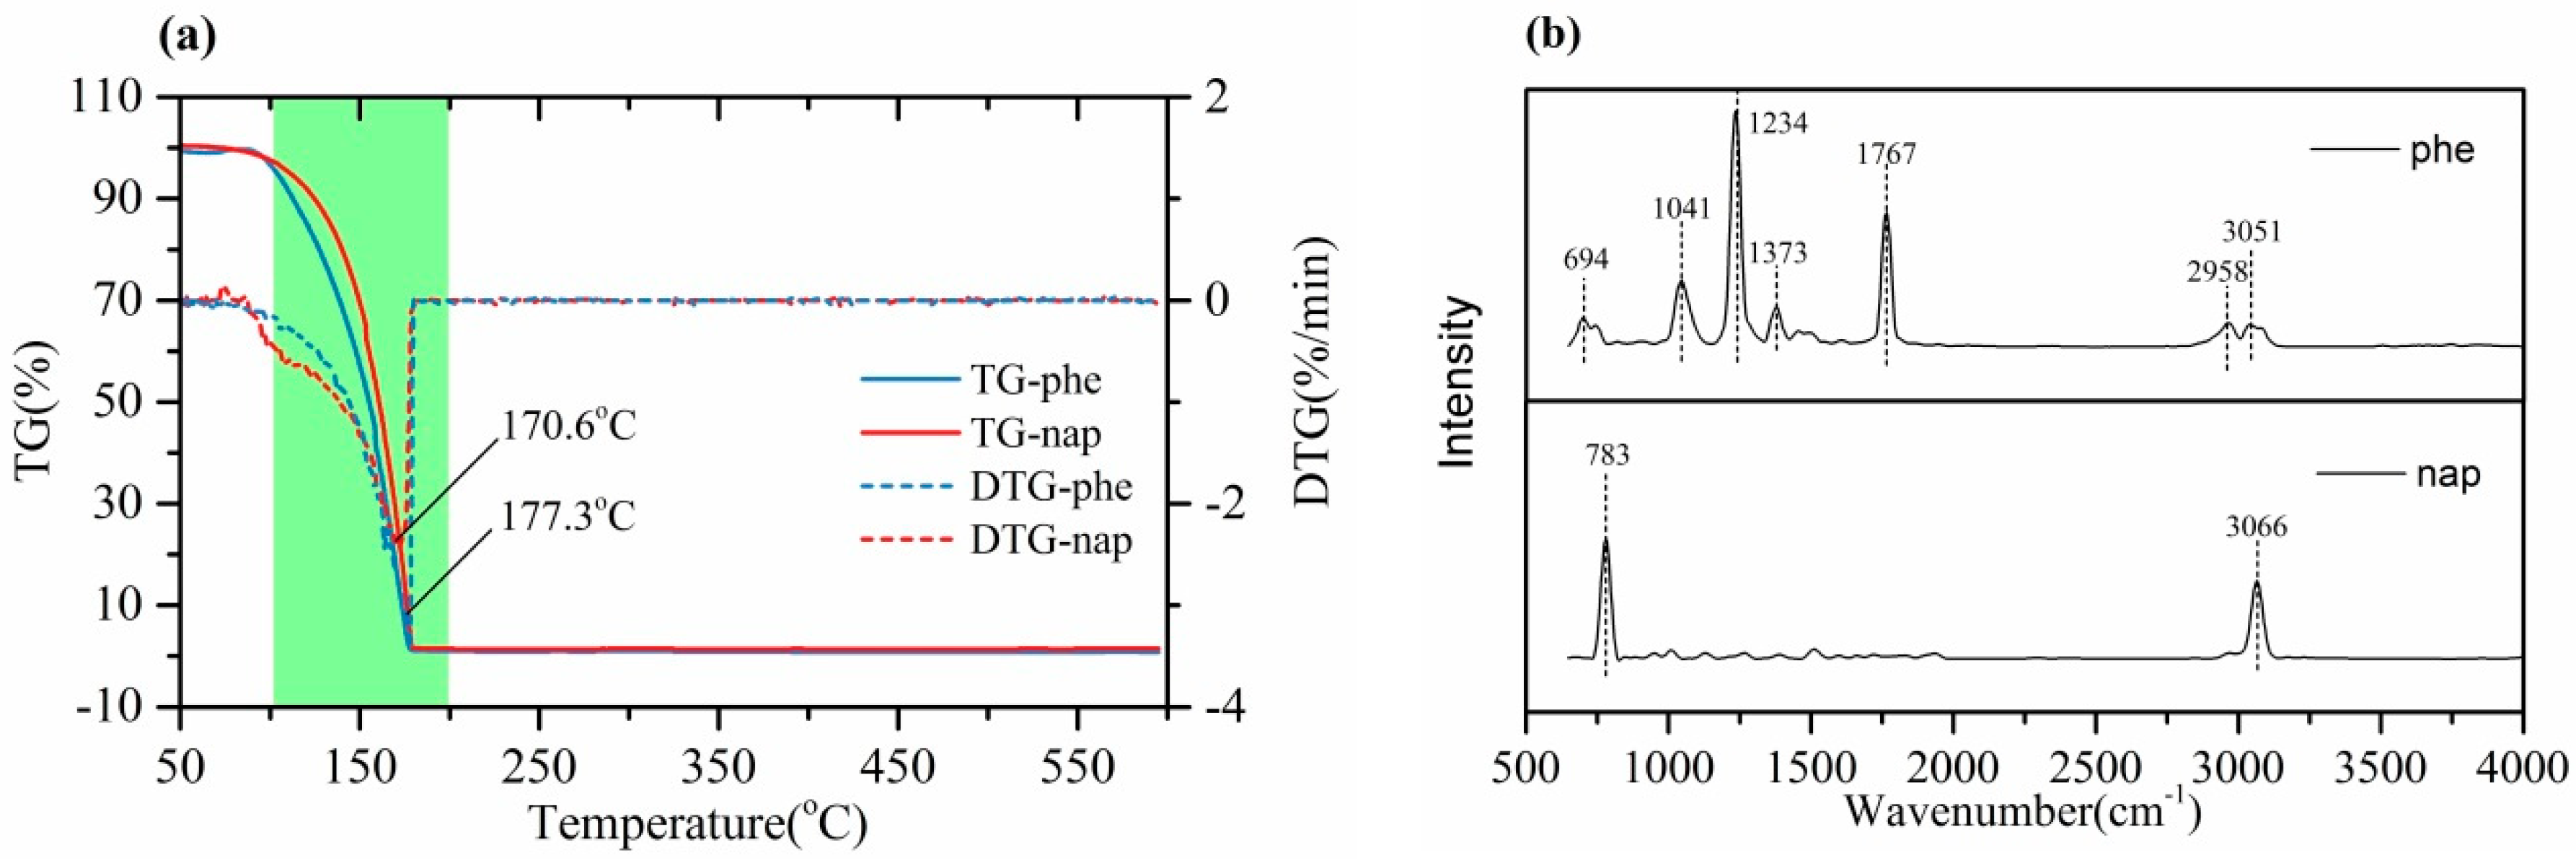
3.1. Thermal Stability Analysis of Internal Standards

The thermal stability of the internal standards (namely phenethyl acetate and naphthalene) was estimated by using TG-FTIR, and the TG and DTG curves were compared in Figure 1a. It could be found that the internal standards showed similar thermal stability. Almost all the tested samples were released in the heating process with the maximum weight loss temperature range between 100 °C and 200 °C. The peak temperature points of the weight loss rate of phenethyl acetate and naphthalene were 177.3 and 170.6 °C, respectively. Clearly, these temperatures were lower than the main decomposition temperature of the typical components (like cellulose, hemicellulose and lignin) of biowaste [18,19], which suggested that adding these standards into biowaste before pyrolysis might hardly affect the decomposition of biowaste in the slow pyrolysis.
Figure 1b shows the FTIR results of phenethyl acetate and naphthalene at the temperatures corresponding to the peak point for the fastest weight loss rate. For phenethyl acetate, the three infrared spectra peaks with the strongest signal in turn corresponded to the C-H in-plane bending vibration (wavenumber 1041 cm−1), ester C-O-C stretching vibration (wavenumber 1234 cm−1), and ester C=O stretching vibration (wavenumber 1767 cm−1) on the benzene ring, which was consistent with what was reported in the literature [20]. For naphthalene, two significant signal peaks which consisted of the in-plane bending vibration of C-H (wavenumber 783 cm−1) and C-H stretching vibration (wavenumber 3066 cm−1) were the same as reported functional groups’ according to research [21]. The results from TG-FTIR tests revealed that the internal standards exhibited good thermal stability, and were mainly released in the form of gaseous molecules during this weight loss process.

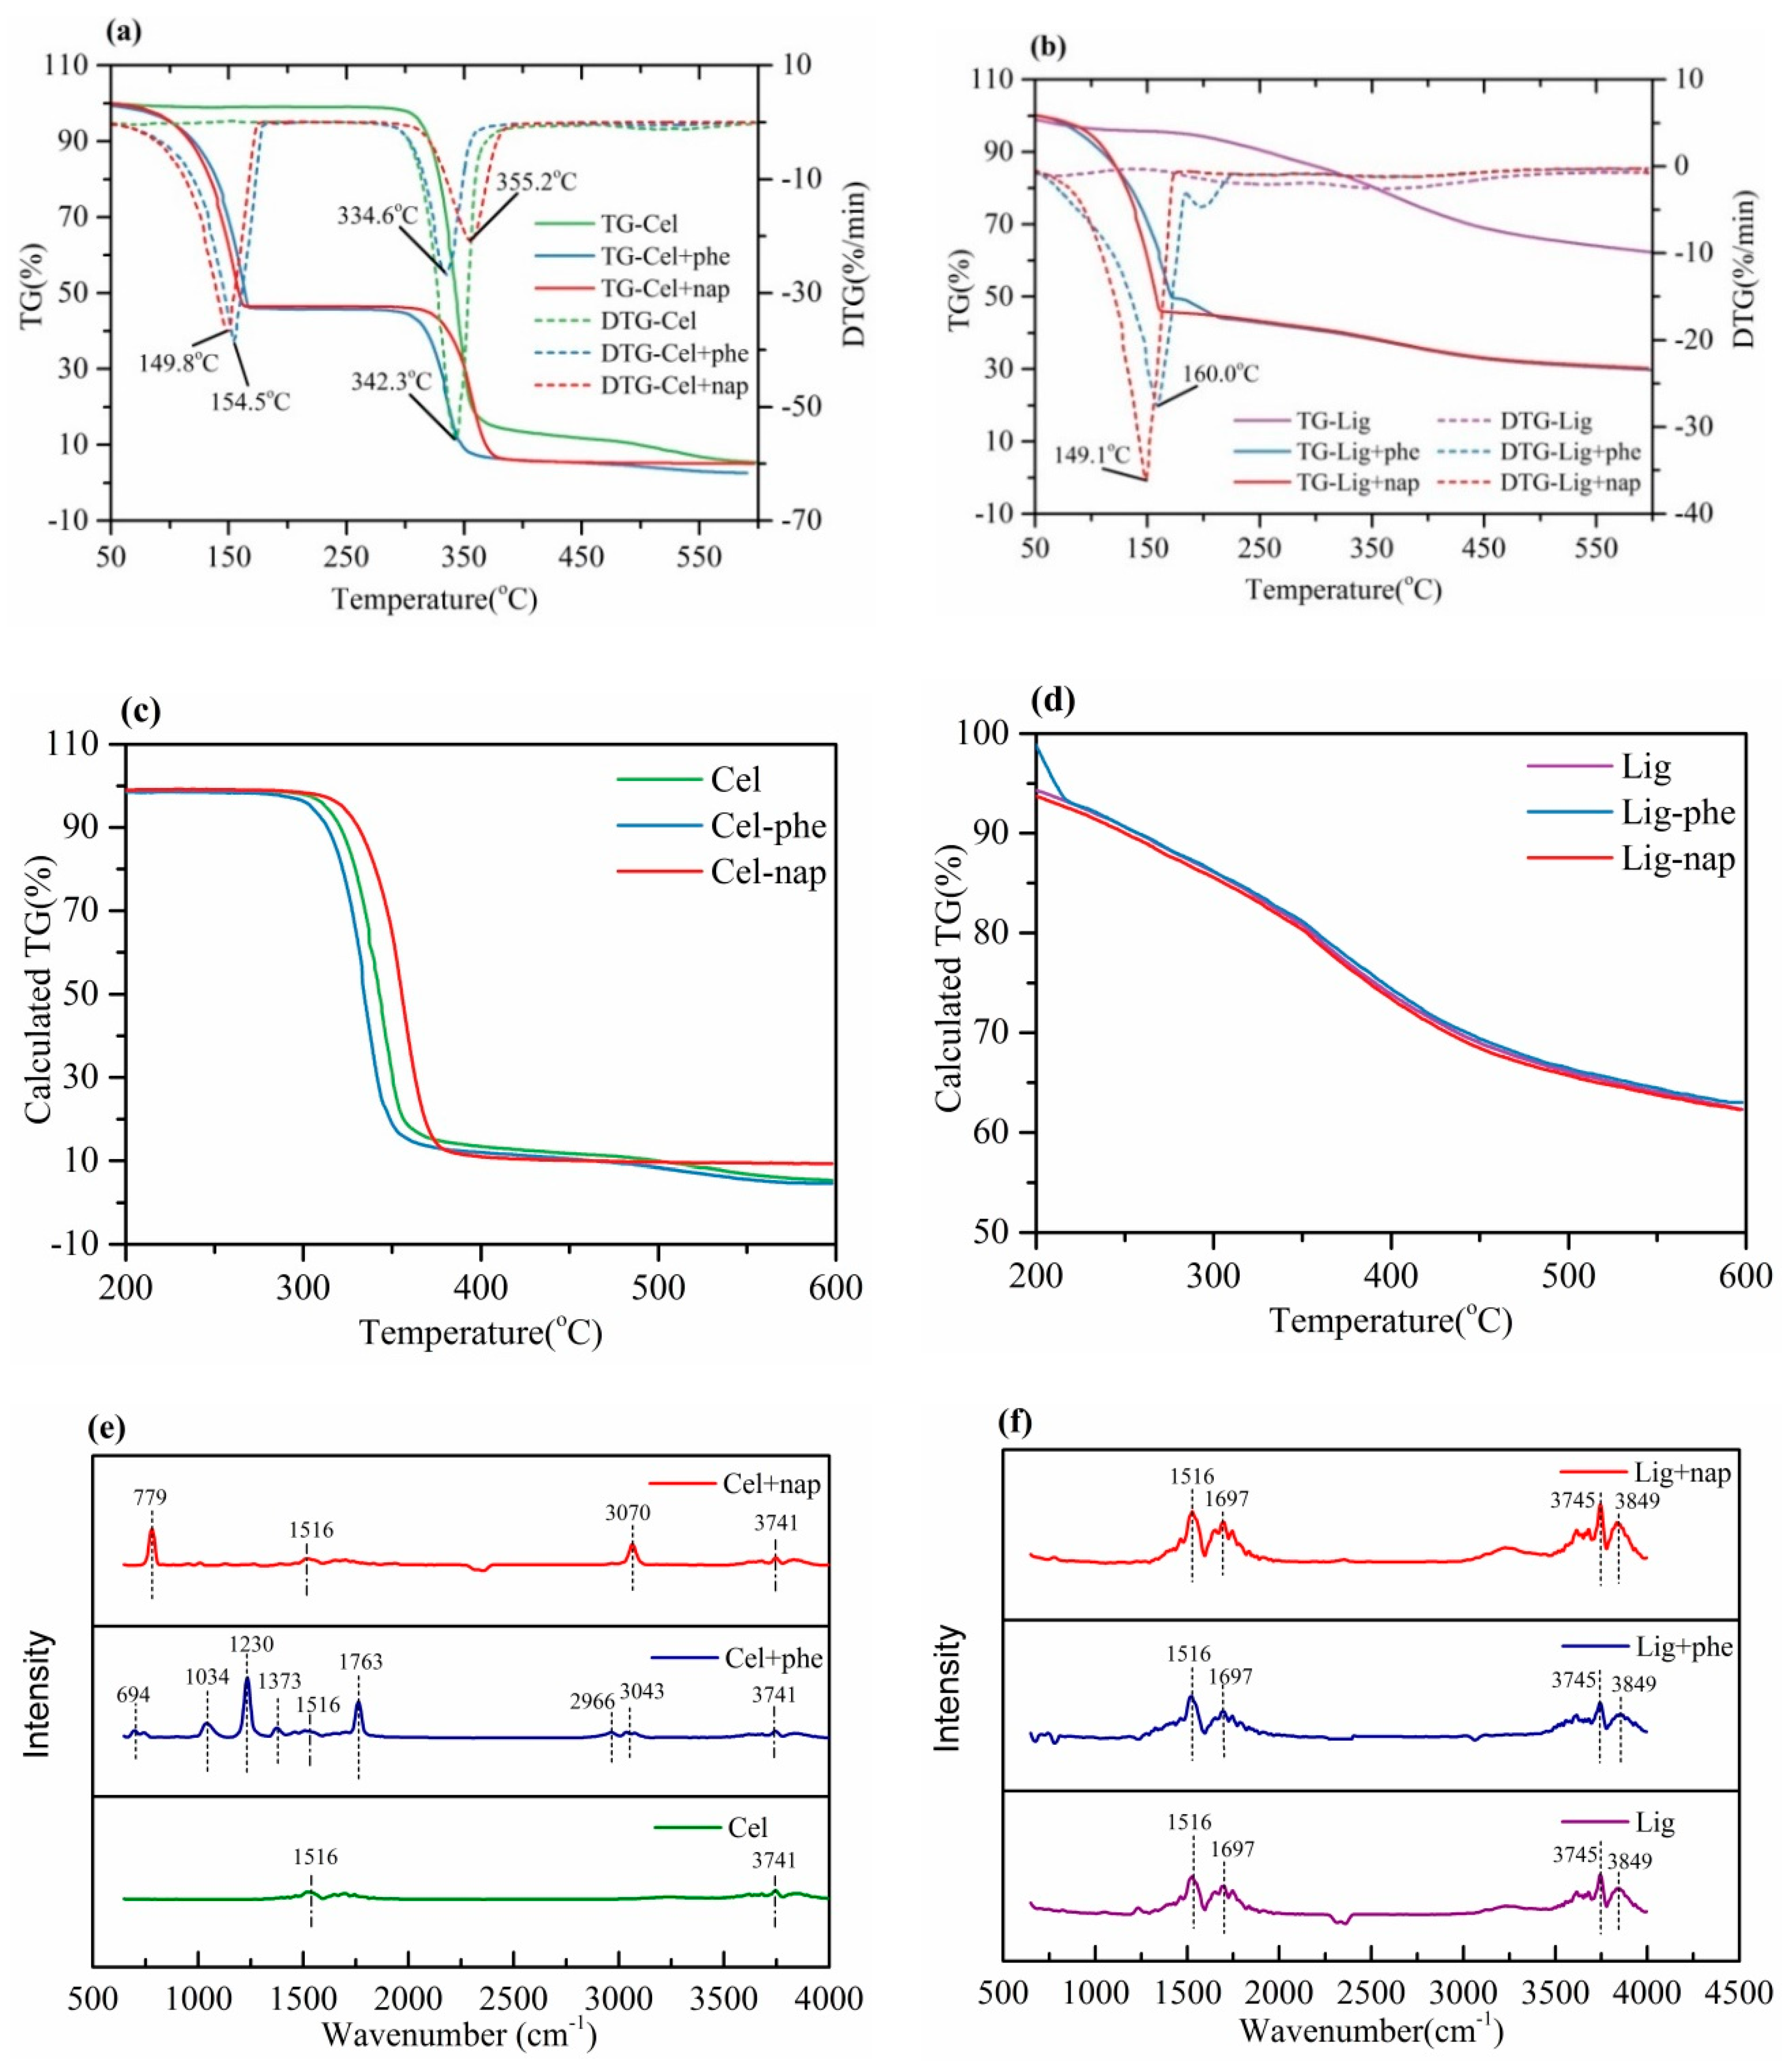
3.2. Study of Potential Interactions between Typical Biomass Components and Internal Standards

As displayed in Figure 2a, cellulose had a two step-type weight loss including the removal of adsorbed water and two competing reactions occurred—dehydration and depolymerization, and the temperature range of weight loss (between 300–380 °C) was mainly attributed to reactions in the second stage [19,22,23]. After the addition of phenethyl acetate or naphthalene, a new peak point for weight loss was found around 150 °C according to the DTG curves, which was lower than the related temperatures for the release of phenethyl acetate or naphthalene. In order to more clearly reflect the influence of internal standards on cellulose, the calculated TG curves (Figure 2c) were obtained by subtracting the internal standards mixture mass ratio. The results showed that the internal standards did not change the thermal decomposition characteristics of cellulose after 200 °C.
In order to observe the potential decomposition of the added standards, infrared spectra of different combinations of cellulose at the first rapid rate of release temperature point are given in Figure 2e. There were mainly two peaks of C=C skeleton vibration (wavenumber 1516 cm−1) and hydroxyl O-H stretching vibration (wavenumber 3741 cm−1) in the spectra for single cellulose [24]. With naphthalene and phenethyl acetate, two and seven additional infrared spectra peaks were observed, respectively. These peak positions were consistent with the peaks observed in the spectra of naphthalene and phenethyl acetate. These results demonstrated that although the mixture with cellulose lowered the released temperature of the selected standards, the components in the released compounds from phenethyl acetate or naphthalene were hardly changed.
Different from cellulose, the thermal weight loss (see Figure 2b) of lignin shows a gentle downward trend with a wide temperature range reach to 600 °C. After the addition of the standards, an obvious jumping peak in weight loss appeared, resulting from the release of the added phenethyl acetate or naphthalene. It was worth noting that the two selected internal standards mixed with lignin also showed a similar pattern to the internal standard mixed with cellulose, and the first weight loss rate peak of the blended internal standard was advanced by 17.3 and 21.5 °C, respectively. However, the curves of TG (Figure 2d) calculated by subtracting the part related to the added phenethyl acetate and naphthalene from the blending of lignin almost showed no obvious difference compared to the single lignin. Nevertheless, the results of FTIR from lignin (Figure 2f) showed similar peaks, based on the fact that the infrared spectrum peak of the internal standard may be covered due to the continuous release of lignin.

3.3. Effects of Adding Standards before and after Pyrolysis on the Generation of Biowaste Pyrolytic Products

Figure 3 shows the yields of pyrolytic products after thermal treatment of tobacco waste and sawdust waste within and without internal standards. Considering uncontrollable errors in the collection process during the experiments, few effects were found regarding the addition of internal standards on the pyrolytic products generation. Furthermore, by observing the noncondensable gas and biochar properties displayed in Figures S1 and S2, it was clearly that the added internal standards hardly participated in the formation of noncondensable gas and biochar. In addition, Figure S3 compared the GC-MS chromatograms of bio-oil from tobacco waste and sawdust waste with the addition of internal standards before or after pyrolysis, and the results showed no obvious difference in the component distribution of bio-oil. Table 1 and Table 2 presented the detailed information of GC-MS chromatograms results for various compounds from tobacco waste and sawdust waste, respectively. Considering the adequate mixing of the added standards (before pyrolysis) in the generated bio-oil, the proposed method could partly help to avoid inaccurate analysis of bio-oil components caused by incomplete collection of the volatiles. Although the addition of internal standards into the bio-oil before analysis diluted the concentration of each component in the bio-oil without regard to the peak area measurement related to the added standards, the chromatograms and the main components for the various compounds derived from tobacco waste or wood waste showed good similarity.
In order to better estimate the feasibility of adding standards into biowaste before pyrolysis for bio-oil quantitative analysis, eight typical components in the bio-oil from tobacco waste and sawdust waste were selected as evaluation substances. As depicted in Figure 4, peak area ratios were calculated based on the ratios of the peak area for each component to the peak area for internal standards (shown as Equation (2)). For tobacco waste, the peak ratio of 3-methylvaleric acid, phenol, neophytadiene, palmitic acid, 4-nitrophthalene dimethylamide from bio-oil in the two addition methods were basically close, indicating that the different addition methods have similar quantitative effects on the above five substances. However, for furfural, the quantitative ratio for adding internal standards after pyrolysis was higher than that before pyrolysis, which implied the corresponding correction factor would be lower under the same injection volume. In addition, different addition methods would have a certain bias effect on the quantification of nicotine and palmitic acid. Nevertheless, the addition of phenethyl acetate to nicotine could avoid the impact of different addition methods, and the addition of naphthalene to palmitic acid could avert the influence of different additions. Similarly, the furfural, eucalyptol, p-cresol, guaiacol, 2-methoxy-4-methylphenol, 4-ethylguaiacol, pandan and erucamide in the bio-oil of sawdust waste were analyzed through the ratio of the peak area of different components to the internal standard under different adding methods. The results revealed that the furfural produced by different raw material sources displayed a similar regular pattern. Moreover, the naphthalene could be chosen as the appropriate internal standard to quantify eucalyptol, p-cresol, guaiacol, 2-methoxy-4-methylphenol, 4-ethylguaiacol and vanillin, which showed certain advantages that would avoid the influence caused by different addition methods. On the other hand, the addition of phenethyl acetate before pyrolysis mostly appeared to have a lower area ratio than that of after pyrolysis, which could further lead the relative correction factor to be higher. For erucamide, the selection of suitable internal standards in different addition methods required further exploration. In short, it was advisable to add suitable internal standards before pyrolysis for quantifying the substances from bio-oil.

4. Conclusions

The current study aimed to find a convenient method for optimized quantitative analysis of bio-oil from biowastes, which evaluated the influence of the addition of phenethyl acetate and naphthalene before and after pyrolysis on the quantitative analysis of bio-oil. The internal standards phenethyl acetate and naphthalene were hardly decomposed and showed similar evaporation characteristics under slow pyrolysis conditions. The thermal stability of these standards was slightly changed after mixing with cellulose or lignin. Limited interactions were found between the internal standards and biomass components or biowastes. Few effects were found from the addition of these standards on the yields of the pyrolytic products as well as their properties. Compared with the traditional method for bio-oil analysis by adding standards into the bio-oil after pyrolysis, the component distribution characteristics of the bio-oil were similar according the results using the method through the addition of standards before pyrolysis. For the accurate quantitative analysis of bio-oil components, proper internal standards were suggested to be carefully selected. For the bio-oil from tobacco waste pyrolysis, both phenethyl acetate and naphthalene could be used to accurately quantify 3-methylvaleric acid, phenol, neophytadiene, palmitic acid and 4-Nitrophthalamide. For the bio-oil from sawdust waste pyrolysis, naphthalene was selected as internal standard to effectively quantify eucalyptol, p-cresol, guaiacol, 2-methoxy-4-methylphenol, 4-ethylguaiacol and vanillin.

Supplementary Materials

Supplementary materials can be found at https://www.mdpi.com/1996-1073/13/23/6202/s1. Figure S1. Schematic diagram of experimental device; Figure S2. The composition distribution of noncondensable gas from tobacco waste (TW) and sawdust waste (SW) with and without the addition of phenethyl acetate (-phe) and naphthalene (-nap); Figure S3. FTIR analysis of biochar from tobacco waste (TW) and sawdust waste (SW) with and without the addition of phenethyl acetate (-phe) and naphthalene (-nap); Figure S4. GC/MS chromatograms of (a) bio-oil from tobacco waste with the addition of phenethyl acetate (b) bio-oil from sawdust waste with the addition of phenethyl acetate (c) bio-oil from tobacco waste with the addition of phenethyl acetate before pyrolysis (d) bio-oil from sawdust waste with the addition of phenethyl acetate before pyrolysis (e) bio-oil from tobacco waste with the addition of naphthalene before pyrolysis (f) bio-oil from sawdust waste with the addition of naphthalene before pyrolysis.

Author Contributions

Conceptualization, X.S., F.W. and H.H.; methodology, M.W. and F.W.; formal analysis, X.P.; investigation, J.Y. and F.W.; resources, X.S. and H.H.; data curation, Q.G.; writing—original draft preparation, X.S. and M.W.; writing—review and editing, X.S., Q.G. and H.H.; funding acquisition, H.H. All authors have read and agreed to the published version of the manuscript.

Funding

This research was funded by National Natural Science Foundation of China (51906081), Major Technical Innovation Projects of Hubei Province, China (2018ACA151) and Natural Science Foundation Projects of Hubei Province, China (2018CKB906).

Acknowledgments

The authors are grateful to the Analytical and Testing Center of Huazhong University of Science and Technology for the experimental measurements.

Conflicts of Interest

The authors declare no conflict of interest.

References

  1. Lohri, C.R.; Diener, S. Treatment technologies for urban solid biowaste to create value products: A review with focus on low- and middle-income settings. Rev. Environ. Sci. Biotechnol. 2017, 16, 81–130. [Google Scholar] [CrossRef] [Green Version]
  2. Cao, J.P.; Xiao, X.B. Preparation and characterization of bio-oils from internally circulating fluidized-bed pyrolyses of municipal, livestock, and wood waste. Bioresour. Technol. 2011, 102, 2009–2015. [Google Scholar] [CrossRef] [PubMed]
  3. Lazzari, E.; Schena, T. Classification of biomass through their pyrolytic bio-oil composition using FTIR and PCA analysis. Ind. Crops Prod. 2018, 111, 856–864. [Google Scholar] [CrossRef]
  4. Mangesh, V.L.; Padmanabhan, S. Combustion and emission analysis of hydrogenated waste polypropylene pyrolysis oil blended with diesel. J. Hazard. Mater. 2020, 386, 121453. [Google Scholar] [CrossRef]
  5. Wang, S.; Xia, Z. Mechanism research on the pyrolysis of seaweed polysaccharides by Py-GC/MS and subsequent density functional theory studies. J. Anal. Appl. Pyrolysis. 2017, 126, 118–131. [Google Scholar] [CrossRef]
  6. You, Y.L.; Han, X.X. Structural characteristics and pyrolysis behaviors of huadian oil shale kerogens using solid-state 13C NMR, Py-GCMS and TG. J. Therm. Anal. Calorim. 2018, 131, 1845–1855. [Google Scholar] [CrossRef]
  7. El Hayany, B.; El Fels, L. Pyrolysis-GCMS as a Tool for Maturity Evaluation of Compost from Sewage Sludge and Green Waste. Waste Biomass-Valorization 2020, 1–14. [Google Scholar] [CrossRef]
  8. Whitman, C.A.; O’Flynn, J.T. Determining the oxidation behavior of metal powders during heating through thermogravimetric and evolved gas analysis using a coupled thermogravimetry-gas chromatography-mass spectrometry technique. Thermochim. Acta 2016, 638, 124–137. [Google Scholar] [CrossRef]
  9. Mohan, D.; Pittman, C.U. Pyrolysis of Wood/Biomass for Bio-oil: A Critical Review. Energy Fuel 2006, 20, 848–889. [Google Scholar] [CrossRef]
  10. Kim, K.H.; Bai, X.L. Quantitative Investigation of Free Radicals in Bio-Oil and their Potential Role in Condensed-Phase Polymerization. ChemSusChem 2015, 8, 894–900. [Google Scholar] [CrossRef]
  11. Chen, F.X.; Gong, P. Biomass Pyrolysis of Helianthus annuus Stems: Qualitative and Quantitative Study Based on Py-GC/MS. BioResource 2016, 11, 8589–8614. [Google Scholar] [CrossRef] [Green Version]
  12. Van Erven, G.; De Visser, R.; De Waard, P.; Van Berkel, W.J.H.; Kabel, M.A. Uniformly C-13 Labeled Lignin Internal Standards for Quantitative Pyrolysis-GC-MS Analysis of Grass and Wood. Sustain. Chem. Eng. 2019, 7, 20070–20076. [Google Scholar] [CrossRef] [Green Version]
  13. Liang, H.C. Analysis of Trace Substances by Gas Chromatography; China Petrochemical Press: Beijing, China, 2000; pp. 228–231. [Google Scholar]
  14. Peng, Y.S.; Li, Y.L. Determination of 16 Polycyclic Aromatic Hydrocarbons in Meat Samples by Gas Chromatography-Isotope Dilution Mass Spectrometry Approach. Food Sci. 2019, 40, 321–325. [Google Scholar]
  15. Kang, H.-R.; Hwang, H.-J.; Lee, J.E.; Kim, H.R. Quantitative analysis of volatile flavor components in Korean alcoholic beverage and Japanese sake using SPME-GC/MS. Food Sci. Biotechnol. 2016, 25, 979–985. [Google Scholar] [CrossRef] [PubMed]
  16. Alzoubi, H.H.; Al-Olaimat, D.J. The Effect of Using Naphthalene and Local Soil with Concrete Mixture on Thermal Conductivity, Case of Mafraq City—Jordan. Ecol. Eng. 2019, 20, 42–53. [Google Scholar] [CrossRef]
  17. Canet, R.; Birnstingl, J.G. Biodegradation of polycyclic aromatic hydrocarbons (PAHs) by native microflora and combinations of white-rot fungi in a coal-oil contaminated soil. Bioresour. Technol. 2001, 76, 113–117. [Google Scholar] [CrossRef]
  18. Chua, Y.W.; Yu, Y. Thermal decomposition of pyrolytic lignin under inert conditions at low temperatures. Fuel 2017, 200, 70–75. [Google Scholar] [CrossRef]
  19. Burhenne, L.; Messmer, J. The effect of the biomass components lignin, cellulose and hemicellulose on TGA and fixed bed pyrolysis. J. Anal. Appl. Pyrolysis 2013, 101, 177–184. [Google Scholar] [CrossRef]
  20. El-Azab, A.S.; Jalaja, K. Spectroscopic analysis (FT-IR, FT-Raman and NMR) and molecular docking study of ethyl 2-(4-oxo-3-phenethyl-3,4-dihydroquinazolin-2-ylthio) -acetate. J. Mol. Struct. 2016, 1119, 451–461. [Google Scholar] [CrossRef]
  21. Kloss, S.; Zehetner, F. Characterization of Slow Pyrolysis Biochars: Effects of Feedstocks and Pyrolysis Temperature on Biochar Properties. J. Environ. Qual. 2012, 41, 990–1000. [Google Scholar] [CrossRef]
  22. Mironova, M.; Makarov, I. Improvement in Carbonization Efficiency of Cellulosic Fibers Using Silylated Acetylene and Alkoxysilanes. Fibers 2019, 7, 84. [Google Scholar] [CrossRef] [Green Version]
  23. Li, S.S.; Li, S.Y. Catalytic effects of ammonium dihydrogen phosphate on the pyrolysis of lignocellulosic biomass: Selective production of furfural and levoglucosenone. Fuel Process. Technol. 2020, 209, 106525. [Google Scholar] [CrossRef]
  24. Schramm, C. High temperature ATR-FTIR characterization of the interaction of polycarboxylic acids and organotrialkoxysilanes with cellulosic material. Spectrochim. Acta Part A Mol. Biomol. Spectrosc. 2020, 243, 118815. [Google Scholar] [CrossRef] [PubMed]
Figure 1. TG-FTIR analysis for thermal stability estimation of phenethyl acetate and naphthalene: (a) TG/DTG curves; (b) FTIR spectrogram.
Energies 13 06202 g001
Figure 2. TG-FTIR analysis of the selected internal standards after mixing with cellulose or lignin: (a) TG/DTG curves of the internal standards blending with cellulose; (b) TG/DTG curves of the internal standards blending with lignin; (c) calculated TG curves of cellulose; (d) calculated TG curves of lignin; (e) FTIR spectrogram of the internal standards blending with cellulose; (f) FTIR spectrogram of the internal standards blending with lignin.
Energies 13 06202 g002
Figure 3. The yields of pyrolytic products during tobacco and sawdust waste pyrolysis with the addition of different standards.
Energies 13 06202 g003
Figure 4. Quantitative peak analysis of typical bio-oil components by adding internal standards before or after pyrolysis: (a) bio-oil from tobacco waste; (b) bio-oil from sawdust waste.
Energies 13 06202 g004
Table 1. The distribution characteristics of bio-oil from tobacco waste by adding internal standards before or after pyrolysis.
RT(min)FormulaCompoundRelative Mass Content (%)
AP-pheAP-napBP-pheBP-nap
5.45C5H4O2Furfural3.65.010.60.88
7.84C6H12O23-methylvaleric acid2.762.750.731.12
8.34C6H6Ophenol2.241.910.680.58
11.80C10H8Naphthalene *-5.11-56.71
12.84C10H12O2Phenylethyl acetate *4.28-64.79-
14.17C10H14N2Nicotine34.0132.9716.717.68
19.85C20H38Neophytadiene4.33.791.581.76
21.07C16H32O2Palmitic acid3.762.780.920.82
27.95C18H35NOOleamide7.2312.187.785.81
31.19C8H5N3O44-Nitrophthalichydrazide2.841.960.562.57
Other compounds34.9831.545.6612.07
Notes: *, internal standard; AP-phe, adding phenethyl acetate after pyrolysis; AP-nap, adding naphthalene after pyrolysis; BP-phe, adding phenethyl acetate before pyrolysis; BP-nap, adding naphthalene before pyrolysis.
Table 2. The distribution characteristics of bio-oil from sawdust waste by adding internal standards before or after pyrolysis.
RT(min)FormulaCompoundRelative Mass Content (%)
AP-pheAP-napBP-pheBP-nap
5.43C5H4O2Furfural4.516.063.242.04
9.27C10H18OEucalyptol1.351.931.191.04
10.02C7H8OP-cresol2.001.781.031.25
10.26C7H8O2Guaiacol7.67.355.475.09
11.80C10H8Naphthalene *-3.59-43.55
11.90C8H10O22-Methoxy-4-methylphenol6.125.834.244.75
12.84C10H12O2Phenylethyl acetate *2.2-54.93-
13.17C9H12O24-ethylguaiacol3.693.442.132.62
13.70C9H10O24-vinyl-2-methoxyphenol4.443.952.673.78
14.17C8H10O32,6-Dimethoxyphenol2.382.51.682.09
14.26C10H12O22-Methoxy-3-(2-propenyl)-phenol1.411.411.081.44
14.84C8H8O3Vanillin3.413.232.392.99
15.42C9H12O33,5-Dimethoxy-4-hydroxytoluene1.321.560.821.20
15.48C10H12O2(E)-2-Methoxy-4-(1-propenylphenol)4.114.862.884.00
15.96C9H10O3Vanilla ethyl ketone2.382.171.571.88
16.51C10H12O34-hydroxy-3-methoxypro-piophenone1.451.480.91.17
18.85C10H10O34-hydroxy-3-methoxycinnamaldehyde2.092.411.332.25
27.95C22H43NOErucamide2.893.513.66.7
Other compounds46.6541.218.8512.16
Notes: *, internal standard; AP-phe, adding phenethyl acetate after pyrolysis; AP-nap, adding naphthalene after pyrolysis; BP-phe, adding phenethyl acetate before pyrolysis; BP-nap, adding naphthalene before pyrolysis.
Publisher’s Note: MDPI stays neutral with regard to jurisdictional claims in published maps and institutional affiliations.

