Abstract
This research qualitatively and quantitatively characterises the minor chemical elements in diesel particulate matter (DPM). DPM was extracted from in-use diesel engine passenger vehicles of diverse types and models from major brand car producers in Europe. We analysed particulate matter extracted from the exhaust manifold part from passenger vehicles that are used in daily life environment. To qualitatively and quantitatively characterise the DPM, we employed the high-resolution Laser-Induced Breakdown Spectroscopy analytical technique (LIBS). Qualitative spectrochemical LIBS analyses confirmed the presence of minor chemical elements—silicon, nickel, titan, potassium, strontium, and molybdenum in DPM. For quantification of the LIBS signal, the calibration functions were constructed from internal calibration standards. Different concentrations of detected minor elements Si, Ni, Ti, K, Sr, and Mo were measured with respect to the type of complex particulate matter.
Keywords:
particulate matter; diesel particulate matter; particulates; soot; carbon emissions; pollutant emissions; vehicle emissions; exhaust emissions; ultrafine particles; metallic nanoparticles; trace metals; trace elements; trace emission; air quality; optical emission spectroscopy; laser-induced plasma spectroscopy; LIBS; LIPS 1. Introduction
Issues with diesel engine emissions and vehicles emission monitoring [1,2,3] are important subjects for human health. However, the real situation immediately reflects on the current quality of circulating air flow in the cities, suburbs, and industrial or rural areas, which influences the number of inhalant nanoparticles within the particulate matter (PM) in air and forms the current air pollution of our “modern” civilisation. Non-polluted clean air is important for our human body, mainly for the lungs, cardiovascular system, as well as for the central nervous system and brain [4,5]. Nowadays, PM and metallic nanoparticles are the key sources of many diseases and illnesses or deaths. Therefore, it should be among our highest priorities to rigorously explore and understand the composition of particulate matter. The knowledge of this information can help to find new techniques to precisely measure and quantify the content of different chemical elements adsorbed inside the small PM and to minimise the vehicle’s emissions.
In this research, we employed a Laser-Induced Breakdown Spectroscopy technique [6] for spectrochemical analysis of particulate matter. PM was collected from in-use passenger vehicles driven by diesel engines. We inspected the particulate matter from sixty-seven unique passenger vehicles used in a daily life environment. The main task was to investigate the composition of particulate matter, essentially agglomerated minor chemical compounds. Due to the complicated processes involved within the combustion of diesel engines, the presence of agglomerate chemical elements in diesel exhaust emissions occurred. These processes are linked with engine type, engine size, engine operation conditions, type of fuel, quality of fuel, additives, lubricants, and aftertreatment devices. All these inputs modify the particulate exhaust emissions and the final elemental composition of diesel particulate matter (DPM) emitted from in-use diesel engine vehicles.
In this manuscript, we speak about diesel particulate matter to clearly distinguish the particulate matter formed from the diesel engine driven vehicles. DPM is a specific type of particulate matter due to the combustion processes involved.
The main objective of this manuscript is to characterise the minor chemical elements in different diesel particulate matter samples by the Laser-Induced Breakdown Spectroscopy technique. Here, we present the quantitative analytical approach to obtain the concentration of minor chemical elements in the exhaust emissions as particulate matter from in-use diesel engine passenger vehicles. This presented work here is the continuation of our previous research study published in [7,8], where we examined the major chemical elements in diesel particulate matter by LIBS. The major elements of DPM were identified as carbon, iron, magnesium, aluminium, chromium, zinc, sodium, and calcium, in addition to the hydrogen and oxygen content.
2. Methodology
In this research, we applied the Laser-Induced Breakdown Spectroscopy technique (LIBS) for qualitative as well as sensitive quantitative compositional analytical measurements of chemical elements in DPM [7,8]. The basic principle of the LIBS method is quite well explained in the publications [9,10,11], and therefore, we only shortly describe the experimental setup.
By means of the LIBS technique, we can qualitatively analyse the major and minor chemical elements of DPM, and after a calibration procedure provide a qualitative characterisation of the sample composition.
2.1. Experimental LIBS Setup
The setup used for Laser-Induced Breakdown Spectroscopy included a laser source-pulsed Nd:YAG (Neodymium doped Yttrium Aluminum Garnet) laser, high-intensity laser system, collection optics (mirrors, focusing lens, optical telescope), experimental LIBS chamber, and high-resolution optical spectrometer. An emerging laser radiation from the laser source was navigated via optical mirrors into the sample. Before hitting the sample, a high power laser light was focussed via focussing optics. Consequently, the sample surface material has been ablated, the ejected nanoparticles were ionised, and plasma was created. A schema and experimental laser-induced breakdown spectroscopy setup is shown in the Figure 1.
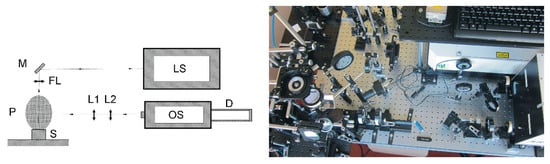
Figure 1.
Schema and experimental laser-induced breakdown spectroscopy setup. LS—Laser Source (Nd:YAG laser, Yasmin, Quantel, France), M—Mirror, P—Plasma, S—Sample, FL—Focusing Lens, L1 and L2—Optical Telescope, OS—Optical Spectrometer (Aryelle Butterfly, Echelle spectrograph, LTB Berlin, Germany), D—Intensified Charge-Coupled Device (ICCD) Detector, PI-Max 4, Princeton Instruments, Trenton, NJ, USA.
For laser-induced plasma generation, we have used a solid-state Nd:YAG laser, Yasmin, from Quantel, France. The laser radiation has a pulse duration of 8.5 ns and wavelength of 1064 nm in an invisible IR radiation spectrum. During the experiments, we have used the pulses with 300 mJ laser energy per pulse. Due to different DPM matrices, we used a higher laser pulse energy to increase the plasma optical emission and to gain a broad spectral signal for all DPM samples. We used a 10 cm focusing lens for laser radiation and plane solid target surface to create homogeneous plasma. The light from plasma emission was collected perpendicularly via a collection optics-telescope directly to high-resolution Aryelle Butterfly, Echelle spectrograph from LTB, Berlin, Germany. The spectrometer is equipped with an Intensified Charge Coupled Device (ICCD) detector PI-Max 4 from Princeton Instruments, Trenton, NJ, USA, and consists of two individual spectrographs. The first part was from 190 to 440 nm in the UV range and the second was in the range from 440 to 800 nm for the VIS optical spectrum. The resolution capability is from 3 to 7 picometres in the VUV range and 4 to 8 picometres in the VIS part. Such a high spectral resolution provides LIBS measurements with a broad spectral range and with detailed spectral information. During the measurements, the delay time of 1 μs and a gate width of 2 μs has been used. The plasma optical emission has been generated in an air atmosphere with atmospheric pressure and room temperature. A brief description regarding the type of equipment, model, company, and device specification is included in the Table 1.

Table 1.
Brief description of type of equipment, model, company, and device specification.
2.2. Particulate Matter Collection and Sample Preparation
Sixty-seven samples of particulate matter were prepared from different in-use diesel engine passenger vehicles. These were from diverse automobiles producers in Europe. Passenger cars that were particularly selected for sample collection were from the standard daily life environment, such as those we use to drive every day to work, school, shopping, etc. We have not used vehicles for special tests, driving test cycles, nor test engines. Particulate matter samples were extracted at the end of the exhaust system directly from the tail pipe.
In reality, we have collected the particulate matter from more than seventy different passenger vehicles; unfortunately, not all samples were used for LIBS analytical measurements. This was due to the insufficient particulate matter powder for the sample preparation or some samples being simply destroyed during the sample preparation. Due to the lack of PM, we could not prepare identical samples from the same vehicle, or same samples were destroyed during the LIBS analytical measurements.
The selection of passenger cars was performed without any preferences. No automobile producer brands or types of vehicles were preferred. The samples of particulate matter extracted from diesel engine passenger vehicles, particularly tail pipe deposits, were pressed mechanically into the flat disc-like shape pellets with diameters of 6 mm. In total, we obtained LIBS spectra from sixty-seven different PM samples from different passenger vehicles.
3. Results and Discussion
3.1. Diesel Particulate Matter Measured by LIBS
Basic spectrochemical analyses of diesel particulate matter were performed by the Laser-Induced Breakdown Spectroscopy technique. Typical examples of measured LIBS spectra from three different diesel particulate matter samples are shown in Figure 2. In these graphs, x-axis denotes the spectral wavelength and y-axis denotes the intensity of the measured optical emission signal in arbitrary units (a.u.). A.U. is used due to the lack of absolute intensity signal; therefore, in practice, the LIBS signal has to be further calibrated.
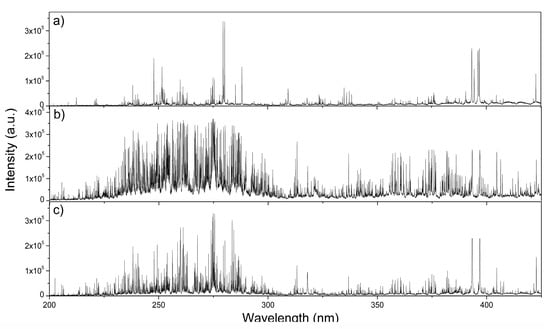
Figure 2.
Laser-Induced Breakdown Spectroscopy (LIBS) signal measured from three diesel particulate matter samples. High-intensity spectral lines are from major chemical elements—carbon, iron, magnesium, aluminium, chromium, zinc, sodium, and calcium. (a) C, Mg, Ca, and Al; (b) Fe, Cr, and Ca, Mg; and (c) C, Ca, and Mg.
From these three spectrographs, we can observe strong optical line emissions mainly from major chemical elements: carbon, iron, zinc, magnesium, sodium, chromium, calcium, and aluminium spectral lines. Measured chemical elements were previously identified as major components of diesel particulate matter. More details can be found in references [7,8]. Measured Laser-Induced Breakdown Spectra obtained from DPM extracted from exhaust emissions from in-use diesel engine passenger vehicles exhibit typical line spikes with distinct line peaks, which are generated from atomic, ionic, and molecular spectral transitions.
3.2. Qualitative Measurements of Minor Chemical Elements in Diesel Particulate Matter
In order to qualitatively characterise the minor chemical elements in diesel particulate matter, the state-of-the-art LIBS laboratory setup was built to obtain optical emission spectral images and particular quantitative data with high spectral resolution. The results from LIBS measurements are shown in Figure 3a–f. Figures are showing a measured signal as original data—not filtered—from sixty-seven samples of diesel particulate matter. In this figure, the x-axis represents the measured wavelength in (nm) for the spectral LIBS signal and the y-axis represents the intensity of the LIBS signal in arbitrary units. In this study, we mainly focus our research to minor chemical elements. These are particularly minor spectral lines from molybdenum, nickel, potassium, silicon, strontium and titan atomic or ionic optical emission. Since the strength of the measured LIBS signal for a particular atomic or ionic spectral line is generally proportional to the concentration of the studied analyte in the sample, we analysed in detail each measured LIBS spectrum and the corresponding spectral line profile. Each spectral peak is characterised with an individual line peak-shape, intensity, and Full Width High Maxima (FWHM). Obtained signal and particular atomic and ionic spectral lines data were used for qualitative as well as quantitative characterisation of diesel particulate matter.
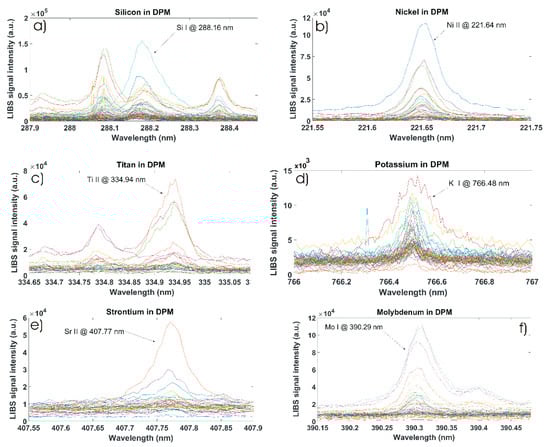
Figure 3.
Laser-Induced Breakdown Spectroscopy signal measured from different diesel particulate matter samples. Spectrum from: (a) Silicon, (b) Nickel, (c) Titan, (d) Potassium, (e) Strontium, and (f) Molybdenum.
For a detailed qualitative LIBS comparison, we numerically calculated the integral of each spectral peak to obtain qualitative information about the chemical composition of diesel particulate matter. The individual profile of the spectral peak has been background corrected and fitted with an appropriate fitting function curve. The results from the integral calculations are shown in Figure 4a–f. In this figure, one can easily compare chemical elements variations, corresponding to the concentrations of studied minor elements in DPM matrices. In this figure, the x-axis represents the number of individual DPM samples, and the y-axis represents the numerically calculated integral values in arbitrary units (a.u.). Nevertheless, for detailed quantitative analytical measurements, the calibration procedure of LIBS spectral data has to be performed. This procedure is explained further in Section 3.3.
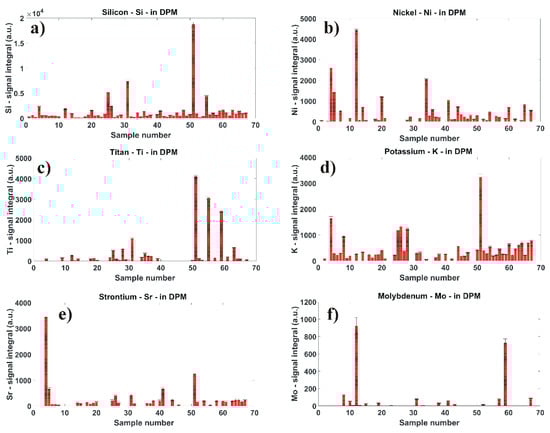
Figure 4.
Comparison of calculated integral values from optical emissions spectrum of (a) Silicon, (b) Nickel, (c) Titan, (d) Potassium, (e) Strontium, and (f) Molybdenum minor chemical elements in diesel particulate matter.
The silicon-atomic spectral line Si I at 288.16 nm is displayed in Figure 3a. Here, we can relatively easy compare variations in the silicon signal (a.u.) within diverse DPM matrices. A high content of Si is in the samples #51, 31, 25, and 55. From LIBS analytical measurements and numerical calculations, the results of which are shown in Figure 4a, we can conclude that silicon is a minor element, and it has been measured in 63 out of 67 different DPM samples.
The nickel-ionic spectral line Ni II at 221.64 nm is shown in Figure 3b. Here, the response peak from the nickel signal is quite strong. The calculation of the signal integral values is shown in Figure 4b. The samples with a high content of nickel are #12, 4, 34, 5, and 20. Nickel as a minor chemical element was measured in 43 different DPM samples.
The titan-ionic spectral line Ti II at 334.94 nm is compared in Figure 3c. From the numerical calculation shown in Figure 4c, we can see that the optical emission from this element was measured in 32 DPM matrices. A high content of titan is present in samples #51, 55, and 59.
The potassium-atomic spectral line K I at 766.48 nm is present in the IR spectral range shown in Figure 3d. A high content has been measured in samples #51, 4, 26, 28, 25, and 8. The comparison of calculated integral values from the potassium spectral signal is shown in Figure 4d. Potassium was measured in 50 different DPM samples.
The strontium-ionic spectral line Sr II at 407.77 nm recorded from the visible spectral region is shown in Figure 3e. From the numerical calculation and signal comparison in Figure 4e, strontium as a minor chemical element has been measured in 35 different DPM samples. A strong signal from Sr is in samples #4 and 51.
The molybdenum-atomic spectral line Mo I at 390.29 nm is shown in Figure 3f. Here, the intensity of the Mo spectral line is well pronounced. From the integral calculation shown in Figure 4f, a higher content of molybdenum is in two samples, #12 and 59. Molybdenum as a minor element has been measured in 17 different DPM samples.
The summary of identified minor chemical elements in the DPM is shown in Table 2. In this table, the atomic and ionic spectral lines that were used for the LIBS analytical measurements as well as the sample numbers are included. The spectroscopic lines data included in Table 2 are from the National Institute of Standards and Technology (NIST) atomic spectra database [12].
Table 2.
Spectral atomic and ionic lines employed for the analytical LIBS measurements as well as the number of samples with detected chemical elements. The spectral lines are from the National Institute of Standards and Technology (NIST) atomic spectra database [12].
3.3. Quantitative Analyses of LIBS Signal
Qualitative and quantitative spectrochemical information about the composition of the examined analytes is contained in the LIBS spectrum. This originates from excited neutrals, ions, and molecules within the generated laser-induced plasma. Therefore, different approaches are known to gain the quantitative information from LIBS measurements. One of the methods determines the concentration of each element independently by evaluating the line emission from known transition probabilities and from the absolute measurements of the integrated line intensities. Another possible way is to measure the emission line intensities relative to the line intensity of the main abundant element. Quite often, the approaches to obtain quantitative results are the LIBS intensities in relation to known calibration standards or certified reference materials. By assuming the optical emission line intensity (or integral of spectral peak curve), the ratio of the concentration of two species A and B can be expressed as a function ratio of the line intensity of species A to the line intensity of species B. Considering that the concentration ratio is directly proportional to the ratio of corresponding line intensities, it is possible to establish a calibration function. This curve is basically a plot of relative concentrations of an element obtained by LIBS measurements versus the known relative concentrations of this element in the samples. Then, calibration curves can be used for the quantitative determination of unknown concentrations in the examined material.
The quantitative characterisation of the diesel particulate matter samples and the LIBS spectral signal were obtained from internal laboratory calibration standards. Laboratory standards were prepared with different concentrations of major as well as minor chemical elements. The majority of the elements in the PM are due to the high intensity and signal strength measured by the LIBS technique from carbon, iron, zinc, calcium, and magnesium. These elements are forming the major concentration of elements in the DPM matrix. According to our previous research (see Ref. [7,8]), these chemical elements form a main part of the diesel particulate matter. Minor elements of the laboratory prepared particulate matter samples are molybdenum, nickel, potassium, silicon, strontium and titan. These elements form a minority group due to the lower concentrations of these elements in the DPM.
For calibration purposes, similar types of particulate matter material were produced as internal standards in our laboratory. These were on the basis of previous qualitative and quantitative analytical measurements of various types of diesel particulate matter matrices performed by the high-resolution LIBS technique. Internal standards were made from pure certified elements bought from Sigma-Aldrich Chemie GmbH., Taufkirchen, Germany and Carl Roth GmbH., Karlsruhe, Germany. All laboratory calibration standards were produced as mixtures of nanopowdered materials. The nanopowder was further mixed and milled by a laboratory grinder to obtain well-mixed fine powder. This way, the prepared nanopowder was pressed into the pellets with a diameter of 6 mm, similar to the DPM samples.
3.4. LIBS Measurements of Calibration Samples
All calibration standards were analysed by using the same experimental parameters as those in the DPM matrices, which were explained earlier. An identical experimental setup, parameters, laser energy, spectrometer, and detector settings were used. Again, LIBS measurements were performed in air atmosphere at normal atmospheric pressure. Calculated calibration functions and R2 regression parameter, 95% confidence limits, and prediction bands measured for molybdenum, nickel, potassium, silicon, strontium, and titan are shown in Figure 5. In this figure, the x-axis represents the calculated integral value for an individual spectral line from minor elements. To enhance the LIBS quantitative analytical sensitivity of calibration functions, in particular, the regression parameter, confidence limits, and limit of detection ratio of two spectral lines were used. One spectral line from a minor chemical element versus one spectral line from a major chemical element (carbon) from prepared calibration standards were calculated. Each profile of spectral peak has been background corrected and fitted with an appropriate mathematical function. The y-axis represents a known concentration of individual chemical elements in the laboratory prepared standards. For the calibration purposes, we used either the linear fitting or the nonlinear allometric fitting procedures, depending on the measured and calculated data from the LIBS analyses. The concentrations and calibration curves of individual chemical elements are shown in weight percent (wt %) unit. Calibration functions often experience a nonlinear profile. This is because of the sample-matrix effect. The matrix effect is due to the different concentrations of major elements in the sample that influence the physical and chemical property of the studied material. Therefore, it is useful to split the interval of calibration into smaller intervals of concentration values: for example, a calibration function for low concentrations, for middle concentrations, and for high concentrations. This approach can help increase the sensitivity of LIBS quantitative analytical measurements.
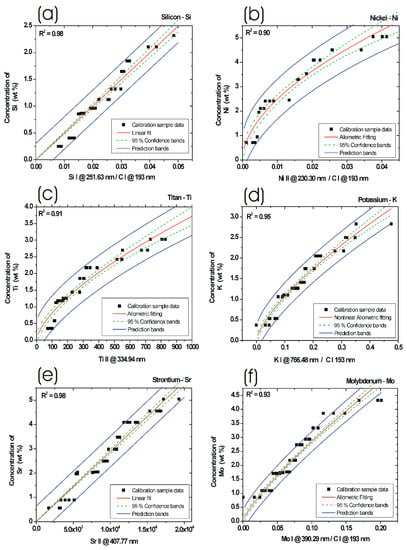
Figure 5.
Calibration curves (red line) including regression parameter R2, 95% confidence limits (green dashed line) and prediction bands (blue line) for: (a) Silicon, (b) Nickel, (c) Titan, (d) Potassium, (e) Strontium, and (f) Molybdenum obtained from laboratory prepared PM calibration standards. Concentrations of elements are in weight percent (wt %).
3.4.1. Silicon Calibration Curve
Generally, in an LIBS optical spectrum, there are available many silicon spectral lines. However, in the case of DPM, a number of silicon spectral lines are quite limited, due to the often overlapping of silicon spectral lines with other more intense spectral lines, such as iron atomic or iron ionic lines. Therefore, we decided to use the specific spectral line Si I at 251.63 nm, which is often applied in optical emission spectroscopy for samples with a high concentration of iron, as this line is very well pronounced in this kind of PM matrix. The profile of the spectral peak has been background corrected and fitted with an appropriate mathematical function. Furthermore, we calculated the integral values of individual signal lines (Si I at 251.63 nm) for each calibration sample. The integral of the line peak signal has been calculated for all calibration samples. Due to the carbon element forming a major content of the DPM samples, it can be used for calibration procedures. The background corrected and fitted spectral peak line of carbon C I at 193.02 nm was calculated, and its peak integral values were used for the calibration procedure, too. The integral product of the silicon atomic line and carbon atomic line ratio was plotted against the known concentration of silicon in the calibration curves. The calibration function for silicon is shown in Figure 5a. Here, obtained ratios are marked in the graph as black squares, 95% confidence limits are marked by dashed lines (green), linear fit is marked by solid lines (red), and prediction bands are marked by solid lines (blue). The R2 parameter was calculated to 0.98. Due to the limited number of prepared internal standard samples and the resulting calibration function, it is recommended to use the data from the calibration function only within the obtained interval values, in our case from 0 wt % to 3 wt % for Si.
3.4.2. Nickel Calibration Curve
To gain the nickel calibration function from the laboratory prepared internal standards, we used the ratio of peak integral of an ionic spectral line Ni II at 230.30 nm and integral values of the carbon atomic line C I at the 193.02 nm profile. The regression parameter R2 was calculated from nonlinear allometric fitting procedures to 0.90. The calibration curve for Ni is shown in Figure 5b. From the internal standards prepared and resulting sample data, the Ni calibration function can be use for the interval values between 0 to 7 weight percent (wt %).
3.4.3. Titan Calibration Curve
The titan calibration curve was calculated from the integral values of the ionic spectral line Ti II at 334.94 nm profile. The signal from the Ti spectral line was at first background corrected and afterwards fitted with an appropriate function. The regression parameter R2 was calculated from nonlinear allometric fitting procedures to 0.91. The calibration curve for Ti is shown in Figure 5c. From the prepared internal standards and resulting sample data, the Ti calibration function can be use for the concentration between 0 and 4 wt %.
3.4.4. Potassium Calibration Curve
To acquire a potassium calibration curve, we calculated the ratio of the peak integral of the atomic spectral line K I at 766.48 nm and integral values of the carbon atomic line C I at 193.02 nm profile. The regression parameter R2 was calculated from nonlinear allometric fitting procedures to 0.95. The potassium calibration curve is shown in Figure 5d. From the internal standards and sample data, the calibration function of K can be used for the interval values between 0 and 3 weight percent.
3.4.5. Strontium Calibration Curve
The calibration curve for strontium was obtained from the ionic spectral line Sr II at 407.77 nm profile. The signal from the Sr line was background corrected and fitted with an appropriate function. Afterwards, the integral of the fitted function was calculated. The regression parameter R2 was calculated from linear fitting procedures to 0.98. The calibration curve for Sr is shown in Figure 5e. From the measured data, the Sr calibration function can be optimally used for the concentration of internal values between 0 and 5 wt % of Sr in particulate matter.
3.4.6. Molybdenum Calibration Curve
To gain a molybdenum calibration curve, we calculated the ratio of the peak integral of the atomic spectral line Mo I at 390.29 nm and the integral of the carbon atomic line C I at the 193.02 nm profile. The regression parameter R2 was calculated from nonlinear allometric fitting procedures to 0.93. The molybdenum calibration curve is shown in Figure 5f. From the spectral data and calibration function, Mo can be used in an interval between 0 and 6 weight percent.
The obtained calibration curves for molybdenum, nickel, potassium, silicon, strontium and titan will result in the possibility of further predicting concentrations of minor chemical elements in various diesel particulate matter samples.
Table 3 specifies minor chemical elements in DPM, a summary of selected spectral lines, calculated R2 regression parameters, and concentration intervals (wt %) that are valid for calibration curves. Optical spectral lines and ratios of chemical elements are used for LIBS signal processing.
Table 3.
Summary of calibration: minor chemical elements in diesel particulate matter (DPM), calculated regression parameter R2, concentration interval in (wt %) and calibration curve validity. Optical spectral lines and ratios of chemical elements used for LIBS signal processing.
By means of the calibration functions presented in Figure 5a–f and by using calculated integral values from the background corrected and fitted LIBS signal measured from different DPM, shown in Figure 4a–f, it was possible to get quantitative information about the minor chemical elements. Results from the quantitative determination after applying calibration curves are shown in Figure 6a–c and Figure 7a–c. In these six figures, each bar graph represents an average concentration of chemical element for one sample determined in wt %. Concentration of silicon, nickel, and titan are shown in Figure 6a–c, while concentration of potassium, strontium, and molybdenum are shown in Figure 7a–c. Here, the measurements are from 67 different DPM samples. Due to the calibration procedure, the resulting concentrations values shown here are only within the valid calibration interval, as explained above in Table 3. The other values, especially samples with much higher concentrations, were simply omitted. However, it would be also possible to use these calibration functions, but it is recommended to perform an additional calibration procedure with extra calibration standards and measured data points for each concentration interval to increase the precision of measured data.
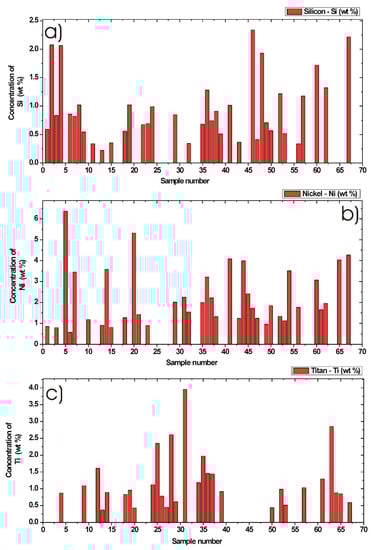
Figure 6.
Quantitative determination of minor chemical elements in particulate matter collected from in-use diesel engine passenger vehicles by Laser-Induced Breakdown Spectroscopy. Bar graphs represent an average concentration of chemical element in wt %. Concentration of (a) Silicon, (b) Nickel and (c) Titan in 67 different DPM samples.
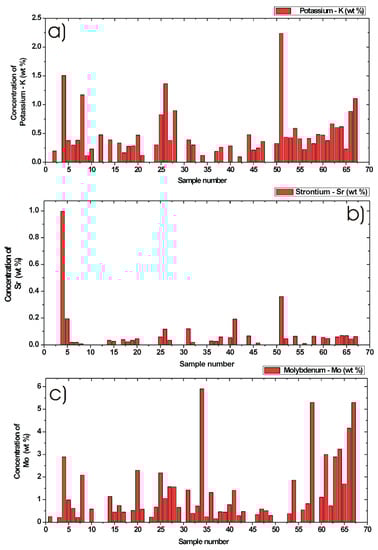
Figure 7.
Quantitative determination of minor chemical elements in particulate matter collected from in-use diesel engine passenger vehicles by Laser-Induced Breakdown Spectroscopy. Bar graphs represent an average concentration of chemical element in wt %. Concentration of (a) Potassium, (b) Strontium, and (c) Molybdenum in 67 different DPM samples.
3.5. Quantification of Minor Chemical Elements in Diesel Particulate Matter
3.5.1. Silicon Concentration in DPM
According to the silicon calibration function shown in Figure 5a and the calculated integral values from the LIBS signal shown in Figure 4a, the maximum content of silicon in Figure 6a was measured to be 2.33 wt %. From Figure 6a, the minimum measured and detected concentration of Si was 0.22 wt %. The mean value was calculated to 0.94 wt % and the median value was calculated to be 0.81 wt % in DPM. The samples with zero Si signal and samples with a concentration above 3 wt % were not included into the statistics. For this reason, 37 valid samples within the concentration interval were accepted. Other samples with much higher concentrations of Si in DPM were simply omitted.
3.5.2. Nickel Concentration in DPM
By using nickel calibration data, the maximum Ni content was measured to 6.36 wt %. From Figure 6b, the minimum measured concentration of Ni was 0.57 wt %. The mean value was calculated to 2.22 wt % and median value of Ni was calculated to 1.76 wt %. The zero Ni signal and concentration above 7 wt % were not included into these statistics. For statistics, 37 samples within the accepted interval were used.
3.5.3. Titan Concentration in DPM
From the titan calibration curve and measured samples data, the maximum of Ti content was measured to 3.95 wt %. From Figure 6c, the minimum measured concentration was 0.36 wt %. The mean value was calculated to 1.21 wt %, and the median value was calculated to 0.95 wt %. A zero Ti signal and concentrations above 4 wt % were not included in the statistics. We used 29 samples for statistics within the accepted interval.
3.5.4. Potassium Concentration in DPM
From the calibration curve and measured data, the maximum of potassium content in DPM was measured to 2.23 wt %. From Figure 7a, the minimum measured concentration was 0.1 wt %. The mean value was calculated to 0.48 wt % and the median value was calculated to 0.37 wt %. A zero K signal and concentrations above 3 wt % were not included into the statistics. For these statistics, 50 DPM samples within the accepted interval were used.
3.5.5. Strontium Concentration in DPM
From the calibration function of strontium and measured data, the maximum content of Sr was obtained to 0.99 wt %. From Figure 7b, the minimum concentration was 0.01 wt %. The mean value was calculated to 0.09 wt % and median value was calculated to 0.04 wt %. A zero Sr signal and concentrations above 5 wt % were omitted. For statistics, 35 different samples within the accepted interval were used.
3.5.6. Molybdenum Concentration in DPM
By means of the molybdenum calibration function and DPM samples, the maximum Mo concentration was measured to 5.9 wt %, while the minimum concentration was 0.16 wt %, as shown in Figure 7c. The mean value was calculated to 1.32 wt % and the median value was calculated to 0.72 wt %. A zero Mo signal and concentrations above 6 wt % were not included in the statistics. For these statistics, 52 DPM samples within the accepted calibration interval were used.
Table 4 summarises the results from the quantitative determination of minor chemical elements in DPM collected from different in-use diesel engine passenger vehicles. In particular, the obtained maximum, minimum, mean value, and median concentrations of minor elements in (wt %).
Table 4.
Summary of quantitative determination of minor chemical elements in DPM obtained by the high-resolution LIBS technique. Calculated maximum, minimum, mean value, and median concentrations of minor elements in different DPM from in-use diesel engine passenger vehicles. Values are in (wt %). For these statistics, only the samples where the minor element concentration was within the accepted calibration interval were used.
By means of high-resolution LIBS and calibration procedures, we have quantitatively analysed the minor chemical elements in DPM. From the presented results, we obtained the following mean value concentrations. The mean value concentration of silicon in DPM was 0.94 wt %. The mean value concentration for nickel was 2.22 wt %. The mean value concentration for titan was 1.21 wt %, for potassium, it was 0.48 wt %, for strontium, it was 0.09 wt %, and for molybdenum, it was 1.32 wt % in DPM samples collected from different in-use diesel engine passenger vehicles.
The resulting concentrations of these chemical elements in the DPM matrix are connected to various processes involved in real vehicles. These are engine type, engine size, engine operation conditions, type of fuel, quality of fuel, composition of fuel, additives of fuel, lubricants of engine, performance of engine, particulate filters, catalytic reduction devices, engine deterioration, deterioration of engine components, etc. Therefore, further research is important to perform and identify individual sources of these elements in DPM.
4. Conclusions
The main task of this research was to spectrochemically analyse minor chemical elements contained in diesel particulate matter, by means of the high-resolution LIBS technique. In this study, we prove that LIBS can provide a sensitive qualitative as well as quantitative elemental composition of minor chemical elements. DPM was extracted from in-use diesel engine passenger vehicles of diverse types and models from major brand car producers in Europe. Qualitative spectrochemical analyses confirmed the presence of minor chemical elements—silicon, nickel, titan, potassium, strontium, and molybdenum in DPM. For quantitative analyses of LIBS results, we performed the calibration procedure. The laboratory internal calibration standards were prepared from major and minor chemical elements contained in DPM. Thus, the calibration functions for Si, Ni, Ti, K, Sr, and Mo were constructed by means of LIBS. Different concentrations of detected minor elements were measured with respect to the type of complex particulate matter. We provided data for the maximum, minimum, mean values, and median concentrations of minor chemical elements in DPM.
The exact composition of DPM exhaust emissions from in-use diesel engine passenger vehicles is related to different processes involved during the engine combustion as well as applied exhaust-filtering devices. Due to the complex processes involved within the combustion, the agglomeration of chemical elements in exhaust emissions occurred. These processes depend on the engine type, engine size, engine operation conditions, type of fuel, quality of fuel, additives, lubricants, and aftertreatment devices. All these conditions modify the exhaust emissions and final chemical composition of emitted PM from in-use diesel engine passenger vehicles. Up to now, it is not distinct which of these sources are mostly influencing the composition of DPM.
In the future, it is important to identify individual sources of major and minor chemical elements in the diesel exhaust emissions. It is necessary to find out where these elements come from. This would improve the general understanding of DPM formation. The classification of primary sources responsible for these elements would be important to acquire as well. Additionally, detailed information about chemical elements such as sulphur and chlorine were not yet specified. This is due to the current spectrometer limitation—spectral window gap in our spectrograph. Therefore, these spectral gaps would be important to explore, too.
The knowledge gained from these studies can be very beneficial for scientists and engineers to better understand the diesel particulate matter formation, for modeling of PM emissions generated from diesel engine vehicles, for the development of aftertreatment devices, and for future emission standards. All this information will help to minimise unwanted pollutant emissions from in-use diesel engine vehicles.
Author Contributions
R.V., C.W., W.B. contributed to the manuscript. For further details please contact the corresponding author. All authors have read and agreed to the published version of the manuscript.
Funding
The authors would like to thank the Linz Center of Mechatronics (LCM), project number K 24400/LCM for financial support. Open Access Funding by the Austrian Science Fund (FWF), project number P 27967. Austrian Science Fund: P 27967
Acknowledgments
The authors would like to thank Maria Rusnak for the proofreading and for the valuable corrections. Open Access Funding by Austrian Science Fund (Fonds zur Förderung der wissenschaftlichen Forschung) FWF (P 27967). Authors would like to acknowledge the financial support of the Linz Center of Mechatronics (LCM), project number K 24400/LCM.
Conflicts of Interest
The authors declare no conflict of interest.
References
- Ntziachristos, L.; Papadimitriou, G.; Ligterink, N.; Hausberger, S. Implications of Diesel emissions control failures to emission factors and road transport NOx evolution. Atmos. Environ. 2016, 141, 542–551. [Google Scholar] [CrossRef]
- Zacharof, N.; Tietge, U.; Franco, V.; Mock, P. Type approval and real-world CO2 and NOx emissions from EU light commercial vehicles. Energy Policy 2016, 97, 540–548. [Google Scholar] [CrossRef]
- Commission Regulation (EU) 2016/646. Commission Regulation (EU) 2016/646 of 20 April 2016 Amending Regulation (EC) (No 692/2008) as Regards Emissions from Light Passenger and Commercial Vehicles (Euro 6). Available online: http://eur-lex.europa.eu/eli/reg/2016/646/oj (accessed on 9 January 2020).
- Calderón-Garcidueñas, L.; Mora-Tiscareño, A.; Ontiveros, E.; Gómez-Garza, G.; Barragán-Mejía, G.; Broadway, J.; Chapman, S.; Valencia-Salazar, G.; Jewells, V.; Maronpot, R.R.; et al. Air pollution, cognitive deficits and brain abnormalities: A pilot study with children and dogs. Brain Cogn. 2008, 68, 117–127. [Google Scholar] [CrossRef] [PubMed]
- Block, M.L.; Calderon-Garciduenas, L. Air pollution: Mechanisms of neuroinflammation and CNS disease. Trends Neurosci. 2009, 32, 506–516. [Google Scholar] [CrossRef] [PubMed]
- Noll, R. Laser-Induced Breakdown Spectroscopy, Fundamentals and Applications; Springer: Berlin, Germany, 2012. [Google Scholar]
- Viskup, R.; Wolf, C.; Baumgartner, W. Qualitative and quantitative characterisation of major elements in particulate matter from in-use diesel engine passenger vehicles by LIBS. Energies 2020, 13, 368. [Google Scholar] [CrossRef]
- Viskup, R.; Wolf, C.; Baumgartner, W. Major Chemical Elements in Soot and Particulate Matter Exhaust Emissions Generated from In-Use Diesel Engine Passenger Vehicles, Introduction to Diesel Emissions, Richard Viskup. In Introduction to Diesel Emissions; IntechOpen: London, UK, 2020. [Google Scholar] [CrossRef]
- Miziolek, A.W.; Palleschi, V.; Schechter, I. Laser-Induced Breakdown Spectroscopy (LIBS): Fundamentals and Application; Cambridge University Press: New York, NY, USA, 2006. [Google Scholar]
- Cremers, D.A.; Radziemski, L.J. Handbook of Laser-Induced Breakdown Spectroscopy; John Wiley & Sons Inc.: New Delhi, India, 2013. [Google Scholar]
- Viskup, R. Single and Double Laser Pulse Interaction with Solid State–Application to Plasma Spectroscopy. In Nd YAG Laser; Dumitras, D.C., Ed.; InTech: Rijeka, Croatia, 2012; ISBN 978-953-51-0105-5. [Google Scholar] [CrossRef]
- Kramida, A.; Ralchenko, Y.; Reader, J.; NIST ASD Team National Institute of Standards and Technology NIST. Atomic Spectra Database. Available online: http://physics.nist.gov/asd (accessed on 9 January 2020).
Publisher’s Note: MDPI stays neutral with regard to jurisdictional claims in published maps and institutional affiliations. |
© 2020 by the authors. Licensee MDPI, Basel, Switzerland. This article is an open access article distributed under the terms and conditions of the Creative Commons Attribution (CC BY) license (http://creativecommons.org/licenses/by/4.0/).