Article

Numerical Modeling on the Fracturing and Energy Evolution of Large Deep Underground Openings Subjected to Dynamic Disturbance

1
School of Resources and Safety Engineering, Central South University, Changsha 410083, China
2
Research Center for Mining Engineering and Technology in Cold Regions, Central South University, Changsha 410083, China
3
Guangxi Gaofeng Mine Co. Ltd., Hechi 547205, China
*
Author to whom correspondence should be addressed.
Energies 2020, 13(22), 6102; https://doi.org/10.3390/en13226102
Submission received: 15 October 2020 / Revised: 17 November 2020 / Accepted: 18 November 2020 / Published: 22 November 2020

Abstract

:
The exploitation of deep resources is necessary for human development. At the same time, high-stress environments that are deep underground bring about great challenges vis-à-vis resource exploitation. A large deep opening is sensitive to high ground stress, and is easily influenced by external interference, which can lead to geologically hazardous occurrences. To investigate the evolution of fracturing and energy in large, deep stopes subjected to dynamic loads, we established a numerical model of a stope in the Gaofeng mine. Using ANSYS/LS-DYNA software, we implemented an implicit solution to initial static stress and an explicit solution for dynamic analysis. Based on our numerical results, we obtained the fracture behavior and energy evolution under coupled static and dynamic loads. To determine the response of ground pressure to mining activity, a 24-channel microseismic monitoring system was designed for the Gaofeng mine based on the numerical analysis.

1. Introduction

As human activities developed, rock engineering continued to occur underground via the exploitation of deep mines, the creation of hydropower station chambers, the production of underground oil and gas storage caverns, the utilization of underground carbon dioxide storage sites, and so on [1,2]. The high-stress environment of a deep rock mass threatens the safety of workers and machinery. Because deep resources are needed to develop human society, disaster control during the development of deep resources has become a challenge [3,4]. It is well known that the source of stress in deep mines is the superposition of original geo-stress and mining-induced stress [5]. Geo-stress continuously accumulates with the formation of overlying strata, and excavation disturbs the in situ stress in the rock mass. Therefore, the original stress can be redistributed around deep openings and high-energy regions can appear in critical areas due to the stress concentration effect [6].
Ore and rock masses store energy, and when energy is concentrated and disturbed by the appropriate dynamic amplitude, the stress state of those materials exceeds its strength, leading to collapse and rock burst disaster [7]. The main factors that lead to rock disaster are dynamic disturbances and high ground stress in deep rock engineering [8]. Although various new rock breaking technologies have been applied to rock breaking, drilling and blasting methods are still the main methods used in mining due to their high efficiency and easy operation. Because of its high frequency and high energy characteristics, the blasting load is the most significantly incurring factor that induces geotechnical disasters [9,10]. The coupled static-dynamic loading theory plays a significant role when investigating the mechanical and energy characteristics of deep hard rocks [11]. This theory is widely used during an experimental investigation or numerical simulation of deep rock mass fracturing behavior subjected to dynamic disturbances [12,13]. Many studies regarding the failure behaviors of deep tunnels or roadways with different shapes under dynamic disturbances have been theoretically or numerically performed. Results have indicated that the failure behavior of deep engineering is governed by rock mass properties, initial stress state, engineering geometry, dynamic disturbance direction, and amplitude, among other factors [14,15,16]. However, compared with tunnels, mine stopes are larger, which is a disadvantage for safe production. On the other hand, the stability of the stope plays a vital role in workforce and underground equipment safety, as well as mine production, capacity, and profitability; therefore, the failure behavior of openings should be evaluated [17,18]. For a large opening that is a short distance from the blasting source, the risk factor is very high. The dynamic loading failure of a deep rock mass is a mutation process; therefore, it is of great significance to study the fracturing of deep stopes under high ground stress and dynamic disturbance [19].
The No. 105 orebody of Guangxi Gaofeng Mine Co., Ltd., has entered the deep mining stage. Evidence of significant geo-stress has been observed often, such as the frequent occurrence of visible floor heaves in roadways and the sound of rocks cracking in the underground chamber. The process of rock mass fracturing is accompanied by a considerable energy release, so it is difficult to directly observe fracturing [20,21]. In order to study rock characteristics under coupled static and dynamic loading, some experimental devices have been developed to investigate rock dynamic behavior under high static stress [22]. Some rock samples with different cavity shapes have been tested with these deep rock mechanics experimental apparatuses, but the results may be limited by the sample dimension and may not reflect the rock properties encountered in engineering problems [23,24]. Furthermore, experimental testing is labor-intensive, time-consuming, and expensive [25,26]. With the continuous development of computer science and technology, numerical simulation has been widely used in research with a high efficiency and low cost [27]. In a previous study, the structural parameters of the deep stope in the Gaofeng mine were optimized based on the combination of a numerical simulation method and the chart method. In this study, a high-stress stope model in the Gaofeng mine, which was used to study the dynamic failure process of deep structures under dynamic loads, was implemented into the ANSYS/LS-DYNA software, a general explicit dynamic analysis software program that analyzed the structure’s dynamic responses to disturbances such as blasting, impacting, drilling, and cutting [28,29]. An implicit solution to the initial static stress and an explicit solution for dynamic analysis were presented via an implicit–explicit conversion algorithm. Aiming at providing a guide for engineering practices, the failure behaviors and energy evolution rules in the vicinity of large stopes under the action of high-amplitude dynamic disturbances are herein summarized on the basis of the numerical results.

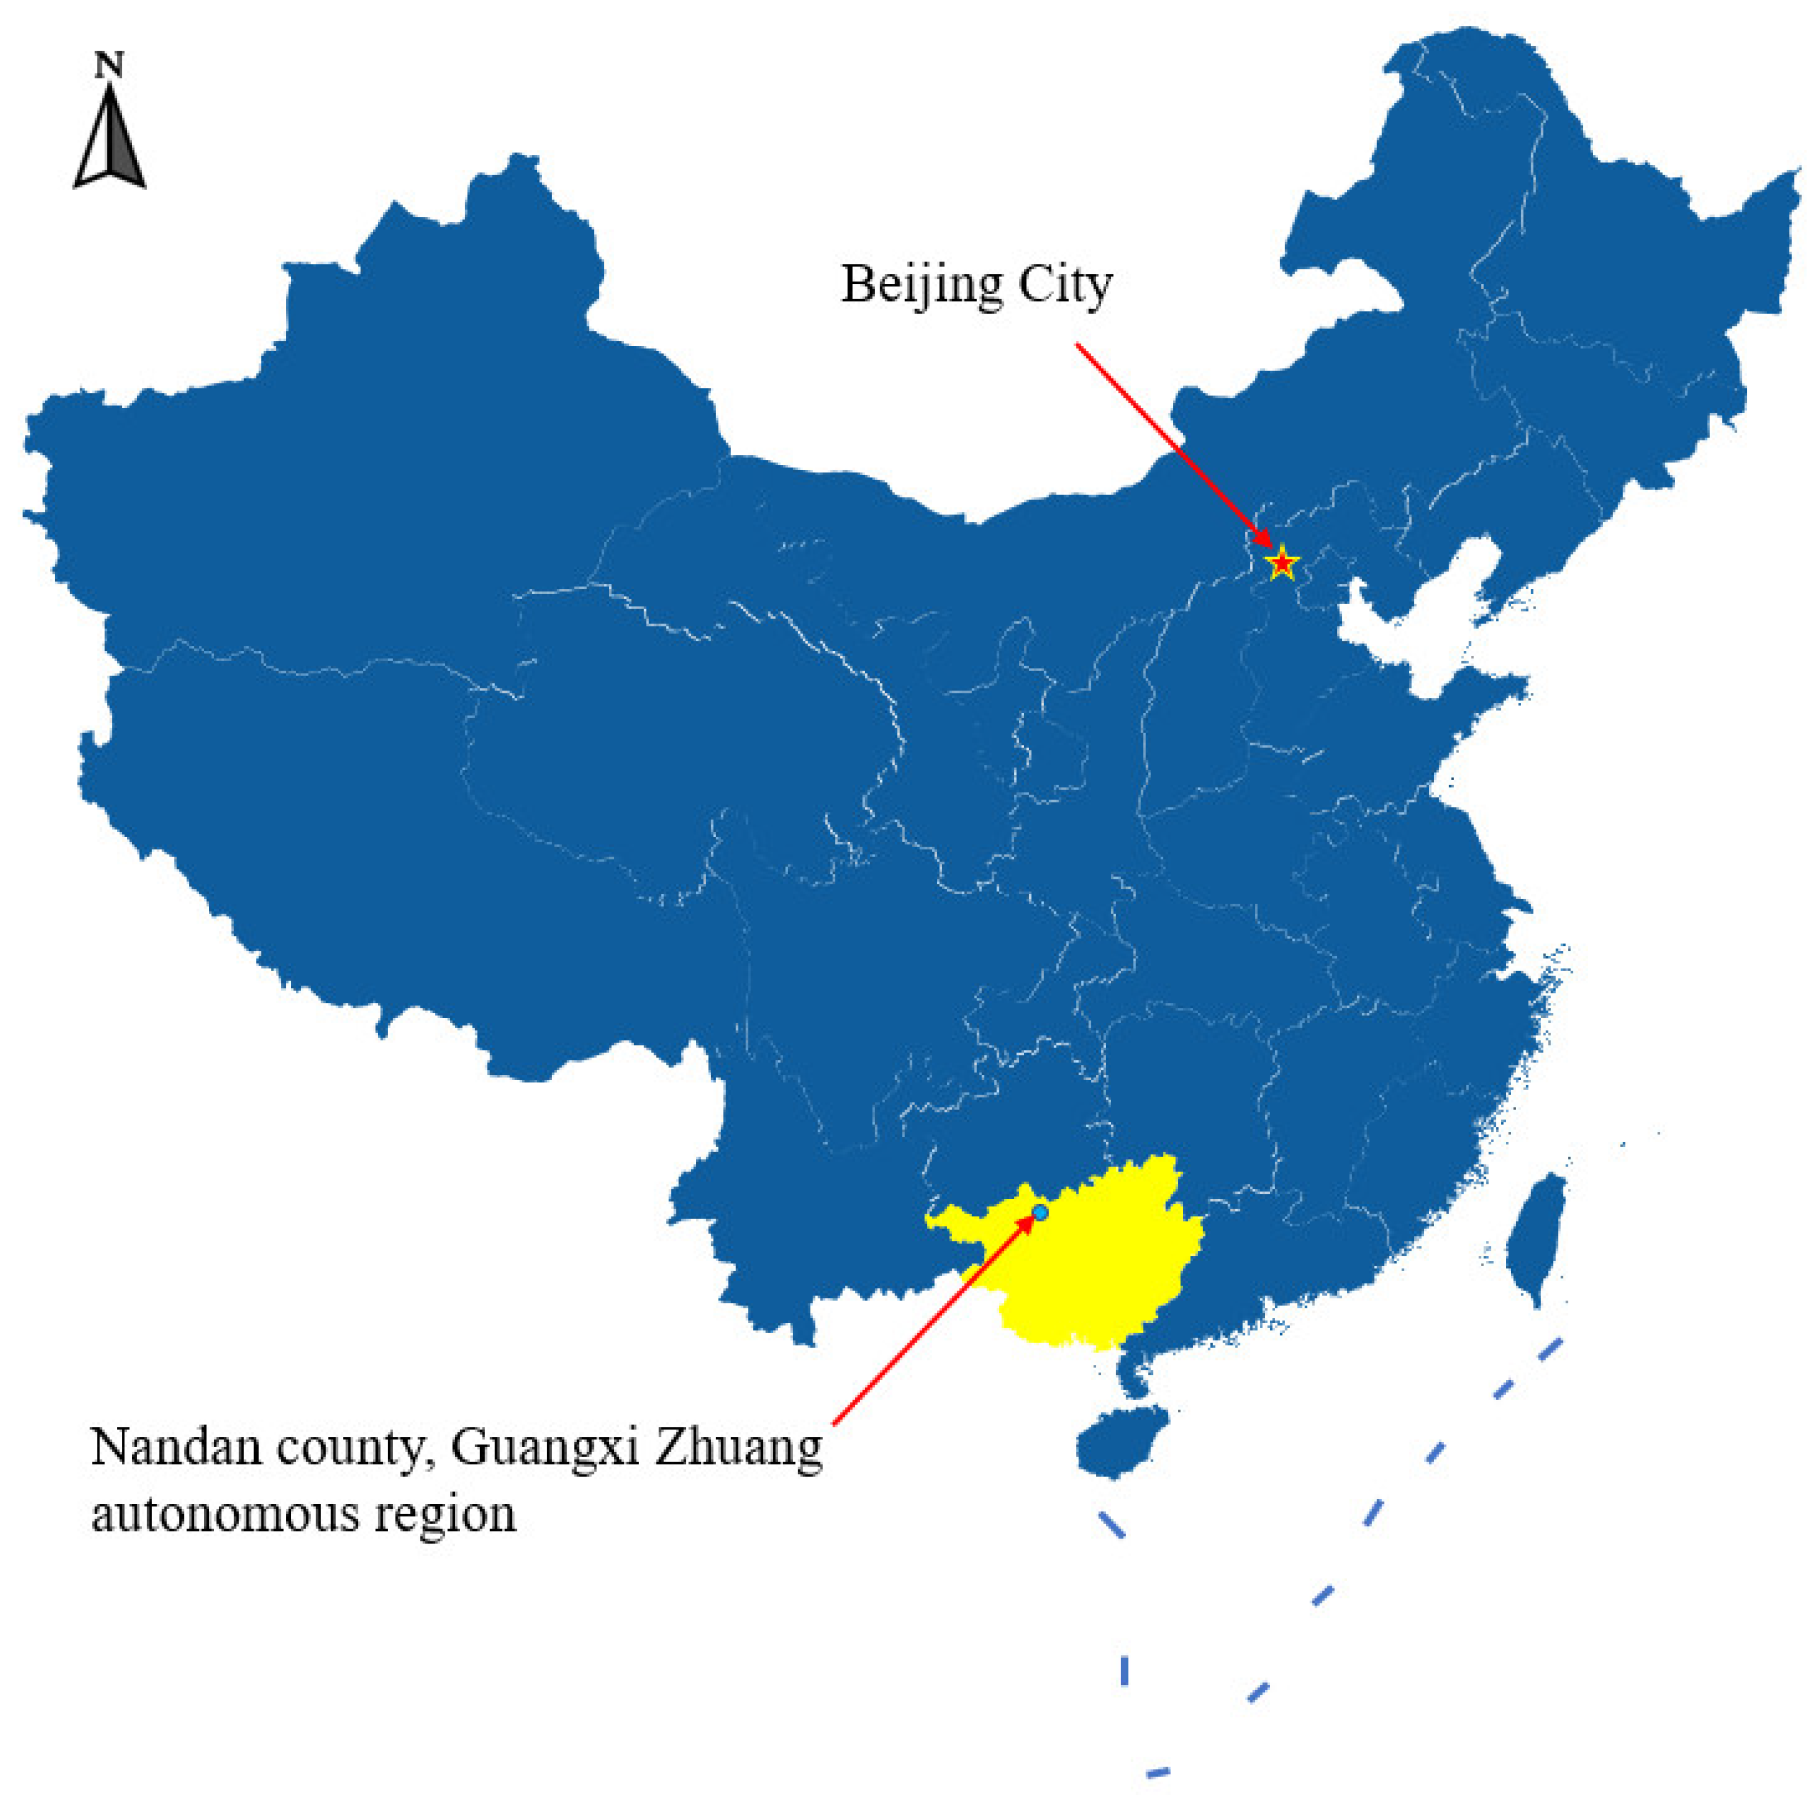
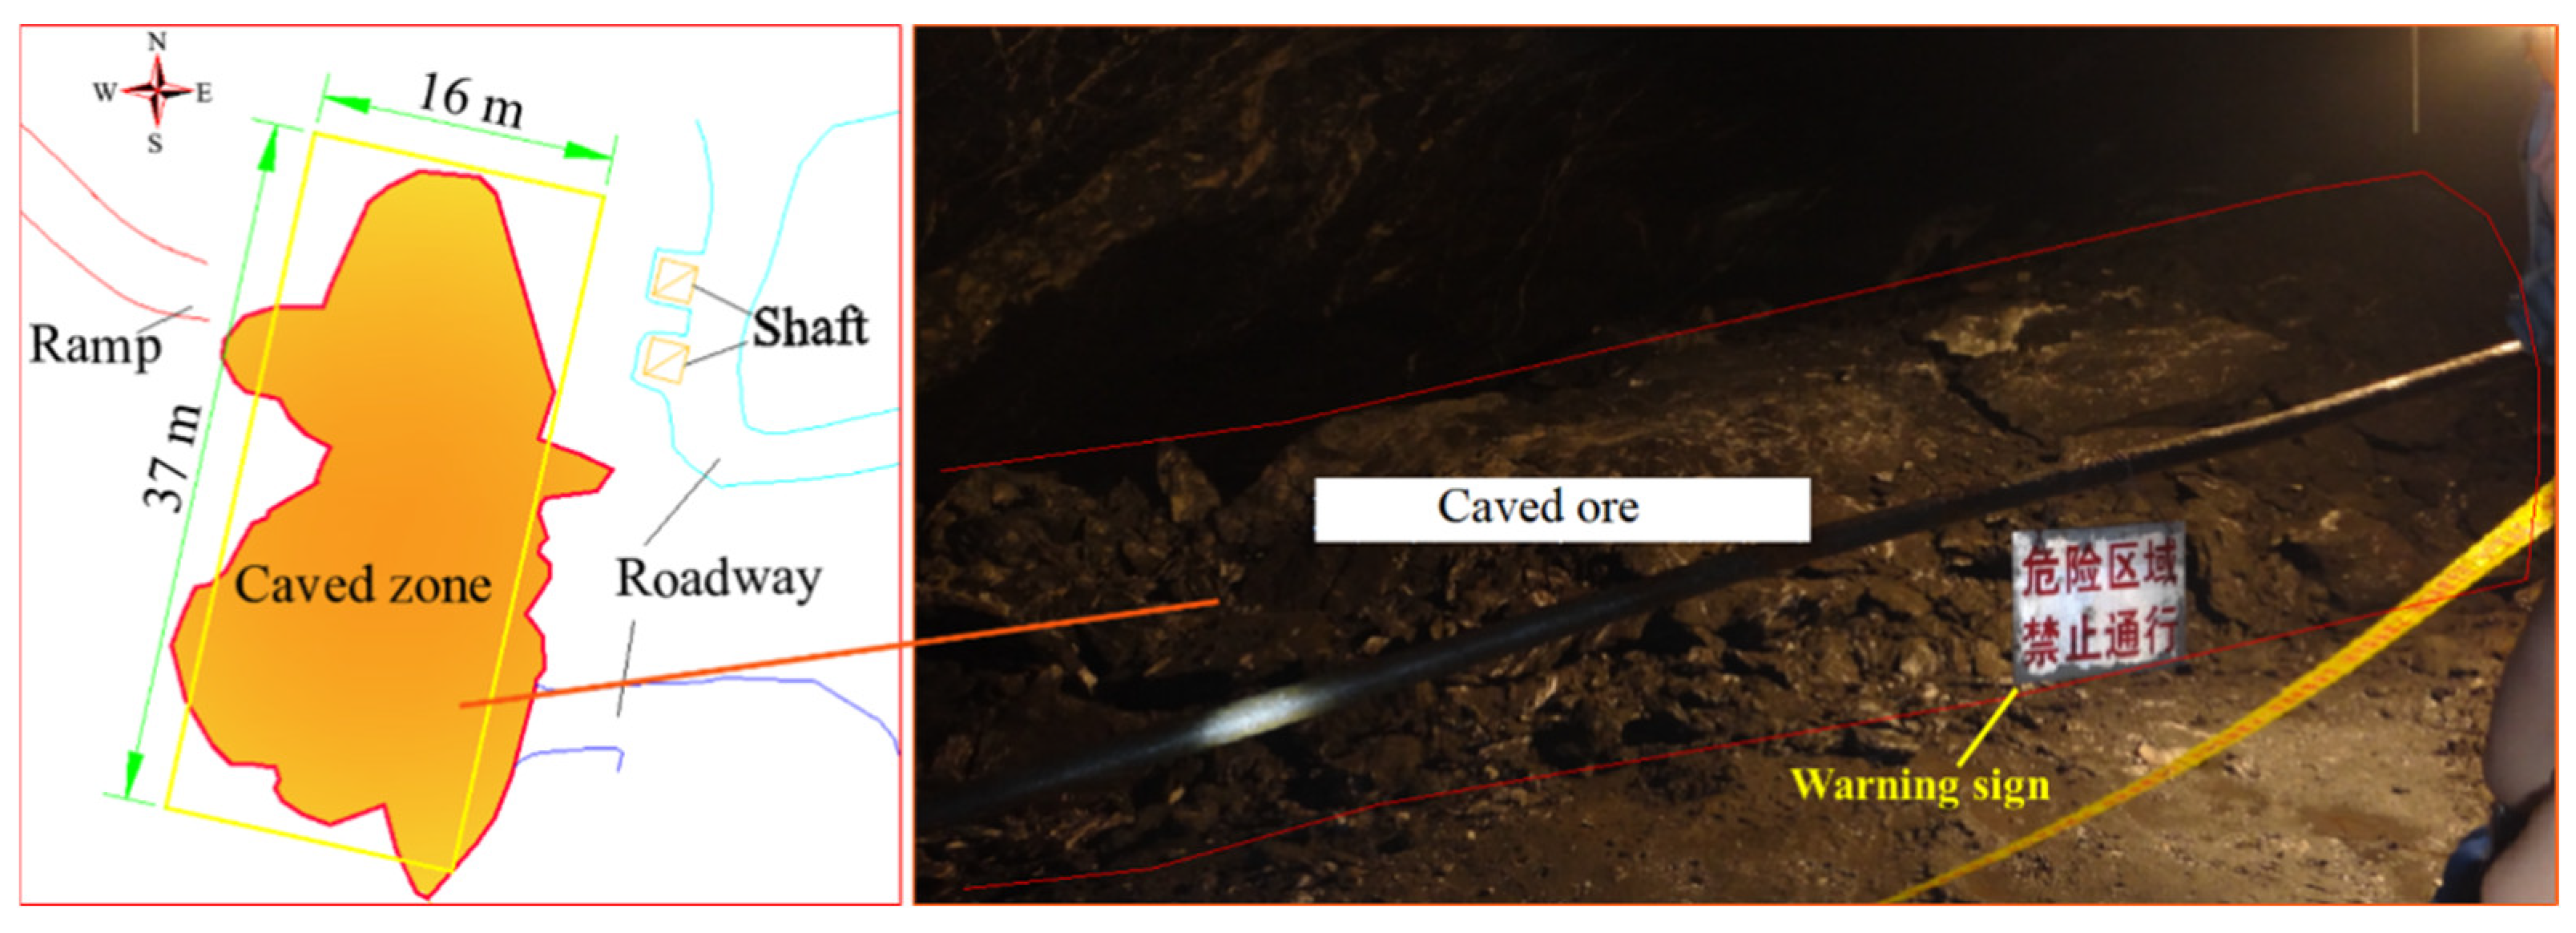
2. A Caving Case Induced by Dynamic Disturbances
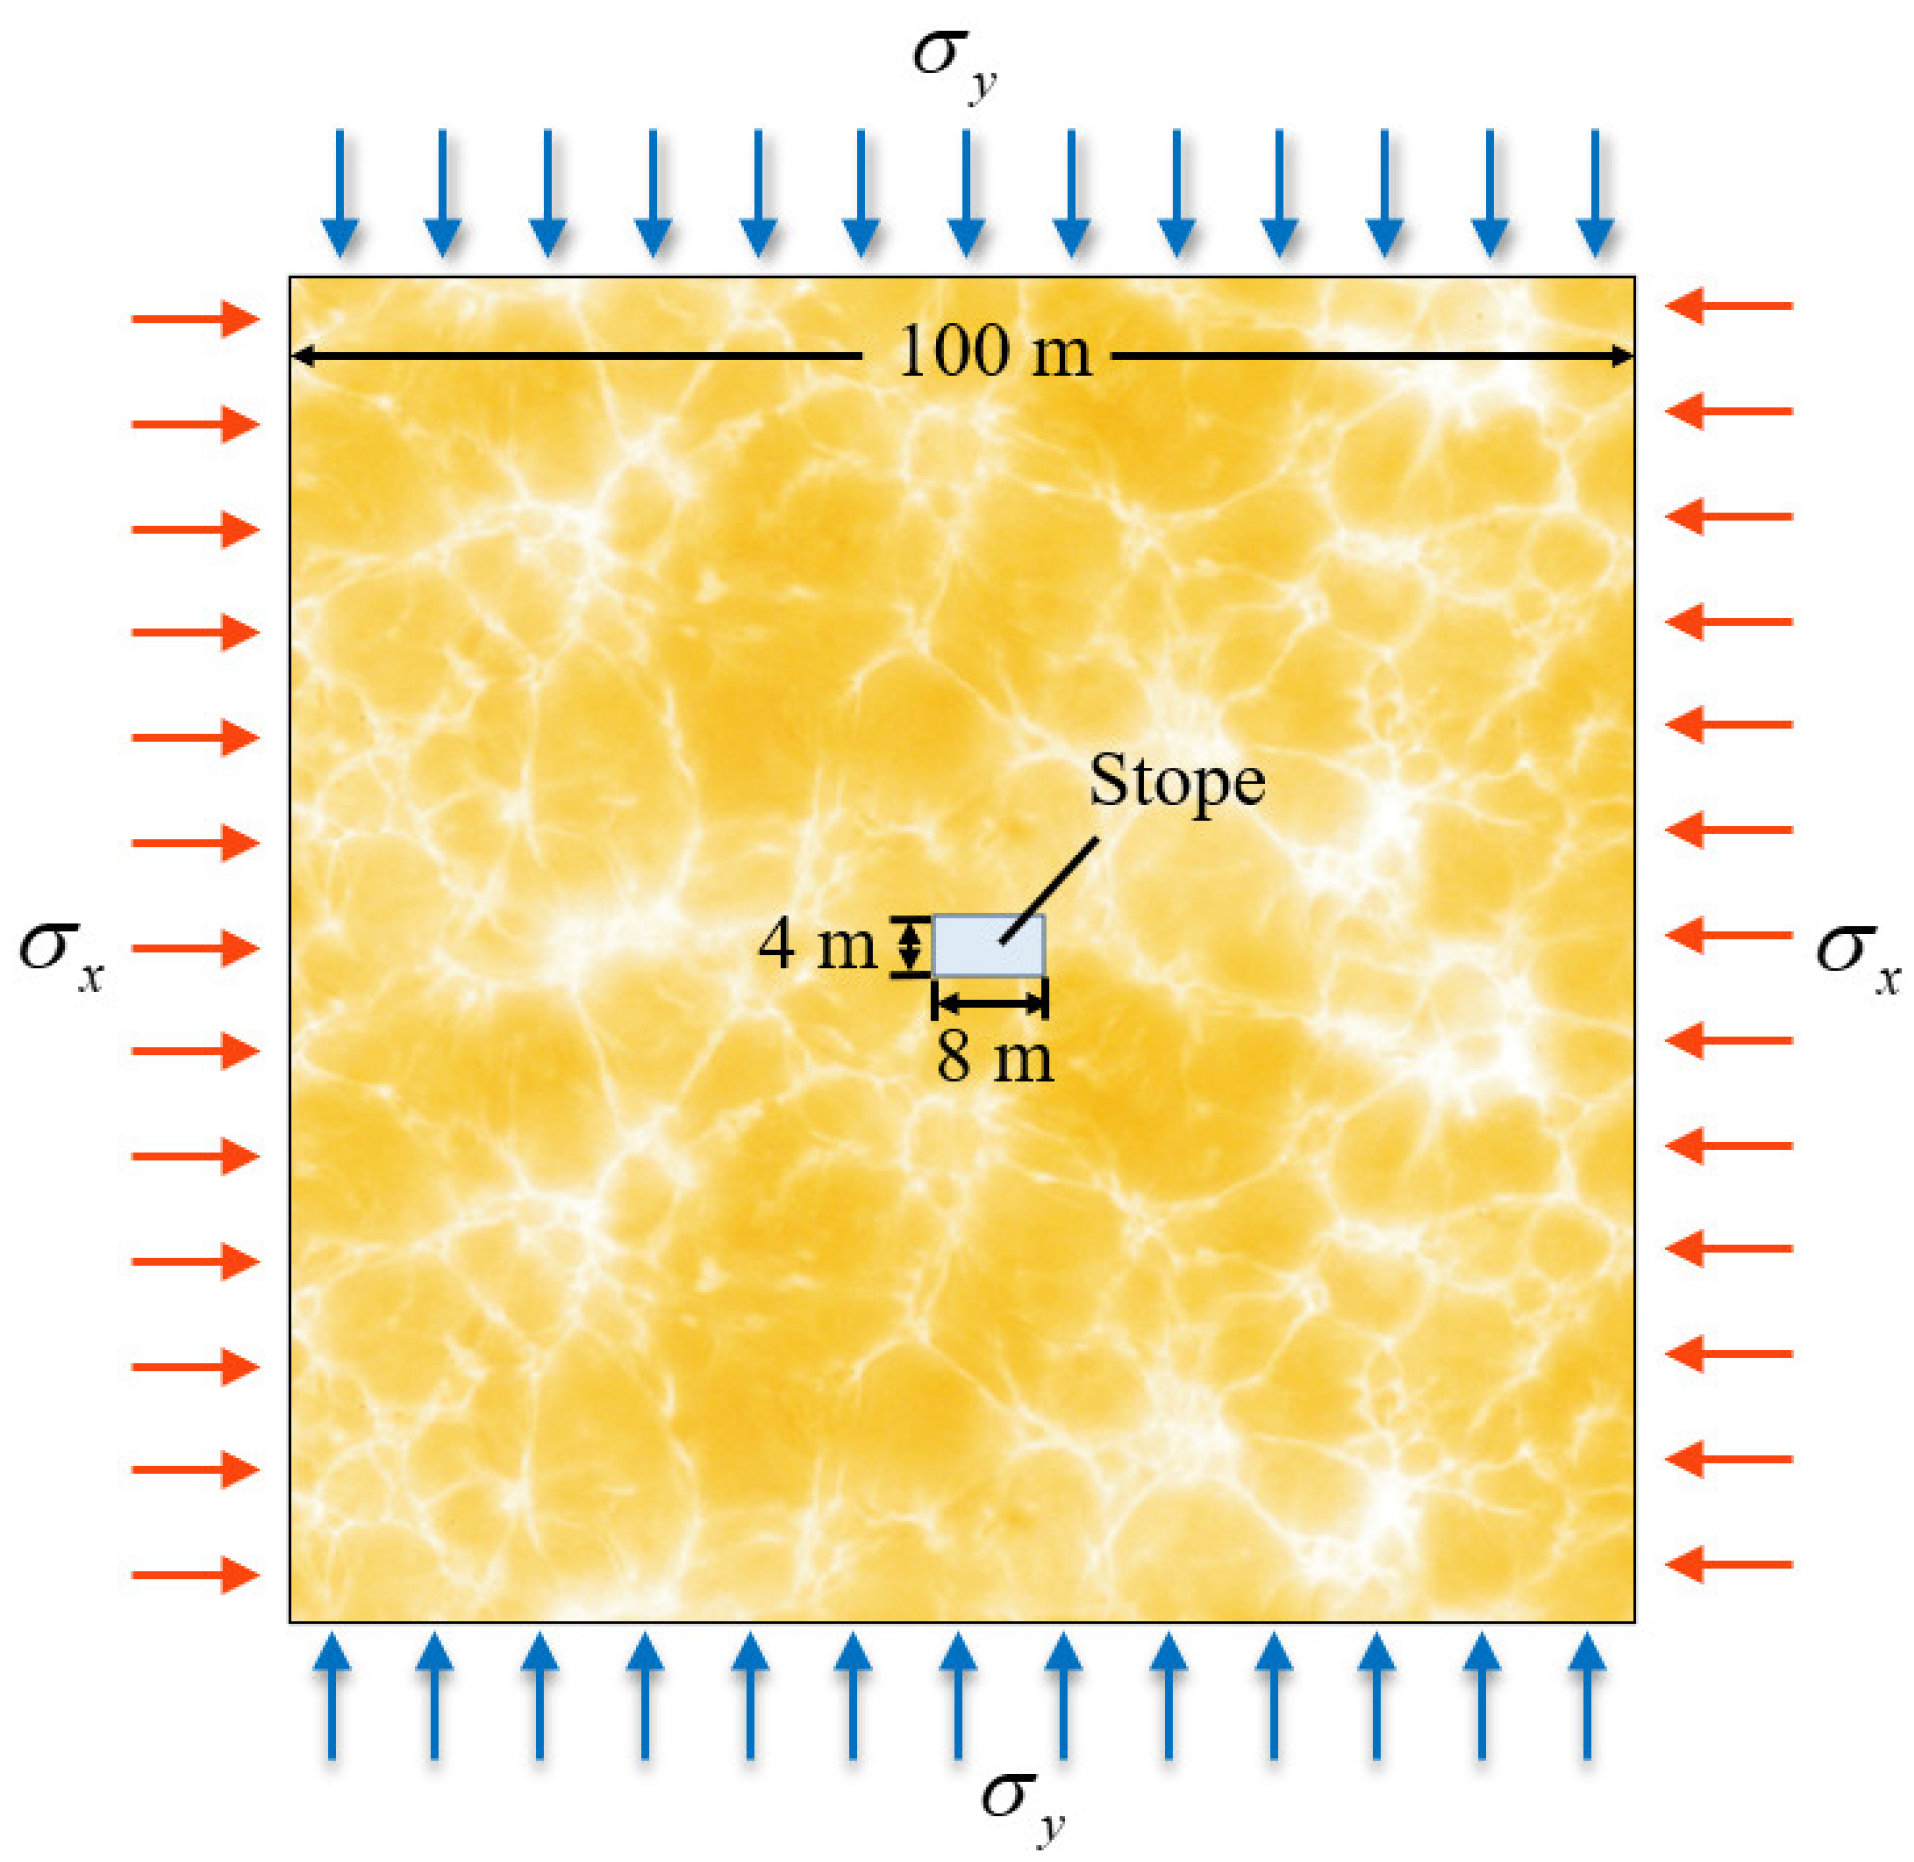
As shown in Figure 1, the Gaofeng mine is located in Nandan County, Guangxi Zhuang Autonomous Region, China. The mining area is characterized by a subtropical monsoon mountain climate. On average, it receives 1300 to 1600 mm of rainfall a year. Its surface elevation around No. 105 orebody varies from 680 m to 900 m, and its main shaft is 723 m. Currently, the main mining depth is maintained at −200 m, and it targets deep reserves. The orebody strike length varies between 100 m to 300 m, and the horizontal thickness varies between 10 m to 70 m, and it trends nearly north and south. The surrounding rock mainly consists of reef limestone, granite, and shale. It is of a high grade tin polymetallic ore body, and the typical characteristic of the ore contains sulfide. The integrated average grade of major useful metals including tin, zinc, lead, and antimony is about 22%, which contributes to enormous economic benefits. The main mining method is the upward horizontal cut and fill stoping method. Due to the limited capacity of the filling system, the cavity cannot be filled quickly; therefore, the stability of the cavity is an important problem.
A caving accident occurred in the No. 1 stope at the −179 m level, as shown in Figure 2. The structural parameters of the stope are as follows. It is perpendicular to the strike of the orebody. The width is 16 m and the length, which is the thickness of the orebody, is 37 m. In addition to the long pan, the surrounding rock mass is also broken, and both are disadvantageous for stope stability. The structural parameters of the caving region are as follows: the width is 4 m, the length is 10 m, and the average thickness is 2 m. The burst rocks were mainly in the shapes of slices and lenses. Furthermore, workers in the ramp heard clear cracking sounds and an ejection, which they said was similar to a gunshot. After a field investigation and analysis were performed, it was believed that the main cause of the accident was the long span of the roof without a pillar, which caused a stress redistribution and high geo-stress concentration in the roof; finally, caving was induced by the blasting stress wave from a nearby stope. For safety reasons and as a precaution, the workers cleared loose stones from the surface of the roof, and the cavity was filled quickly.

3. Numerical Model

3.1. Boundary Conditions for the Static Solution

The orebody thickness in the study area varied between 20 m to 50 m, and the general axis of the stope was perpendicular to the strike of the orebody. Because of the air drifter’s poor efficiency, the length of the caving step along the general axis of the stope was about 6 m. Under these circumstances, stope width and layer height played a significant role in stability and production capacity. Reasonable stope structural parameters were obtained via the Mathews stability graph approach, which provided a guide for the subsequent numerical simulation scheme. Then, optimization of the structural parameters of the stope was implemented in the finite difference software FLAC3D. Finally, the optimal structural parameters for the Gaofeng mine were determined, and the width of the first mining step was 8 m [30]. Considering the capacity of the filling system, the layer height remained 4 m.
To reduce calculation costs, the numerical model was simplified to a quasi-plane strain model [31], as shown in Figure 3. The thickness of the numerical model equaled the side length of a single element. The sides of the square model were 100 m, and the model consisted of 111,512 hexahedral elements. The boundary conditions for the implicit solution are shown in Figure 3. A uniform stress load was applied to the left and right sides, as well as the top and bottom of the model. According to the measured geo-stress data at the −200 m level, σ x = 30.60 MPa and σ y = 20.22 MPa.

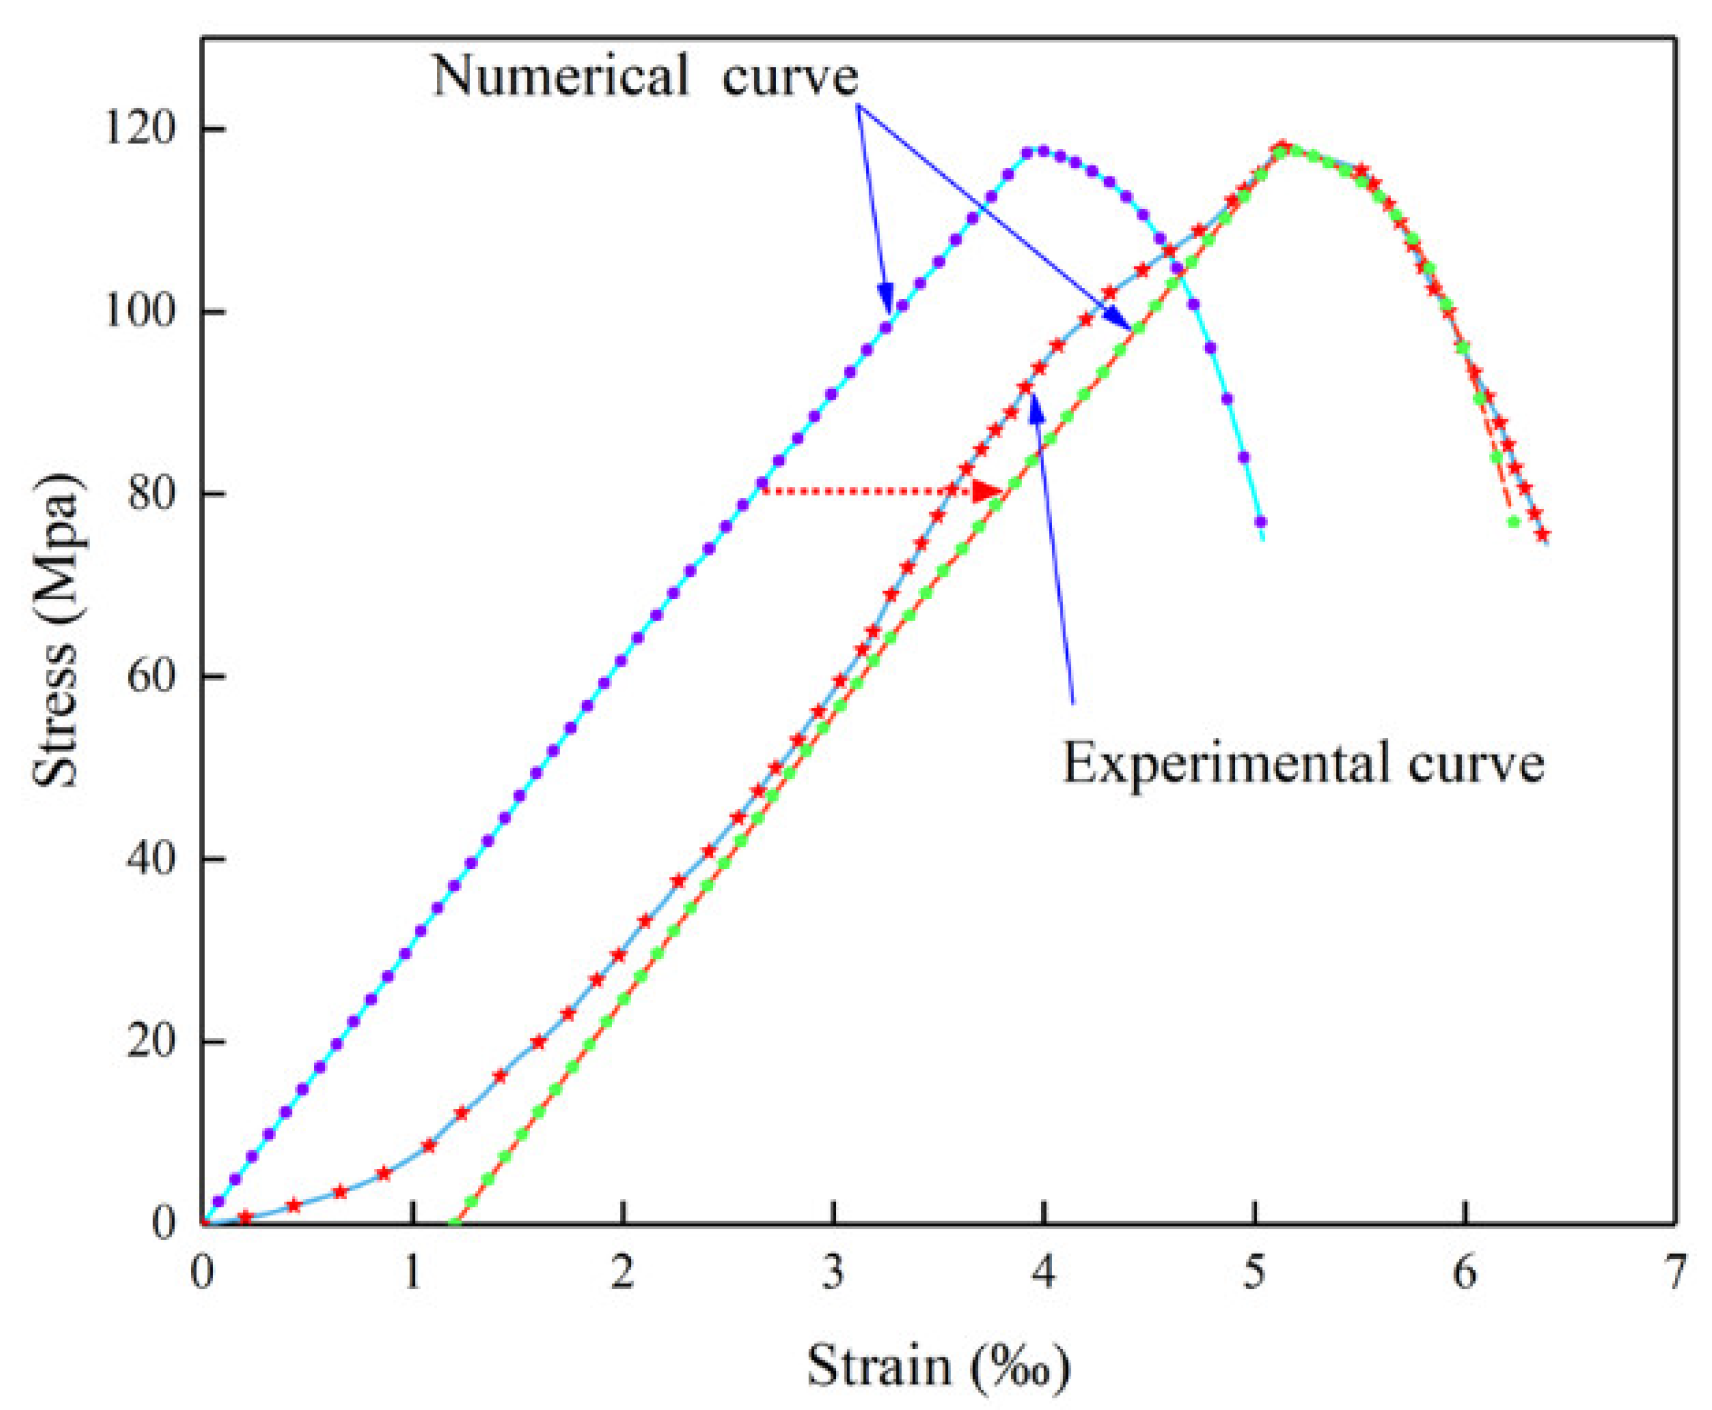
3.2. Material Parameters

Material models appropriate for rock or concrete such as MAT_PLASTIC_KINEMATIC, MAT_BRITTLE_DAMAGE, MAT_JOHNSON_HOLMQUIST_CONCRETE, MAT_CSCM, and MAT_RHT were included in the LS-DYNA database [32]. Suitable material models were selected according to the requirements for different analyses, such as the strain rate effect, failure, and damage output. Although there were many material models available for rock in the material database, those that supported an algorithm for explicit and implicit conversion were limited. In this study, we needed to obtain the solution of the initial geo-stress. Then, the dynamic response of the rock mass under dynamic disturbance was obtained. The MAT_CSCM (continuous surface cap model) material model is a smooth or continuous surface cap model available for solid elements in LS-DYNA and it supported the explicit and implicit conversion algorithm. The material model included an isotropic constitutive equation, and hardening, damage, and rate effects were taken into account in this constitutive model. This model has been widely used in the dynamic analysis of reinforced concrete and rock.
The yield surface was defined in terms of three stress invariants: J 1 is the first invariant of the stress tensor, J 2 ʹ is the second invariant of the deviatoric stress tensor, and J 3 ʹ is the third invariant of the deviatoric stress tensor. All of these stress invariants can be written as:
J 1 = 3 P
J 2 ʹ = 1 2 S i j S i j
J 3 ʹ = 1 3 S i j S j k S k i
where S i j , S j k , and S k i denote the deviatoric stress tensors; P is pressure.
These three invariants and the cap hardening parameter, κ are the basis for the yield function:
f ( J 1 , J 2 ʹ , J 3 ʹ , κ ) = J 2 ʹ 2 F f 2 F C
where F f is the shear failure surface, denotes the Rubin three-invariant reduction factor, and F c represents the hardening cap. The Rubin three-invariant reduction factor determines the strength of the material for any state of stress relative to the strength under triaxial compression (TXC).
When the material is in a state of tension with a low confining pressure, the shear surface is used to determine the strength of the material:
F f ( J 1 ) = α λ exp β J 1 + θ J 1
The values of α , β , λ , and θ are selected by fitting the model surface to strength measurements from TXC tests conducted on plain concrete cylinders. The strength of the material is modeled by a combination of the cap and shear surfaces in high confining pressure regimes. The isotropic hardening cap is a two-part function that is either unified or an ellipse:
F c ( J 1 , κ ) = 1 [ J 1 L ( κ ) ] [ | J 1 L ( κ ) | + J 1 L ( κ ) ] 2 [ X ( κ ) ( κ ) ] 2
where L ( κ ) can be written as:
L ( κ ) = { κ    if κ > κ 0 κ 0    otherwise
X ( κ ) = L ( κ ) + R F f ( L ( κ ) )
where R is the cap ellipticity ratio (the ratio of its major to minor axes) and κ 0 is the value of J 1 at the initial intersection of the cap and shear surfaces before hardening occurs (before the cap moves).
Strength under torsion (TOR) and triaxial extension (TXE) are modeled as Q 1 F f and Q 2 F f , respectively, where
Q 1 = α 1 λ 1 exp β 1 J 1 + θ 1 J 1
Q 2 = α 2 λ 2 exp β 2 J 1 + θ 2 J 1
The parameters α 1 , λ 1 , β 1 , θ 1 , α 2 , λ 2 , β 2 , and θ 2 can be determined based on the experimental data from the TOR and TXE tests, respectively, when the pressure is compressive.
In the constitutive model, the damage parameter d is defined via the brittle damage and ductile damage, ranging from zero, for no damage, to one, for complete damage. Brittle damage accumulates under tensile stress that exceeds the brittle damage threshold. Brittle damage accumulation depends on the maximum principal strain, ε max , which can be written as:
τ b = E ε max 2
where τ b is an energy-type term and E is Young’s modulus.
Ductile damage accumulates under compressive stress and depends on the total strain component, ε i j , as shown in the following Equations.
τ d = 1 2 σ i j ε i j
where τ d is an energy-type term and σ i j is the stress component.
This model provides the user with some default parameters for normal strength concrete, and the parameters fit data reflecting unconfined compressive strengths between approximately 20 MPa and 58 MPa. For rock materials with a high strength, according to the experimental data, the user-defined parameters can be used [33].
To ensure that the simulation results fit well with the actual conditions of the stope in the Gaofeng mine, the numerical simulation parameters were checked against mechanical test results. Due to a large number of numerical simulation parameters, the laboratory test results were not sufficiently comprehensive, and some parameters were assigned the default value. The numerical simulation was accurate only when the numerical experimental data fit the laboratory test results well [34].
As the line with the red stars in Figure 4 shows, the experimental stress–strain curve of the ore has a uniaxial compressive strength of 117.84 MPa. After multiple verifications, the numerical results of the single-element test fit the experimental results well, and the final numerical parameters used for the ore are shown in Table 1. Due to the lack of fractures and pores in the numerical model, there was no compaction stage in the numerical curve.

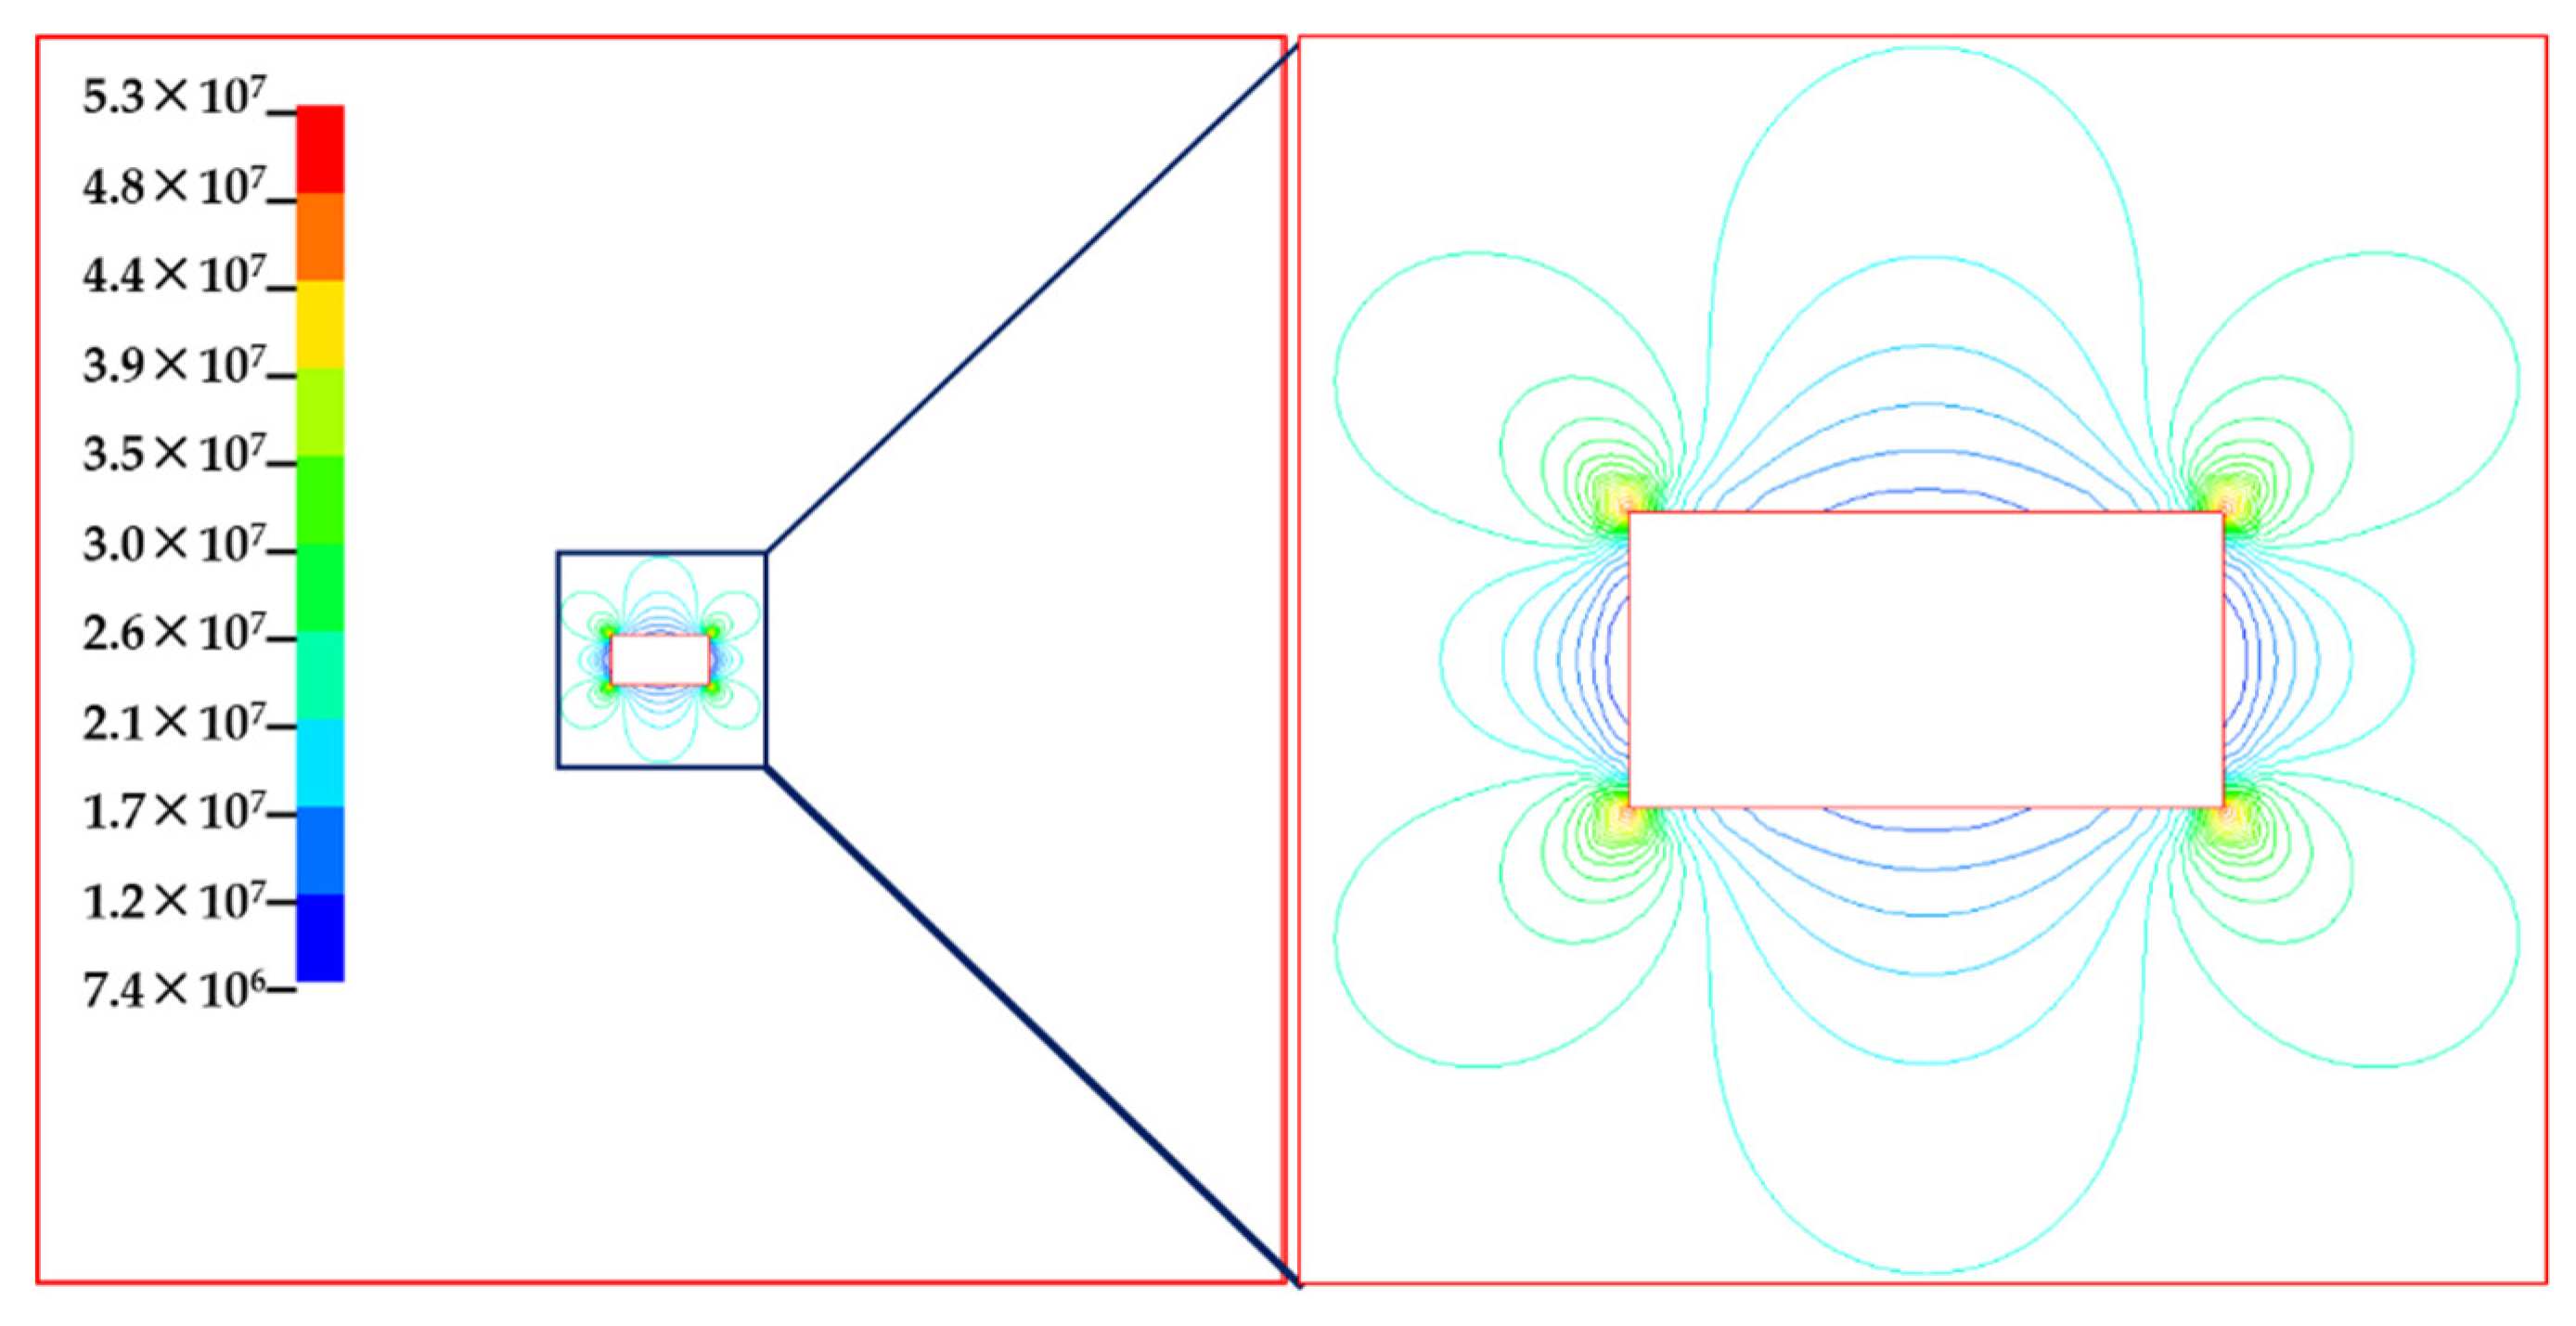
3.3. Solution of Geo-Stress

The numerical simulation consisted of two stages: (1) implicit solution of geo-stress; (2) explicit solution of dynamic disturbance by introducing the initial stress state obtained from stage 1. The solution of geo-stress, shown in Figure 5, shows all regions around the stope in the compressive state under the stress boundary condition influence and stope geometry [35]. Figure 5 shows that the area of stress distribution in the vertical direction was larger than in the horizontal direction. Because the stope model in the numerical simulation was a rectangle, the stress concentration appeared in the corner of the stope, and the maximum stress rose to 52.98 MPa. The implicit solution only provided the initial geo-stress for the explicit solution, so the displacement data was deleted by modifying some commands [36].

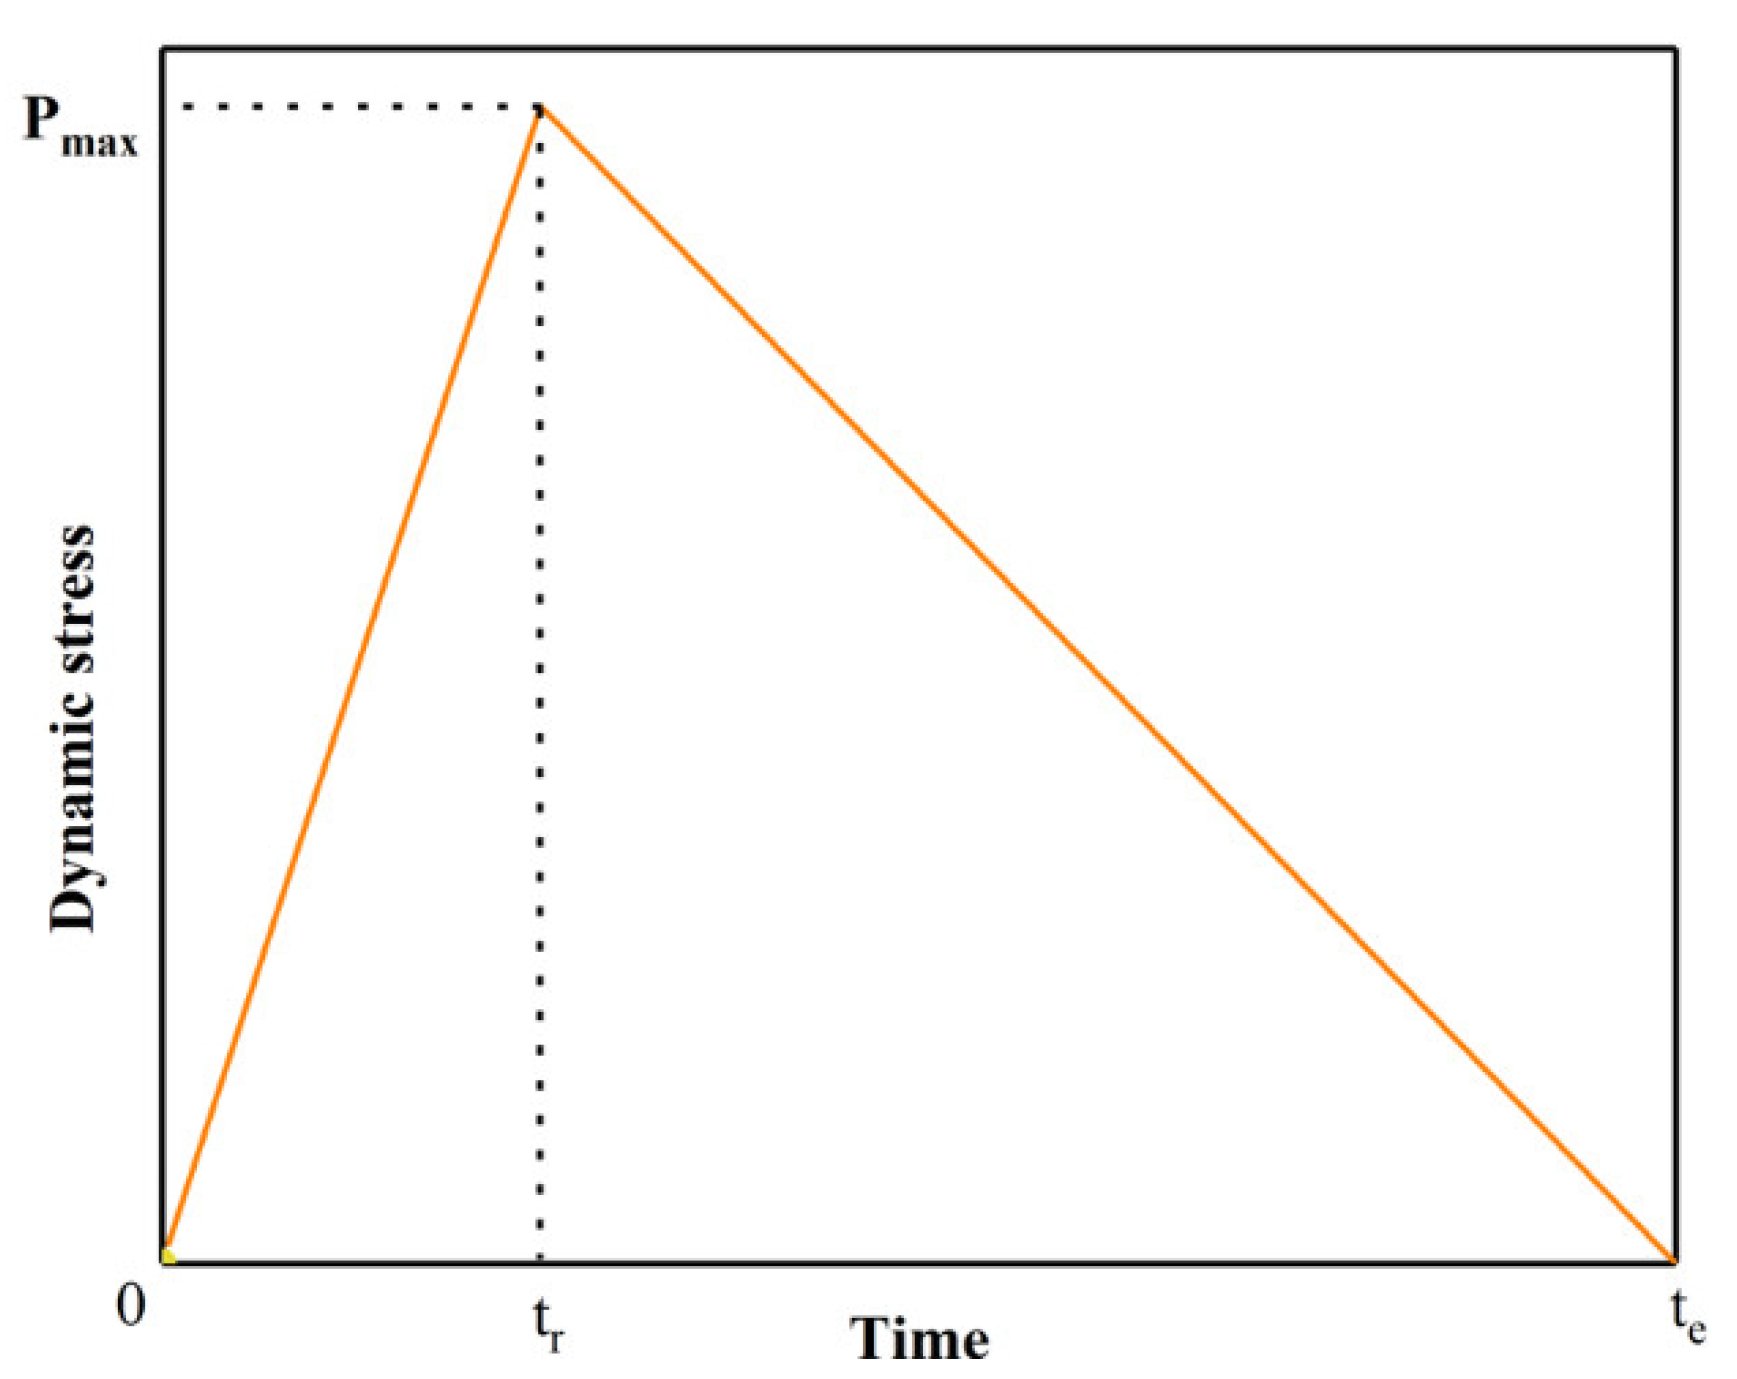
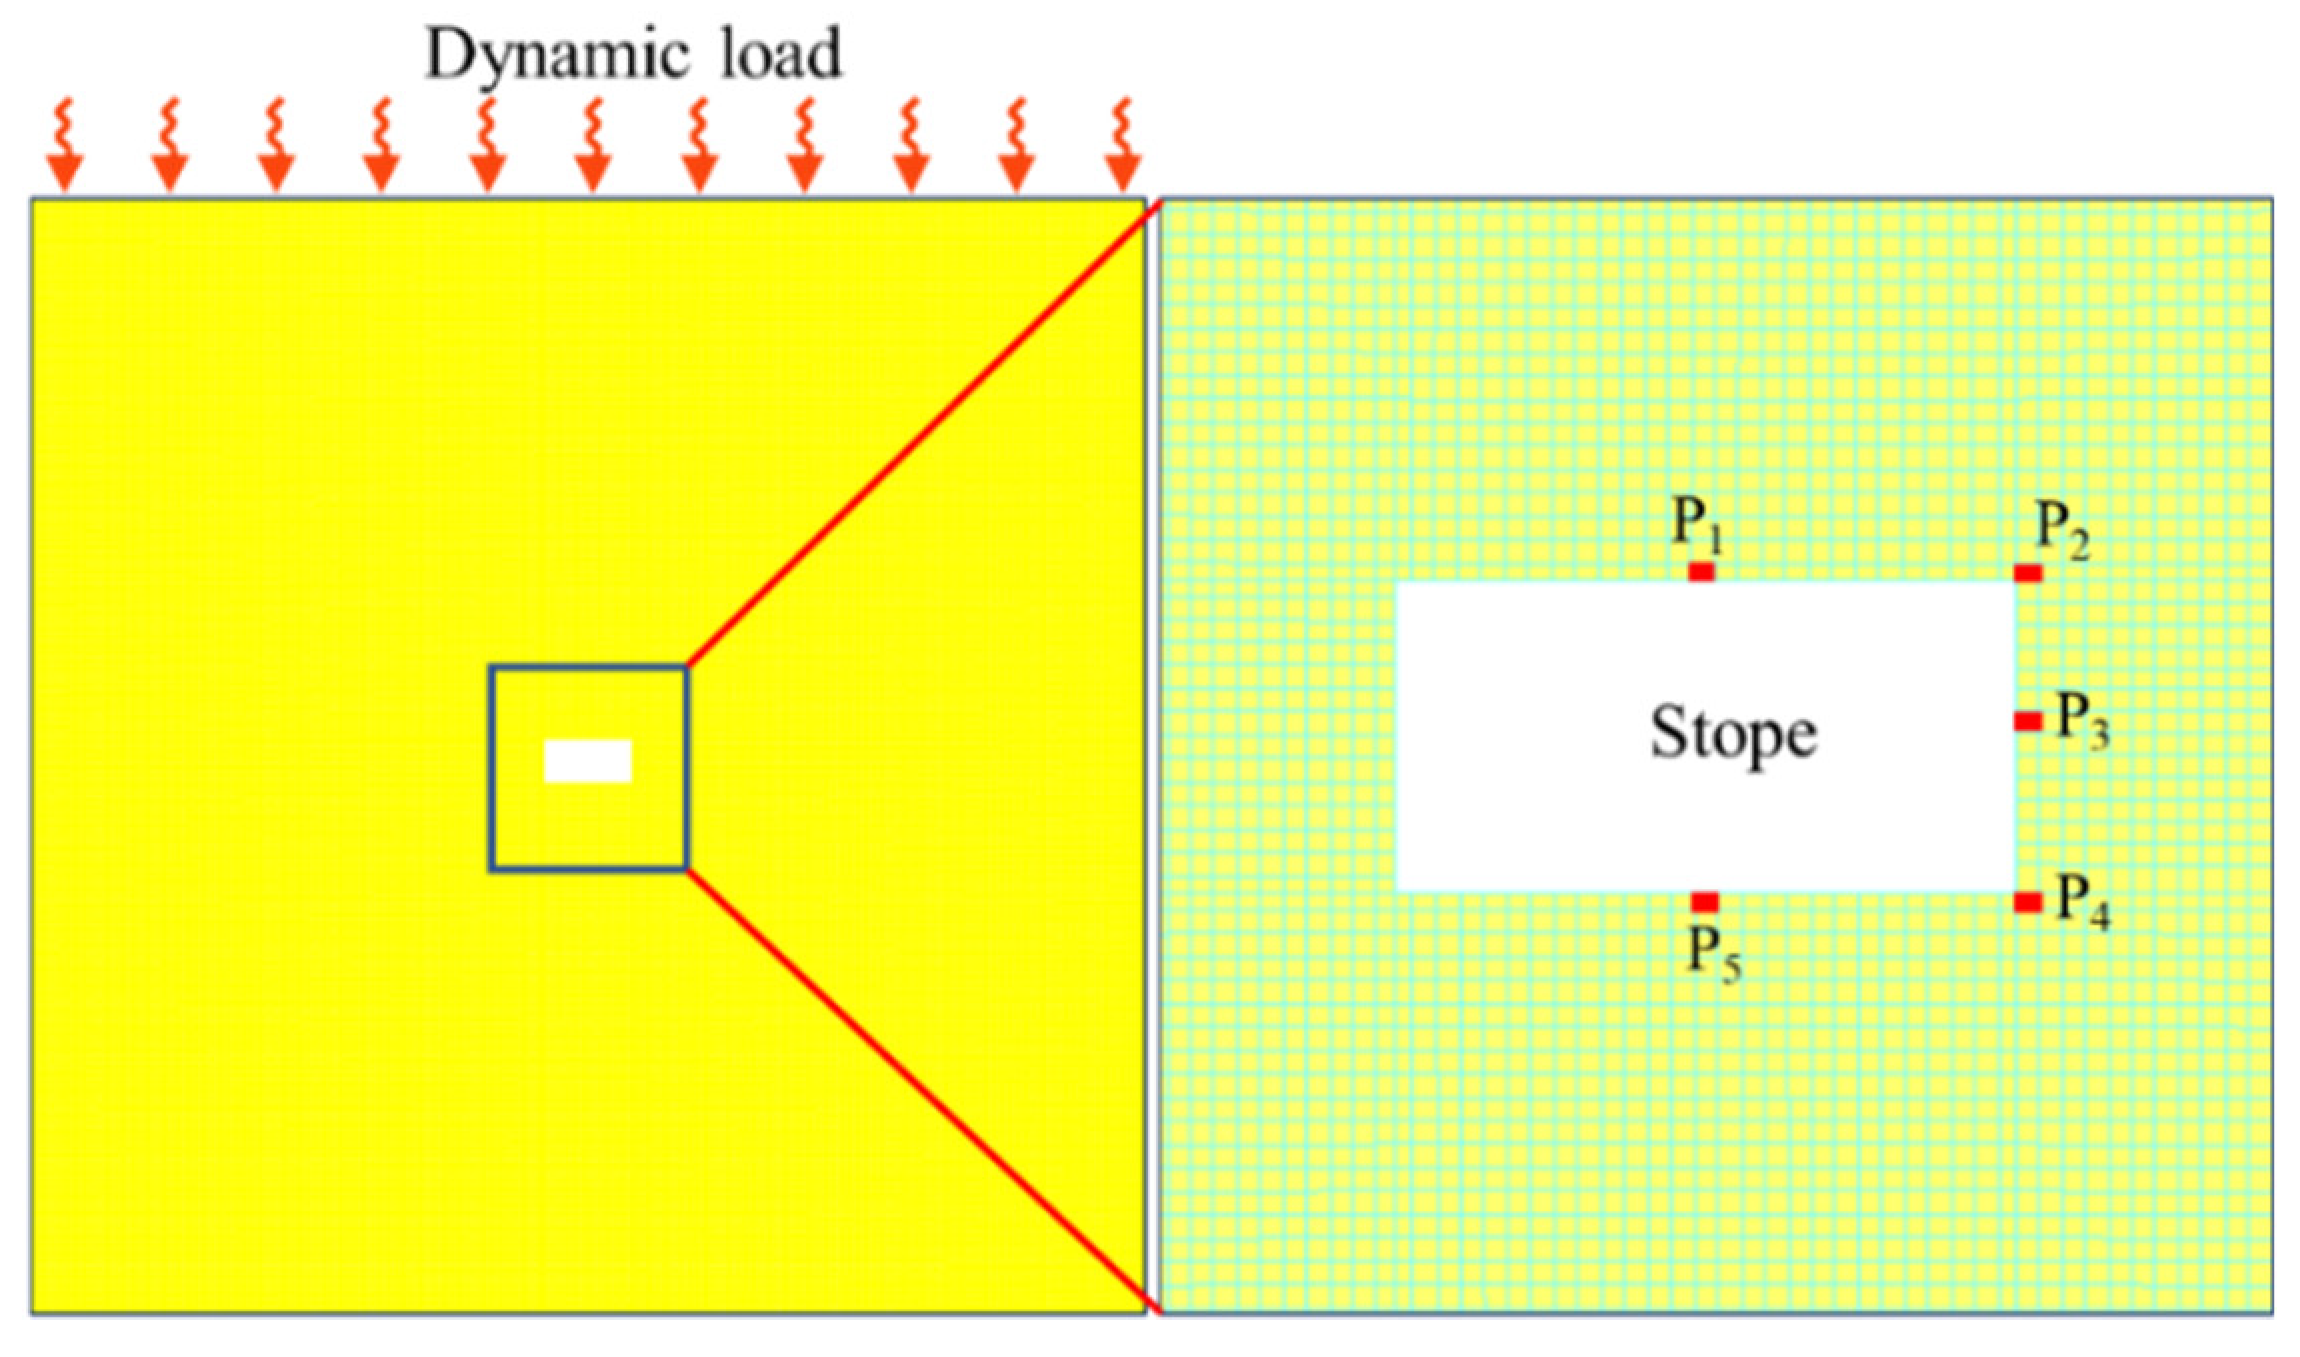
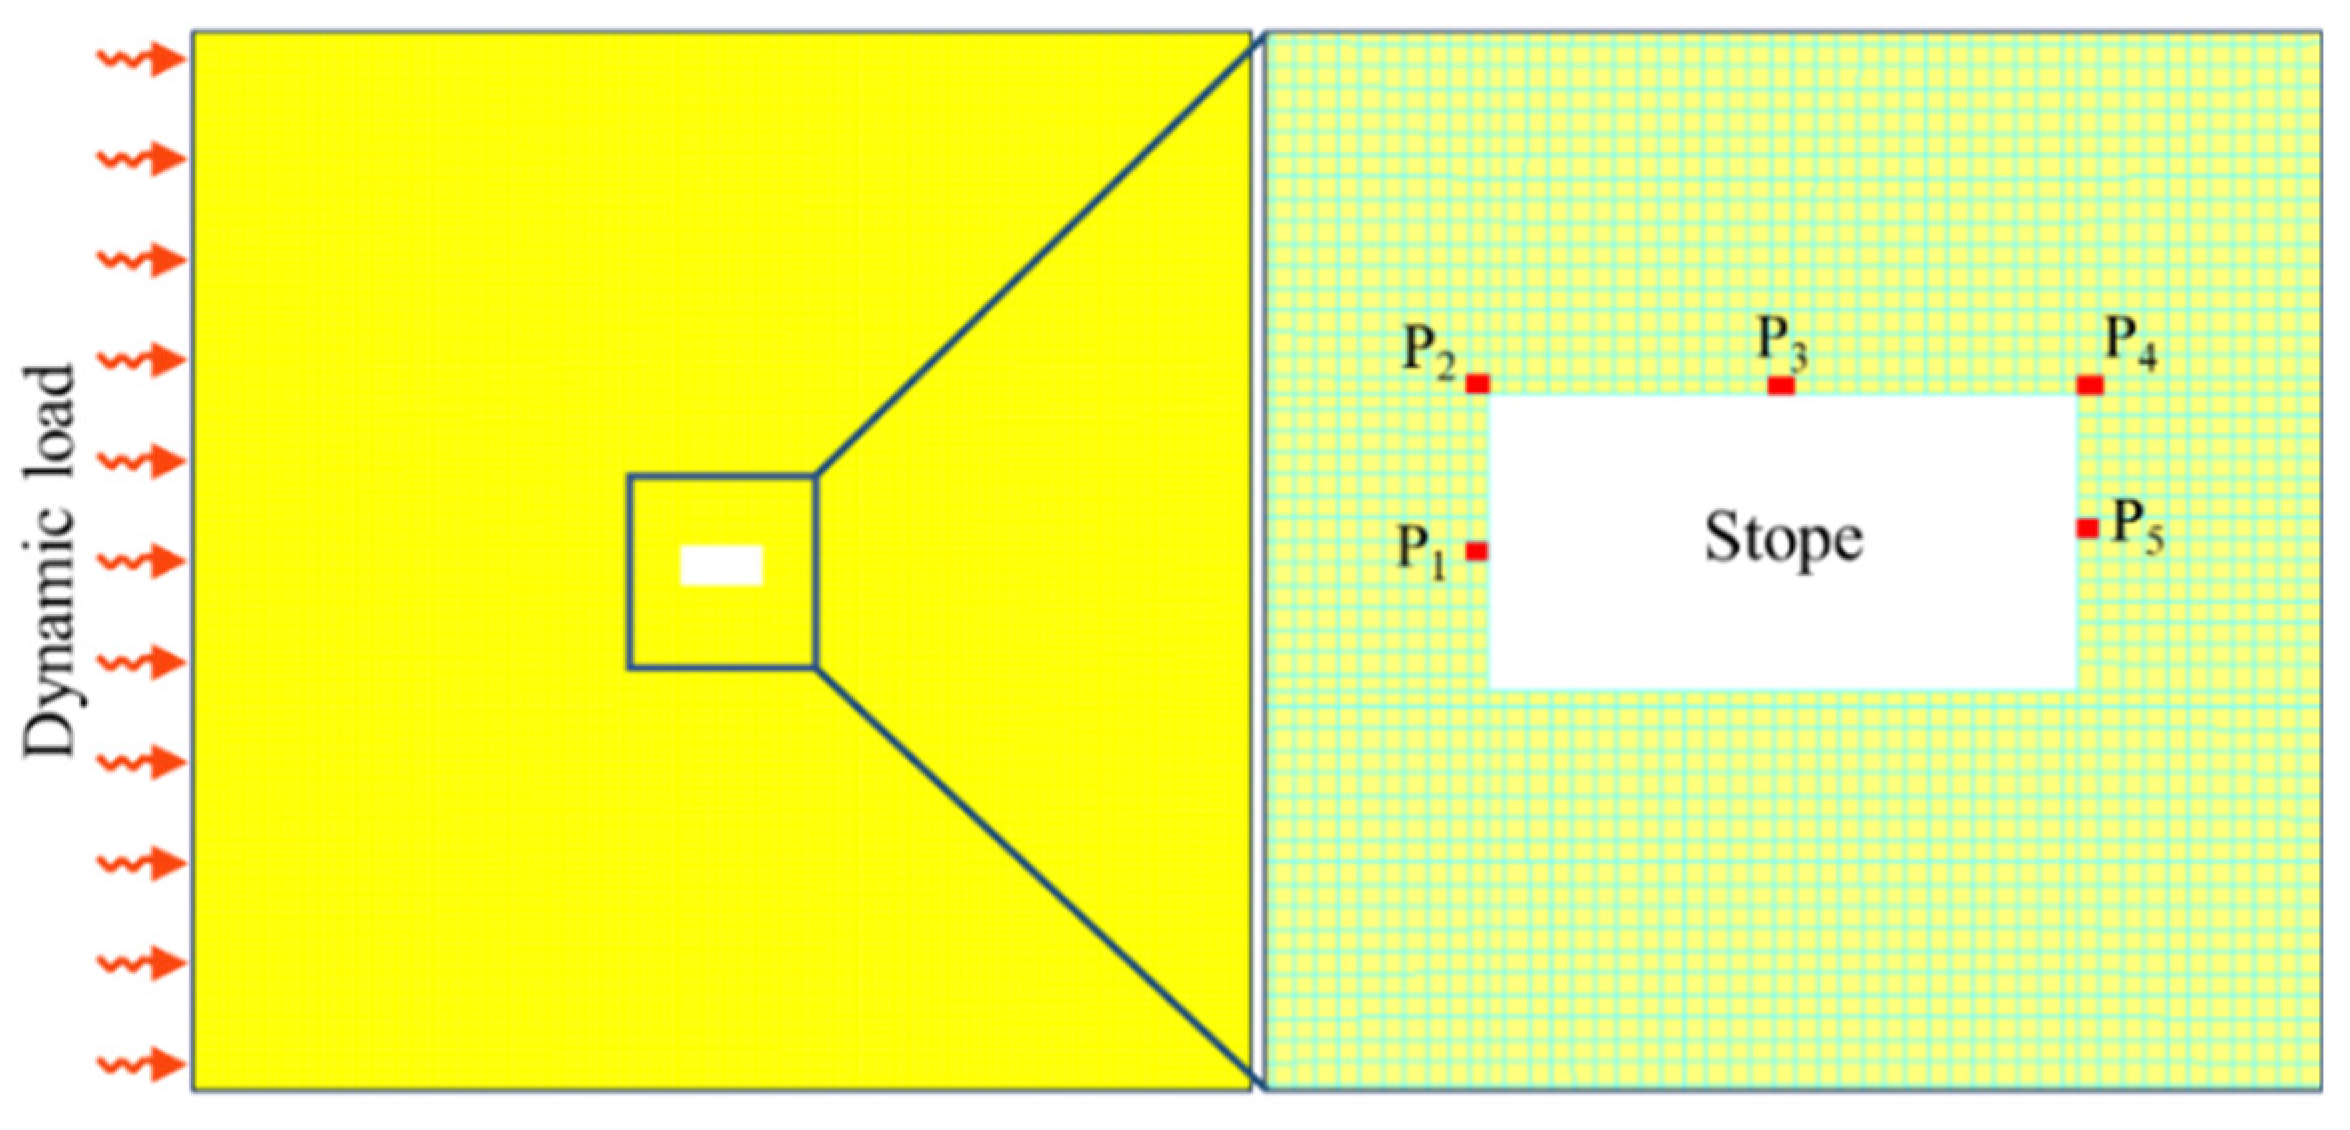
3.4. Boundary Conditions for the Dynamic Solution

Influenced by the medium’s propagation properties, the structure’s geometry, and charge amount, among other factors, underground blasting vibration showed a feature of high uncertainty. Therefore, as shown in Figure 6, the real blasting load was usually expressed with a simplified equivalent blast loading curve [37]. A triangular loading function P d ( t ) , which includes a rising stage and descending stage, has been widely used in the numerical simulation of blasting, which can be expressed as follows:
P d ( t ) = { 0                        , t < o t t r P max         , o t < t r t e t t e t r P max    , t r t < t e 0                         , t t e
where P max is the peak value of the dynamic disturbance and t e is the total duration of the triangular load. The rising stage duration varies from 0 to t r , and the peak value of the dynamic disturbance decreases from P max at t r to 0 at t e . For the triangular loading function, the rising stage indicates loading, and the descending stage indicates unloading.
The distribution of openings in the underground mine is complicated; therefore, a dynamic disturbance could come from any direction for a certain stope. Because of the different charge amounts and distances to the explosive source, the amplitude of a dynamic load varied over a wide range. Considering the symmetry of the rectangular model, a dynamic load with different amplitudes was applied in the top and left boundaries of the model, as shown in Figure 7 and Figure 8.

4. Numerical Results Analysis

4.1. Energy Evolution around a Large Deep Stope

Notably, deep unexcavated rock masses can store energy. When the dynamic load propagates in a rock mass with a free surface, the rock mass experiences repeated loading and unloading [38]. If the stress exceeds the strength of the rock mass, the deep opening undergoes instantaneous collapse or stripping. Indicators of damage (e.g., stiffness, strength, strain energy density (SED), energy release rate, etc.) are used for risk assessment in deep engineering. To identify the transition and transformation of the energy in a rock mass and use the results and conclusions of laboratory tests to guide field engineering practice, the index of strain energy density is often used to study the rules of energy evolution in deep mines because it eliminates the influence of the size effect. As an energy analysis index without volume dependence, the strain energy density perfectly fits the quasi-3D model in this study [39] and can be written as:
W = 1 2 E ( σ 1 2 + σ 2 2 + σ 3 2 2 ν ( σ 1 σ 2 + σ 1 σ 3 + σ 2 σ 3 ) )
where W is the strain energy density, E is Young’s modulus, and ν is Poisson’s ratio. σ 1 , σ 2 , and σ 3 denote the first, second, and third principal stresses, respectively.

4.1.1. SED Evolution around the Stope

Model I

The storage of energy within a rock mass was expressed via the implicit solution for geo-stress, and a stable stress state formed after the implicit solution was applicable. In the process of finding an explicit dynamic solution, the dynamic disturbance on the top boundary with a load amplitude of 20 MPa was applied. When the dynamic disturbance propagated from the top boundary, the distribution of SED in the undisturbed region reflected the initial state, which was the same as the implicit solution results, as shown in Figure 9a. Meanwhile, due to the stress concentration effect, the energy concentration was also significant at the sharp corner of the stope, where the SED was at its maximum value. Low SED was distributed on the stope’s sidewall. To track the evolution characteristics of the SED’s free surface under dynamic disturbance, the positions of the four maximum values (Pmax1, Pmax2, Pmax3, and Pmax4) and the four minimum values (Pmin1, Pmin2, Pmin3, and Pmin4) were tracked.
When the dynamic disturbance propagated to the vicinity of the stope, the region of the minimum strain energy density deviated from the sidewall and moved upward, which indicated that the rock mass elements in the area exhibited an unloading behavior and that the element energy was released during the dynamic load propagation. Furthermore, the high-SED area near the roof migrated to both ends of the floor, as Figure 9c shows. As the dynamic load continuously propagated downward, the four minimum SEDs fluctuated near the horizontal axis of the stope. The four corners of the rectangular cavity were still in a high-SED state under the influence of the stress concentration effect. The maximum SED was maintained on both sides of the floor when the dynamic load propagated from the roof to the floor. After the dynamic load passed through the floor of the cavity, the elements near the free surface underwent a self-regulation process. During that time, the four elements of minimum SED fluctuated around the horizontal axis of the stope, and the fluctuation decreased. When the dynamic disturbance ended, the elements with a minimum SED were observed at the middle of sidewalls, and the elements with a maximum SED returned to the four corners, as Figure 9f shows. To make the contour lines of strain energy density at different moments comparable, the legend intervals were equal. Compared with the initial undisturbed state, there was an obvious redistribution of SED under dynamic disturbance, and most regions showed energy release features.

Model II

Via the same research method mentioned above, the positions of the four maximum values (Pmax1, Pmax2, Pmax3, and Pmax4) and four minimum values (Pmin1, Pmin2, Pmin3, and Pmin4) for model II were also tracked, as described in this section. A dynamic load amplitude of 20 MPa was applied to the left boundary during the explicit solution. Before the dynamic stress wave reached the stope’s vicinity, the SED around the stope maintained its initial state. When the dynamic disturbance began acting on the stope’s left sidewall, the four elements of the minimum SED were distributed at the cavity’s left sidewall and then migrated to the right with the movement of the dynamic load. As the dynamic stress wave propagated from the left sidewall to the right sidewall, the four elements of the maximum SED remained at the right two corners, as shown in Figure 10c–e. When the left dynamic disturbance ended, the four elements of the minimum SED were observed at the vertical axis of the model, and the four elements with the maximum SED returned to the four corners.
The legend of the contour lines in Figure 10 is the same as that in Figure 9, and the distribution range of the SED contour line in Figure 10f is smaller than that in Figure 9f. The left dynamic load had a stronger action of energy release than the top dynamic load. The stress environment around the stope was sensitive to the left-side dynamic disturbance.

4.1.2. Time History of SED

Given the symmetry of the stope and dynamic loading boundary, five elements of each model were chosen to extract the data of the SED time history; the positions of the elements are shown in Figure 7 and Figure 8, and the time history is shown in Figure 11. To gain insight into the change in SED, the values of the initial SED minus the final SED are listed in Figure 12. As Figure 11 shows, in any case, the dynamic response of the elements always started with SED decreasing, which indicates that, during the dynamic loading of the energy storage region, the first response was to unload. For model I, P1 P2, P3, and P4 showed a decreasing trend after the dynamic disturbance ended, and the maximum decrease in SED was 52.50 KJ/m3, as Figure 12a shows. The elements of P5 on the sidewall absorbed energy from the dynamic load, and their SEDs increased by 7.09 KJ/m3. Although the elements of P2 and P4 in the model had nearly equal initial SEDs, the changes in their SEDs were markedly different after dynamic disturbances because the dynamic energy gradually weakened as the dynamic load spread through the rock mass. In model II, the SEDs of those five elements exhibited a similar fluctuation law with that of the five elements in model I; the difference was that the elements in the different models exhibited different SED changes.
The different dynamic loading directions had different influences on the same position. The first example was that P1 and P3 in model I had the same positions as P3 and P5 in model II, respectively, and all of these elements exhibited relatively low initial SED. The SED of P1 in model I decreased by 2.25 KJ/m3, and the SED of P3 in model II decreased by 9.94 KJ/m3. The SED of P3 in model I decreased by 5.20 KJ/m3, and the SED of P5 in model II increased by 6.27 KJ/m3, as shown in Figure 12. This result indicates that the dynamic load boundary played a vital role in the change in energy of elements with a low initial energy. As another example, both P2 in model I and P4 in model II were located in the top right of the stope, and they had a high initial SED. The final SED of P2 in model I and P4 in model II decreased by 49.89 KJ/m3 and 62.14 KJ/m3, respectively. This result indicates that in the high initial energy regions, under the circumstance of a dynamic disturbance amplitude of 20 MPa, the initial stress state played a more significant role in the energy evolution of elements than the role of the dynamic disturbance.
Under all circumstances, the monitored SED results exhibited these stages during the dynamic disturbance, declining from sharply fluctuating to stable. In conclusion, elements on the central axis of the stope that were perpendicular to the dynamic loading boundary absorbed energy from the dynamic disturbance, and the remaining elements showed energy release characteristics.

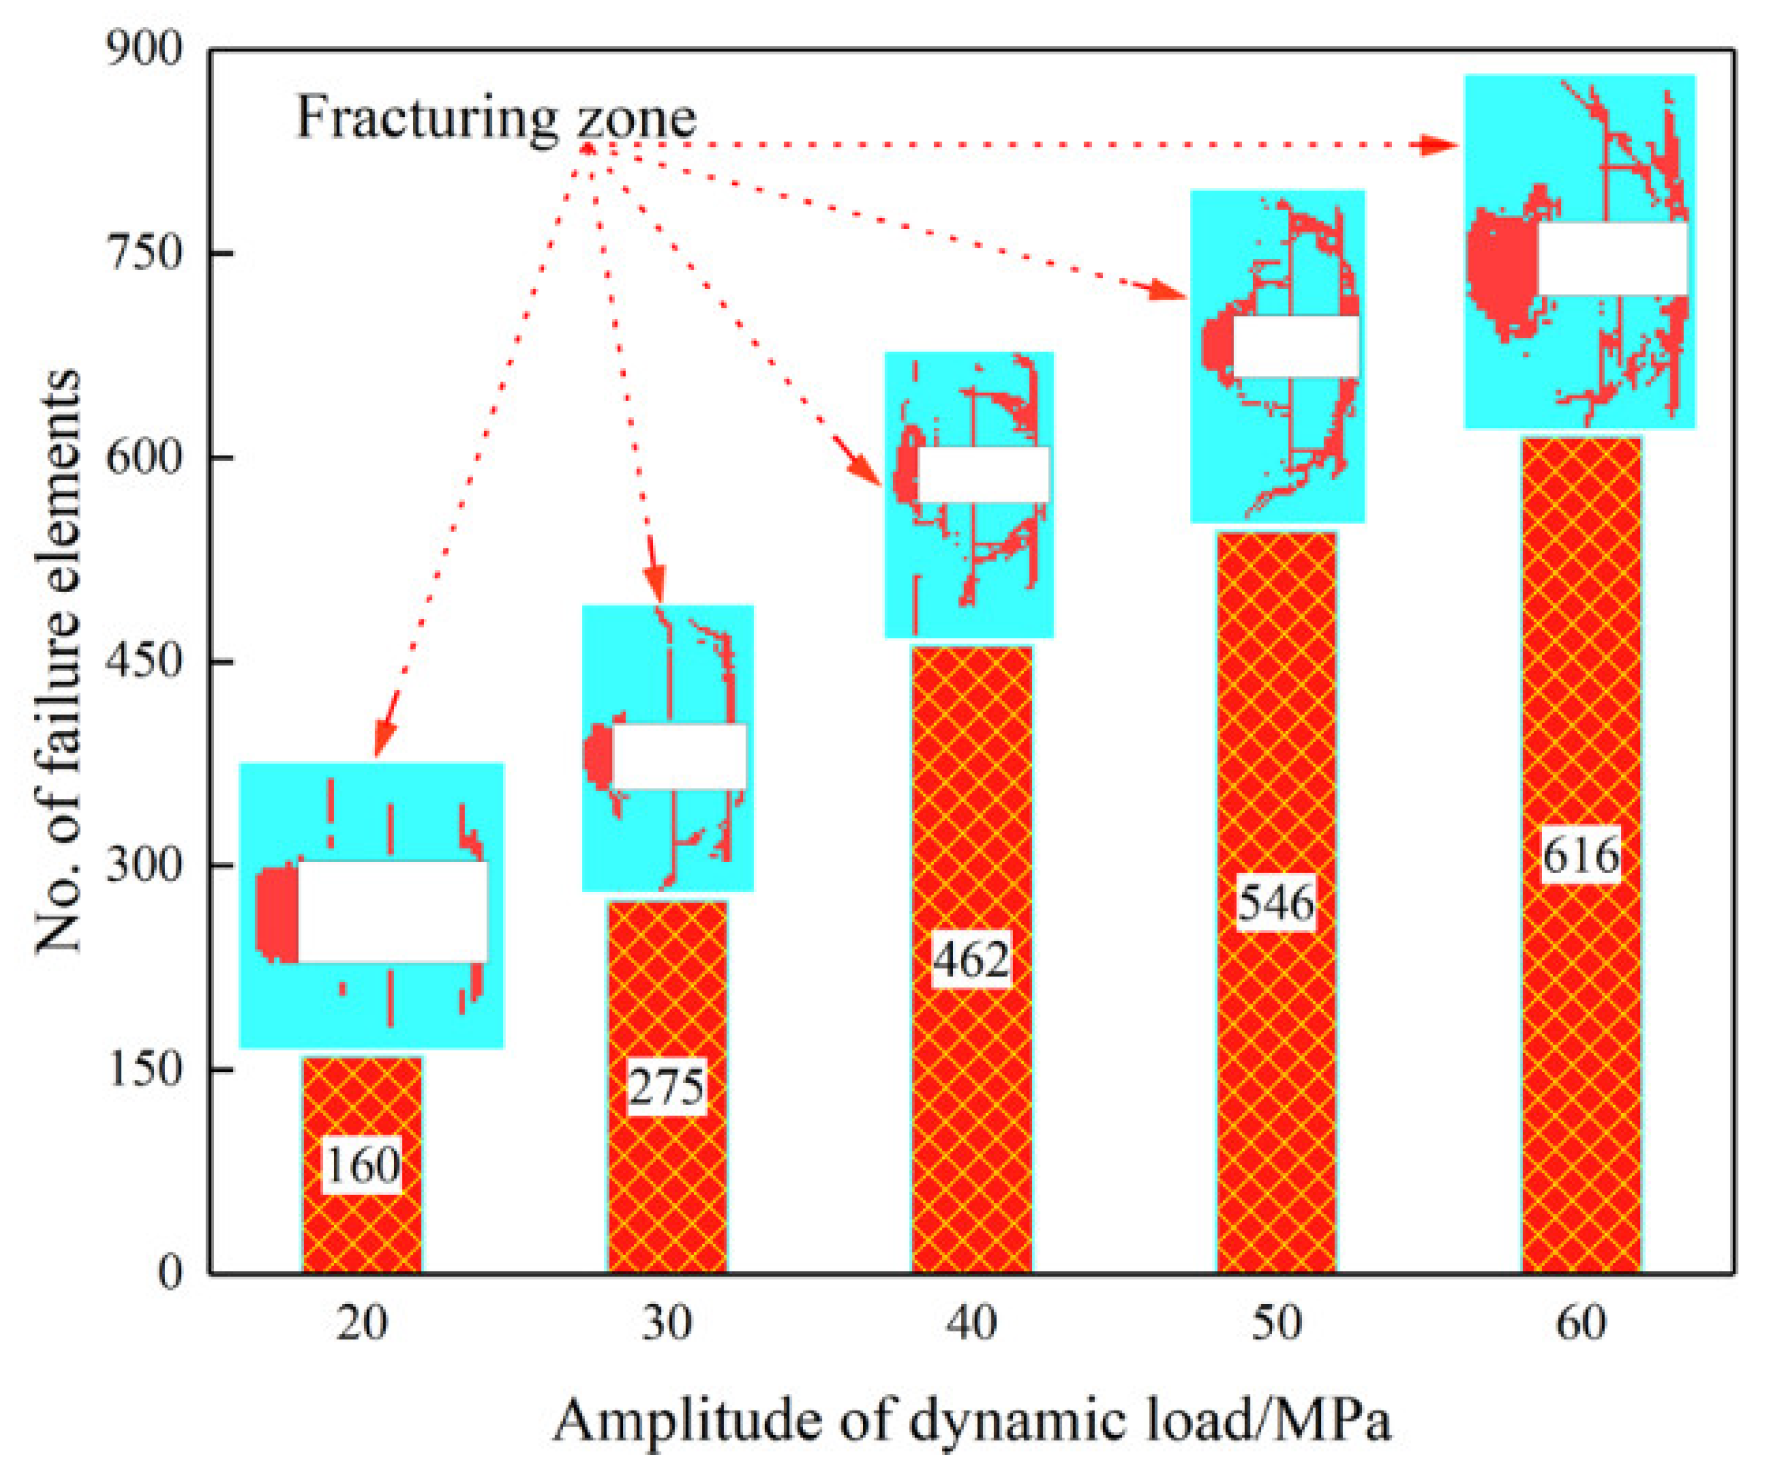
4.2. Fracturing under Different Dynamic Stress Amplitudes

When external energy was input into a deep rock mass, energy was stored in the form of elastic energy. As the rock mass deformed under loading, the energy was consumed in the form of crushed energy and friction energy. If there was stored energy remaining in the rock, dynamic disaster occurred [40]. Because the uncertainty in the dynamic disturbance is high, to investigate the fracturing of large stopes, dynamic loads of 30 MPa, 40 MPa, 50 MPa, and 60 MPa were applied on the dynamic boundary. It is known that the compressive strength of rock is much greater than its tensile strength, and dynamic tensile failure is the primary cause for spalling around underground openings; therefore, the tensile failure zone was tracked based on the CSCM model [41]. All the hexahedral elements used in the numerical model were the same size, so the number of failure elements reflected the failure characteristics of the stope to some extent. The number of failure elements was automatically extracted from the numerical output file by a computer script. To illustrate the failure zone, as shown in Figure 13 and Figure 14, the failure elements are shown in red, and the intact elements are shown in blue.
When the stress wave propagated to the free surface, it was reflected as a tensile wave and caused fracturing. Due to the geometry of the stope, the roof was a larger free surface than the cavity’s sidewall. Therefore, under a certain dynamic disturbance amplitude, the number of failure elements in the roof was always larger than the sidewall. The maximum number of failure elements induced by the upper and left dynamic disturbances were 1553 and 616, respectively.
We found that the spatial pattern of the failure elements under the low dynamic disturbance amplitude had little difference under the influence of the initial geo-stress, and the distributions of failure elements were geometrically similar. The failure zone under the top dynamic disturbance consisted of the main fracturing zone in the roof and horizontal cracks near the side walls, and the failure zone under the left dynamic disturbance consisted of the fracturing zone in the left side wall and vertical cracks near the roof and floor. The dynamic stress wave strength steadily reduced when spreading distance increased. Therefore, no failure occurred in the floor of model I and the right side wall of model II. With the increase in the top dynamic load, the failure zone in the roof became larger and interconnected with the horizontal cracks. Under the conditions of the dynamic loads from the left boundary, the failure zone was distributed on the left of the sidewall, and vertical cracks near the roof and floor. When the dynamic load exceeded 30 MPa in model II, the fracturing zone extended from the left sidewall to the roof and floor. With the continuous increase in the left dynamic load, vertical cracks near the roof and floor were gradually interconnected.
As the amplitude of the dynamic disturbance increased, the number of failure elements also increased, and the changes in the fracturing zone geometry were obvious. This finding indicates that the fracturing was governed by the dynamic load when the stope was subjected to a high dynamic load.

5. Discussion

Mining operations under high stress conditions at depth are often faced with rock bursts and other geological disasters, both of which challenge the safety and efficiency of mining. From the above research results, a large area of the fracturing zone in the Gaofeng mine was formed under strong dynamic disturbance, which will eventually cause huge losses of life and property. Furthermore, when the mining exploration went to the −250 m level, the ground pressure significantly changed due to mining activity. In engineering practice, pretreatment measures for eliminating potential hazards is required when workers and machinery enter a large opening. However, due to the complexity of the mining environment, geological disasters in deep mines exhibit high uncertainty. It is difficult to manually realize on-site workplace hazard screening. In addition, such a screening is limited to disaster-inducing factors in mining operation design. From the numerical results presented in this study, we observed that the large size introduced high risks to stabilize the deep opening under dynamic disturbance. In addition, reasonable stoping layouts also had significant effects on deep engineering stability [42,43]. The stress redistribution induced by an unreasonable mining scheme could partly contribute to stress concentration in the sharp corner of openings, and rock burst may be subjected to a very low dynamic disturbance [44,45]. In such cases, in order to keep the safety of the working environment, the maximum detonation charge must be reduced, which is not acceptable due to the low mine production capacity. Although some geotechnics have been proven to be effective to prevent rock burst, lower personnel exposure is the first line of defense for a mining operation [46].
It is known that the redistribution of geo-stress induced by mining operations may lead to the initiation, development and propagation of a microcrack [47]. All signals of elastic waves generated by rock deformation and failure can be captured by sensors and recorded with a data acquisition instrument [48]. As an effective early warning approach, microseismic monitoring techniques have become a common means to monitor the stability of engineering in deep mines [49,50]. To determine the response of the geo-stress in mining activities, a 24-channel microseismic monitoring system (Figure 15) was designed for the Gaofeng mine and is now under construction.
In total, 16 microseismic sensors were installed at the −200 m and −175 m levels, including 12 uniaxial geophone sensors and four triaxial geophone sensors. The data acquisition instruments were arranged in a special chamber at the −200 m level. An optical cable was used for data transfer, and real-time data viewing was realized in the control center at the 690 m level. The microseismic data was also sent to the remote console at Central South University via wireless communication technology. If the fiber optic system was out of order, the technician still collected data at the −200 m level. A real-time microseismic monitoring system is expected to help in disaster early warning.

6. Conclusions

In this study, a numerical model for a large deep underground opening (8 m × 4 m) was built based on the optimization of a stope structural parameter. An implicit solution of the initial static stress and an explicit solution for dynamic analysis were implemented into ANSYS/LS-DYNA software. Combining the SED, fracturing zone extent, and number of failure elements, the numerical investigation of fracturing and energy evolution of a large, deep underground opening subjected to dynamic stress was presented. The main conclusions are as follows:
(1) Considering energy distribution, the main dynamic response of the stored energy in a rock mass under dynamic disturbance is energy release. When the dynamic disturbance finished, the distribution range of the SED decreased obviously. When the direction of dynamic loading corresponded to the maximum principal stress, the effect of energy release was even more significant.
(2) In every case, the dynamic response of the monitored elements always began by decreasing SED, which indicated that when the dynamic loading affected the energy storage region, the first response was to unload. The elements far from the loading boundary absorbed dynamic energy, which led to their SEDs increased.
(3) For large-sized deep rock engineering, the main failure zone is governed by the size of free surface. In a certain initial stress environment, the geo-stress plays a significant role in the fracturing behavior of rock mass. When the amplitude of the dynamic disturbance is relatively low, the initial geo-stress dominates the fracturing of the rock mass. When the peak value of the dynamic load is high, the number of rock mass failure elements increases, and the failure mode is governed by the dynamic disturbance.
(4) In engineering practice, pretreatment measures for eliminating potential hazards are required when workers and machinery enter a large underground opening. To realize long-term effective ground pressure control in the Gaofeng mine, an early warning of surrounding rock mass deformation and failure should be provided in a timely manner.

Author Contributions

Conceptualization, C.Y. and K.Z.; methodology, C.Y.; software, C.Y.; writing—original draft, C.Y.; supervision, K.Z.; funding acquisition, K.Z.; data curation, Z.L. (Zhichao Li), X.X., Y.L. and Z.L. (Zengwu Luo); investigation, Z.L. (Zhichao Li), X.X., Y.L. and Z.L. (Zengwu Luo); validation, Z.L. (Zhichao Li). All authors have read and agreed to the published version of the manuscript.

Funding

This research was funded by the National Natural Science Foundation of China, grant number 51774323 and Fundamental Research Funds for the Central Universities of Central South University, China, grant number 2018zzts216. The first author gives his gratitude to the financial support of China Scholarship Council.

Acknowledgments

The reviewers are acknowledged for their helpful comments and suggestions that greatly improved the manuscript.

Conflicts of Interest

The authors declare no conflict of interest.

References

  1. Zhai, X.; Huang, G.; Chen, C.; Li, R. Combined supporting technology with bolt-grouting and floor pressure-relief for deep chamber: An underground coal mine case study. Energies 2018, 11, 67. [Google Scholar] [CrossRef] [Green Version]
  2. Wagner, H. Deep mining: A rock engineering challenge. Rock Mech. Rock Eng. 2019, 52, 1417–1446. [Google Scholar] [CrossRef] [Green Version]
  3. Ranjith, P.G.; Zhao, J.; Ju, M.; De Silva, R.V.S.; Rathnaweera, T.D.; Bandara, A.K.M.S. Opportunities and Challenges in Deep Mining: A Brief Review. Engineering 2017, 3, 546–551. [Google Scholar] [CrossRef]
  4. Hu, J.; Yang, C.; Zhou, K.; Li, J.; Gao, F. Stability of undercut space in fragment orebody based on key block theory. Trans. Nonferrous Met. Soc. China 2016, 26, 1946–1954. [Google Scholar] [CrossRef]
  5. Fan, D.; Liu, X.; Tan, Y.; Song, S.; Gu, Q.; Yan, L.; Xu, Q. Roof cutting parameters design for gob-side entry in deep coal mine: A case study. Energies 2019, 12, 2032. [Google Scholar] [CrossRef] [Green Version]
  6. Yang, J.; Yao, C.; Jiang, Q.; Lu, W.; Jiang, S. 2D numerical analysis of rock damage induced by dynamic in-situ stress redistribution and blast loading in underground blasting excavation. Tunn. Undergr. Space Technol. 2017, 70, 221–232. [Google Scholar] [CrossRef]
  7. Wang, X.; Li, S.; Xu, Z.; Xue, Y.; Hu, J.; Li, Z. An interval fuzzy comprehensive assessment method for rock burst in underground caverns and its engineering application. Bull. Eng. Geol. Environ. 2019, 78, 5161–5176. [Google Scholar] [CrossRef]
  8. Yang, Y.; Wei, S.; Zhao, S. Research on the destructional pattern of surrounding rock of roadway induced by dynamic disturbance. Geotech. Geol. Eng. 2019, 37, 4447–4459. [Google Scholar] [CrossRef]
  9. Hamdi, E.; Bouden Romdhane, N.; du Mouza, J.; Le Cleac’h, J.M. Fragmentation energy in rock blasting. Geotech. Geol. Eng. 2008, 26, 133–146. [Google Scholar] [CrossRef]
  10. Yang, L.; Huang, C.; Bao, S.; Zhang, L. Model experimental study on controlled blasting of slit charge in deep rock mass. Soil Dyn. Earthq. Eng. 2020, 138, 106318. [Google Scholar] [CrossRef]
  11. Li, X.; Gong, F.; Tao, M.; Dong, L.; Du, K.; Ma, C. Failure mechanism and coupled static-dynamic loading theory in deep hard rock mining: A review. J. Rock Mech. Geotech. Eng. 2017, 9, 767–782. [Google Scholar] [CrossRef]
  12. Kouame, K.J.A.; Jiang, F.; Zhu, S. Research on cause of dynamic disaster of deep mining control in china and its further prevention application in ivory coast. Geotech. Geol. Eng. 2017, 35, 1141–1149. [Google Scholar] [CrossRef]
  13. Li, C.; Li, X.; Liang, L. Dynamic response of existing tunnel under cylindrical unloading wave. Int. J. Rock Mech. Min. Sci. 2020, 131, 104342. [Google Scholar] [CrossRef]
  14. Karampinos, E.; Hadjigeorgiou, J.; Hazzard, J.; Turcotte, P. Discrete element modelling of the buckling phenomenon in deep hard rock mines. Int. J. Rock. Mech. Min. Sci. 2015, 80, 346–356. [Google Scholar] [CrossRef]
  15. Su, G.; Feng, X.; Wang, J.; Jiang, J.; Hu, L. Experimental study of remotely triggered rockburst induced by a tunnel axial dynamic disturbance under true-triaxial conditions. Rock Mech. Rock Eng. 2017, 50, 2207–2226. [Google Scholar] [CrossRef]
  16. Li, X.; Li, C.; Cao, W.; Tao, M. Dynamic stress concentration and energy evolution of deep-buried tunnels under blasting loads. Int. J. Rock Mech. Min. Sci. 2018, 104, 131–146. [Google Scholar] [CrossRef]
  17. Zhu, Y.; Peng, G. Similar material simulation research on movement law of roof over-lying strata in stope of fully mechanized caving face with large mining height. J. Coal Sci. Eng. 2010, 16, 6–10. [Google Scholar] [CrossRef]
  18. Zhang, X.; Wen, Z.; Liu, J.; Luo, L.; Sun, B. Research on distribution and evolution laws of surrounding rock stress during the island panel mining in multiple complex stope. Geotech. Geol. Eng. 2019, 37, 3355–3366. [Google Scholar] [CrossRef]
  19. Li, C.; Li, X. Influence of wavelength-to-tunnel-diameter ratio on dynamic response of underground tunnels.subjected to blasting loads. Int. J. Rock Mech. Min. Sci. 2018, 112, 323–338. [Google Scholar] [CrossRef]
  20. Wang, Z.; Dou, L.; Wang, G. Mechanism analysis of roadway rockbursts induced by dynamic mining loading and its application. Energies 2018, 11, 2313. [Google Scholar] [CrossRef] [Green Version]
  21. Kong, P.; Jiang, L.; Jiang, J.; Wu, Y.; Chen, L.; Ning, J. Numerical analysis of roadway rock-burst hazard under superposed dynamic and static loads. Energies 2019, 12, 3761. [Google Scholar] [CrossRef] [Green Version]
  22. Li, D.; Gao, F.; Han, Z.; Zhu, Q. Experimental evaluation on rock failure mechanism with combined flaws in a connected geometry under coupled static-dynamic loads. Soil Dyn. Earthq. Eng. 2020, 132, 106088. [Google Scholar] [CrossRef]
  23. Cui, F.; Zhang, T.; Lai, X.; Cao, J.; Shan, F. Study on the evolution law of overburden breaking angle under repeated mining and the application of roof pressure relief. Energies 2019, 12, 4513. [Google Scholar] [CrossRef] [Green Version]
  24. Ramamurthy, T. Realistic parameters adoption to solve rock engineering problems. Indian Geotech. J. 2018, 48, 595–614. [Google Scholar] [CrossRef]
  25. Feng, F.; Chen, S.; Li, D.; Hu, S.; Huang, W.; Li, B. Analysis of fractures of a hard rock specimen via unloading of central hole with different sectional shapes. Energy Sci. Eng. 2019, 7, 2265–2286. [Google Scholar] [CrossRef] [Green Version]
  26. Liu, C.; Deng, J.; Yu, S.; Lin, Y. Effect of freezing and thawing on microstructure damage and dynamic flexural tension of granite. Rock Mech. Rock Eng. 2002, 53, 3853–3858. [Google Scholar] [CrossRef]
  27. Smoljanović, H.; Živaljić, N.; Nikolić, Ž. A combined finite-discrete element analysis of dry stone masonry structures. Eng. Struct. 2013, 52, 89–100. [Google Scholar] [CrossRef]
  28. Yang, C.; Hu, J.; Ma, S. Numerical investigation of rock breaking mechanism with supercritical carbon dioxide jet by SPH-FEM approach. IEEE Access 2019, 7, 55485–55495. [Google Scholar] [CrossRef]
  29. Wu, C.; Hao, H.; Lu, Y. Dynamic response and damage analysis of masonry structures and masonry infilled RC frames to blast ground motion. Eng. Struct. 2005, 27, 323–333. [Google Scholar] [CrossRef]
  30. Luo, X.; Wei, J.; Gao, F.; Xiong, X. Optimization of stope width for steeply inclined thick ore-body in deep mine. Metal Mine 2018, 6, 7–10. [Google Scholar]
  31. Ahmed, L.; Ansell, A. Structural dynamic and stress wave models for the analysis of shotcrete on rock exposed to blasting. Eng. Struct. 2012, 35, 11–17. [Google Scholar] [CrossRef]
  32. Wei, X.; Zhao, Z.; Gu, J. Numerical simulations of rock mass damage induced by underground explosion. Int. J. Rock Mech. Min. Sci. 2009, 46, 1206–1213. [Google Scholar] [CrossRef]
  33. Murray, Y.D. Users Manual for LS-DYNA Concrete Material Model 159. Available online: https://rosap.ntl.bts.gov/view/dot/38730 (accessed on 15 October 2020).
  34. Tu, Z.; Yong, L. Evaluation of typical concrete material models used in hydrocodes for high dynamic response simulations. Int. J. Impact Eng. 2009, 36, 132–146. [Google Scholar] [CrossRef]
  35. Li, X.; Weng, L. Numerical investigation on fracturing behaviors of deep-buried opening under dynamic disturbance. Tunn. Undergr. Space Technol. 2016, 54, 61–72. [Google Scholar] [CrossRef]
  36. Tao, M.; Li, X.; Wu, C. Characteristics of the unloading process of rocks under high initial stress. Comput. Geotech. 2012, 45, 83–92. [Google Scholar] [CrossRef]
  37. Low, H.Y.; Hao, H. Reliability analysis of reinforced concrete slabs under explosive loading. Struct Saf. 2001, 23, 157–178. [Google Scholar] [CrossRef]
  38. Gao, F.; Zhou, K.; Luo, X.; Zhai, J. Effect of induction unloading on weakening of rock mechanics properties. Trans. Nonferrous. Met. Soc. China 2012, 22, 419–424. [Google Scholar] [CrossRef]
  39. Wang, X.; Ma, J.; Liu, L. Numerical simulation of failed zone propagation process and anomalies related to the released energy during a compressive jog intersection. J. Mech. Mater. Struct. 2010, 5, 1007–1022. [Google Scholar] [CrossRef] [Green Version]
  40. Gu, S.; Zhang, W.; Jiang, B.; Hu, C. Case of rock burst danger and its prediction and prevention in tunneling and mining period at an irregular coal face. Geotech. Geol. Eng. 2019, 37, 2545–2564. [Google Scholar] [CrossRef]
  41. Shang, J.; Hencher, S.R.; West, L.J. Tensile strength of geological discontinuities including incipient bedding, rock joints and mineral veins. Rock Mech. Rock Eng. 2016, 49, 4213–4225. [Google Scholar] [CrossRef] [Green Version]
  42. Yang, C.; Zhou, K.; Gao, R.; Xiong, X. Numerical investigation of the dynamic response of a preconditioned roof in an underground mine: A case study of mining environment regeneration. Soil Dyn. Earthq. Eng. 2020, 140, 106457. [Google Scholar] [CrossRef]
  43. Zhou, K.; Li, Z.; Gao, R. Study of the mechanical law and disturbance-response characteristics during deep-filling mining. Mater. Technol. 2019, 53, 583–593. [Google Scholar] [CrossRef]
  44. Qiu, J.; Li, X.; Li, D.; Zhao, Y.; Hu, C.; Liang, L. Physical model test on the deformation behavior of an underground tunnel under blasting disturbance. Rock Mech. Rock Eng. 2020, 1–18. [Google Scholar] [CrossRef]
  45. Qiu, J.; Li, D.; Li, X.; Zhu, Q. Numerical investigation on the stress evolution and failure behavior for deep roadway under blasting disturbance. Soil Dyn. Earthq. Eng. 2020, 137, 106278. [Google Scholar] [CrossRef]
  46. Konicek, P.; Soucek, K.; Stas, L.; Singh, R. Long-hole destress blasting for rockburst control during deep underground coal mining. Int. J. Rock Mech. Min. Sci. 2013, 61, 141–153. [Google Scholar] [CrossRef]
  47. Tang, Z.; Liu, X.; Xu, Q.; Li, C.; Qin, P. Stability evaluation of deep-buried TBM construction tunnel based on microseismic monitoring technology. Tunn. Undergr. Space Technol. 2018, 81, 512–524. [Google Scholar] [CrossRef]
  48. Asim, K.M.; Idris, A.; Iqbal, T.; Martínez-Álvarez, F. Seismic indicators based earthquake predictor system using Genetic Programming and AdaBoost classification. Soil Dyn. Earthq. Eng. 2018, 111, 1–7. [Google Scholar] [CrossRef]
  49. Sun, J.; Wang, L.; Hou, H. Application of micro-seismic monitoring technology in mining engineering. Int. J. Min. Sci. Technol. 2012, 22, 79–83. [Google Scholar] [CrossRef]
  50. Zhao, Y.; Yang, T.; Zhang, P.; Zhou, J.; Yu, Q.; Deng, W. The analysis of rock damage process based on the microseismic monitoring and numerical simulations. Tunn. Undergr. Space Technol. 2017, 69, 1–17. [Google Scholar] [CrossRef]
Figure 1. The location of the Gaofeng mine.
Energies 13 06102 g001
Figure 2. Caving induced by blasting.
Energies 13 06102 g002
Figure 3. Boundary conditions for the implicit solution.
Energies 13 06102 g003
Figure 4. Validation of numerical results.
Energies 13 06102 g004
Figure 5. Implicit solution of geo-stress. Note: units are in Pa.
Energies 13 06102 g005
Figure 6. Triangular load.
Energies 13 06102 g006
Figure 7. Explicit solution model I (top dynamic loading).
Energies 13 06102 g007
Figure 8. Explicit solution model II (top dynamic loading).
Energies 13 06102 g008
Figure 9. Contour lines of strain energy density (SED) (model I). Note: units are in J/m3. (a) T = 5.0 ms; (b) a local enlarged view; (c) T = 17.3 ms; (d) T = 17.8 ms; (e) T = 23.0 ms; (f) T = 35.0 ms.
Energies 13 06102 g009
Figure 10. Contour lines of SED (model II). Note: units are in J/m3. ((a) T = 5.0 ms; (b) a local enlarged view; (c) T = 16.7 ms; (d) T = 17.3 ms; (e) T = 18.9 ms; (f) T = 35.0 ms)
Energies 13 06102 g010
Figure 11. Time history of SED (a: model I; b: model II).
Energies 13 06102 g011
Figure 12. Changes in SED (a: model I; b: model II).
Energies 13 06102 g012
Figure 13. Failure characteristics and number of failure elements (model I).
Energies 13 06102 g013
Figure 14. Failure characteristics and number of failure elements (model II).
Energies 13 06102 g014
Figure 15. Schematic diagram of the real-time microseismic monitoring system in the Gaofeng mine.
Energies 13 06102 g015
Table 1. Numerical parameters for the ore.
Density
(kg/m3)
Bulk Modulus
(GPa)
Shear Modulus
(GPa)
Uniaxial Compressive Strength
(MPa)
Uniaxial Tensile Strength
(MPa)
-
4200.0017.8012.30117.844.20-
TXC surface α
(MPa)
β
(MPa−1)
λ
(MPa)
θ -
10.741.93 × 10−210.500.56-
TOR surface α 1 β 1
(MPa−1)
λ 1 θ 1
(MPa−1)
-
0.75−1.79 × 10−10.17−5.12 × 10⁻²-
TXE surface α 2 β 2
(MPa−1)
λ 2 θ 2
(MPa−1)
-
0.66−0.180.16−5.36 × 10⁻³-
Cap and hardening parametersCap aspect ratioCap initial location
(MPa)
Maximum plastic volume compactionLinear shape parameter (MPa)Quadratic shape parameter (MPa2)
5.00202.300.050.25 × 10−30.35 × 10⁻⁶
Fracture energyFracture energy in uniaxial stress
(Pa·m)
Fracture energy in uniaxial tension
(Pa·m)
Fracture energy in pure shear stress
(Pa·m)
--
6000.0060.0060.00--
Strain rate parametersRate effects parameter for uniaxial compressive stressRate effects power for uniaxial compressive stressRate effects parameter for uniaxial tensile stressRate effects power for uniaxial tensile stress-
3.08 × 10−40.495.07 × 10−50.78-
Publisher’s Note: MDPI stays neutral with regard to jurisdictional claims in published maps and institutional affiliations.

